Presentation to the Financial Community - Saipem · Presentation to the Financial Community ... Gas...
22
Presentation to the Financial Community Presentation to the Financial Community July 2012 July 2012 First Half 2012 Results First Half 2012 Results
Transcript of Presentation to the Financial Community - Saipem · Presentation to the Financial Community ... Gas...

Presentation to the Financial CommunityPresentation to the Financial Community
July 2012July 2012
First Half 2012 ResultsFirst Half 2012 Results

2
Forward-Looking Statements
By their nature, forward-looking statements are subject to risk and uncertainty since they aredependent on upon circumstances which should or are considered likely to occur in the futureand are outside of the Company’s control. These include, but are not limited to: monetaryexchange and interest rate fluctuations, commodity price volatility, credit and liquidity risks,HSE risks, the levels of capital expenditure in the oil and gas industry and other sectors,political instability in areas where the Group operates, actions by competitors, success ofcommercial transactions, risks associated with the execution of projects (including ongoinginvestment projects), in addition to changes in stakeholders’ expectations and other changesaffecting business conditions.
Actual results could therefore differ materially from the forward-looking statements.
The Financial Reports contain in-depth analyses of some of the aforementioned risks.
Forward-looking statements are to be considered in the context of the date of their release.Saipem S.p.A. does not undertake to review, revise or correct forward-looking statementsonce they have been released, barring cases required by Law.
Forward-looking statements neither represent nor can be considered as estimates for legal,accounting, fiscal or investment purposes. Forward-looking statements are not intended toprovide assurances and/or solicit investment.

3
Presentation Outline
1H 2012 Financial Results and Backlog Breakdown
Oil & Gas Industry Market Outlook
E&C Offshore Backlog recent evolution
Analysis of a stable Backlog: Underlying Theme – Robust Resilience
Drilling - Resilience and New Opportunities
2012 Guidance – mid-year update
E&C Onshore Backlog recent evolution
Drilling Offshore – long term contracting policy
Drilling Onshore
Local Content and Frontier Focus Resilience – Nigeria and Saudi examples

4
1H 2012 Financial Results and Backlog Breakdown1H 2012 Financial Results and Backlog Breakdown
1H 2012 Results
5
1H 2012 Financial Results
High single digit results growth compared to 1H 2011
OnshoreDrillingOffshore OffshoreOnshore
Revenues EBITDA EBIT Net Profit
1H 20121H 2011 1H 20121H 20111H 20121H 2011 1H 20121H 2011
473438
25182518
30153015
63976397
509509
% on Revenues
10131013 % on Revenues
23742374
28852885
60216021
418418344344
355355
436436
222222
248248
107107
(18.4%)
(53.1%)
(31.1%)
(8.6%)
322322
115115
231231
711711
4343
(13.6%)
(27.5%)
(8.0%)
(12.5%)
% on Revenues% on
Revenues
(16.8%)
(11.8%)
(Mln €)
459459
262262
11071107
272272
114114
(18.2%)
(53.4%)
(32.1%)
(8.7%)
(17.3%)
328328
246246
762762
139139
4949
(13.0%)
(27.3%)
(13.8%)
(8.2%)
(11.9%)

6
Sources and Application of Funds,Net Debt & Leverage
Dividends
Capex
Cash Flow (Net Profit +Depreciation)
Working Capital
1H 2012 Financial Results
(Mln €)
31923192
39353935
Net Debt @June, 30 ’12
Sources of Funds
Q1’12
Application of Funds
Q1’12
Net Debt @Dec., 31 ’11
Leverage = 0.66Leverage = 0.66
740740
316316
307307
232232
8585
Application of Funds
Q2’12
Capex
OnshoreOffshore
Drilling OffshoreOnshore
20111H 2011 1H 2012 2012E
561
226226
297297
11991199
19196464
265265
200200
~1000~1000
54854810102828
5959122122
509509
509509
Sources of Funds
Q2’12
937937
412412
Others
421421
Leverage = 0.79Leverage = 0.79
6161
16801680
43

7
1H 2012 Contract Acquisitions & Backlog
Contract Acquisitions Backlog
OnshoreDrillingOffshore OffshoreOnshore
63036303
42294229
14161416
253253405405
83118311
31973197
80058005
2032320323
810810
June, 30 ‘12Dec., 31 ‘11
60066006
32623262
349349318318
66006600
33013301
96049604
912912
(Mln €)
2041720417
20772077
1H 20121H 2011

8
43%
14%
15%
28%
2012201320142015+
62%
13% 4%4%
5%6%
2%
4%
Saudi Arabia BrazilNigeria Angola Algeria CanadaKazakhstan Others
Backlog Breakdown
Saipem Backlog € 20.32 Bln @ June 30, 2012
by Geo Area
by Client by Year of Execution
by Country – Local Content Focus
~40%of present backlogin Countries where
Saipem has a strong Local Content Commitment
47%36%
7% 10%
Major & Supermajor National
Independent Others
29%
6%11% 7%
18%17%
12%
Middle East AmericaEurope Asia PacificWest & South Africa North AfricaCIS
OnshoreOnshoreOffshoreOffshoreDrillingOff.Off. On.On.
21002100 27972797543543247
2012 Backlog split by Business Unit

9
Oil & Gas Industry Market Outlook Oil & Gas Industry Market Outlook
1H 2012 Results
0
350
700
2007 2008 2009 2010 2011 2012E
10
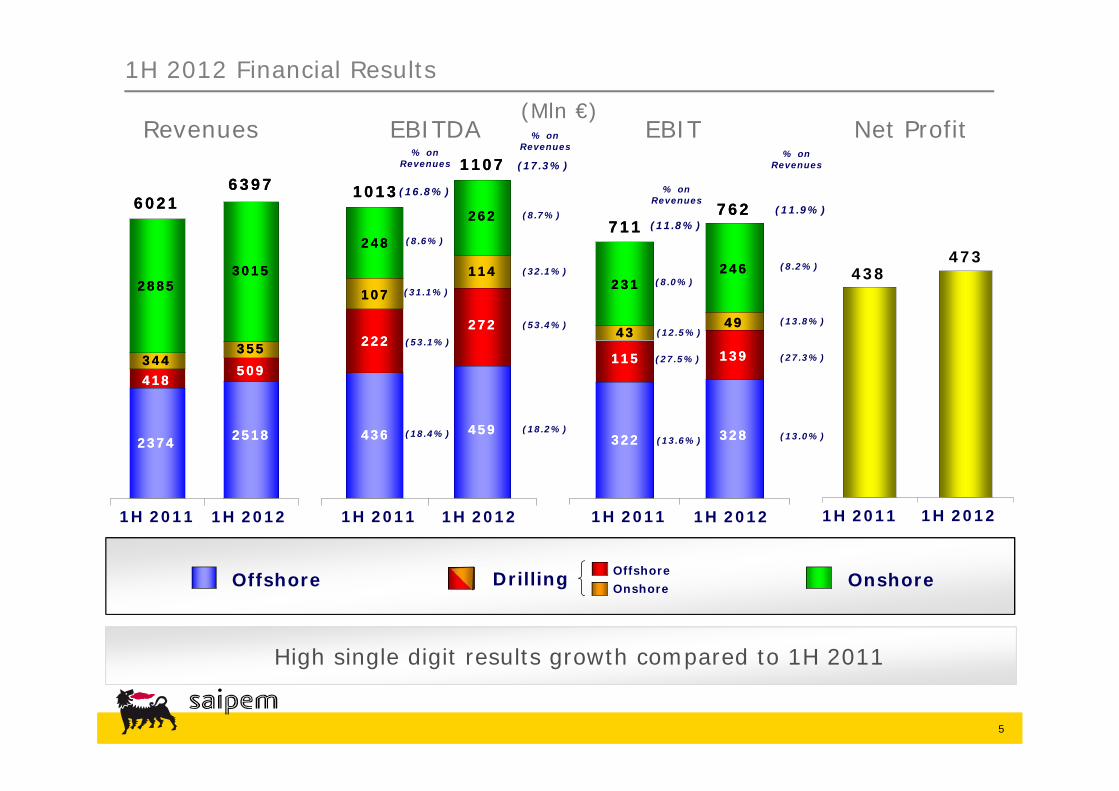
Despite global economic uncertainties, Oil & Gas Services outlook confirmed Positive in the Short and Medium term
Oil & Gas Industry Market Outlook
Short Term: E&P Spending Forecast
Despite continuing macroeconomic concerns, expectations for E&P Spending still solid
Bln
US$
Source: Barclays Capital
Postponement of gas infrastructure and development project awards (i.e. GALSI, Shtokman)
Capex set for exceptional growth in key segments:
• Ultra-Deepwater • LNG • Heavy Oil
in which Saipem recently reinforced its exposure (fleet, Chiyoda JV, Canada)
Medium Term: Oil Services most dynamic segments
Bln
US$
Source: Goldman Sachs - March 2012; * From GS Top 330 projects
Incremental Capex - to 2015*
E&P Spending Forecast2011 VS 2012 Forecast at May 2012: +10.5%
11
Analysis of a Stable Backlog:
Underlying Theme – Robust Resilience
Analysis of a Stable Backlog:
Underlying Theme – Robust Resilience
1H 2012 Financial Results

12
Analysis of a Stable Backlog: Underlying Resilience
Onshore Business secured sustained volumes of activity in recent years of slowdown
Diversified portfolio of activities reduces market cycle exposure
Recent heavy Investments to tackle new industry’s secular trendsamplify room for further Growth
Recent Offshore recovery underpinning Backlog
Focus on Frontiers and Local Content contribute increasing resilience
€Bln
Saipem Backlog evolution by Business Unit: E&C + Drilling Saipem E&C Backlog evolution:
%Onshore VS %Offshore

13
E&C Onshore Backlog recent evolution
LNG: Very strong activity expected after significant LNG projects were sanctioned in 2011
• Saipem cooperation agreement with Chiyoda Iraq:
Iraq projects – set to ramp up • Saipem Iraq Base/Yard in Rumailah (Logistic Base, Pre-fabrication Yard, Training
Centre, Laydown Yard, Batching Plant) Oil Sands:
Oil price and industry’s technology unleash oil sands potential• Saipem setting up a long term presence in Canada: Edmonton pre-fabrication yard
’08-’10: steady E&C Onshore Backlog development, thanks to big NOCs contracting services
’10-Present: short term market uncertainties delaying contract awards
New industry secular trends: Saipem preparing for Long Term Opportunities
€Bln
8.00

14
E&C Offshore Backlog recent evolution
Ichthys - Gas Export Pipeline 42”x889km Australia – Trunk Line – Shallow Water
Tupi NE-Cabiunas – Gas Export Pipeline 24”x380kmBrazil – Trunk Line – Deep Water
Pre-Salt Field Developments and Gas Export PipelinesBrazil – SURF /Trunk Line – Deep Water
Filanovsky – 22”x114km Oil Pipeline and 28”x114km Gas Pipeline Caspian – Trunk Line - Ultra-shallow
Asasa – Pipeline, Risers, Subsea SpoolsWest Africa – SURF – Shallow water
Egina Oil Field Development West Africa – SURF – Deep Water
Saipem 7000 – T&I activitiesNorth Sea – Heavy Lifting
Reinforced presence as a Global Contractor in key offshore markets
Year to date awardsYear to date awards
Jangkrik – Gas and Condensate Pipelines Southeast Asia –Trunk Line – Deep Water
Shah Deniz 2 – Field DevelopmentCaspian – SURF / Trunk Line / T&I - Shallow Water
’08-’10: E&C Offshore Backlog shrinkage due to lower IOCs investments
’10-Present: signs of an upwards trend in all key geographic markets and segments
€Bln
Short term Market opportunities - exampleShort term Market opportunities - example
Across all Business Segments and Geographic Areas
Congo River Crossing – Gas Export Pipelines West Africa – Trunk Line – Shallow Water
Gendalo/Gehem – Field Developments and Export PipelinesSoutheast Asia – SURF / Trunk Line – Deep Water
LNG Upstream Developments – In-Field and Export Pipelines Australia – SURF / Trunk Line – Shallow Water

15
Despite difficulties in the Country, never close the door
Local Content and Frontier Focus Resilience - Nigeria example
Recent awards:Recent awards:
Southern Swamp Associated Gas Solution EPC for compression facilities at sites and new gas Central
Production facilities
Track Record of most recent awards in the Country:Track Record of most recent awards in the Country:
USAN - Elf Petroleum Nigeria (Total)EPIC for subsea development including wells, umbilicals and flowlines
AKPO – Total Upstream Nigeria EPIC for URF, oil loading terminal, FPSO mooring system and gas
export pipeline
Bonga North West - SNEPCo (Shell)• EPIC for subsea development including production pipe-in-pipe
flowlines, water injection flowlines and related production facilities
OFON - Total E&P Nigeria Ltd EPIC for OFP2 Jacket & T&I of complete OFQ living quarter
offshore platform
Saipem involved in almost all Country’s Major developments
Backlog Evolution in Nigeria
Present in the Country since late 1960s ~3700 Nigerian employees
Saipem presence in Nigeria:
A rare example of an International Contractor in the Country able to fulfil Local Content requirements
Scarabeo 3 – Addax Petroleum Charter of the semi-submersible rig until Q1 2014
€ Bln
OML 58 Upgrade Phase 1 - Total E&P Nigeria Ltd Revamping of OML Block, gas treatment train and interconnectingpipelines
Rumoulumeni Yard, Port Harcourt

Local Content and Frontier Focus Resilience - Saudi example
16
Reinforced long term presence in a traditional O&G market
Recent awards:Recent awards:
PetroRabigh II - Naphtha and Aromatics Package –Saudi Aramco and Sumitomo Chemical
EPC for two processing units: Naptha Reformer Unit and Aromatics Complex
Track Record of most recent awards in the Country:Track Record of most recent awards in the Country:
Al Wasit - Saudi Aramco EPIC for two offshore fields development including platforms, trunk
lines, mono-ethylene glycol (MEG) pipelines, related subsea cables and flowlines / shore approaches and onshore pipelines
Manifa - Saudi Aramco EPC for three gas/oil separation trains (GOSP), gas dehydration,
crude inlet manifolds and flare gas system
Khurais - Saudi Aramco EPIC for four gas/oil separation trains (GOSP), water injection
and seawater treatment Plant facilities
Perro Negro 5 and Perro Negro 7 – Saudi Aramco Charter of 2 Jack-up Rigs
Saipem present in all Businesses: E&C/Drilling – Onshore/Offshore
Backlog Evolution in Saudi
Present in the Country since 1976 ~3100 local employees
Saipem presence in Saudi Arabia:
Consistently prominent contributor to Saipem BacklogSynergic across Businesses
5 Onshore Rigs – Saudi Aramco Charter for periods from 3 to 5 years
€ Bln
10 Onshore Rigs – different Clients Charter for periods from 3 to 6 years
Dammam Yard Safco V – SABIC (Safco) EPC for new Urea Plant

17
DrillingDrilling
1H 2012 Results
Resilience and New OpportunitiesResilience and New Opportunities

18
Drilling Offshore – long term contracting policy 1/2
Q1 Q2 Q3 Q4 Q1 Q2 Q3 Q4 Q1 Q2 Q3 Q4 Q1 Q2 Q3 Q4 Q1 Q2 Q3 Q4 Q1 Q2 Q3 Q4 Q1 Q2 Q3 Q4
Q1 Q2 Q3 Q4 Q1 Q2 Q3 Q4 Q1 Q2 Q3 Q4 Q1 Q2 Q3 Q4 Q1 Q2 Q3 Q4 Q1 Q2 Q3 Q4 Q1 Q2 Q3 Q4
Q1 Q2 Q3 Q4 Q1 Q2 Q3 Q4 Q1 Q2 Q3 Q4 Q1 Q2 Q3 Q4 Q1 Q2 Q3 Q4 Q1 Q2 Q3 Q4 Q1 Q2 Q3 Q4
2011 2012 2013 2014 2015 2016 2017
Saipem Fleet Commitment 2011- 2017
Floaters > 3000ft.AVG dayrate 1H 2012Floaters > 3000ft.AVG dayrate 1H 2012
• Saipem 467k $• Market 403k $
Semisub < 3000ft. AVG dayrate 1H 2012Semisub < 3000ft. AVG dayrate 1H 2012
Jackup < 400ft.*AVG dayrate 1H 2012Jackup < 400ft.*AVG dayrate 1H 2012
• Saipem 250k $• Market 241k $
• Saipem 106k* $• Market 100k* $
* Excluding workover-only (i.e.PN4 for Saipem)
Fully Utilisation across all Rig ClassesFloaters locked at top-end dayrates range – Jackup comparing well with the market
(Source for Mkt day-rates : ODS-Petrodata)

19
Drilling Offshore – long term contracting policy 2/2
Saipem Fleet: End-of-contract Availability VS Market Outlook
Rigs marketed months before availability benefit from expected ramp up of dayrates
MarketSemisub < 3000ft.
MarketSemisub < 3000ft.
K $
Positive Market fundamentals
Market Floaters > 3000ft.
Market Floaters > 3000ft.
K $
Market Jackup < 400ft.*
Market Jackup < 400ft.*K
$
Continuing improvement in dayrates* Excluding
workover-only
Source for Market Utilisation (=Marketed Utilisation) and Dayrates: ODS-Petrodata
Deepwater outlook continues to strengthen
Next Saipem Rigs Marketing Period
Next Saipem Rigs Marketing Period
Next Saipem Rigs Marketing Period
2011 2012 2013 2014
2011 2012 2013 2014
2011 2012 2013 2014

6571 73
90 91 93 96 98 98 98 98 98 99 99 100 101 101 101
20
Drilling Onshore
New Contracts in Saudi Arabia
New contracts signed with Saudi Aramco for the charter of five 2,000-HP/1,500-HP onshore rigs
For periods of 3 to 5 years starting in different timeframes from 2H 2012 to Q3 2013
3 new purpose-built rigs
Onshore Rig Fleet by Client Type
Continue fine-tuning of fleet size to address Key-Clients’ requirements
Saipem Onshore Fleet Evolution

21
1H 2012 Results
2012 Guidance – mid-year update2012 Guidance – mid-year update
22
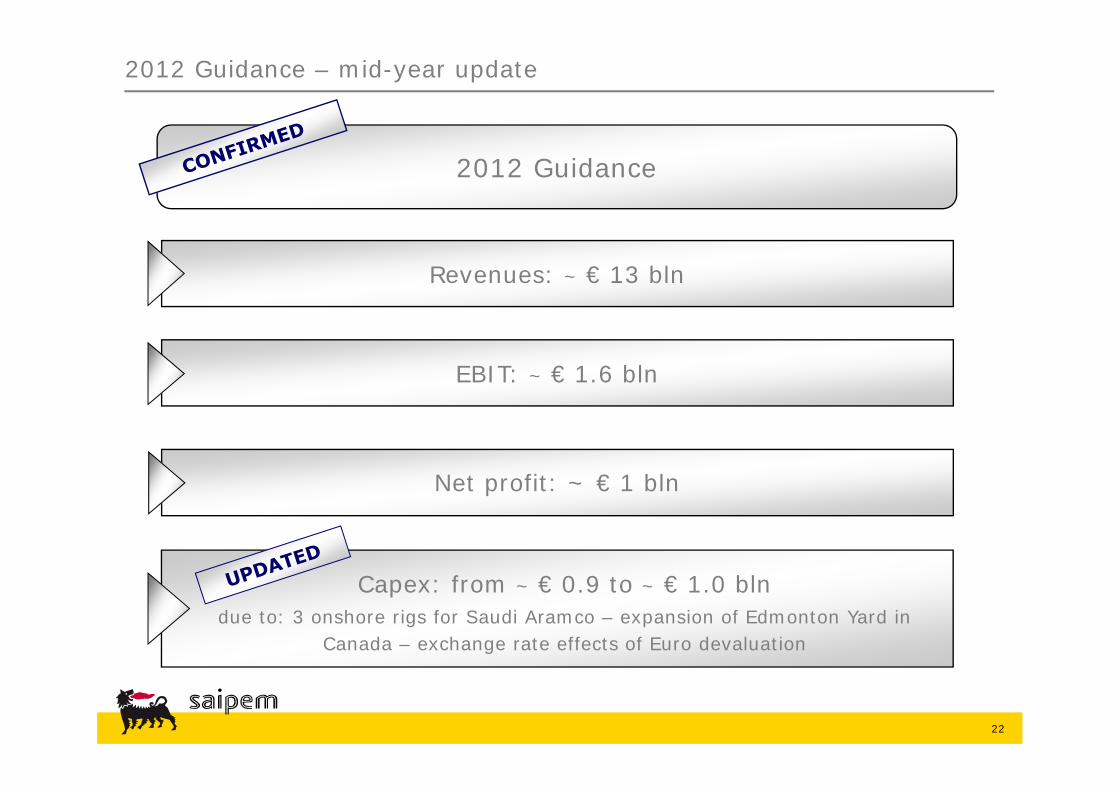
2012 Guidance – mid-year update
Revenues: ~ € 13 bln
EBIT: ~ € 1.6 bln
2012 Guidance
Net profit: ~ € 1 bln
Capex: from ~ € 0.9 to ~ € 1.0 blndue to: 3 onshore rigs for Saudi Aramco – expansion of Edmonton Yard in
Canada – exchange rate effects of Euro devaluation