
Presentation: Language Projections: 2010-2020 - … · Language Projections: 2010-2020 ... spoken...
40
1 Language Projections: 2010-2020 Hyon B. Shin Jennifer M. Ortman U.S. Census Bureau Presentation Prepared for the Federal Forecasters Conference, Washington, DC, April 21, 2011 This paper is released to inform interested parties of ongoing research and to encourage discussion of work in progress. Any views expressed on statistical, methodological, technical, or operational issues are those of the authors and not necessarily those of the U.S. Census Bureau.
Transcript of Presentation: Language Projections: 2010-2020 - … · Language Projections: 2010-2020 ... spoken...

1
Language Projections: 2010-2020
Hyon B. ShinJennifer M. OrtmanU.S. Census Bureau
Presentation Prepared for the Federal Forecasters Conference, Washington, DC, April 21, 2011
This paper is released to inform interested parties of ongoing research and to encourage discussion of work in progress. Any views expressed on statistical, methodological, technical, or operational issues are those of the authors and not necessarily those of the U.S. Census Bureau.

Overview
• Background• Data• Methodology• Results• Future directions
2

Background
• Historically, language questions were asked primarily in the decennial censuses.
• From 1890-1970, various questions on languages spoken and English-speaking ability were asked.
• Since 1980, the same three questions were asked in the 1980, 1990, and 2000 censuses and are currently asked in The American Community Survey (ACS).
• Used to satisfy the Voting Rights Act of 1965.
3

Language Questions Asked
The three-part question that was asked in the 1980, 1990, and 2000 Censuses, and in the ACS from 2001 to the present.
4

Background (continued)
• Language write-ins are coded to about 380 detailed language categories.
• We use the classification list of 39 categories for detailed language groups.
• Languages are further classified into 4 major language groups: Spanish, Other Indo-European languages, Asian and Pacific Island languages, and all other languages.
• While Spanish is the largest non-English language spoken, there are nearly 20 million speakers of other languages.
5

Data
• American Community Survey (ACS)
• U.S. Census Bureau’s 2008 and 2009 National Population Projections
6

The American Community Survey• Data from 2006, 2007, 2008, and 2009
• We project languages with at least 500,000 speakers in 2009:
7
Spanish Hindi
French Chinese
Italian Korean
Portuguese Vietnamese
German Tagalog
Russian Arabic
Polish

8

9

10

National Projections• The U.S. Census Bureau’s official national
population projections released in August 2008 and a series of supplemental projections released in December 2009.
• The projections produced in 2009 consist of four series based on alternative net international migration (NIM) assumptions and include:
(1) High Net International Migration(2) Low Net International Migration(3) Constant Net International Migration(4) Zero Net International Migration
11

National Projections (continued)• Based on Census 2000 and produced using a
cohort-component method.– We do not use any data from the 2010 Census.
• Projections of the resident population and demographic components of change by age, sex, race, and Hispanic origin for the United States: 2000-2050.– We use the projected populations for years 2010-2020.
• Assumptions about future rates of mortality and fertility are the same in all five series.
12

Language Projection Methodology• Projections of the total number of speakers of a
language other than English (LOTE) and the number of speakers for individual languages with at least 500,000 speakers in 2009.
• Future LOTE use is projected for the years 2010 through 2020 and is based on trends in ACS data.
• The projected number of LOTE speakers is produced by applying the projected percentages of speakers to the projected population.
13

Methodology (continued)• Projections of the percent speaking a LOTE are
developed and applied by demographic characteristics:
– LOTE and Spanish use are projected by age and Hispanic origin – 92 groups.
– The other individual languages are projected by age –46 groups.
14

Three Projection Models
Constant
Linear
Logistic
15

Constant Model
• LOTE use is held constant at the level reported in the 2009 ACS.
• Assumes no change in the distribution of LOTE speakers.
where:P = Percent speaking a LOTE in a given year
16
2020201120102009 ... PPPP

Linear Model• LOTE use is projected based on trends
observed in the 2006 through 2009 ACS.• Assumes that LOTE use in the future will
change by the same amount as in the past.
where: Pt = Percent speaking LOTE at time ta = estimated interceptb = estimated slopet = time (year)
17
)( tbaP t

Logistic Model• LOTE use is projected based on trends
observed in the 2006 through 2009 ACS.• Assumes that changes in LOTE use are
constrained.
where: Pt = Percent speaking LOTE at time ta,b,c = estimated parameterst = time (year)
18
))((1 ctt ebaP

Drivers of Change in LOTE Use
• Constant Model:– Changes in the number of speakers will be driven
by the population projections.
• Linear and Logistic Model:– Changes in the number of speakers will be driven
by changes in the projected distribution of LOTE speakers and by the population projections.
19

Comparison of Models: Example 1Increase in LOTE use from 2006 to 2009
0
2
4
6
8
10
12
14
16
18
20
2006 2008 2010 2012 2014 2016 2018 2020
Per
cent
Observed Constant Linear Logistic
Observed
Projected
20

Comparison of Models: Example 1Increase in LOTE use from 2006 to 2009
0
2
4
6
8
10
12
14
16
18
20
2006 2008 2010 2012 2014 2016 2018 2020
Per
cent
Observed Constant Linear Logistic
Observed
Projected
21

Comparison of Models: Example 1Increase in LOTE use from 2006 to 2009
0
2
4
6
8
10
12
14
16
18
20
2006 2008 2010 2012 2014 2016 2018 2020
Per
cent
Observed Constant Linear Logistic
Observed
Projected
22

Comparison of Models: Example 1Increase in LOTE use from 2006 to 2009
0
2
4
6
8
10
12
14
16
18
20
2006 2008 2010 2012 2014 2016 2018 2020
Per
cent
Observed Constant Linear Logistic
Observed
Projected
23

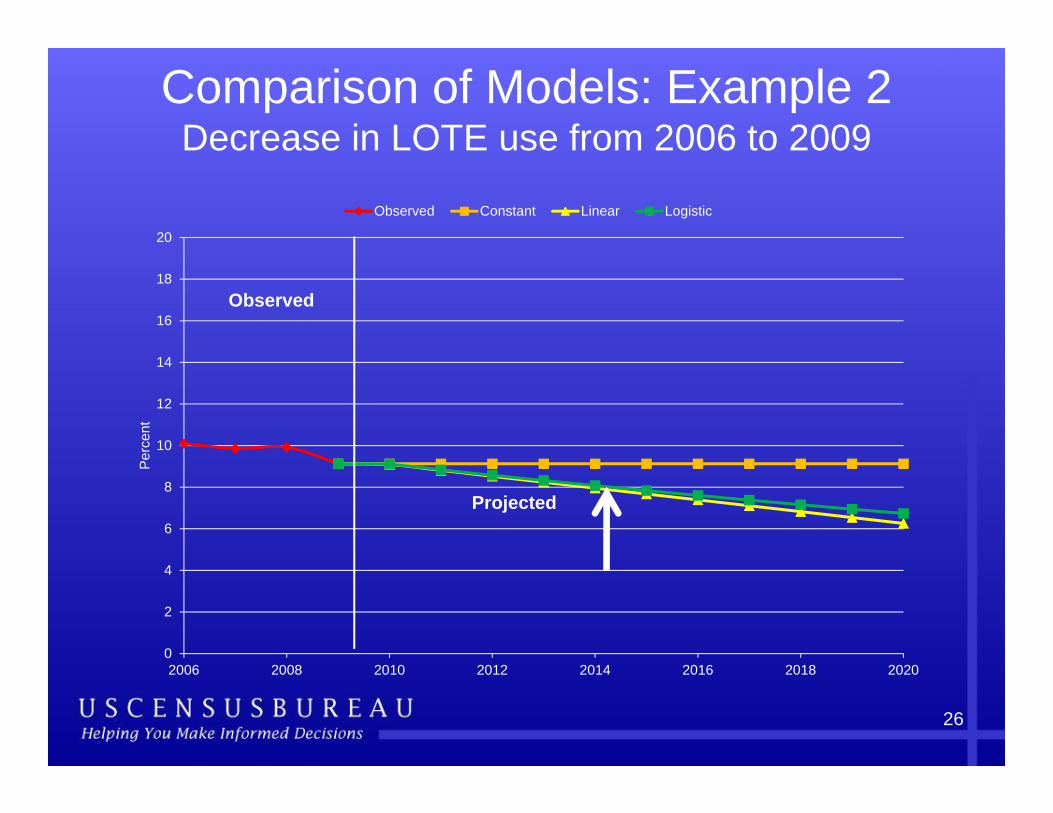
Comparison of Models: Example 2Decrease in LOTE use from 2006 to 2009
0
2
4
6
8
10
12
14
16
18
20
2006 2008 2010 2012 2014 2016 2018 2020
Per
cent
Observed Constant Linear Logistic
Observed
Projected
24

Comparison of Models: Example 2Decrease in LOTE use from 2006 to 2009
0
2
4
6
8
10
12
14
16
18
20
2006 2008 2010 2012 2014 2016 2018 2020
Per
cent
Observed Constant Linear Logistic
Observed
Projected
25
Comparison of Models: Example 2Decrease in LOTE use from 2006 to 2009
0
2
4
6
8
10
12
14
16
18
20
2006 2008 2010 2012 2014 2016 2018 2020
Per
cent
Observed Constant Linear Logistic
Observed
Projected
26

Results
27

Projected Number of LOTE Speakers
28
58,560 58,132 58,096
71,80567,339 66,325
Constant Model Linear Model Logistic Model
2010 2020
Numbers in thousandsBased on the 2008 National Population Projections

Projected Percent Speaking LOTE and English Only
29
20.3 22.5 20.1 21.1 20.1 20.8
79.7 77.5 79.9 78.9 79.9 79.2
0
25
50
75
100
2010 2020 2010 2020 2010 2020
Constant Model Linear Model Logistic Model
LOTE Only English
Based on the 2008 National Population Projections

Projected Number of Spanish Speakers
30
36,780 36,238 36,221
48,711
42,229 41,525
Constant Model Linear Model Logistic Model
2010 2020
Numbers in thousandsBased on the 2008 National Population Projections

Projected Percent of the Population 5 Years and Older Speaking Spanish
31
12.8 12.6 12.615.6 13.5 13.3
Constant Model Linear Model Logistic Model
2010 2020
Based on the 2008 National Population Projections

Projected Percent of the LOTE Speakers that Speak Spanish
32
62.8 62.3 62.367.8
62.7 62.6
Constant Model Linear Model Logistic Model
2010 2020
Based on the 2008 National Population Projections

Change between 2010 and 2020 in the Projected Number Speaking European Languages
33
120
-152
-49
55
-252
-147
42
141109
71
-78-113
53
221
126
42
-189
-118
Con
stan
t
Line
ar
Logi
stic
Con
stan
t
Line
ar
Logi
stic
Con
stan
t
Line
ar
Logi
stic
Con
stan
t
Line
ar
Logi
stic
Con
stan
t
Line
ar
Logi
stic
Con
stan
t
Line
ar
Logi
stic
French Italian Portuguese German Russian Polish
Numbers in thousandsBased on the 2008 National Population Projections

Change between 2010 and 2020 in the Projected Number Speaking Non-European Languages
34
37
235173 148
315
502
60
-135
-58
76
183232
97
318 298
45
442
247
Con
stan
t
Line
ar
Logi
stic
Con
stan
t
Line
ar
Logi
stic
Con
stan
t
Line
ar
Logi
stic
Con
stan
t
Line
ar
Logi
stic
Con
stan
t
Line
ar
Logi
stic
Con
stan
t
Line
ar
Logi
stic
Hindi Chinese Korean Vietnamese Tagalog Arabic
Numbers in thousandsBased on the 2008 National Population Projections

Distribution of LOTE Speakers by Language: Constant Model
35
3.3
1.11.3
1.8
1.5
0.9 1.0
4.5
1.8
2.2
2.5
1.6
2.9
1.0 1.1
1.51.3
0.8 0.9
3.9
1.5
1.9
2.2
1.3
2010 2020
Percent of all LOTE Speakers

Distribution of LOTE Speakers by Language: Linear Model
36
3.3
1.11.3
1.8
1.5
0.91.1
4.5
1.8
2.32.5
1.6
2.6
0.6
1.3 1.4
1.7
0.5
1.3
4.3
1.3
2.2
2.7
2.0
2010 2020
Percent of all LOTE Speakers

Distribution of LOTE Speakers by Language: Logistic Model
37
3.3
1.11.3
1.8
1.5
0.91.1
4.5
1.8
2.2
2.5
1.6
2.8
0.7
1.3 1.4 1.5
0.6
1.2
4.7
1.5
2.3
2.7
1.8
2010 2020
Percent of all LOTE Speakers

Summary• The constant growth assumption is simplistic,
resulting in an increase in LOTE use for all languages.
• The linear and logistic assumptions are more realistic and provide results that are very similar.
• The use of LOTE is projected to increase over the next ten years. – Spanish is projected to remain the most frequently spoken.– Portuguese, Russian, Hindi, Chinese, Vietnamese,
Tagalog, and Arabic are all projected to increase.– French, Italian, German, Polish, and Korean are projected
to decline.
38

Future Directions
• Include 2010 ACS data and use 2010-Census based population projections when the data are available
• Project by age groups instead of single years• Use 3-year ACS files as basis of time series
– 2006-2008– 2007-2009– 2008-2010
• Project by nativity (foreign and native born)• Project by birth cohorts instead of age
39

40
More Information• http://www.census.gov/acs/www/• http://www.census.gov/population/www/projections
• Questions: – Population Projections Branch:
301-763-2428 [email protected]
– Education and Social Stratification Branch:301-763-2464 [email protected]


