Presentation: Global Trade in Services: Fear, Facts, and ... Trade in Services: Fear, Facts, and ......
57
Global Trade in Services: Global Trade in Services: Fear, Facts, and Offshoring Fear, Facts, and Offshoring J. Bradford Jensen J. Bradford Jensen McDonough School of Business, Georgetown University McDonough School of Business, Georgetown University Peterson Institute for International Economics Peterson Institute for International Economics Peterson Institute for International Economics Peterson Institute for International Economics Georgetown Center for Business and Public Policy Georgetown Center for Business and Public Policy NBER NBER Otb 18 2011 Otb 18 2011 October 18, 2011 October 18, 2011
Transcript of Presentation: Global Trade in Services: Fear, Facts, and ... Trade in Services: Fear, Facts, and ......

Global Trade in Services: Global Trade in Services: Fear, Facts, and OffshoringFear, Facts, and Offshoring
J. Bradford JensenJ. Bradford Jensen
McDonough School of Business, Georgetown UniversityMcDonough School of Business, Georgetown University
Peterson Institute for International EconomicsPeterson Institute for International EconomicsPeterson Institute for International EconomicsPeterson Institute for International Economics
Georgetown Center for Business and Public Policy Georgetown Center for Business and Public Policy
NBERNBER
O t b 18 2011O t b 18 2011October 18, 2011October 18, 2011

Why?
Retail trade12%
Transportation and warehousing
3%
Wholesale trade5%
Manufacturing10%
Services50%
Mining0%
Utilities0%
Construction5%
0%
Federal Government2%
State and Local Government12%
Source: 2007 Economic Census, Census of Governments and 2006 Occupational Employment Survey

Why?
Retail trade12%
Transportation and warehousing
3%
Business Services25%
Wholesale trade5%
$56,000$56,000
Manufacturing10%
$46,000$46,000
Construction5%
Utilities0% Mining & Ag. Personal Services
Federal Government2%
State and Local Government12%
0%1%
Personal Services25%
Source: 2007 Economic Census, Census of Governments and 2006 Occupational Employment Survey

Why?
NAICS Code SectorEmployment
2007
Share of Total Employment
2007
Employment Growth
1997-200721 Mining 703 129 0 5% 38%21 Mining 703,129 0.5% 38%22 Utilities 632,432 0.5% -10%23 Construction 7,399,047 5.5% 31%31-33 Manufacturing 13,333,390 9.9% -21%42 Wholesale trade 6,295,109 4.7% 9%44-45 Retail trade 15,610,710 11.5% 12%48-49 Transportation and warehousing 4,435,760 3.3% 52%51-56 Business Services 33,430,809 24.7% 29%
51 Information 3,428,262 2.5% 12%52 Finance and insurance 6,562,546 4.9% 12%53 Real estate and rental and leasing 2,249,353 1.7% 32%54 Professional scientific and technical services 8 121 171 6 0% 51%54 Professional, scientific, and technical services 8,121,171 6.0% 51%55 Management of companies and enterprises 2,915,644 2.2% 11%56 Administrative and support and waste remediation services 10,153,833 7.5% 38%
61-81 Personal Services 34,595,857 25.6% 23%61 Educational services 562,210 0.4% 75%62 Health care and social assistance 16,859,513 12.5% 24%71 Arts entertainment and recreation 2 070 524 1 5% 30%71 Arts, entertainment, and recreation 2,070,524 1.5% 30%72 Accommodation and food services 11,587,814 8.6% 23%81 Other services (except public administration) 3,515,796 2.6% 8%
Federal Government 2,462,000 1.8% --State and Local Government 16,400,000 12.1% --
S U S CSource: U.S. Census Bureau

What is Trade in Services?What is Trade in Services?
• Modes of service trade:
• Mode 1 – Cross‐border provision, e.g. software produced in one region and shipped via internet to another region
• Mode 2 – Consumption abroad, e.g. consumer travels to resort to consume service
• Mode 3 – Commercial presence in foreign region, e.g. restaurant opens local branch to serve foreign demand
• Mode 4 – Temporary movement of natural persons, e.g. consultant travels to customer to deliver services
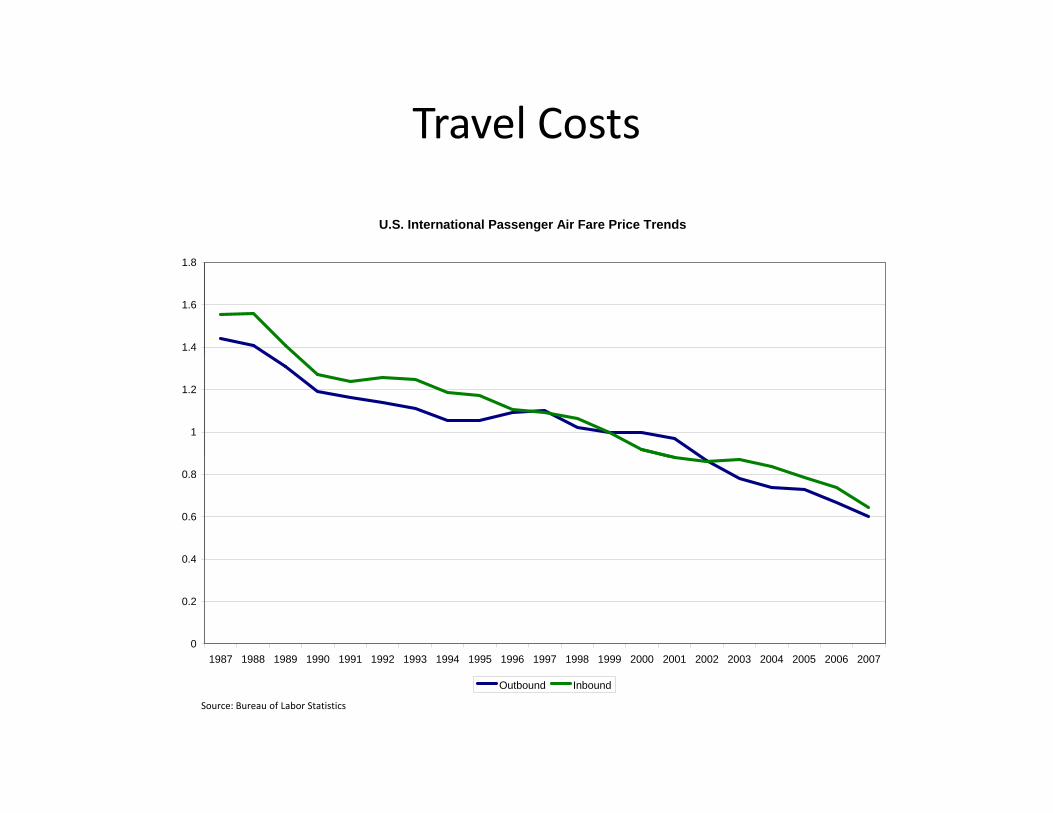
Travel Costs
U.S. International Passenger Air Fare Price Trends
1.4
1.6
1.8
1
1.2
0 4
0.6
0.8
0
0.2
0.4
1987 1988 1989 1990 1991 1992 1993 1994 1995 1996 1997 1998 1999 2000 2001 2002 2003 2004 2005 2006 2007
Outbound Inbound
Source: Bureau of Labor Statistics

Telecommunication CostsInternational Switched Services
Average Revenue per Minute
$1 00
$1.20
$0 60
$0.80
$1.00
$0 20
$0.40
$0.60
$0.00
$0.20
1992 1993 1994 1995 1996 1997 1998 1999 2000 2001 2002 2003 2004 2005 2006 2007
Source: International Telecommunications Data, FCC, June 2009100
120
2 km
50 km
Index 1992 =100
Trends in leased line pricing (2 Mbits)
40
60
80
50 km
200 km
Source: OECD
0
20
1992 1993 1994 1995 1996 1997 1998 1999 2000 2001 2002 2003 2004 2005

Internet Usage
Region Population Internet Users 2009 Penetration User Growth (2000-2009)Africa 975,330,899 54,171,500 6% 1100%Asia 3,780,819,792 657,170,816 17% 475%
World Internet Usage and Population Statistics
Europe 803,903,540 393,373,398 49% 274%Middle East 196,767,614 45,861,346 23% 1296%North America 337,572,949 251,290,489 74% 133%Latin America/Caribbean 581,249,892 173,619,140 30% 861%Oceania / Australia 34,384,384 20,783,419 60% 173%WORLD TOTAL 6 710 029 070 1 596 270 108 24% 342%WORLD TOTAL 6,710,029,070 1,596,270,108 24% 342%
Source: www.internetworldstats.com
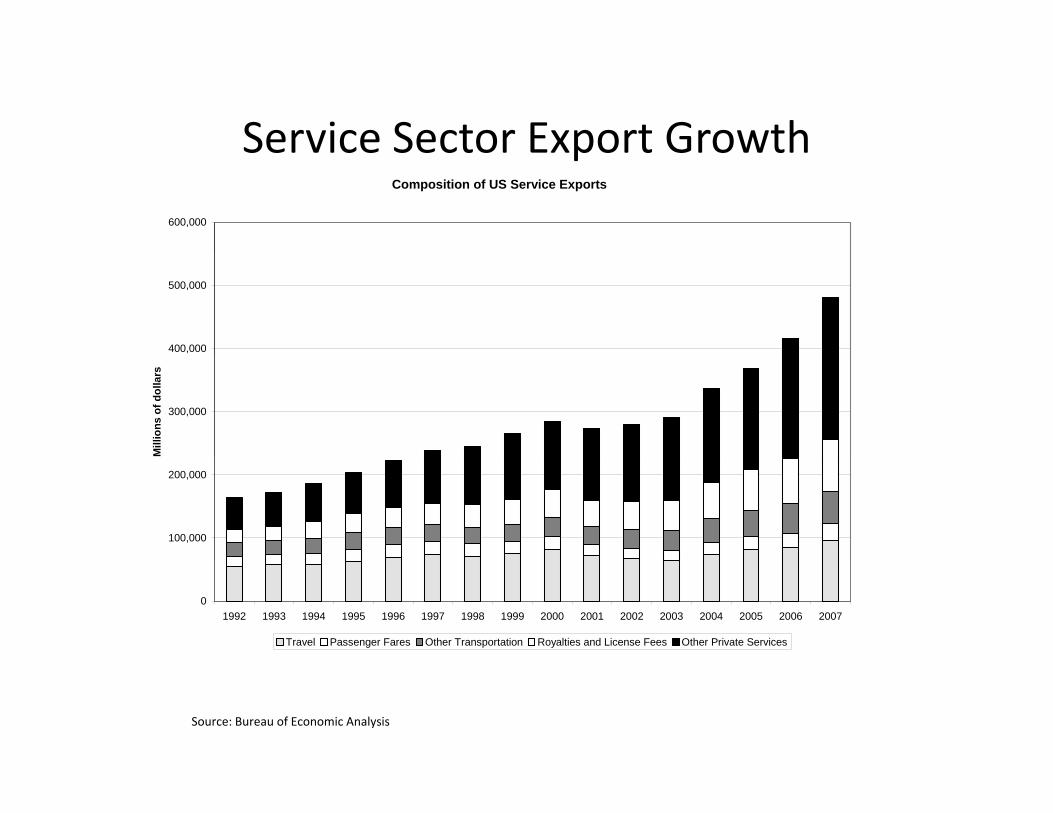
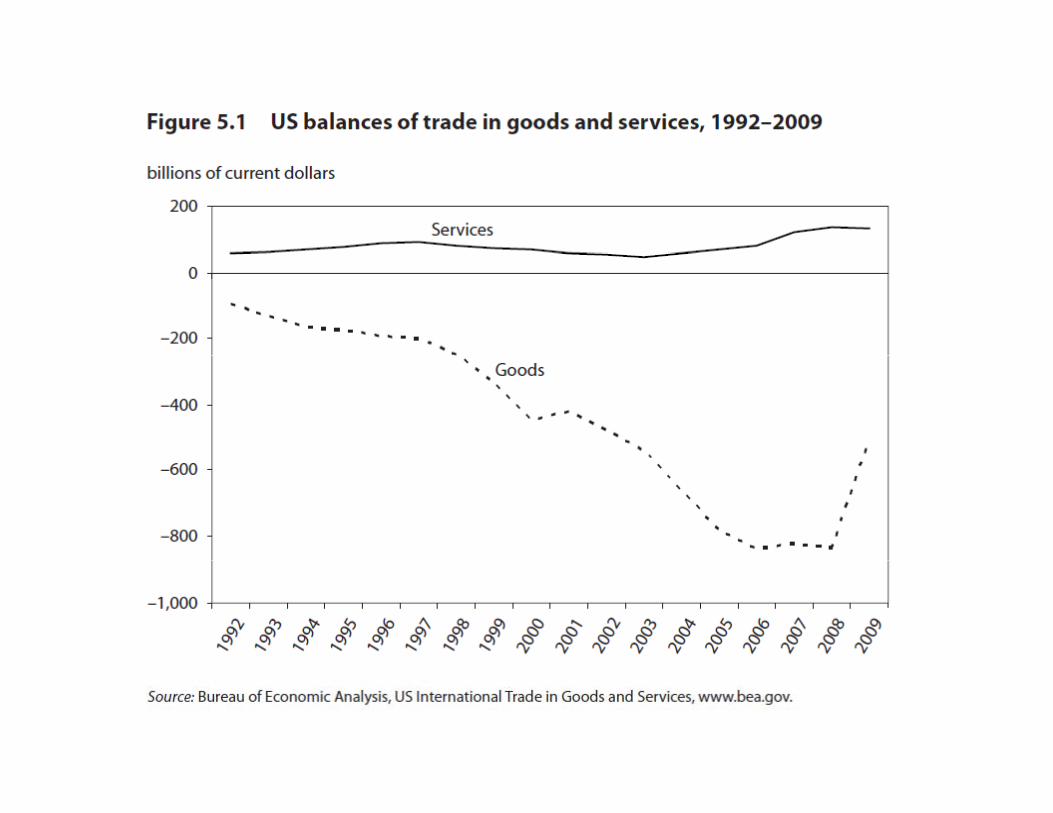
Service Sector Export GrowthService Sector Export GrowthComposition of US Service Exports
600,000
400,000
500,000
300,000
Mill
ions
of d
olla
rs
100,000
200,000
01992 1993 1994 1995 1996 1997 1998 1999 2000 2001 2002 2003 2004 2005 2006 2007
Travel Passenger Fares Other Transportation Royalties and License Fees Other Private Services
Source: Bureau of Economic Analysis
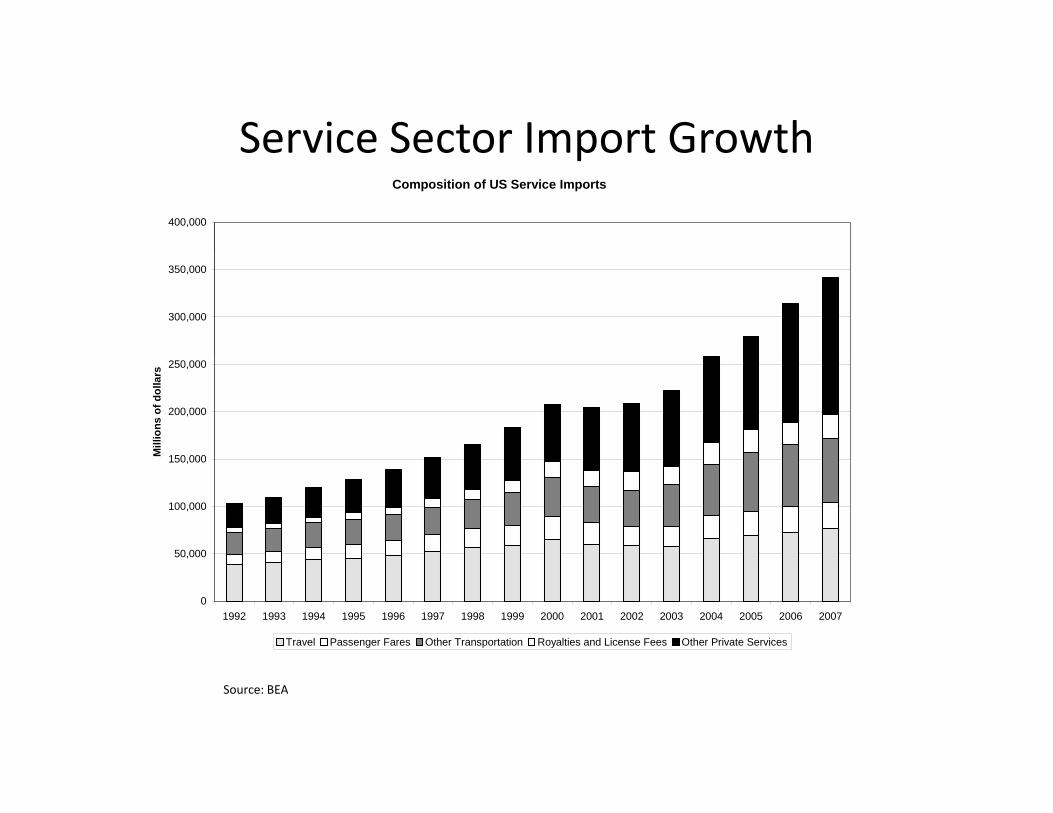
Service Sector Import GrowthService Sector Import GrowthComposition of US Service Imports
400,000
300,000
350,000
150 000
200,000
250,000
Mill
ions
of d
olla
rs
50,000
100,000
150,000
01992 1993 1994 1995 1996 1997 1998 1999 2000 2001 2002 2003 2004 2005 2006 2007
Travel Passenger Fares Other Transportation Royalties and License Fees Other Private Services
Source: BEA

A closer look
2006Travel 2 ……………………………………………………………………Passenger fares 3 …………………………………………………………Other transportation……………………………………………………..Royalties and license fees………………………………………………Other private services 4 15………………………………………………
Education 5………………………………………………………………16Financial services 16……………………………………………………
Insurance services 6 ……………………………………………………Telecommunications 7…………………………………………………Business, professional, and technical services 16…………………
Computer and information services 8 16……………………………Management and consulting services 9Management and consulting services ……………………………Research and development and testing services 9………………Operational leasing 16…………………………………………………Other business, professional, and technical services 10 16………
Accounting, auditing, and bookkeeping services……………….Advertising……………………………………………………………
Data AvailableArchitectural, engineering, and other technical services………Construction …………………………………………………………Industrial engineering………………………………………………Installation, maintenance, and repair of equipment……………Legal services………………………………………………………
11Medical services 11…………………………………………………Mining 12………………………………………………………………Sports and performing arts…………………………………………Trade-related services 13……………………………………………Training services……………………………………………………Other 14Other …………...
Other services………………………………………………………….Film and television tape rentals……………………………………
Other…………………………………………………………………
2001Travel 2 ……………………………………………………………………
Data AvailablePassenger fares 3 ………………………………………………………Other transportation……………………………………………………..Royalties and license fees………………………………………………Other private services 4 15………………………………………………
Education 5………………………………………………………………16Financial services 16……………………………………………………
Insurance services 6 ……………………………………………………Telecommunications 7…………………………………………………Business, professional, and technical services 16…………………
Computer and information services 8 16……………………………Management and consulting services 9Management and consulting services ……………………………Research and development and testing services 9………………Operational leasing 16…………………………………………………Other business, professional, and technical services 10 16………Data Available
11Medical services 11…………………………………………………
Other services………………………………………………………….Film and television tape rentals……………………………………
Other…………………………………………………………………

1997Travel 2 ………………………………………………………………
Data AvailablePassenger fares 3 …………………………………………………Other transportation………………………………………………Royalties and license fees…………………………………………Other private services 4 15…………………………………………
Education 5…………………………………………………………16Financial services 16………………………………………………
Insurance services 6 ……………………………………………Telecommunications 7……………………………………………Business, professional, and technical services 16……………
Computer and information services 8 16………………………
Operational leasing 16…………………………………………Other business, professional, and technical services 10 16…Data Available
11Medical services 11……………………………………………
Other services……………………………………………………Film and television tape rentals………………………………
Other……………………………………………………………

1992Travel 2 ………………………………
Data AvailablePassenger fares 3 ……………………Other transportation…………………Royalties and license fees…………Other private services 4 15…………
Education 5…………………………
Insurance services 6 ………………Telecommunications 7……………
…
Data Available
11Medical services 11………………..
Other services………………………Film and television tape rentals
Other……………………………

A new approach

Empirical Approach: Geographic Concentration
Industrial Concentration: Seattle
16
18
20
12
14
Quo
tient
6
8
10
Loca
tion
Q
0
2
4
0Aircraft and
partsAerospaceproduct and
parts
Ship and boatbuilding
Fishing, hunting,trapping
Toys,amusements,and sporting
goods
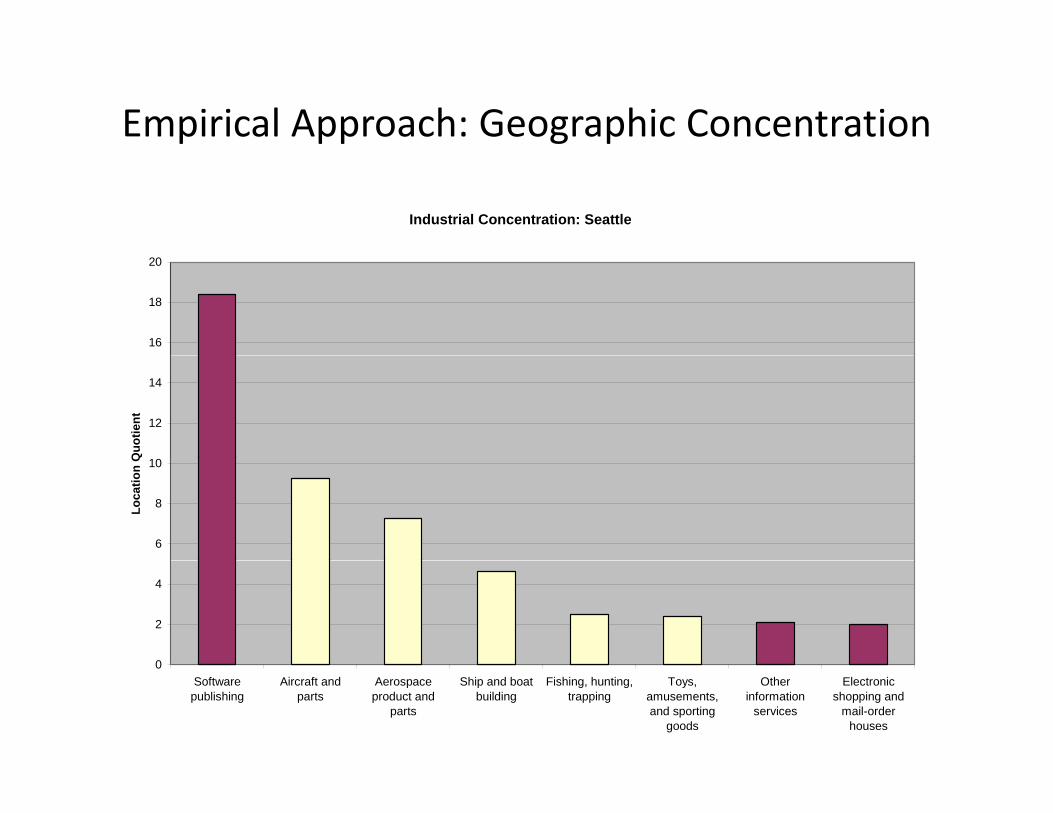
Empirical Approach: Geographic Concentration
Industrial Concentration: Seattle
16
18
20
12
14
Quo
tient
6
8
10
Loca
tion
Q
0
2
4
0Softwarepublishing
Aircraft andparts
Aerospaceproduct and
parts
Ship and boatbuilding
Fishing, hunting,trapping
Toys,amusements,and sporting
goods
Otherinformation
services
Electronicshopping and
mail-orderhouses

Geographic Concentration of Industries
Geographic Concentration of Industries
0.7
0.8
0.9
Mfg EMP –86% T
Ag/Min EMP –100% T
0.5
0.6
Coe
ffici
ent
Bus Svc EMP –70% Tradable
100% T
0.2
0.3
0.4
Gin
i C
Ed/Health EMP –98% N‐TOth Svc EMP –80% N‐T
0
0.1
0 100 200 300 400 500 600 700 800 900 1000
NAICS Industry
Ag Mining Utilities Construction Manufacturing Wholesale Retail Transportation Services Public Admin
Source: Jensen and Kletzer (2006)

Geographic Concentration of Occupations
Geographic Concentration of Occupations
0.7
0.8
0.5
0.6
ffici
ent
Comp/Math EMP –100% T
Scientific EMP –84% T
0 2
0.3
0.4
Gin
i Coe
f
Social Svc/Ed EMP –100% N-T
0
0.1
0.2
010 15 20 25 30 35 40 45 50 55 60
SOC Occupation
High-End Services Other Services Legal Other Services Production Related Military Specific
Mgt, Bus/Fin Ops, Arch/Eng EMP –65% T
Prod EMP – 80% N-T

New insights

Employment Shares for Tradable Industries
Manufacturing10%
Wholesale Trade
Ag, Forest, Fish1%
Retail Trade2%
Trans/Warehouse3%
2%
Business Services14%
Personal Services3%
Public Administration2%
Non-Tradable Industries63%
S A h ’ l l i 2007 A i C i SSource: Author’s calculations, 2007 American Community Survey

Tradable Services are Different
Worker Characteristics for Select Industries
Non-tradable Industry Tradable IndustryNumber of Workers 2,235,432 12,994,490Average Earnings $44,014 $49,952Share with B.A. 16% 24%
Manufacturing (NAICS 30s)
Share with B.A. 16% 24%Share with Advanced Degree 3% 7%Share in Tradable Occupations 26% 34%
Non-tradable Industry Tradable IndustryProfessional Services (NAICS 50s)
Non tradable Industry Tradable IndustryNumber of Workers 8,038,246 18,430,199Average Earnings $42,226 $66,454Share with B.A. 29% 50%Share with Advanced Degree 7% 17%Share in Tradable Occupations 31% 60%pSource: Author's calculations, 2007 American Community Survey
Source: Author’s calculations, 2007 American Community Survey

Tradable Services are Different
25%
Average Earnings Differentialswith Demographic, Industry, and Occupation Group Controls
20%
15%
5%
10%
0%All Workers Prof. Service Industries High-End Service Occupations
Non-tradable Industry, Tradable Occupation Tradable Industry, Non-tradable Occupation Tradable Industry, Tradable Occupation

Cause for concern?

Wall Street Journal, March 28, 2007.

Factor Abundance: Education
Average Educational Attainment, 1985 Select Countries
12
14
U.S.
Australia, Canada
8
10
Year
s
Japan, Germany, U.K., Netherlands, BelgiumSouth Korea
Italy, France
4
6
China
India
IndonesiaBrazil
Mexico
0
2
0 5000 10000 15000 20000
GDP per Capita
Source: Educational Attainment, Barro and Lee and GDP per Capita, Penn World Tables v. 5
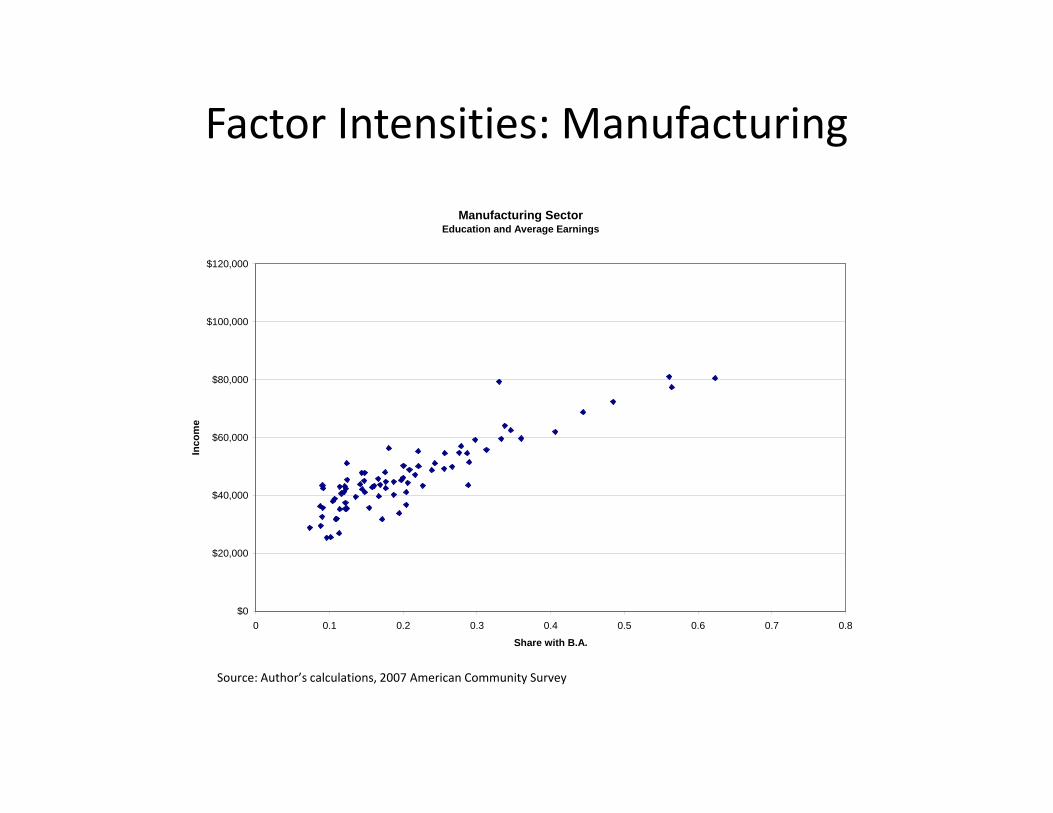
Factor Intensities: Manufacturing
Manufacturing Sector
Education and Average Earnings
$100,000
$120,000
$60,000
$80,000
Inco
me
$20,000
$40,000
$00 0.1 0.2 0.3 0.4 0.5 0.6 0.7 0.8
Share with B.A.
Source: Author’s calculations, 2007 American Community Survey
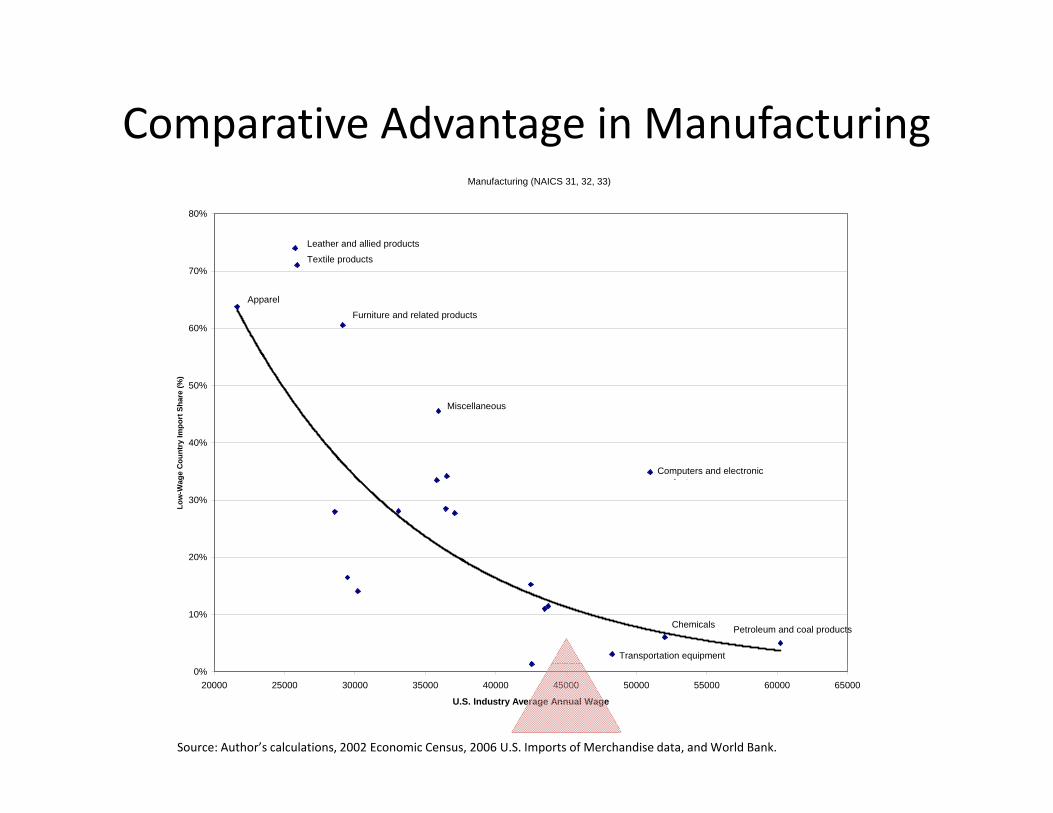
Comparative Advantage in Manufacturing
Manufacturing (NAICS 31, 32, 33)
80%
Leather and allied products
60%
70%Textile products
Apparel
Furniture and related products
40%
50%
untr
y Im
port
Sha
re (%
)
Miscellaneous
20%
30%
Low
-Wag
e C
ou
Computers and electronic d t
10%Petroleum and coal productsChemicals
Transportation equipment
0%20000 25000 30000 35000 40000 45000 50000 55000 60000 65000
U.S. Industry Average Annual Wage
Source: Author’s calculations, 2002 Economic Census, 2006 U.S. Imports of Merchandise data, and World Bank.
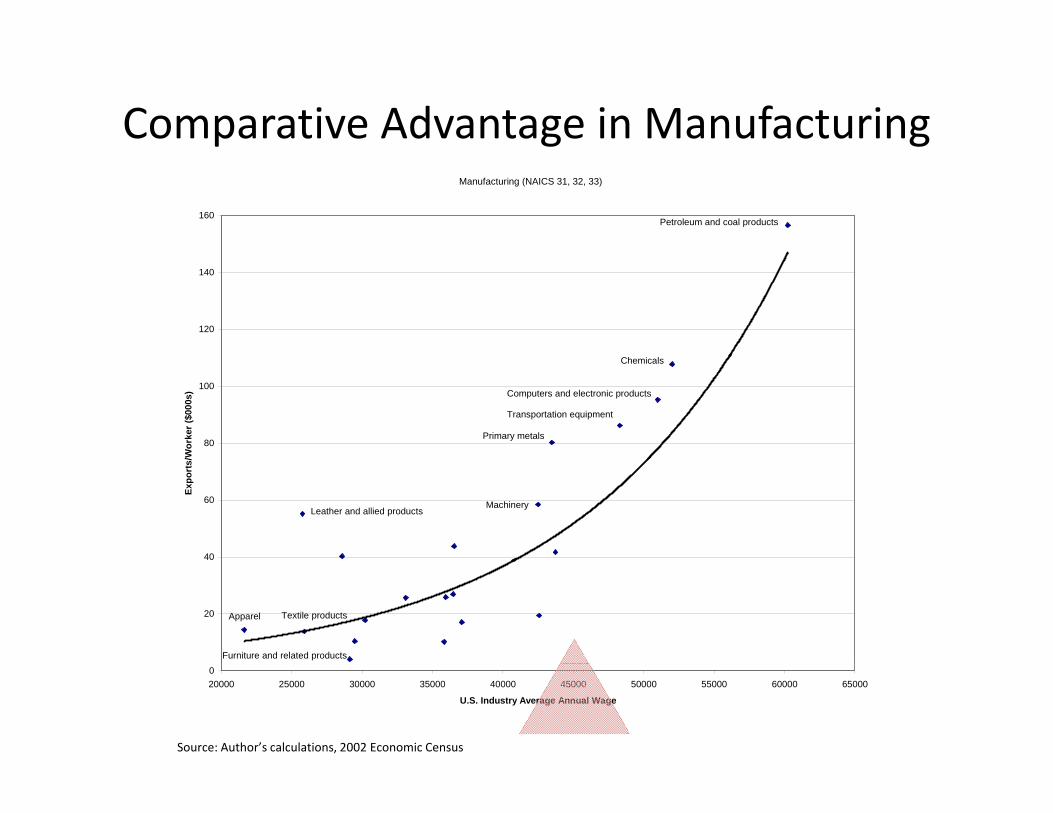
Comparative Advantage in Manufacturing
Manufacturing (NAICS 31, 32, 33)
160Petroleum and coal products
120
140
80
100
/Wor
ker (
$000
s)
Chemicals
Computers and electronic products
Transportation equipment
Primary metals
40
60
Expo
rts/
MachineryLeather and allied products
20 Textile productsApparel
Furniture and related products020000 25000 30000 35000 40000 45000 50000 55000 60000 65000
U.S. Industry Average Annual Wage
Source: Author’s calculations, 2002 Economic Census

Factor Intensities: Services
Service Sector
Education and Average Earnings
$100,000
$120,000
$60,000
$80,000
ncom
e
$20 000
$40,000
In
$0
$20,000
0 0.1 0.2 0.3 0.4 0.5 0.6 0.7 0.8
Share with B.A.
Source: Author’s calculations, 2007 American Community Survey
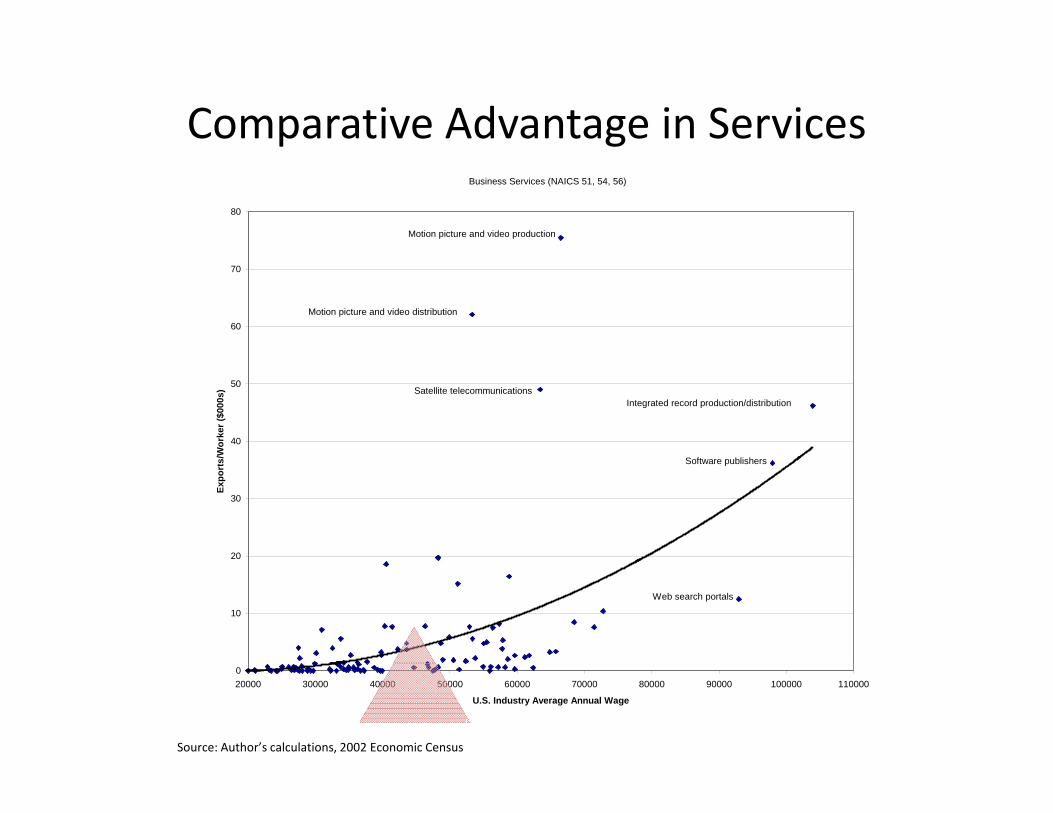
Comparative Advantage in Services
Business Services (NAICS 51, 54, 56)
80
Motion picture and video production
60
70
Motion picture and video distribution
40
50
/Wor
ker (
$000
s)
Integrated record production/distribution
S ft bli h
Satellite telecommunications
20
30
Expo
rts/ Software publishers
10
Web search portals
020000 30000 40000 50000 60000 70000 80000 90000 100000 110000
U.S. Industry Average Annual Wage
Source: Author’s calculations, 2002 Economic Census
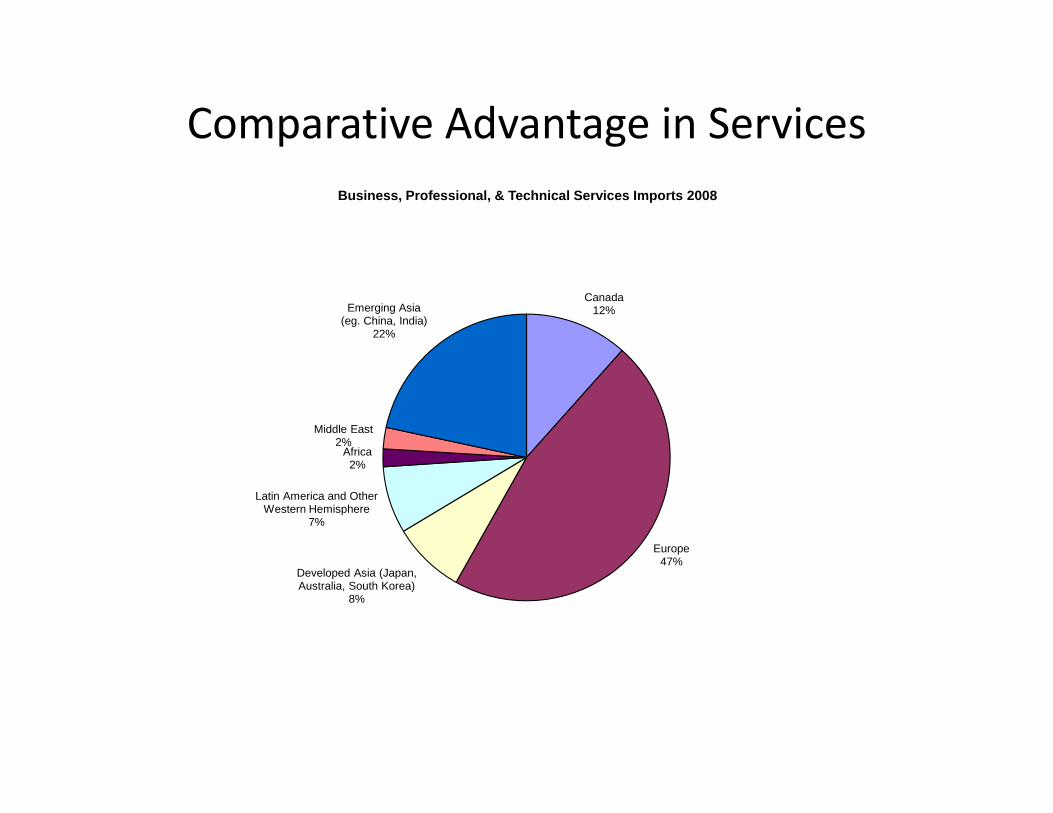
Comparative Advantage in ServicesBusiness, Professional, & Technical Services Imports 2008
Canada12%Emerging Asia
(eg. China, India)22%
Africa
Middle East2%
Europe47%
Latin America and Other Western Hemisphere
7%
2%
47%Developed Asia (Japan, Australia, South Korea)
8%
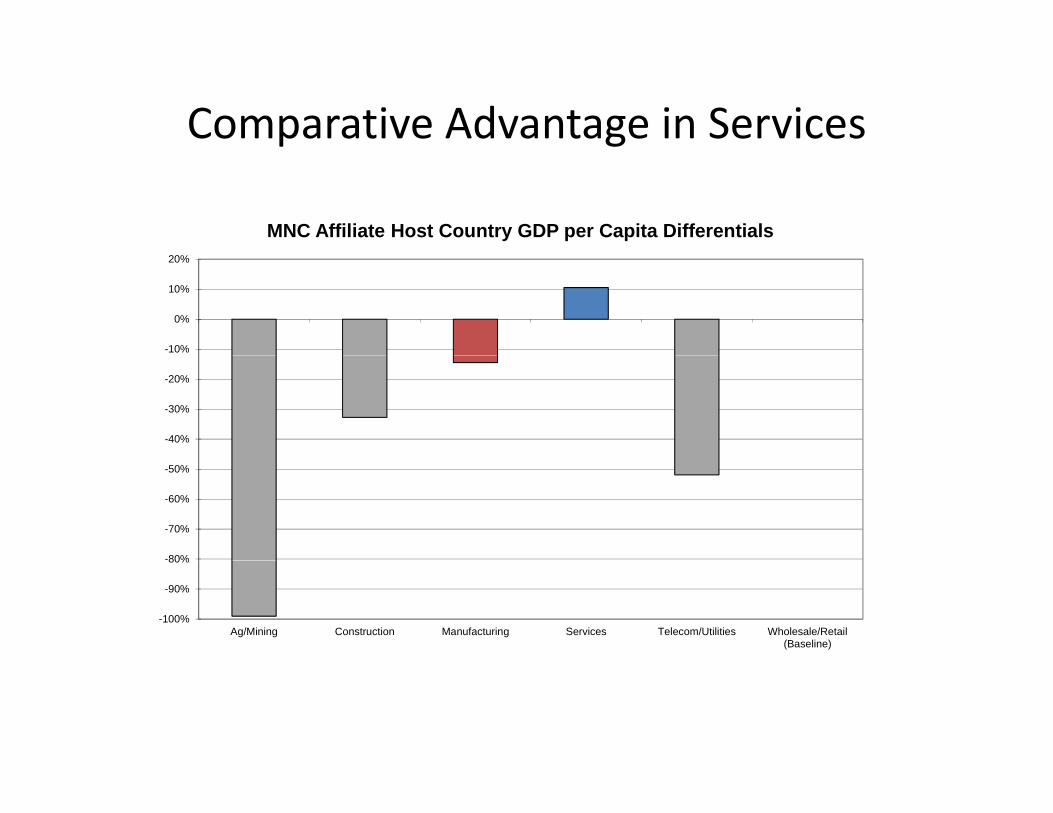
Comparative Advantage in Services
MNC Affiliate Host Country GDP per Capita Differentials
-10%
0%
10%
20%
-40%
-30%
-20%
-80%
-70%
-60%
-50%
-100%
-90%
80%
Ag/Mining Construction Manufacturing Services Telecom/Utilities Wholesale/Retail(Baseline)

Comparative Advantage in Services
50%
GDP per Capita Differences for Vertically Integrated Affiliates
30%
40%
10%
20%
‐10%
0%Manufacturing ‐‐ Vertically Integrated Services ‐‐ Vertically Integrated
‐40%
‐30%
‐20%
‐50%
0%
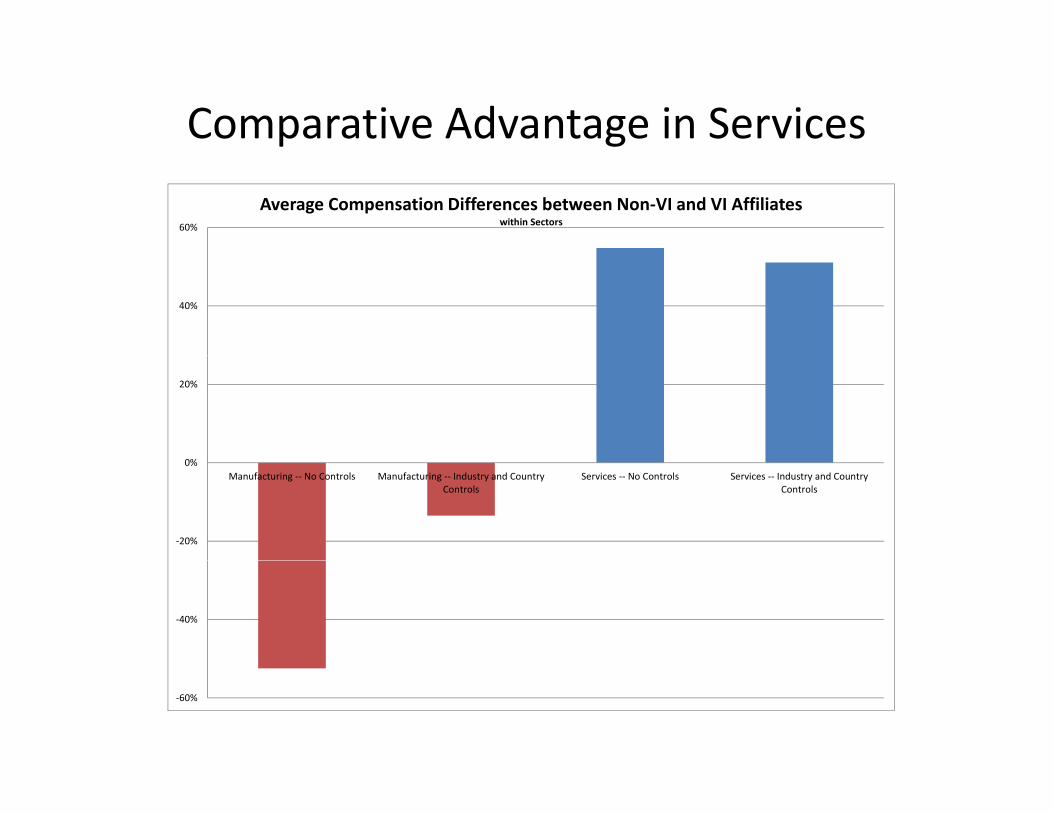
Comparative Advantage in Services
60%
Average Compensation Differences between Non‐VI and VI Affiliates within Sectors
40%
20%
‐20%
0%Manufacturing ‐‐ No Controls Manufacturing ‐‐ Industry and Country
ControlsServices ‐‐ No Controls Services ‐‐ Industry and Country
Controls
‐40%
‐60%

Opportunities?

Impediments to Trade in Services
11 7 illi
14.1 million
Total Employment
11.7 million
Probability of Exporting: 1/4 Probability of Exporting: 1/20
Even controlling for “tradability” i t bli h t h lfservice establishments half as
likely to export
For exporters, exports/sales ratios lower in business
Employmentt E t
6.5 million
ratios lower in business services than manufacturing
at Exporters
1.2 million
Manufacturing Business Services
Source: Author’s calculations from 2002 Economic Census; Manufacturing (NAICS Industries 31-33), Business Services (NAICS Industries 51, 54, 56)
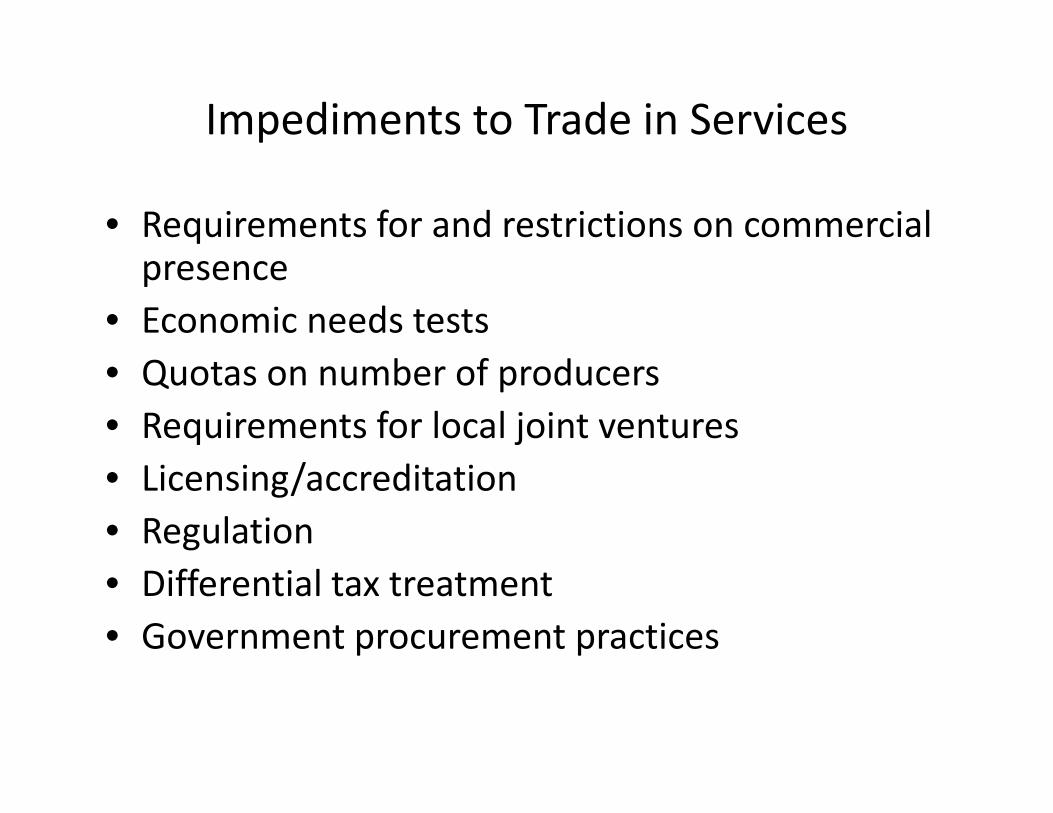
Impediments to Trade in Services
• Requirements for and restrictions on commercial presence
• Economic needs tests• Quotas on number of producers• Requirements for local joint ventures• Licensing/accreditation• Regulation• Differential tax treatment• Government procurement practices

Impediments to Trade in Services
Source: Gootiiz and Mattoo (2009)

Labor Market Impact

Potential Labor Market Impact
100%
Tradable Manufacturing (NAICS 30s) Tradable Business Services (NAICS 50s)
70%
80%
90%
ent
40%
50%
60%
e of
Sec
tor E
mpl
oym
e
20%
30%
Shar
e
0%
10%
20,000 30,000 40,000 50,000 60,000 70,000 80,000 90,000 100,000 110,000 120,000 130,000
Industry Average Wage
Source: Author’s calculation using 2007 County Business Patterns data.

Labor Market Impact
8,000,000
Net Change in Employment, 1998‐2007 by Sector
6,000,000
2,000,000
4,000,000
of Jo
bs
0Business Services ‐
Non‐tradableBusiness Services ‐
TradableManufacturing ‐Non‐tradable
Manufacturing ‐Tradable
Personal Services Other
Num
ber o
‐4,000,000
‐2,000,000
‐6,000,000
Source: Jensen (2011), Author's calculations, County Business Pattern Data, 1998‐2007

Distribution of Tradable Service JobsTradable Business Service Industries Tradable Business Service Occupations
0.25
0.3
Share of Workforce in Low-wage Tradable Professional Service Industries
0.1
0.15
0.2
0
0.05
10 11 12 13 14 15 16 17
ln(Workforce)
Source: Author’s calculations, 2007 American Community Survey

Concluding Observations
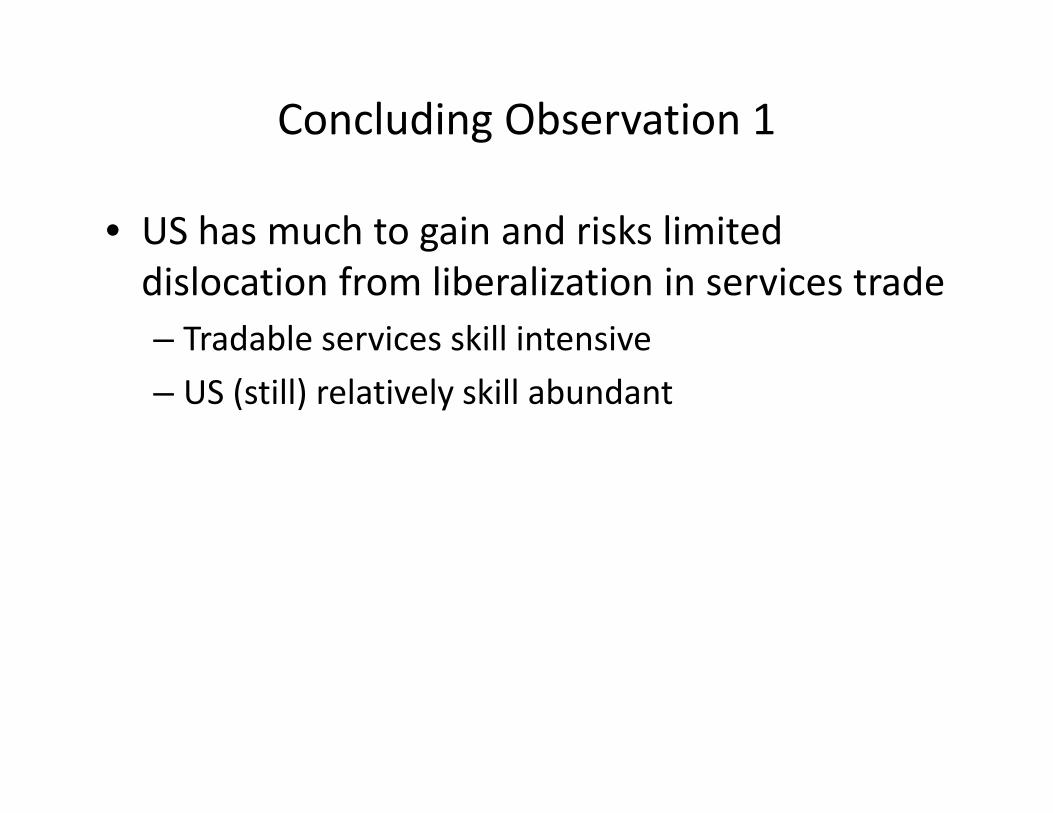
Concluding Observation 1
• US has much to gain and risks limited dislocation from liberalization in services trade– Tradable services skill intensive
– US (still) relatively skill abundant
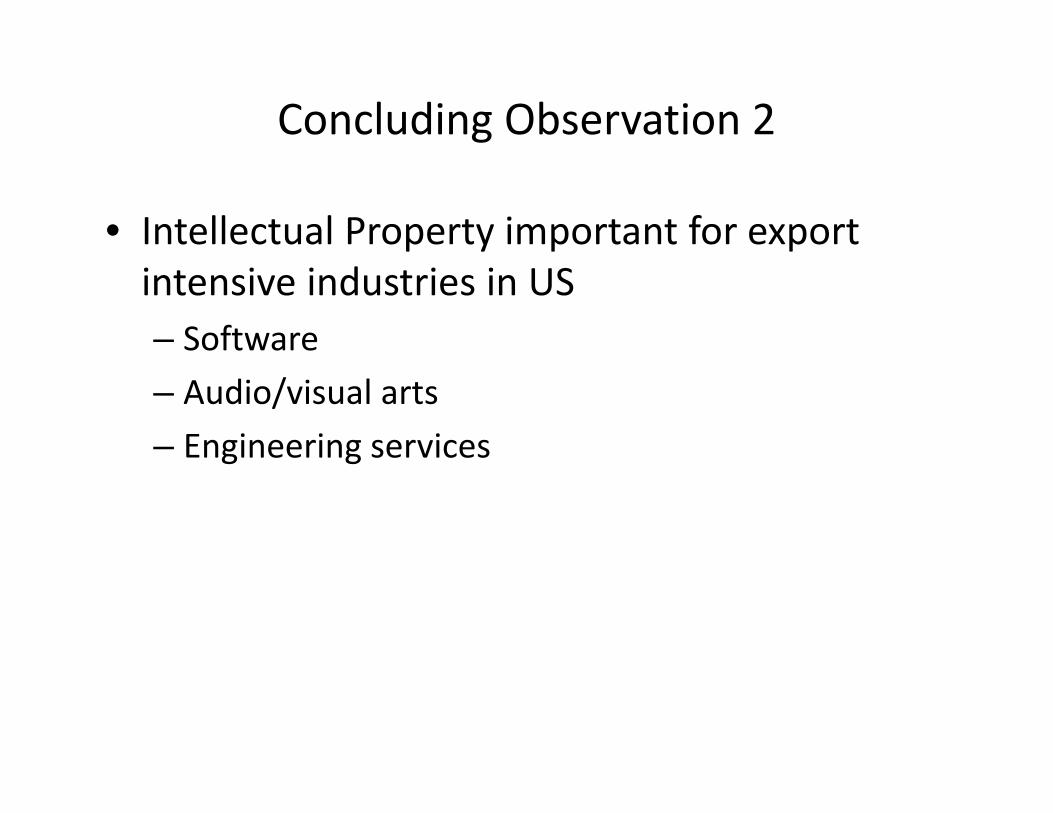
Concluding Observation 2
• Intellectual Property important for export intensive industries in US– Software
– Audio/visual arts
– Engineering servicesg g

Concluding Observation 3
• Large and fast growing economies impose high barriers to trade in services

Concluding Observation 4
• Huge infrastructure boom coming – big opportunity for tradable service firms/workers– $40 Trillion, most outside of US,
– Architecture, financing, engineering services, water treatment, project management services…
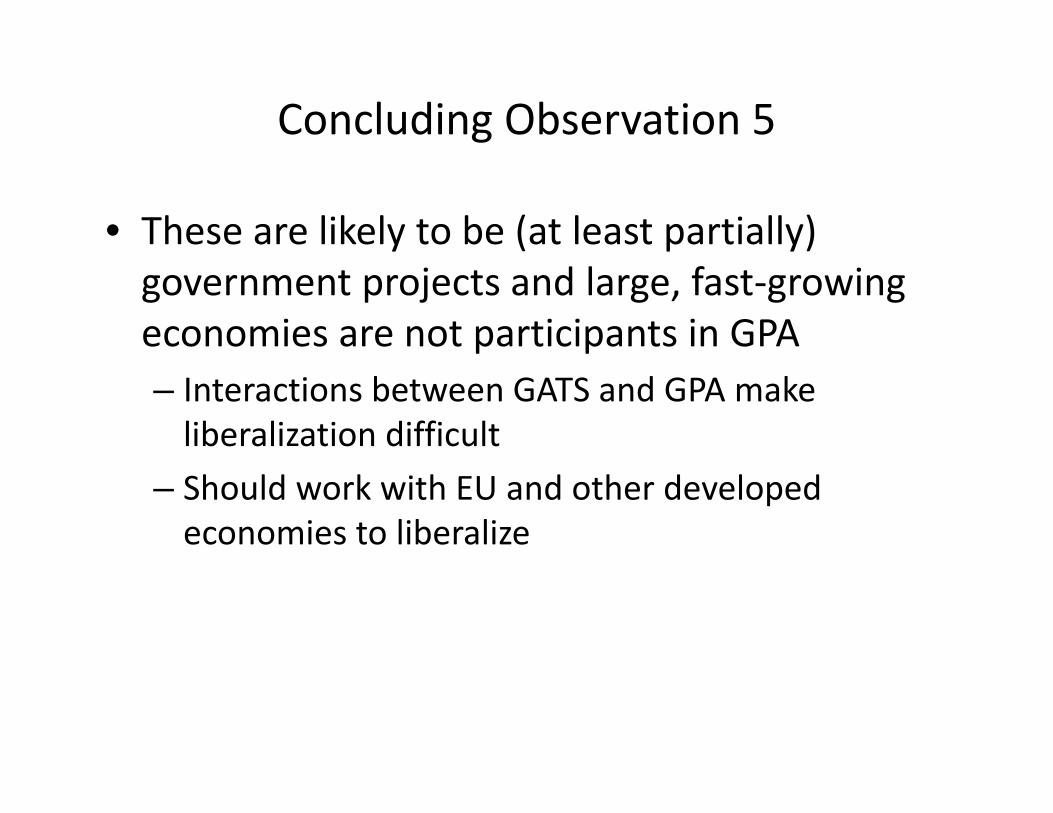
Concluding Observation 5
• These are likely to be (at least partially) government projects and large, fast‐growing economies are not participants in GPA– Interactions between GATS and GPA make liberalization difficult
– Should work with EU and other developed economies to liberalize
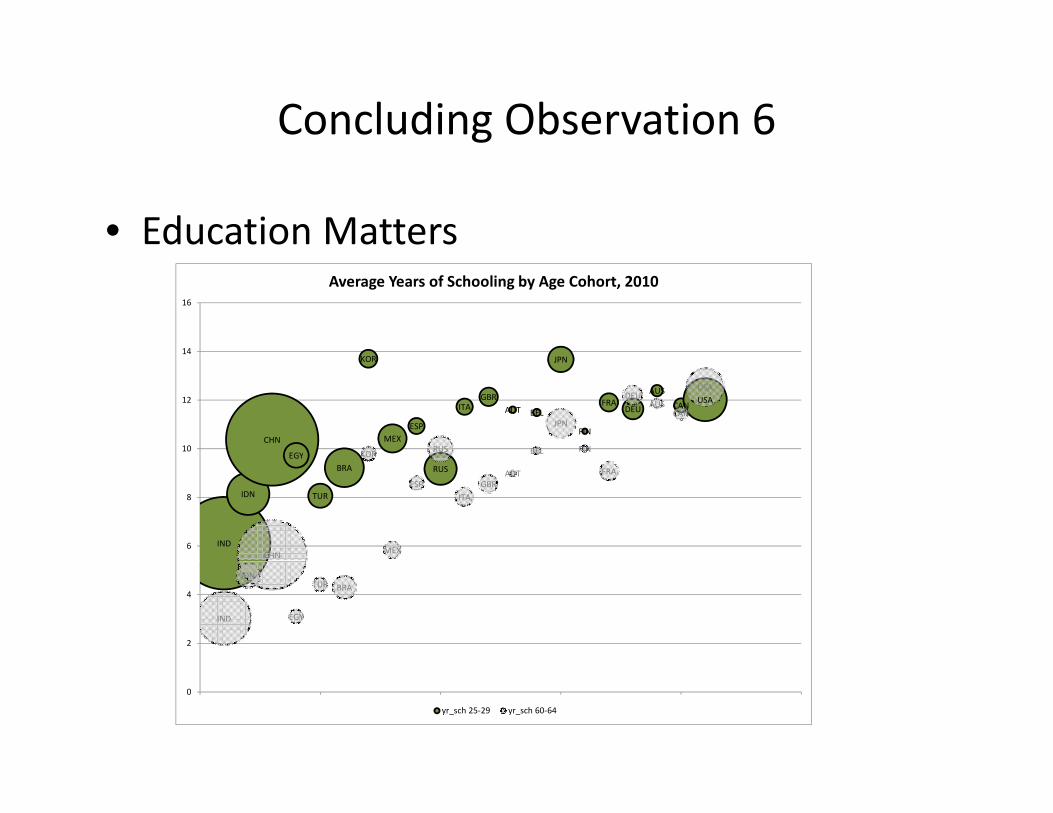
Concluding Observation 6
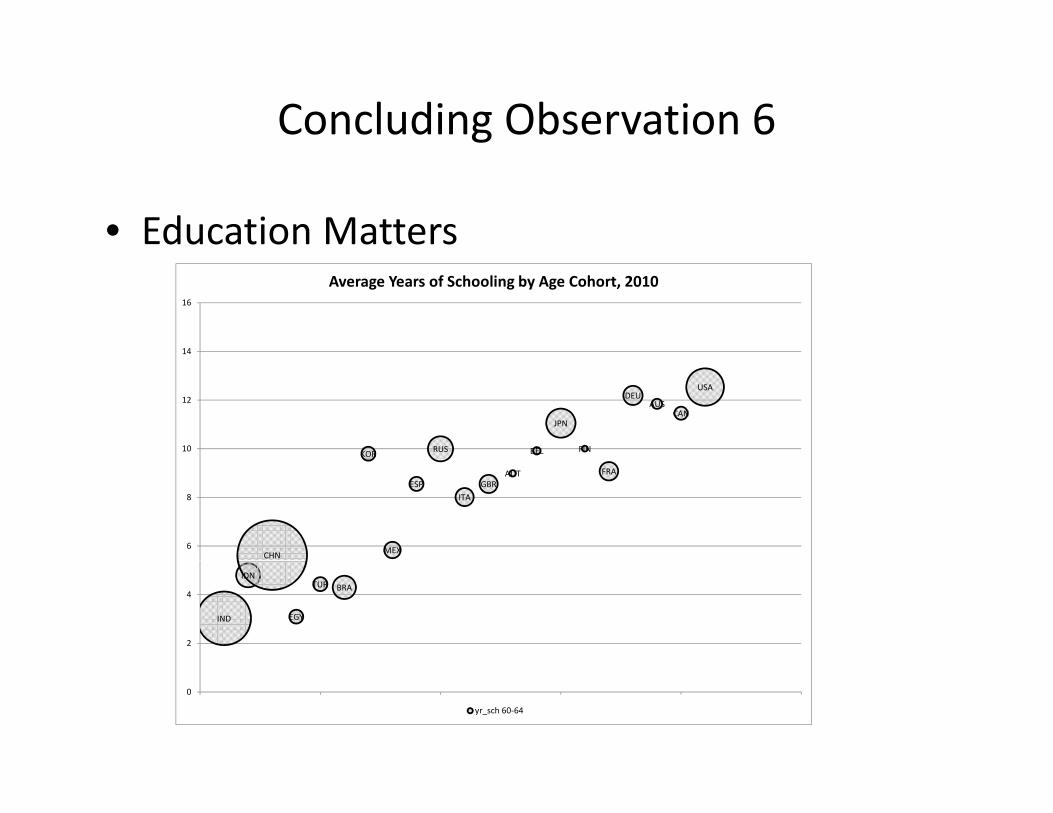
• Education Matters
14
16
Average Years of Schooling by Age Cohort, 2010
KOR RUS BEL
JPN
FIN
DEUAUS
CAN
USA
10
12
CHN MEX
ESPITA
GBRAUT FRA
6
8
IND
IDN
EGY
TUR BRA
2
4
0
yr_sch 60‐64
Concluding Observation 6
• Education Matters
14
16
Average Years of Schooling by Age Cohort, 2010
CHN
EGY
KOR
MEXESP
ITAGBR
AUT BEL
JPN
FIN
FRADEU
AUS
CANUSA
KOR RUS BEL
JPN
FIN
DEUAUS
CAN
USA
10
12
IND
IDN
EGY
TUR
BRA RUS
CHN MEX
ESPITA
GBRAUT FRA
6
8
IND
IDN
EGY
TUR BRA
2
4
0
yr_sch 25‐29 yr_sch 60‐64

What is the potential?
• Thought experiment:– Increase exports/sales ratio in tradable business services to same level as manufacturing
– Many reasons to question this number, but a place to start…
• “Back‐of‐the‐envelope” numbers:Additional Service Exports Jobsp
Empl Sales Exports Exports/ (.156 * $5T) (export sales/(sales/emp))(million) (trillion) (billion) Sales (trillion) (million)
Tradable Manufacturing 12 5 1000 0.200
T d bl B i S i 20 5 220 0 044 0 78 3 12Tradable Business Services 20 5 220 0.044 0.78 3.12

Policy Recommendations:
• The United States, in cooperation with other developed countries, should:should:
• push aggressively to open the large and fast‐growing markets to service trade.
• continue to push for improved intellectual property p p p p yprotections internationally.
• push for further liberalization of business services in the WTO. • strongly encourage large and fast‐growing countries to sign on
to the WTO government procurement agreement.
• The US should make access to a good primary, secondary, and t d d ti hi h ti l i itpostsecondary education a high national priority.
• The US should strengthen the social safety net for workers dislocated by trade and technological advancement.
• The US should collect better data on the service sector• The US should collect better data on the service sector.

Thank YouThank You