Presentation by: Phil Walsack - Missouri Department of ... Walsack Municipal Infrastructure...
77
Presentation by: Phil Walsack
Transcript of Presentation by: Phil Walsack - Missouri Department of ... Walsack Municipal Infrastructure...
Presentation by:
Phil Walsack
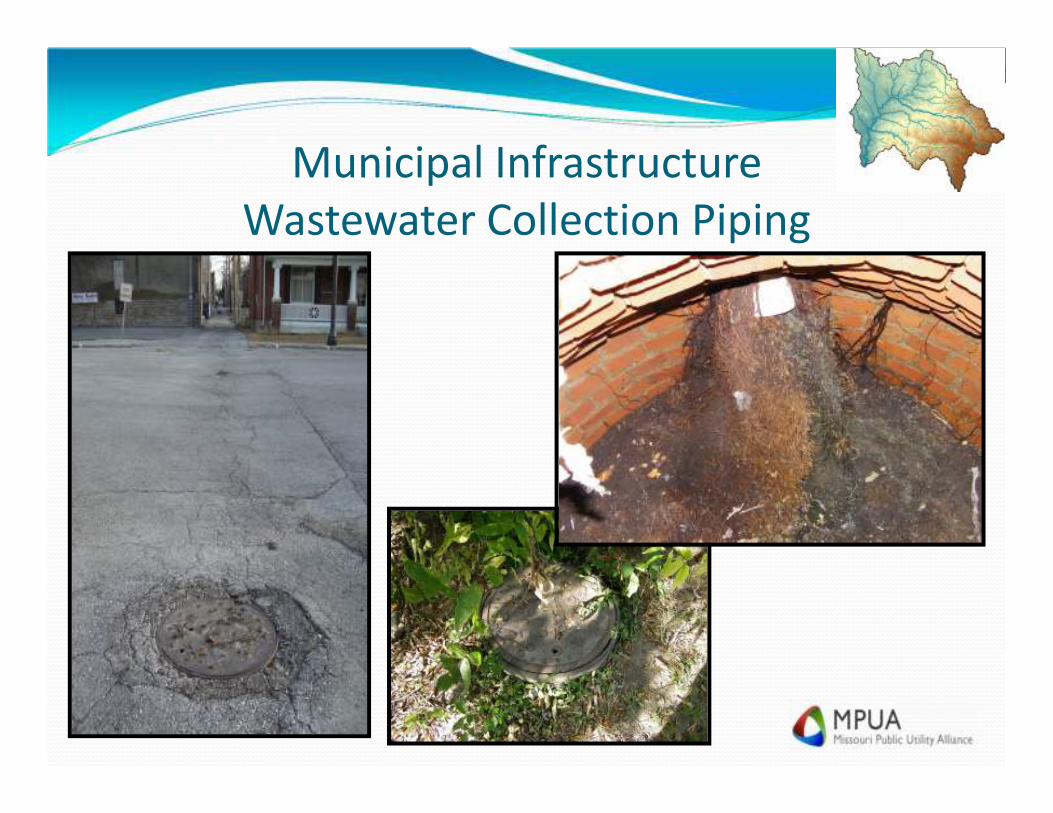
Municipal Infrastructure
Wastewater Collection Piping
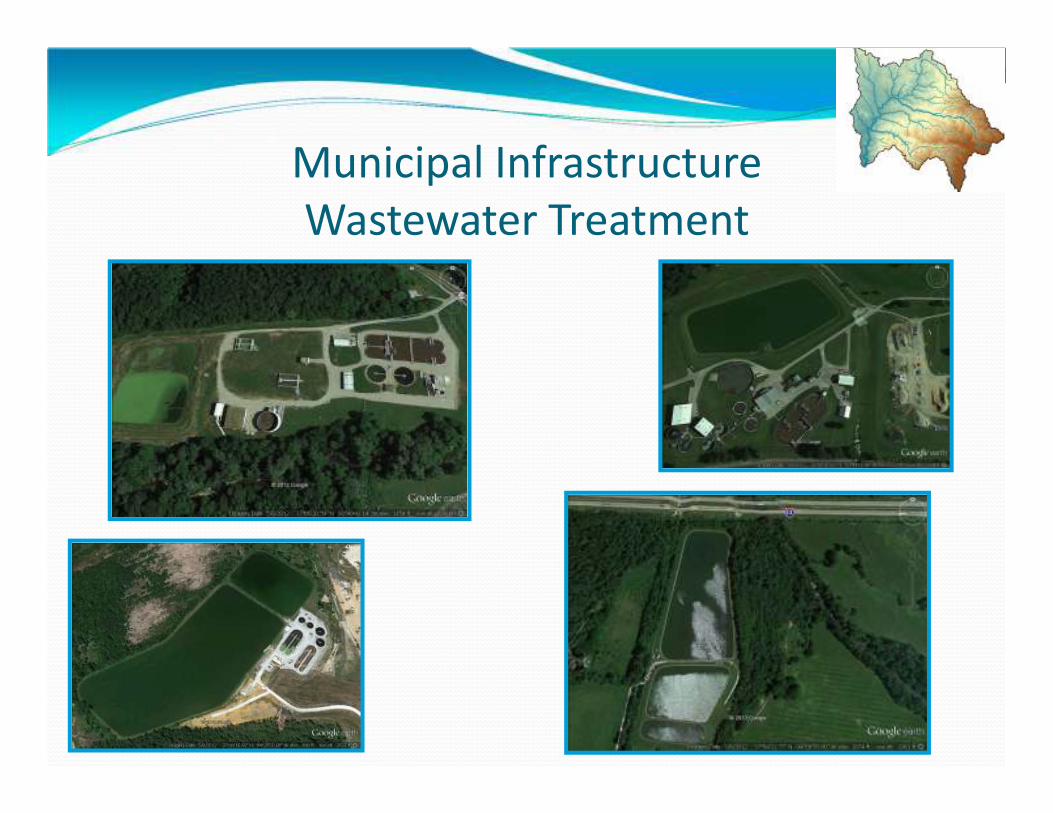
Municipal Infrastructure
Wastewater Treatment

Municipal Infrastructure
Water Treatment
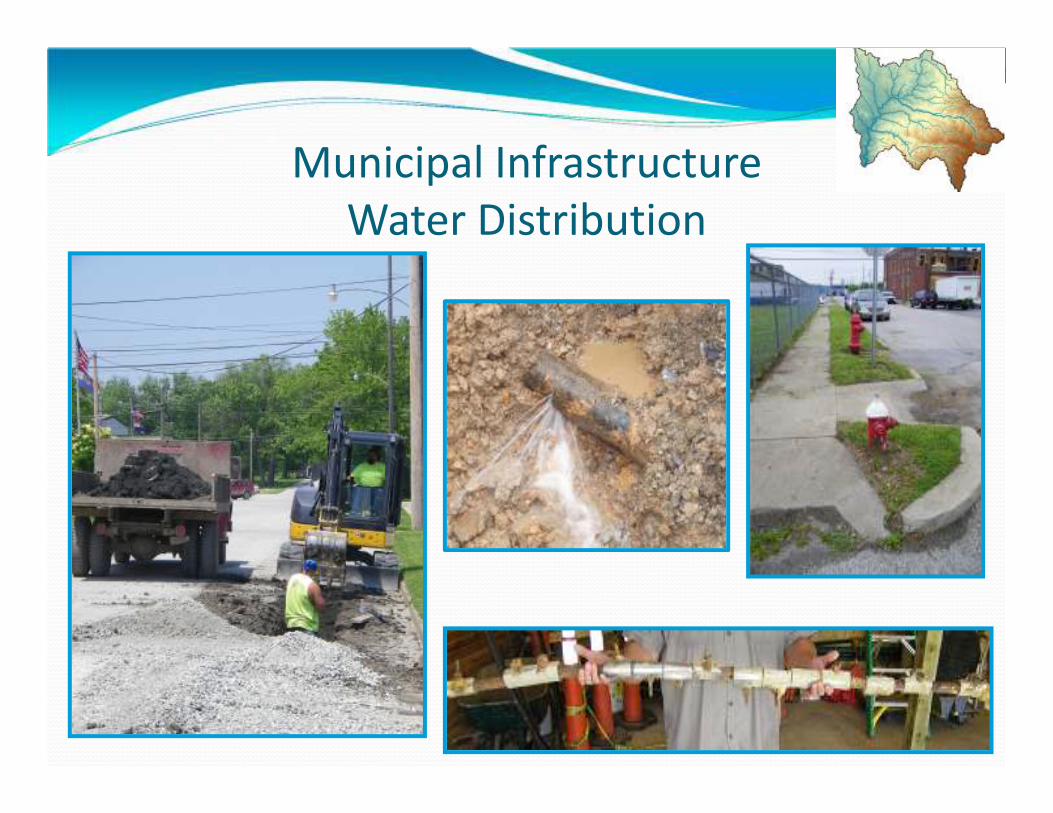
Municipal Infrastructure
Water Distribution

A look through municipally-colored glasses
� Urban Dwellers & Demographics
� Utility Rates
� A Forward-looking View of Municipal Infrastructure
in the Spring River Watershed
A look through municipally-colored glasses
� Urban Dwellers & Demographics
� Utility Rates
� A Forward-looking View of Municipal Infrastructure in the
Spring River Watershed

Missouri
� 68,886 = Land area in square miles
� 5,998,900 = Population (2010 U.S. Census)
� 970 = Number of communities
� 654 = Number of cities
� 623 = Number of communities with less than 1,000 people
� 4th = U.S. rank of number of smaller communities
� (less than 1,000 people)
� 13 = Number of municipalities greater than 50,000 people
� $45,229 = State’s median household income
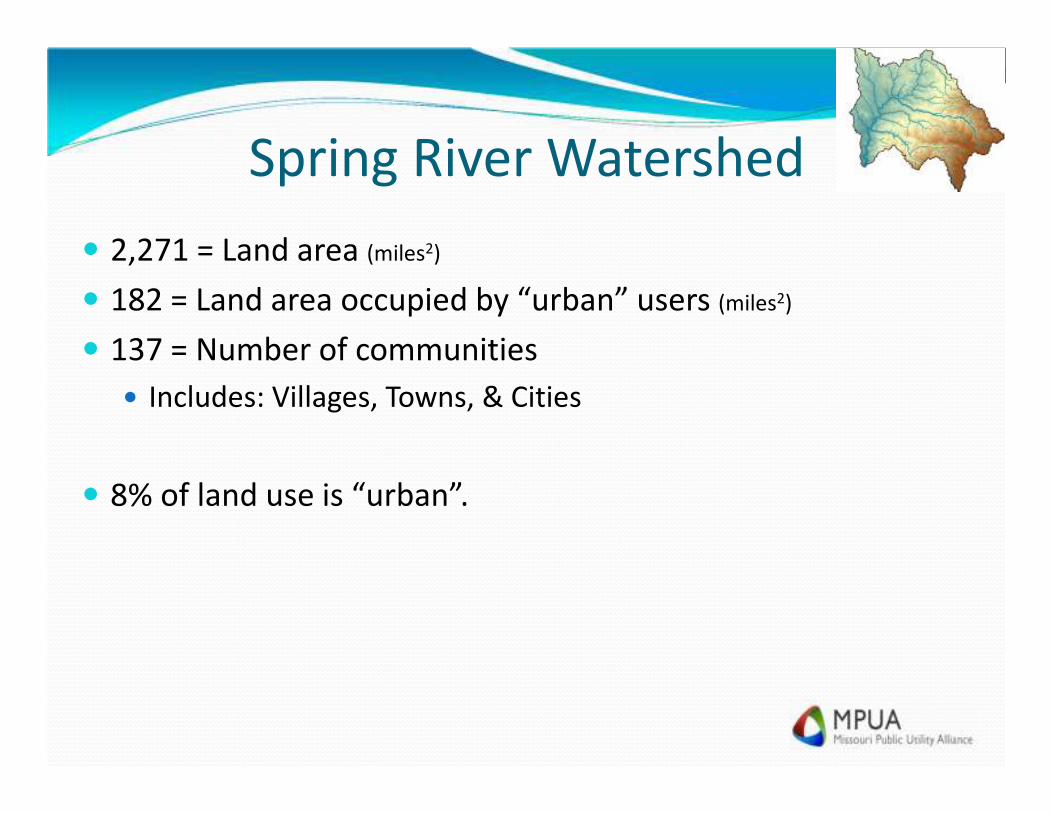
Spring River Watershed
� 2,271 = Land area (miles2)
� 182 = Land area occupied by “urban” users (miles2)
� 137 = Number of communities
� Includes: Villages, Towns, & Cities
� 8% of land use is “urban”.
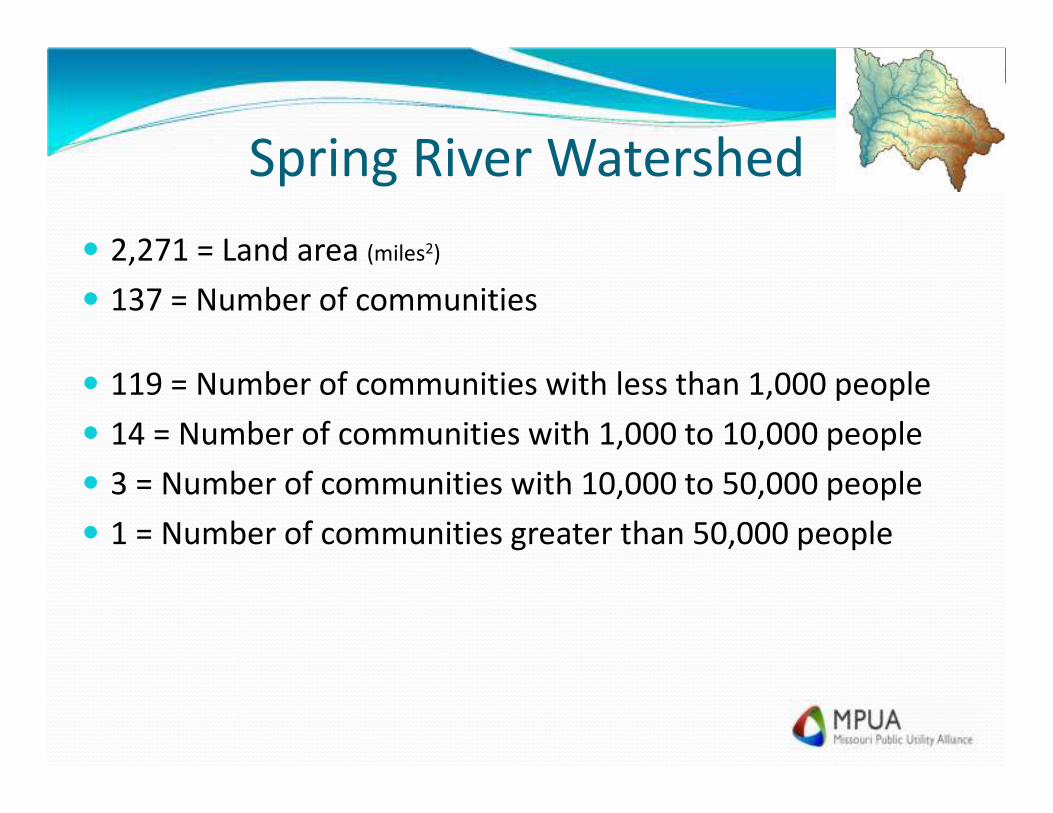
Spring River Watershed
� 2,271 = Land area (miles2)
� 137 = Number of communities
� 119 = Number of communities with less than 1,000 people
� 14 = Number of communities with 1,000 to 10,000 people
� 3 = Number of communities with 10,000 to 50,000 people
� 1 = Number of communities greater than 50,000 people

Spring River Watershed
� 2,271 = Land area (miles2)
� 145,600 = Population (2010 U.S. Census)
� 118 = Land area occupied by “city” dwellers (miles2)
� 5.2% = Land area occupied by “city” dwellers
� 56 = Number of cities
� 38 = Number of cities with less than 1,000 people
� 14 = Number of cities with 1,000 to 10,000 people
� 3 = Number of cities with 10,000 to 50,000 people
� 1 = Number of cities greater than 50,000 people
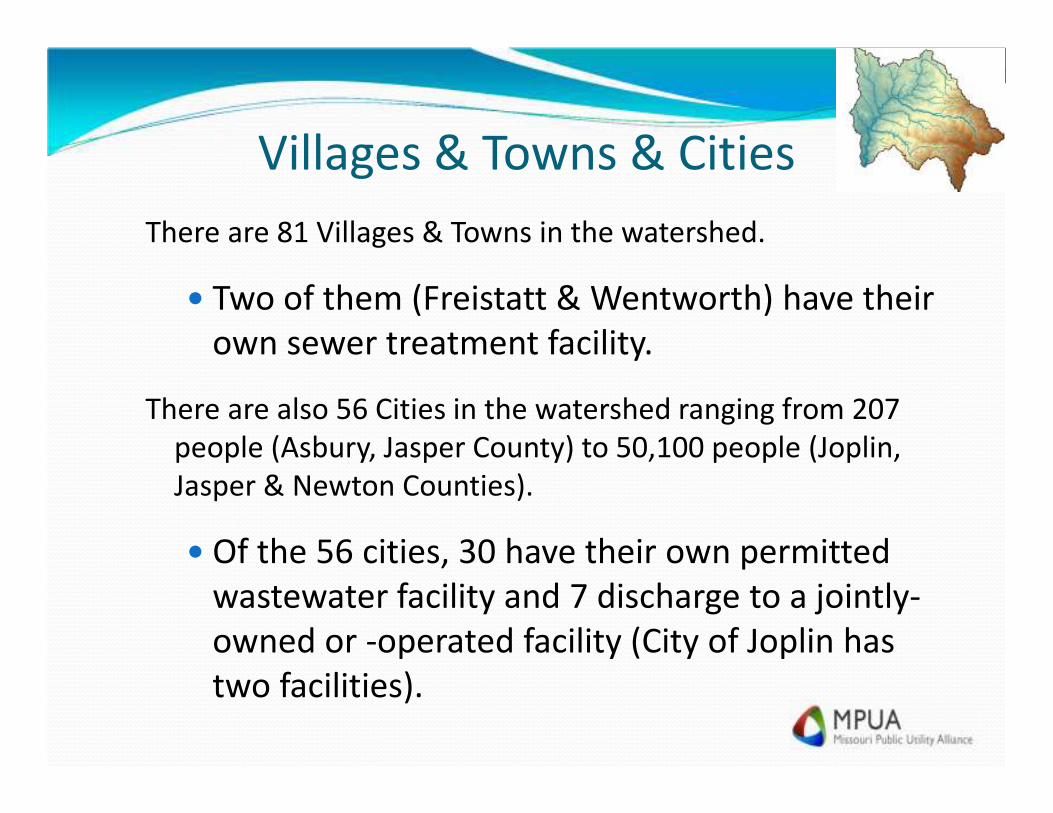
Villages & Towns & Cities
There are 81 Villages & Towns in the watershed.
� Two of them (Freistatt & Wentworth) have their
own sewer treatment facility.
There are also 56 Cities in the watershed ranging from 207
people (Asbury, Jasper County) to 50,100 people (Joplin,
Jasper & Newton Counties).
� Of the 56 cities, 30 have their own permitted
wastewater facility and 7 discharge to a jointly-
owned or -operated facility (City of Joplin has
two facilities).

A look through municipally-colored glasses
� Urban Dwellers & Demographics
� Utility Rates
� A Forward-looking View of Municipal Infrastructure in the
Spring River Watershed
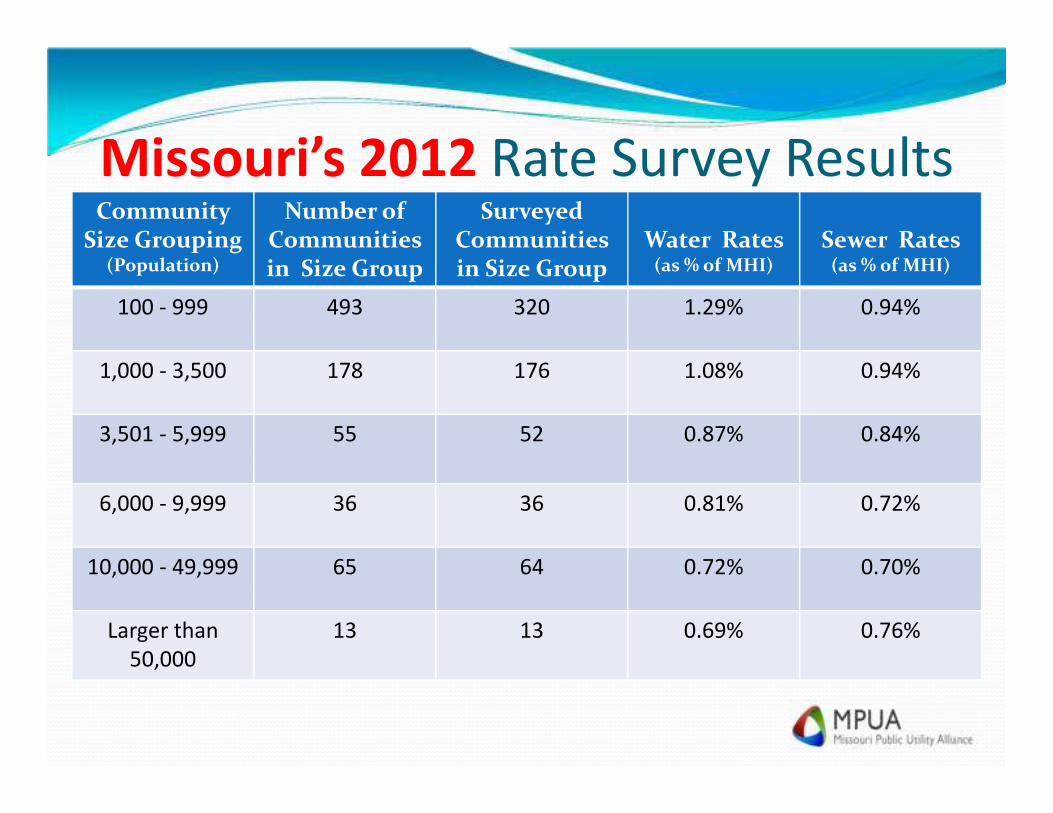
Missouri’s 2012 Rate Survey ResultsCommunity
Size Grouping(Population)
Number of Communities in Size Group
Surveyed Communities in Size Group
Water Rates (as % of MHI)
Sewer Rates (as % of MHI)
100 - 999 493 320 1.29% 0.94%
1,000 - 3,500 178 176 1.08% 0.94%
3,501 - 5,999 55 52 0.87% 0.84%
6,000 - 9,999 36 36 0.81% 0.72%
10,000 - 49,999 65 64 0.72% 0.70%
Larger than
50,000
13 13 0.69% 0.76%

Watershed’s 2012 Rate Survey ResultsCities Size Grouping(Population)
Number of Cities in Size
GroupSurveyed Cities in Size Group
Water Rates (as % of MHI)
Sewer Rates (as % of MHI)
100 - 999 17 17 0.96% 1.00%
1,000 - 3,500 9 9 0.89% 1.17%
3,501 - 5,999 2 2 0.67% 0.82%
6,000 - 9,999 3 3 0.70% 0.61%
10,000 - 49,999 3 3 0.94% 0.91%
Larger than
50,000
1 1 1.16% 0.73%

A Comparison of 2012 Rate Survey ResultsCities Size Grouping(Population)
Number of Cities in Size
GroupSurveyed Cities in Size Group
Water Rates (as % of MHI)
Sewer Rates (as % of MHI)
100 - 999 17 17 - 0.33% 0.06%
1,000 - 3,500 9 9 - 0.19% 0.23%
3,501 - 5,999 2 2 - 0.20% 0.02%
6,000 - 9,999 3 3 - 0.11% - 0.11%
10,000 - 49,999 3 3 0.22% 0.21%
Larger than
50,000
1 1 0.47% - 0.03%
A Forward-looking view of the Spring River
Watershed shows that we have
opportunities to gather and “mine”
municipal infrastructure data.
Here are just a few examples.

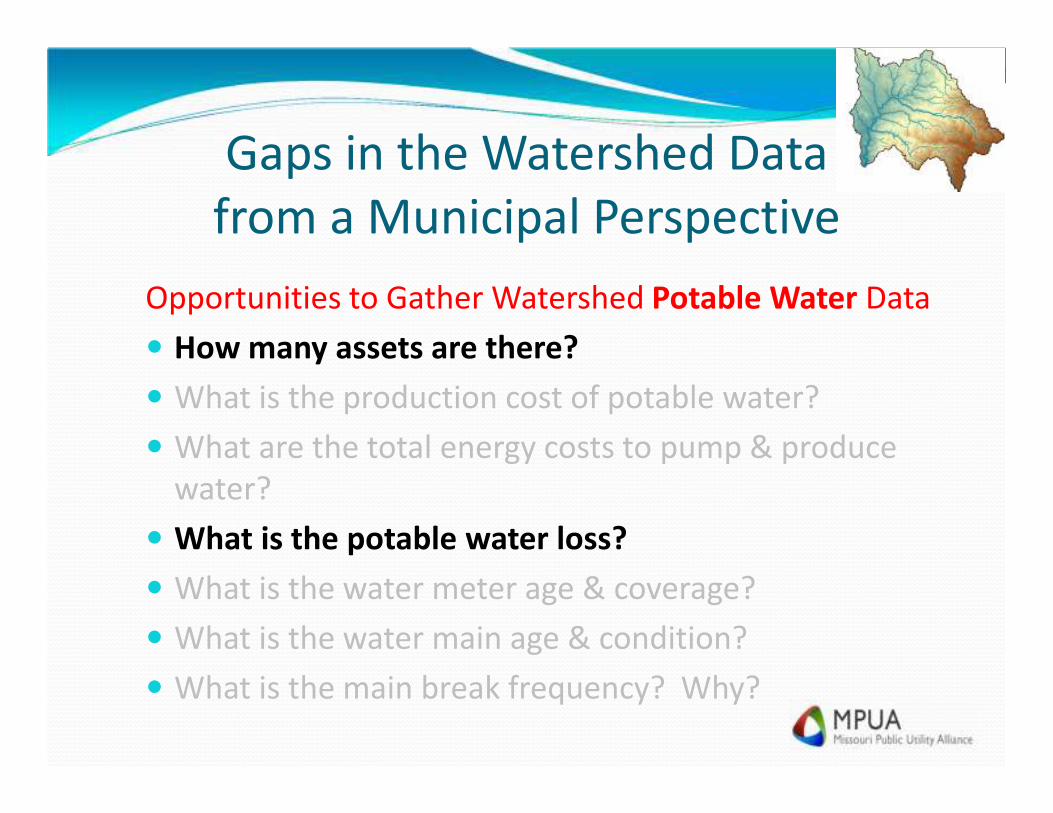
Gaps in the Watershed Data
from a Municipal Perspective
Opportunities to Gather Watershed Potable Water Data
� How many assets are there?
� What is the production cost of potable water?
� What are the total energy costs to pump & produce
water?
� What is the potable water loss?
� What is the water meter age & coverage?
� What is the water main age & condition?
� What is the main break frequency? Why?
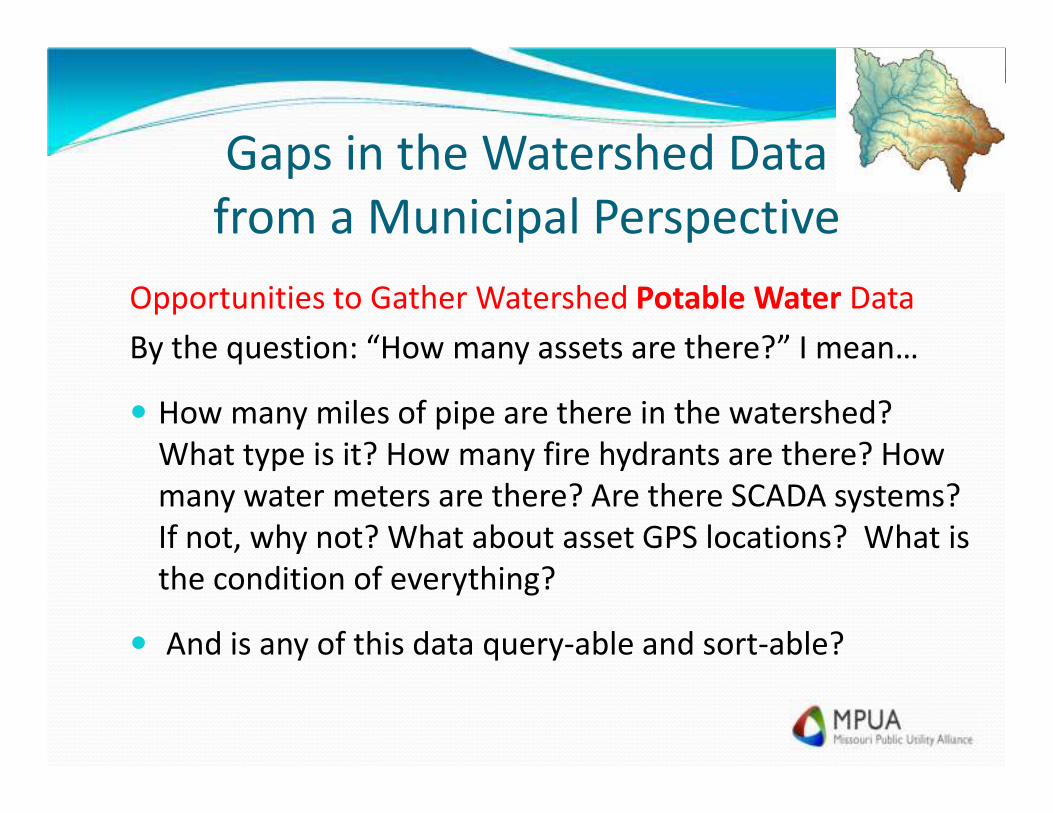
Gaps in the Watershed Data
from a Municipal Perspective
Opportunities to Gather Watershed Potable Water Data
By the question: “How many assets are there?” I mean…
� How many miles of pipe are there in the watershed?
What type is it? How many fire hydrants are there? How
many water meters are there? Are there SCADA systems?
If not, why not? What about asset GPS locations? What is
the condition of everything?
� And is any of this data query-able and sort-able?
Gaps in the Watershed Data
from a Municipal Perspective
Opportunities to Gather Watershed Potable Water Data
The question: “What is the potable water loss?” means…
� Does the utility compute water loss? If not, why not?
How many utilities compute water loss yearly or
monthly? What is the percentage? What are the utilities
doing to reduce the losses? How many have yearly leak
detection programs?
Gaps in the Watershed Data
from a Municipal Perspective
Opportunities to Gather Watershed Potable Water Data
The question: “What is the potable water loss?” means…
� The Tri-State Water Resources Coalition’s & U.S. Army
Corps of Engineers’ model uses a water loss that is
capped at 14%. Is this realistic?
� Should we be satisfied that less than 50% of the data
requests were honored?
� Should we be satisfied that 74% of the population served
by the entities returned the questionnaire?
Gaps in the Watershed Data
from a Municipal Perspective
Opportunities to Gather Watershed Potable Water Data
The question: “What is the potable water loss?” means…
� The Tri-State Water Resources Coalition’s & U.S. Army
Corps of Engineers’ model uses a water loss that is
capped at 14%. Is this realistic? Perhaps
� Should we be satisfied that less than 50% of the data
requests were honored? NO
� Should we be satisfied that 74% of the population served
by the entities returned the questionnaire? NO
Gaps in the Watershed Data
from a Municipal Perspective
Opportunities to Gather Watershed Wastewater Data
� What is the production cost of treated effluent?
� What are the total energy costs to treat?
� What is the inflow / infiltration values?
� What is the collection main age & condition?
� At what size of storm event do the utilities experience
sanitary sewer overflows or bypasses? Why?
As a boots-on-the-ground,
municipal utility guy,
those are the items I consider
when hear “Watershed
Management”…
But what do others think it
means?
Department of Natural Resources
Director Sara Parker Pauley

I Think What I Heard Was…
…the Director said: We fixed what we could
see in the 1970s and early 1980s, but now
we have more to fix.
“But Sara…Where are the burning rivers?
I don’t see them”.
Didn’t we fix everything already?
A Nation in Need
�In 2009, the American Society of Civil Engineers (ASCE) gave water and wastewater infrastructure a grade of “D-” nationwide.
�In 2013, they rank our infrastructure condition…up…to a “D”.
A Nation in Need
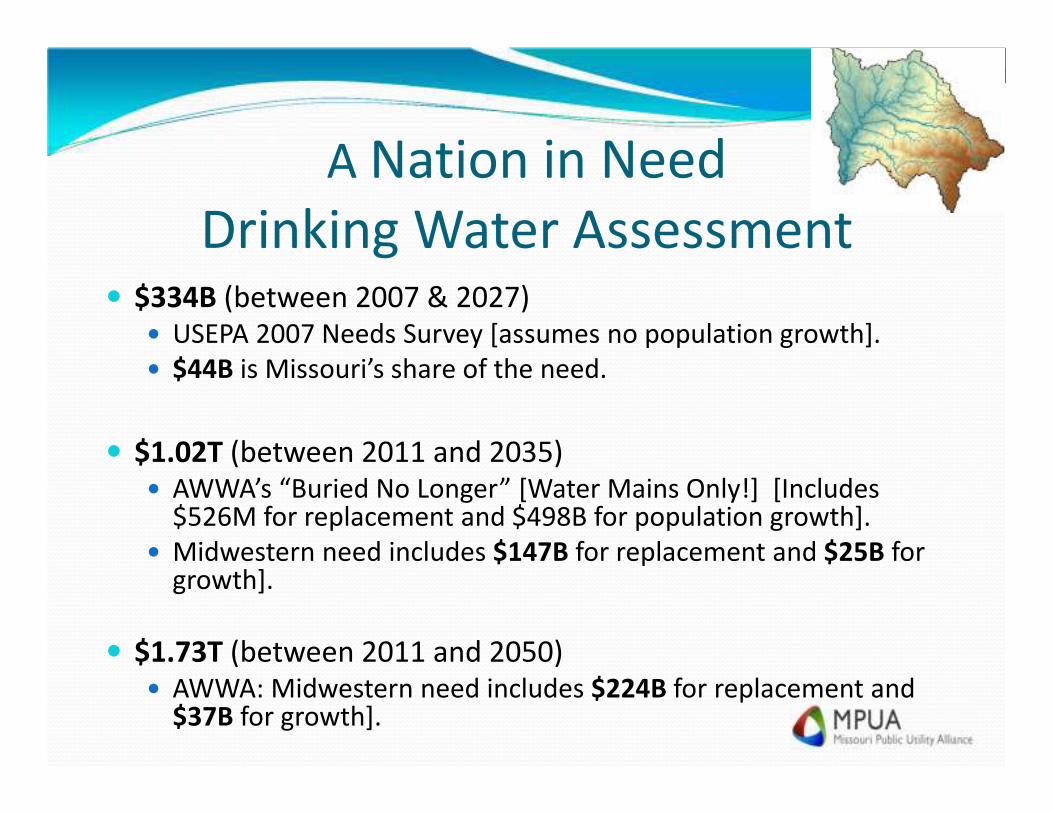
Drinking Water Assessment� $334B (between 2007 & 2027)
� USEPA 2007 Needs Survey [assumes no population growth].
� $44B is Missouri’s share of the need.
� $1.02T (between 2011 and 2035)� AWWA’s “Buried No Longer” [Water Mains Only!] [Includes
$526M for replacement and $498B for population growth].
� Midwestern need includes $147B for replacement and $25B for growth].
� $1.73T (between 2011 and 2050)� AWWA: Midwestern need includes $224B for replacement and
$37B for growth].
A Nation in Need
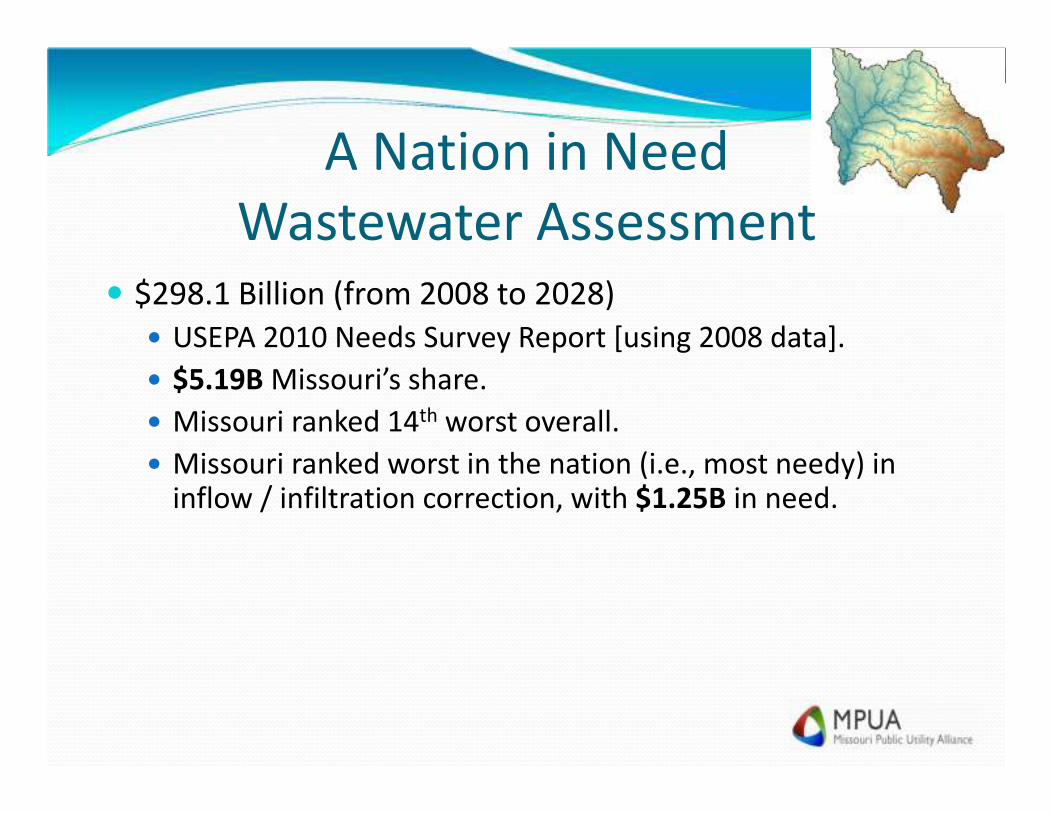
Wastewater Assessment� $298.1 Billion (from 2008 to 2028)
� USEPA 2010 Needs Survey Report [using 2008 data].
� $5.19B Missouri’s share.
� Missouri ranked 14th worst overall.
� Missouri ranked worst in the nation (i.e., most needy) in inflow / infiltration correction, with $1.25B in need.
Missouri Need
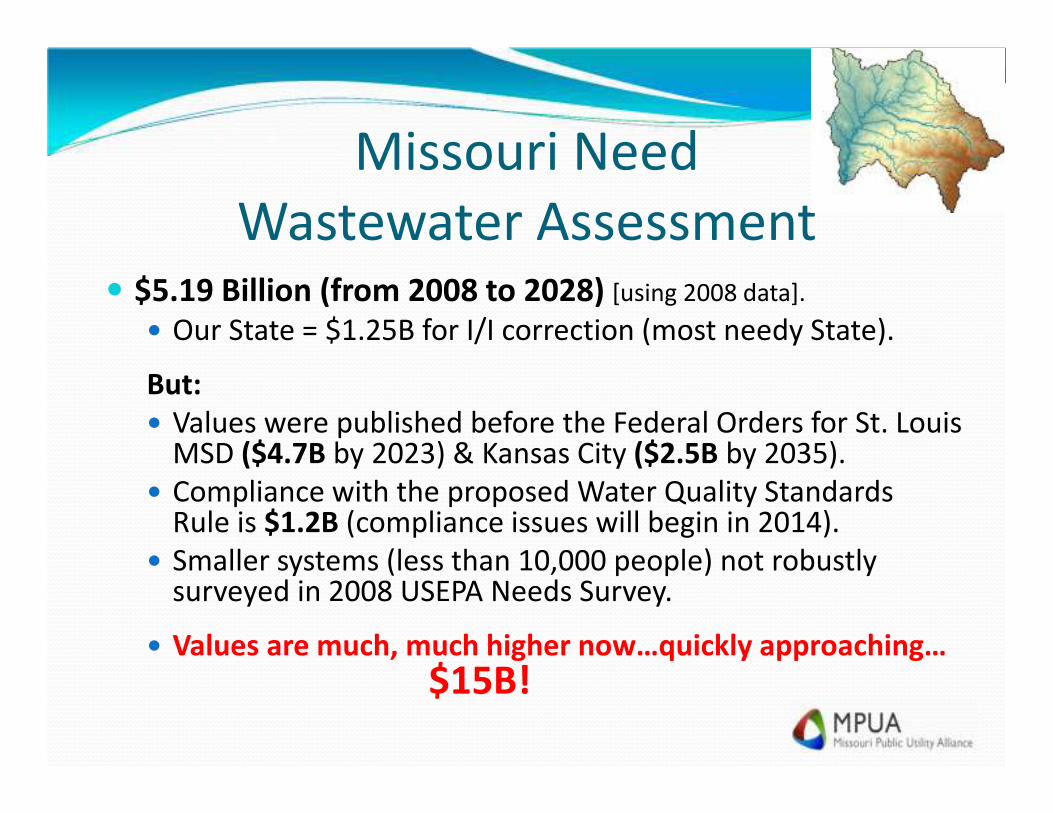
Wastewater Assessment� $5.19 Billion (from 2008 to 2028) [using 2008 data].
� Our State = $1.25B for I/I correction (most needy State).
But:
� Values were published before the Federal Orders for St. Louis MSD ($4.7B by 2023) & Kansas City ($2.5B by 2035).
� Compliance with the proposed Water Quality Standards Rule is $1.2B (compliance issues will begin in 2014).
� Smaller systems (less than 10,000 people) not robustly surveyed in 2008 USEPA Needs Survey.
� Values are much, much higher now…quickly approaching…
$15B!

Spring River Watershed
Wastewater Needs Assessment� In July 2011, Missouri Association of Councils of
Governments made a Statewide Assessment of Wastewater Needs (commonly referred to as the 604(b) Report) for smaller communities (5,000 people and fewer).
� The 604(b) Report states that:
� 7 of 14 communities with I/I issues did not have an plan.
� 3 of the 7 communities have piping in “poor” condition.
� 3 had Notices of Violation.
� 13 communities have schedules of compliance.
How are we (the municipalities) going to
resolve the “still have a long way to go”
issues that Director Pauley is talking about?
A Forward-looking view of Infrastructure
Improvement in the Spring River Watershed
(in Football terminology)
1) Don’t commit turnovers.
2) Run the ball.
3) Play great defense.
A Leanne Tippett-Mosby Slide
The Forward-looking View of Infrastructure
Improvements
1) Do not let “a failure” in one utility’s
infrastructure effect another.
2) Put the potable water back in the
distribution piping.
3) Keep the rainwater out of the sewer
collection piping.
A Return to Infrastructure Fundamentals
A Forward-looking View
1) Do not let “a failure” in one utility’s
infrastructure effect another.
2) Put the potable water back in the
distribution piping.
3) Keep the rainwater out of the sewer
collection piping.

A Solution for the Watershed
The next set of environmental problems are
not going to be solved by fixing only what
we can see.
The Spring River is not on fire.
Our Path Forward
Just add the letter “k” to what
Director Pauley said in her video.
Our Path Forward
Make the paradigm shift from
seeing to seeking.

A Solution for the Watershed
The next set of environmental problems are
ones that we will have to seek. After we
have found them, we will have to prioritize
which ones have the most detrimental
impact on the watershed, prioritize those,
and then fix the ones that show the most
benefit for the cost.

A Solution for the Watershed
The next set of environmental problems
move from place-to-place; are seldom
re-occurring, and can be illusive.
Without the willingness to seek them out,
they will go un-solved.
A Solution for the Watershed
How to seek.
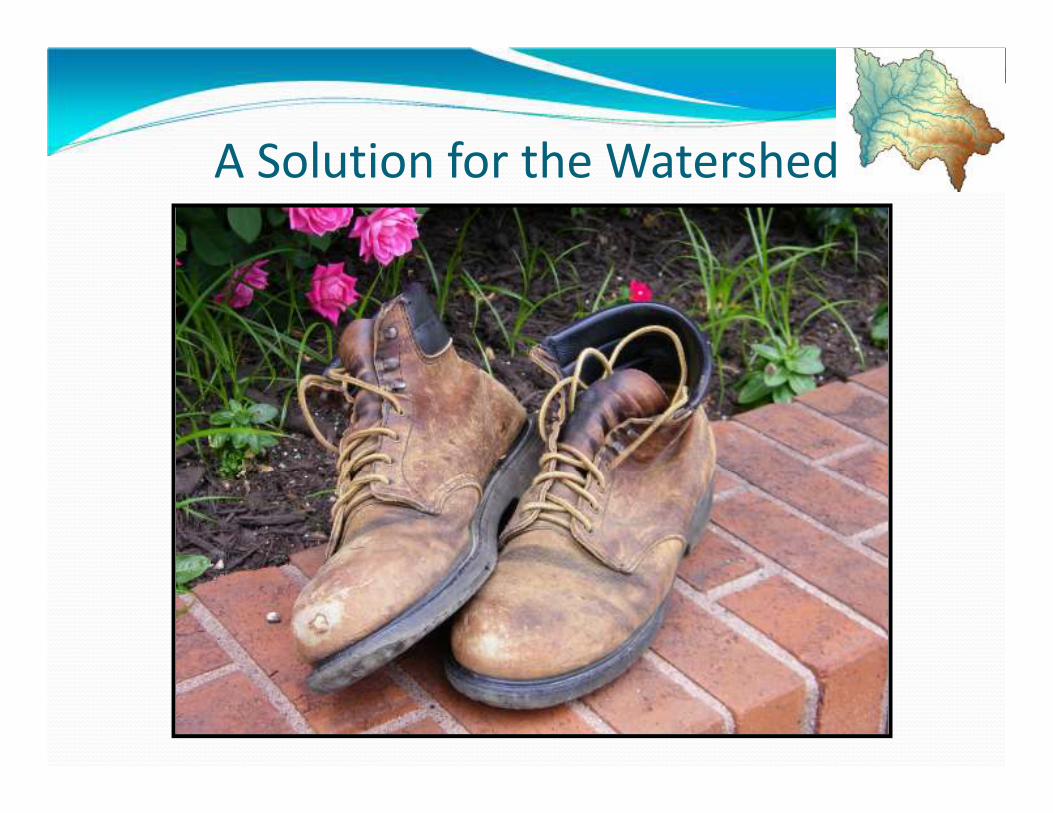
A Solution for the Watershed

A Solution for the Watershed
How to seek.
Oh…I noticed that you have so quickly
forgotten.
Remember its all about the Fundamentals!
A Return to Infrastructure Fundamentals
1) Do not let “a failure” in one utility’s
infrastructure effect another.
2) Put the potable water back in the
distribution piping.
3) Keep the rainwater out of the sewer
collection piping.
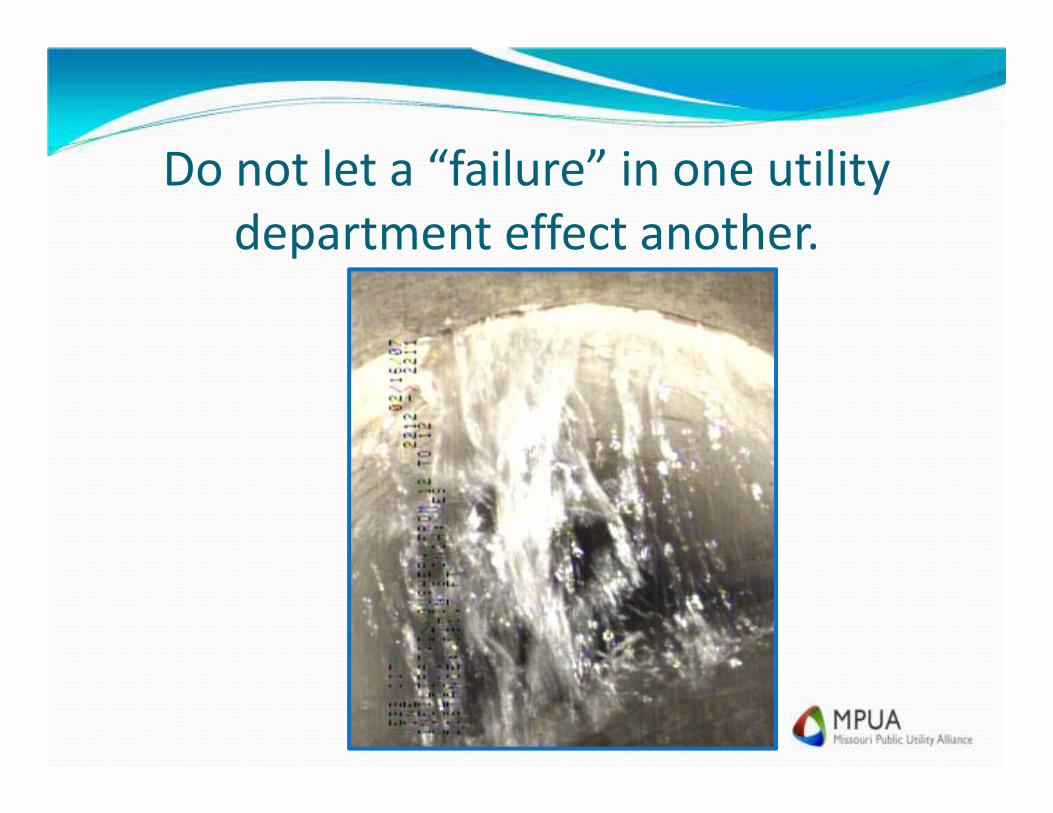
Do not let a “failure” in one utility
department effect another.
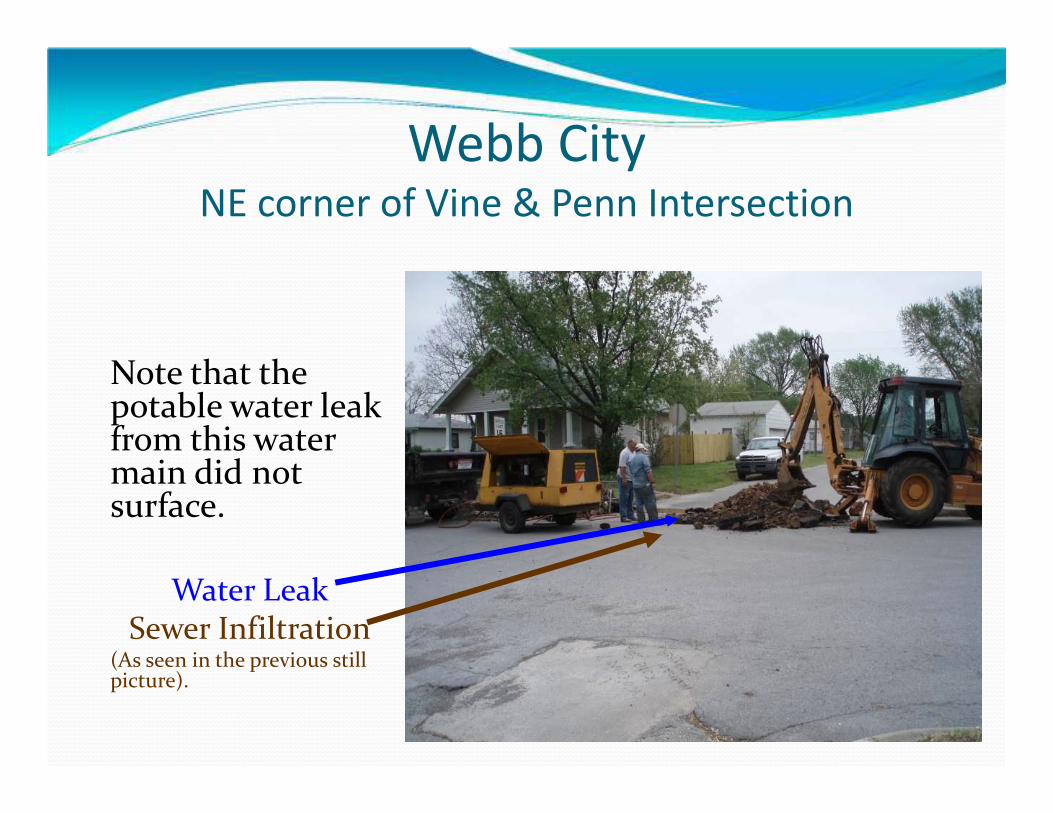
Webb CityNE corner of Vine & Penn Intersection
Note that the potable water leak from this water main did not surface.
Water LeakSewer Infiltration
(As seen in the previous still picture).
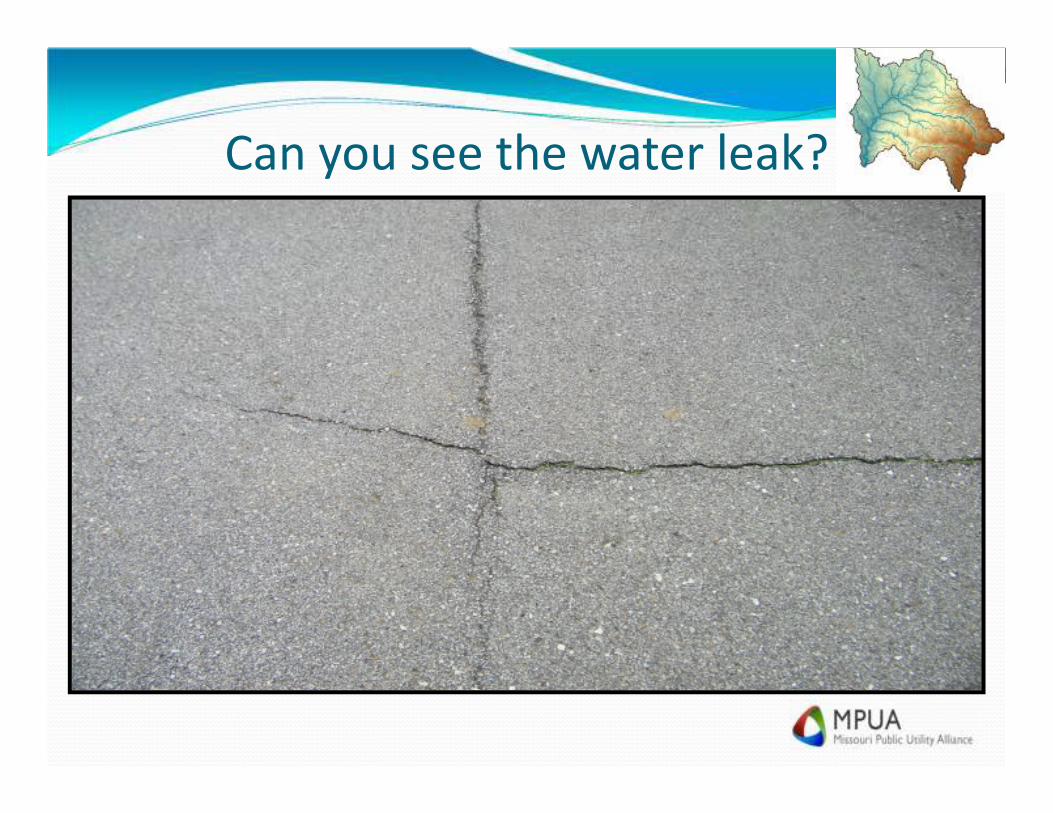
Can you see the water leak?
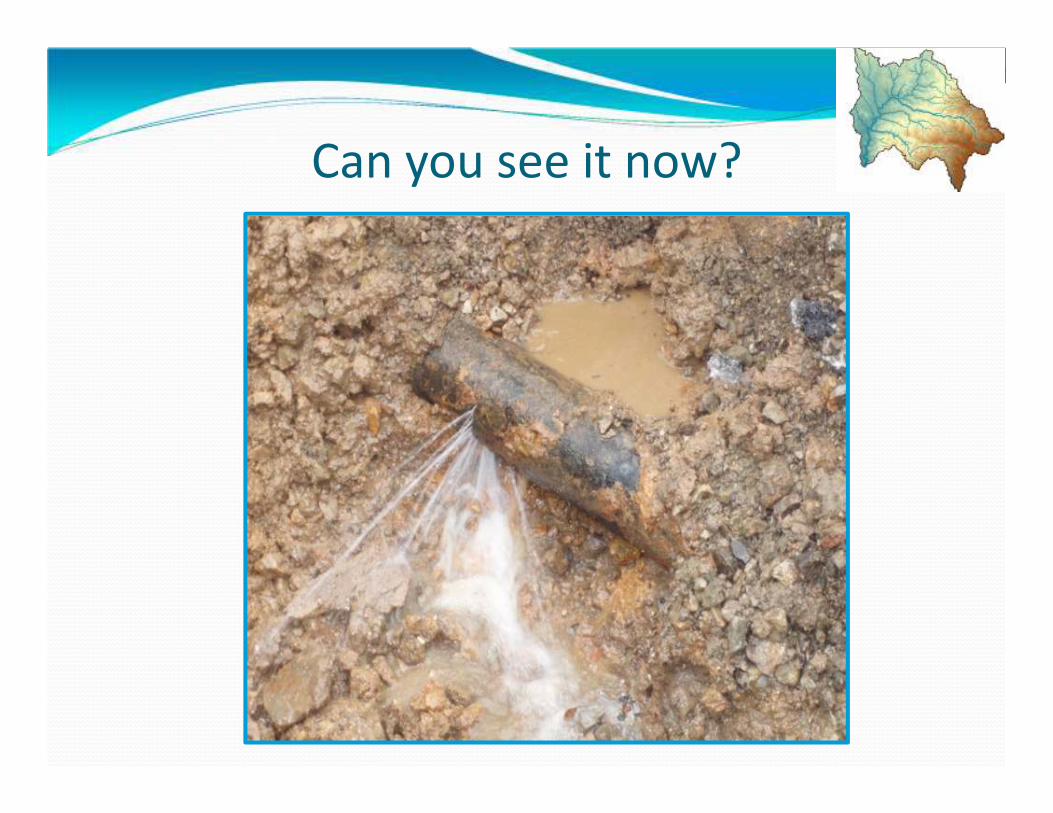
Can you see it now?

Active and Annual Seeking of Water Losses
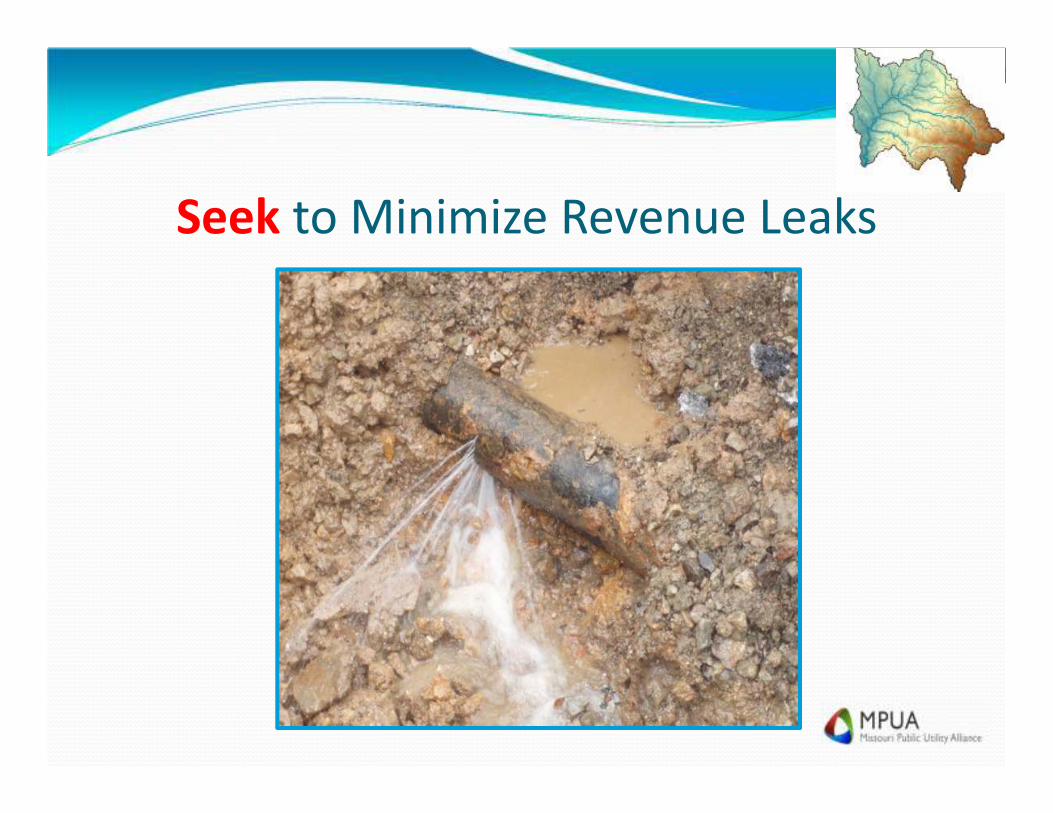
Seek to Minimize Revenue Leaks
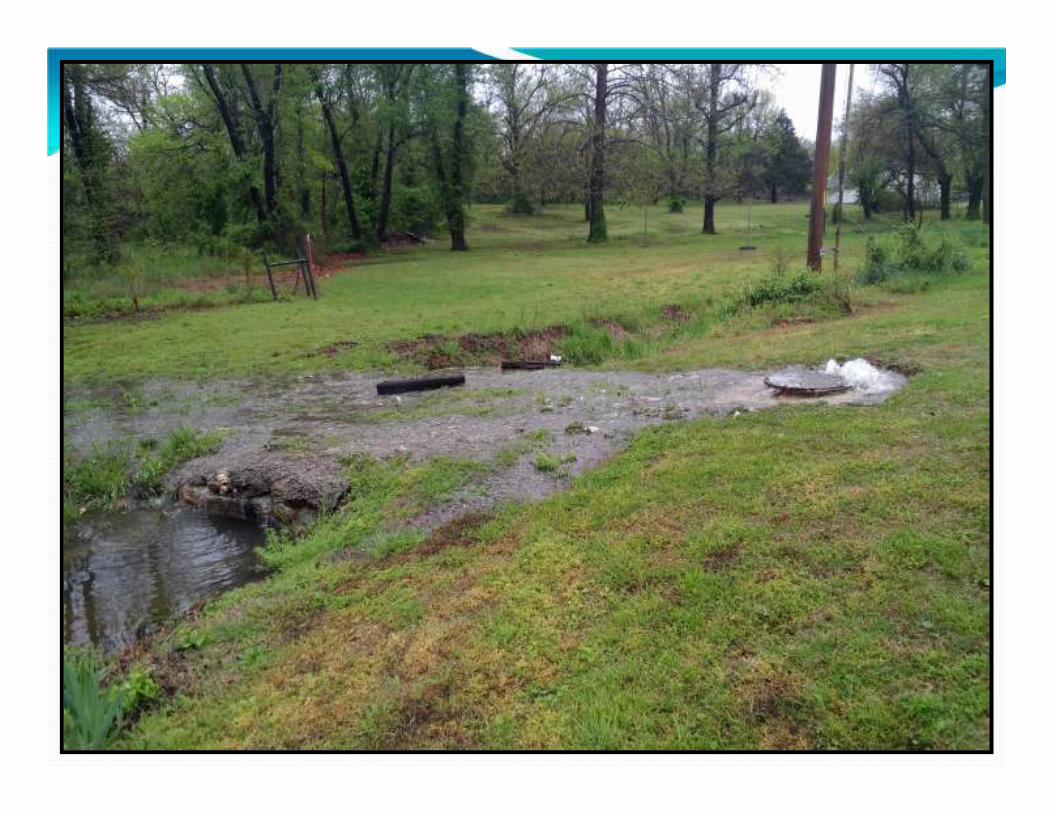
Let’s see a Sanitary Sewer Overflow (SSO)
in the Spring River Watershed
This SSO is the result of a 2.38 inch rainfall
event that occurred on Friday & Saturday,
April 26 & 27, 2013.
(viewed on 4/27/13)


Let’s see the aftermath of another Sanitary
Sewer Overflow (SSO) in the Spring River
Watershed
This SSO is the result of a 1.43 inch rainfall
event that occurred on Thursday,
April 18, 2013.
(viewed on Monday 4/22/13)
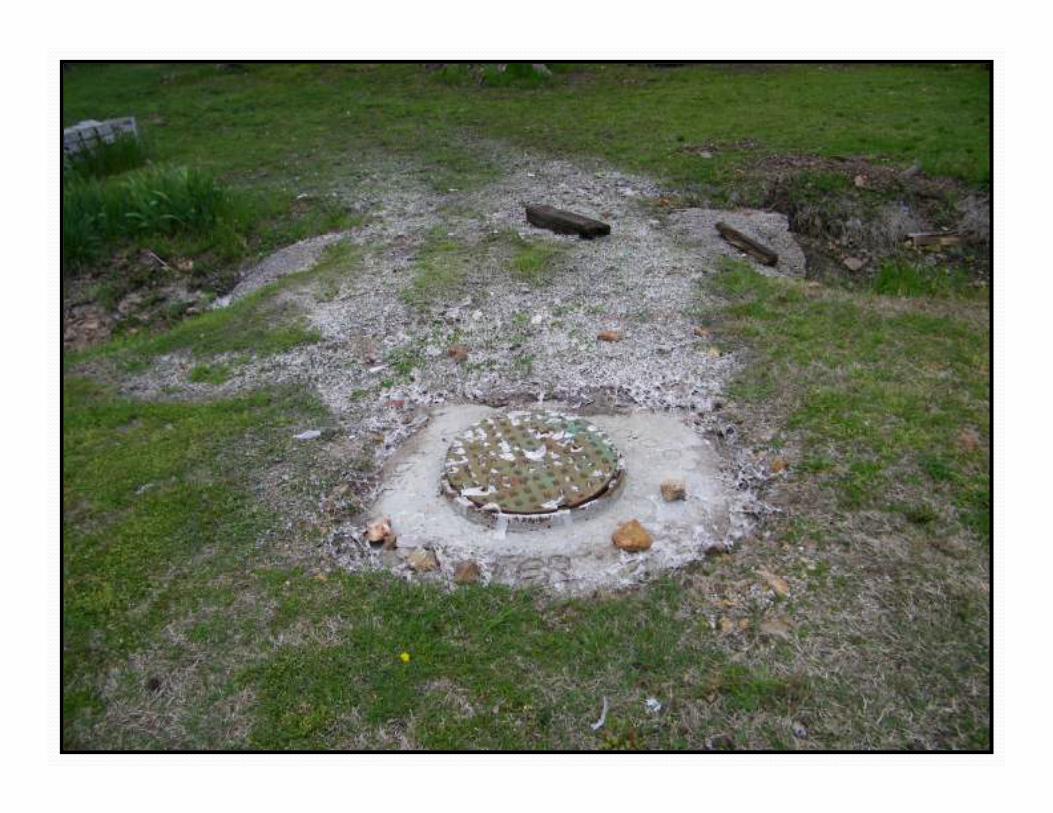
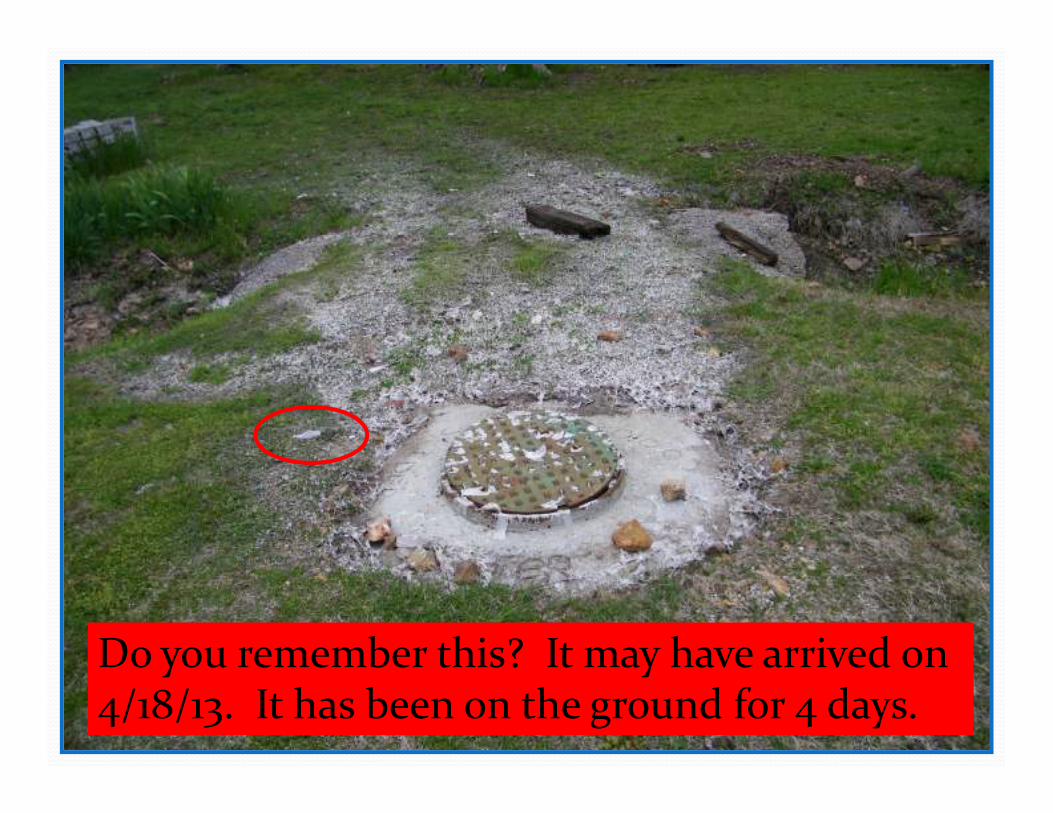
Do you remember this? It may have arrived on 4/18/13. It has been on the ground for 4 days.
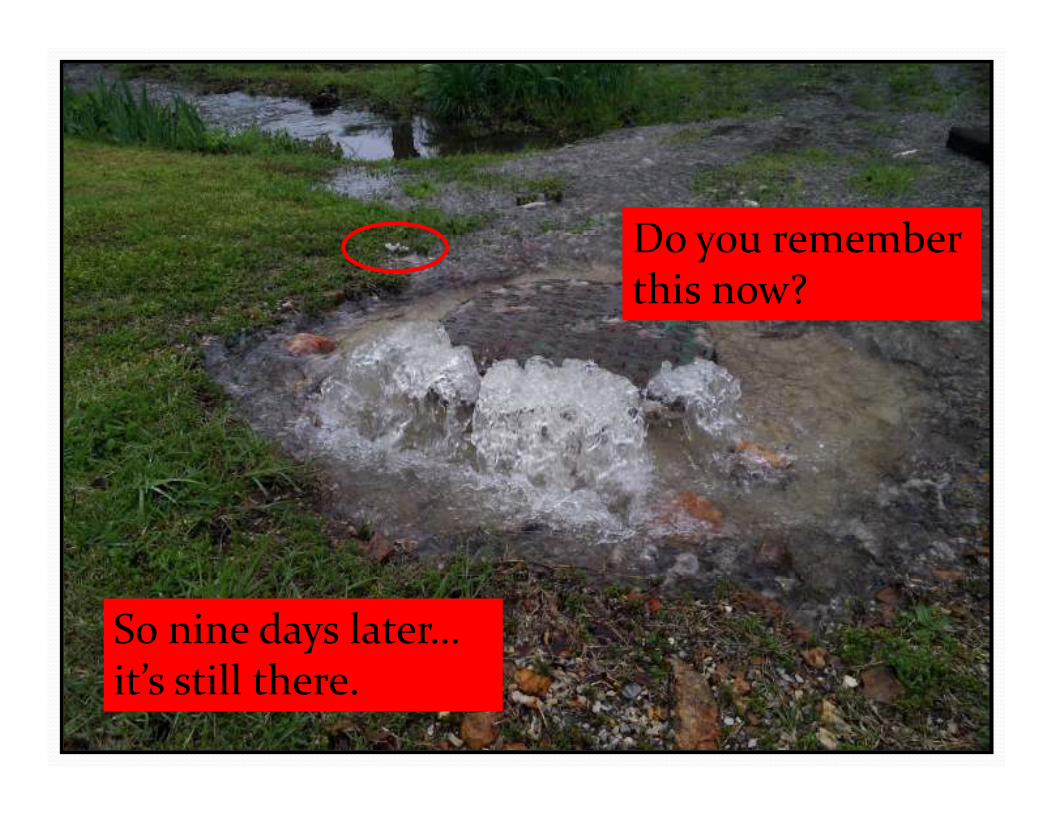
Do you remember this now?
So nine days later… it’s still there.
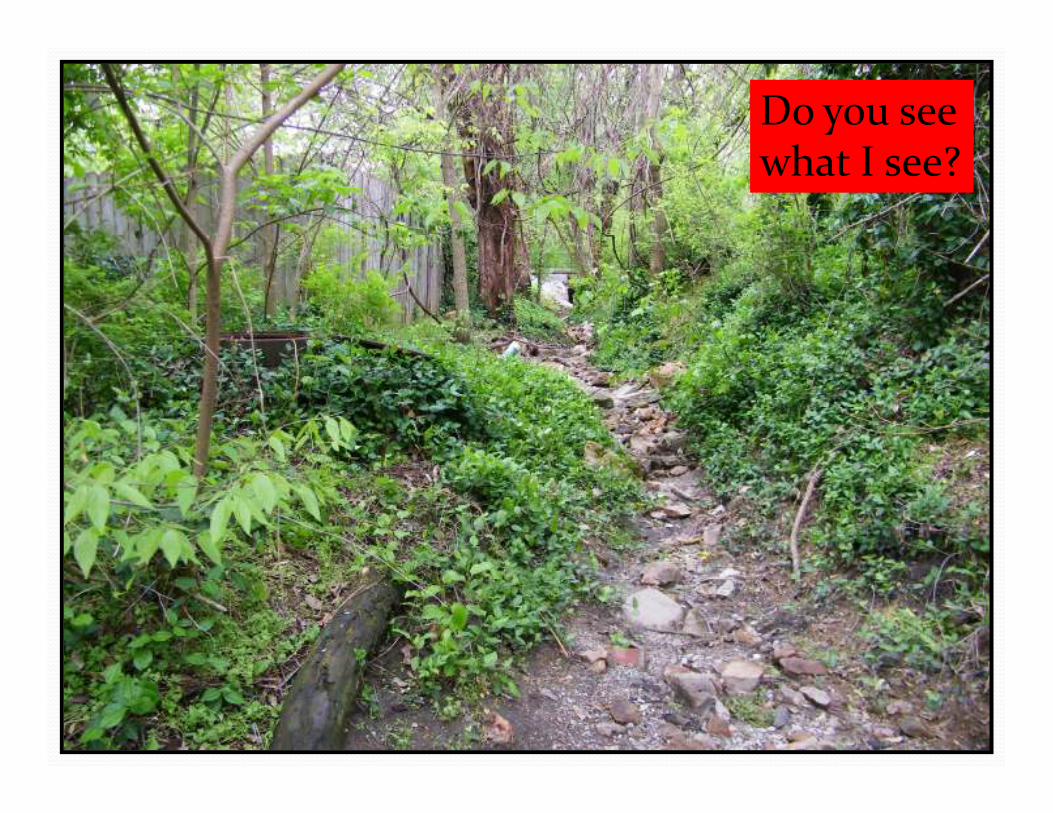
Do you see what I see?
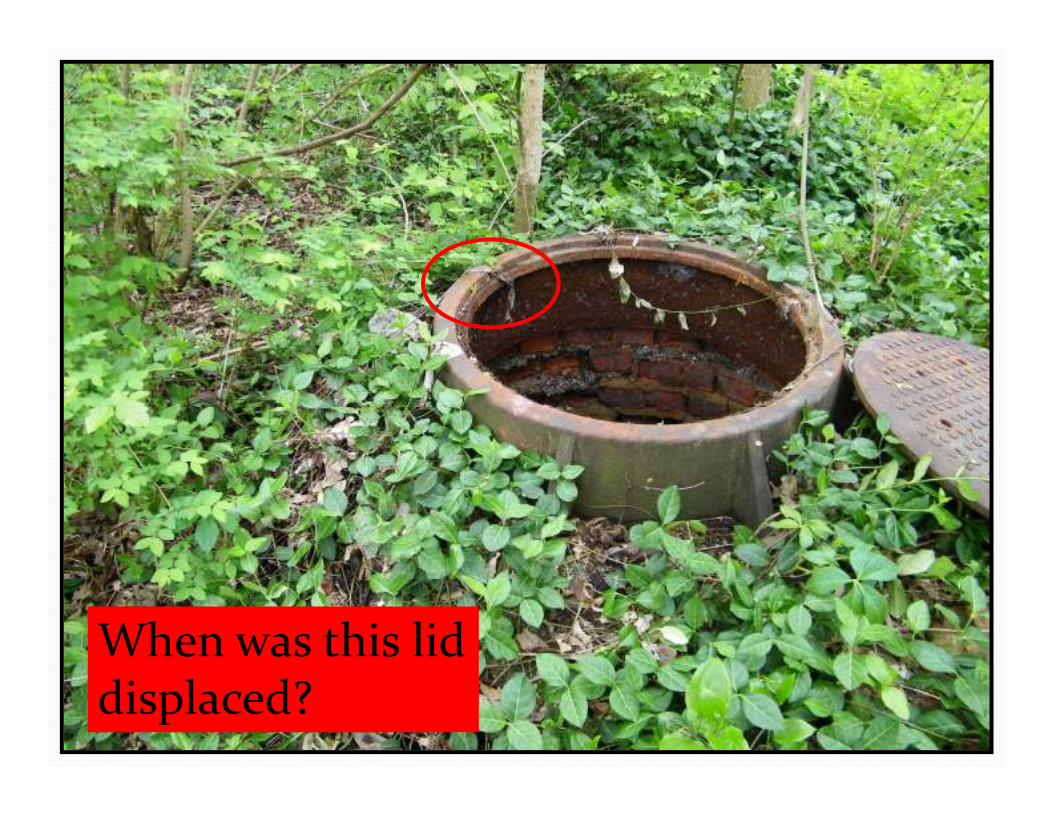
When was this lid displaced?
Legacy Issues
Adverse Water Quality Impacts in the
Spring River Watershed
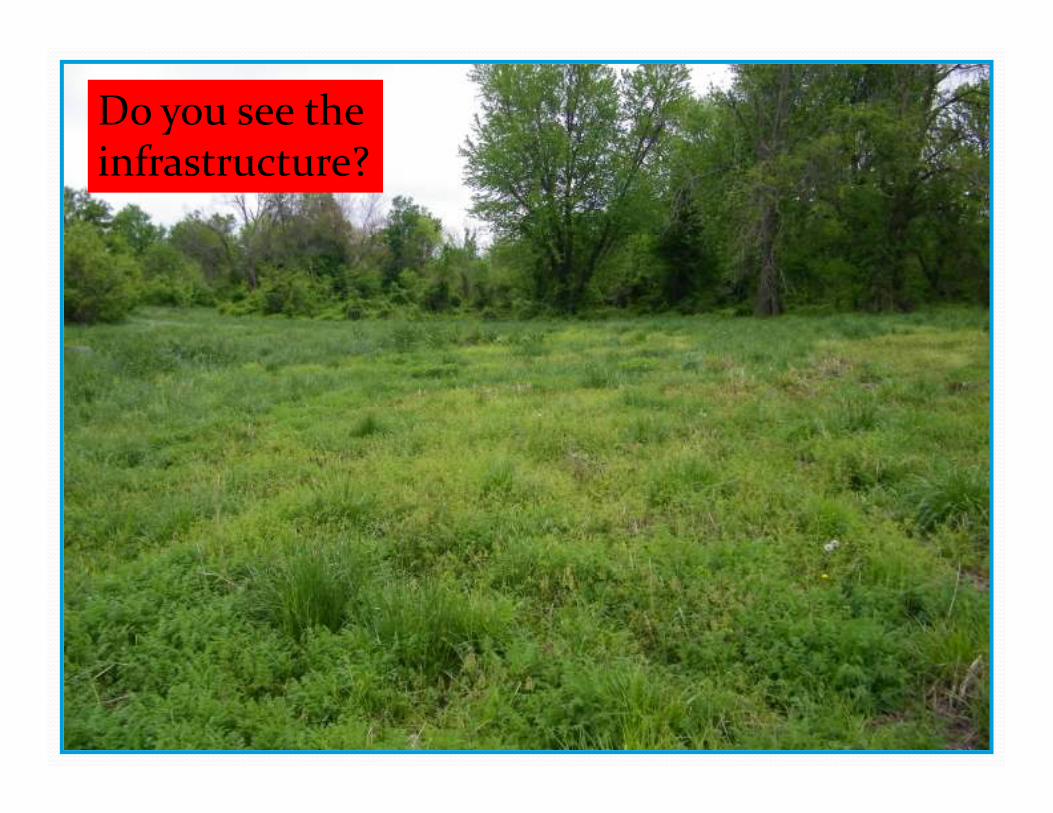
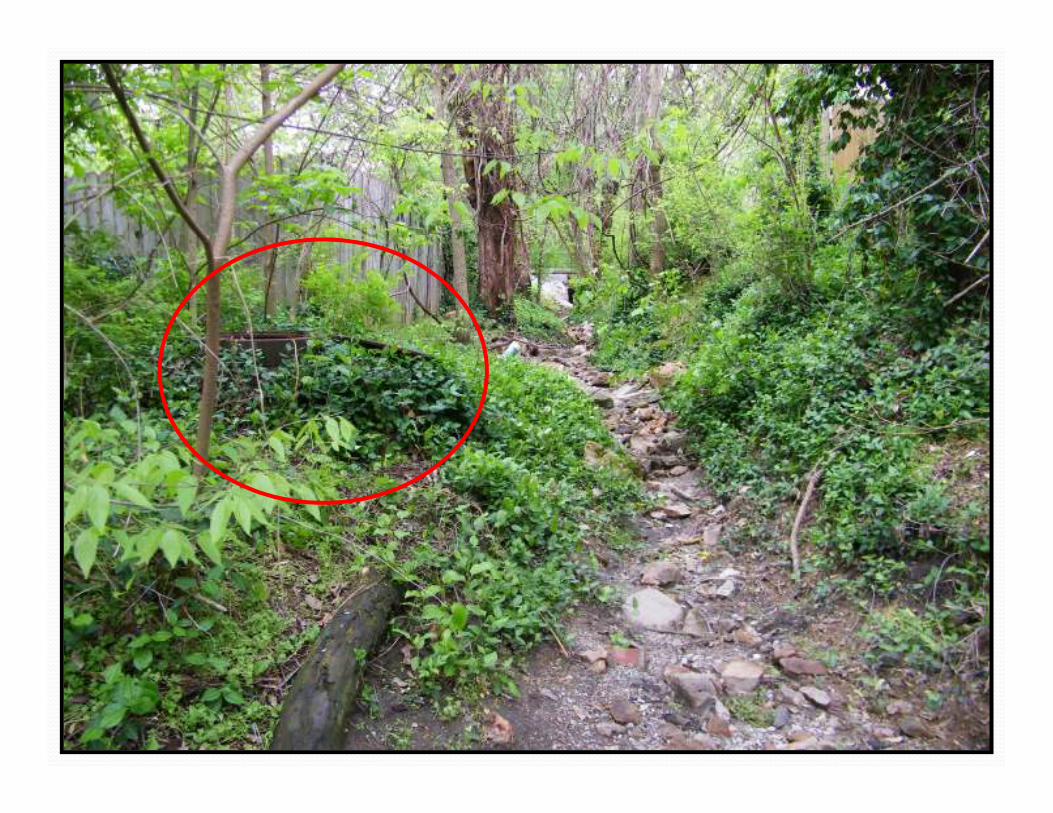
Do you see the infrastructure?
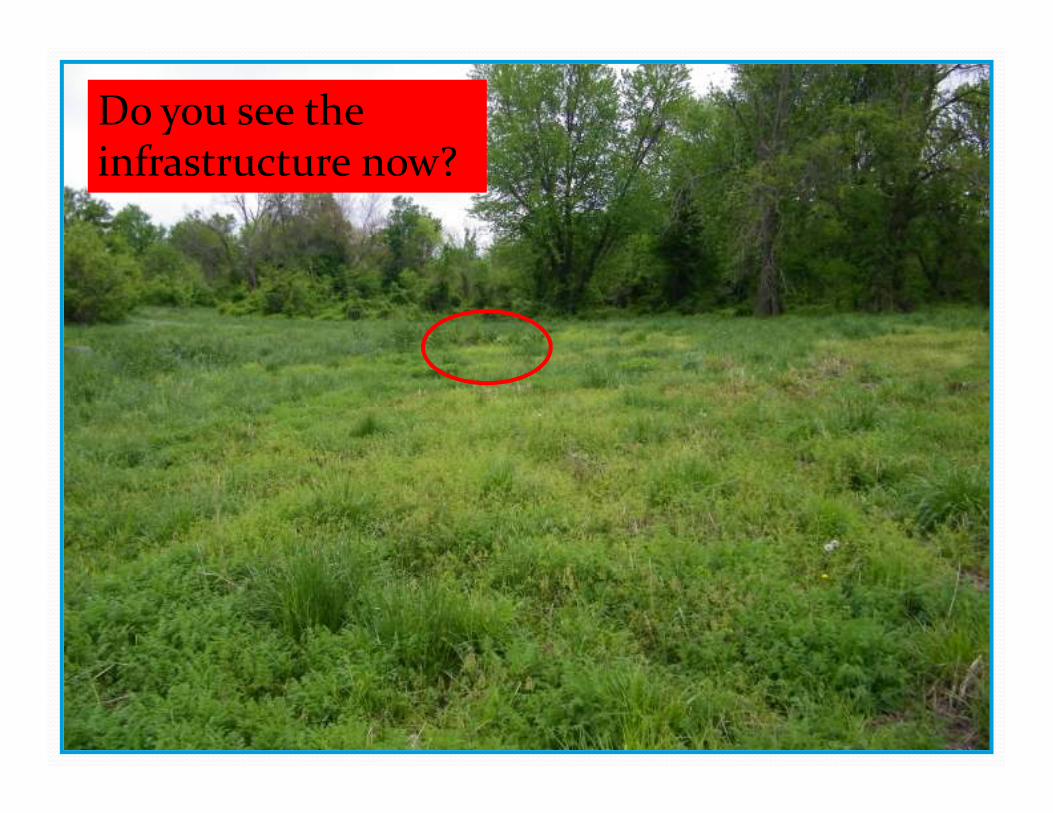
Do you see the infrastructure now?
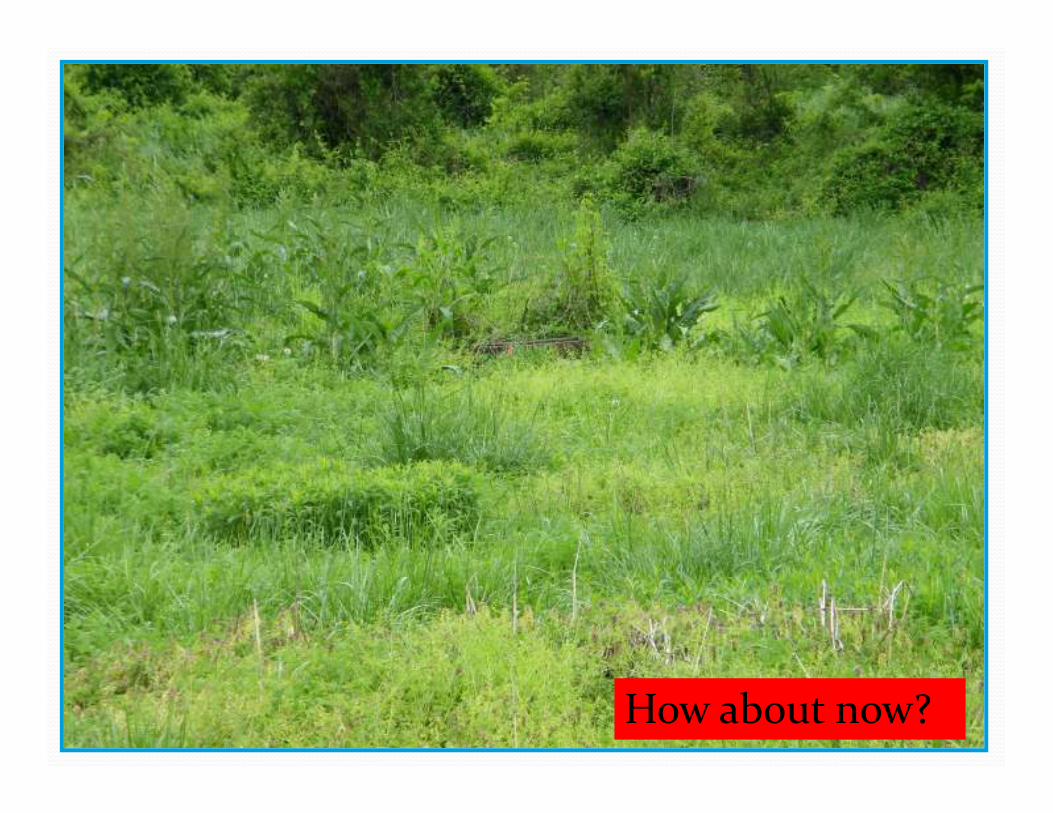
How about now?
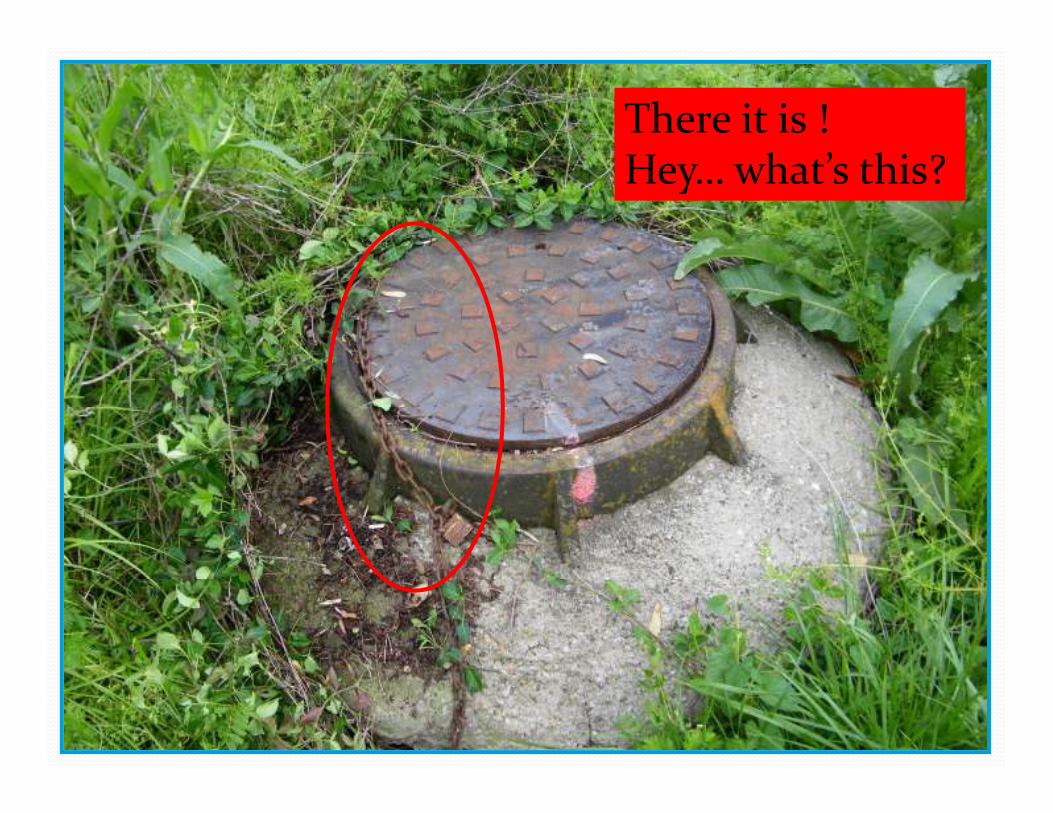
There it is !Hey… what’s this?
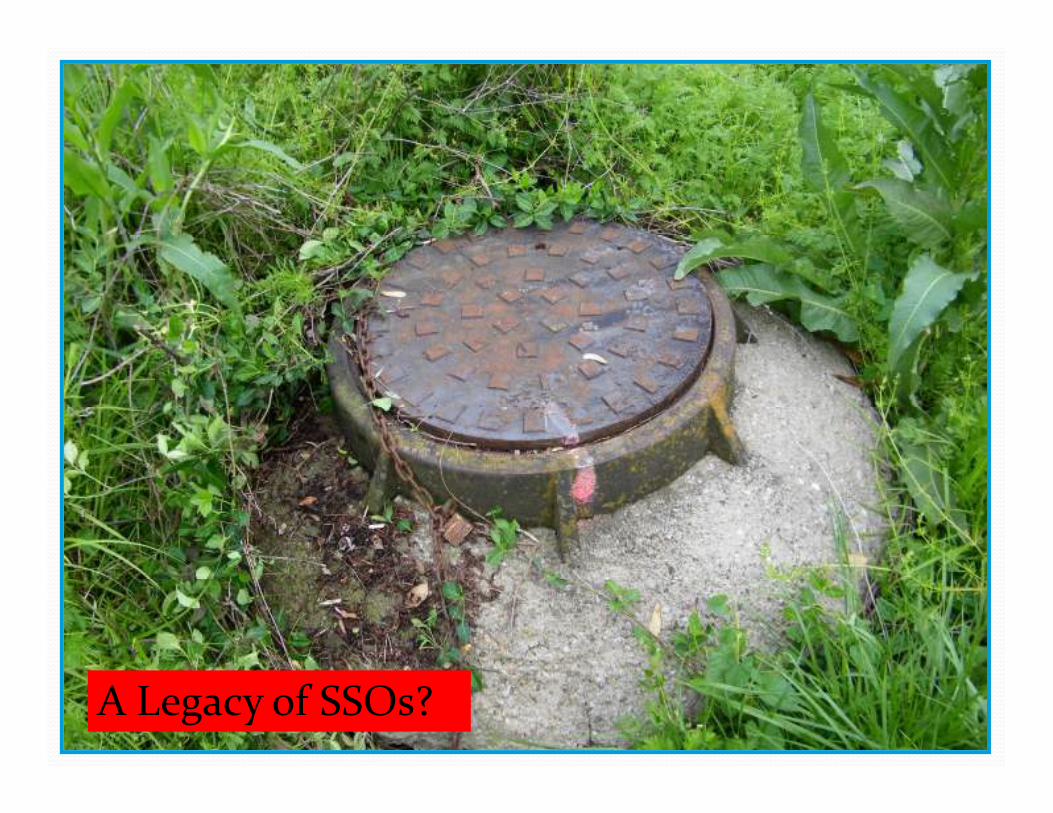
A Legacy of SSOs?
Before you think that the municipal
infrastructure “legends” are immune from
public scrutiny…
Please remember that we are in a New Age
of Information and Data Sharing…
!@#$% goes “Viral” in a hurry!

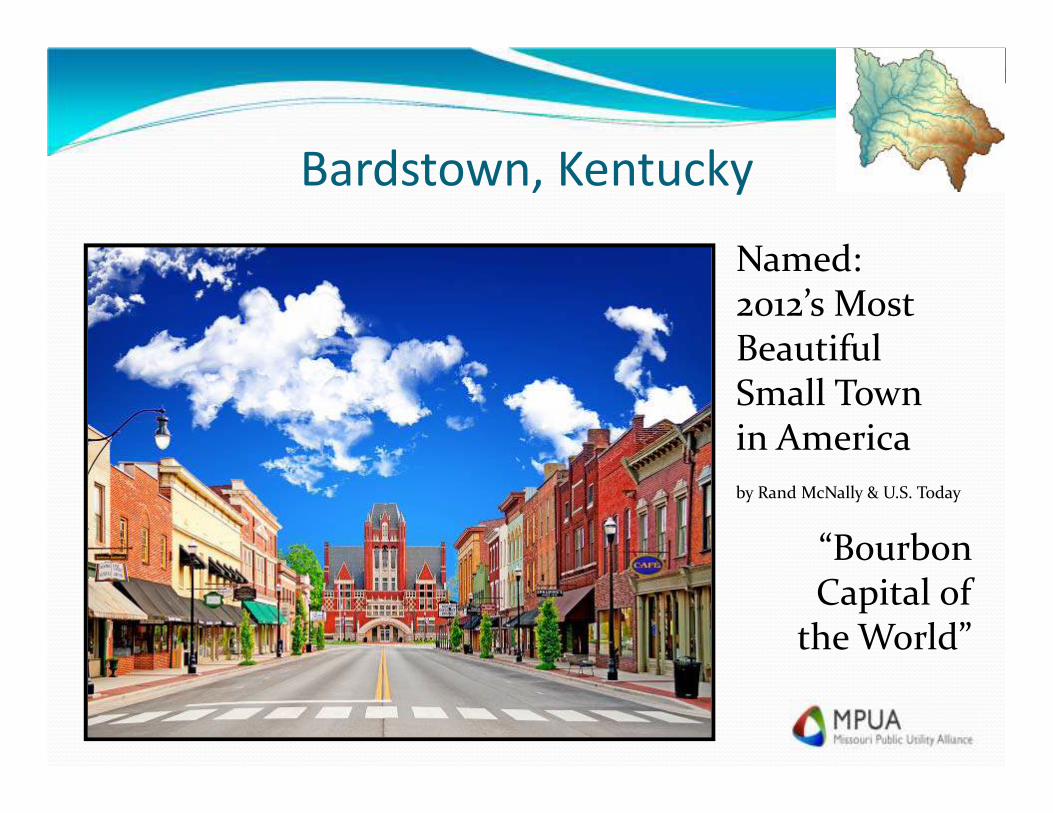
Bardstown, Kentucky
Named:2012’s Most Beautiful Small Town in America
by Rand McNally & U.S. Today
“Bourbon Capital of
the World”

As a boots-on-the-ground,
municipal utility guy…
Watershed Management is about:
Raising the competence and performance
of the under-achievers. It is not raising the
“bar” for the good performers.
Watershed Management is about:
Raising the competence and performance
of the under-achievers. It is not raising the
“bar” for the good performers.
Why Not?
Watershed Management is about:
Raising the competence and performance
of the under-achievers. It is not raising the
“bar” for the good performers.
Watershed improvements are more
dramatic and cheaper when the
under-achiever’s performance improves.

“Mining” data from “Under-performers”
Spring River Watershed Focus
How many utilities have sanitary sewer
overflows through manholes in a 0.5-inch
rainstorm? Where are they? What about
for 1.0-inch storms? Why do they occur?
Historically, we know that a 1-day, 1.6-inch
storm has a 2-month reoccurrence interval.
Watershed Management is also about:
Local folks who care about their local
watershed, with sufficient determination,
that they become the community leaders
who decide to seek out the remaining
environmental problems and “tackle” them.
Thank You for Your Attention!
Philip Walsack
Missouri Public Utility Alliance
1808 I-70 Drive SW
Columbia, MO 65203
573-445-3279


![CAMBI ASA...• Municipal sewage is collected via wastewater infrastructure from urban areas into a wastewater treatment plant [1] • In the wastewater treatment process, an organic](https://static.fdocuments.in/doc/165x107/6145f5088f9ff812541ff591/cambi-asa-a-municipal-sewage-is-collected-via-wastewater-infrastructure-from.jpg)