preprint Seed Color as an Indicator of Flavanol Content in ...
27
1 preprint Seed Color as an Indicator of Flavanol Content in Theobroma cacao L. Melis S. Cakirer † , Gregory R. Ziegler * , Mark J. Guiltinan ‡ Departments of Food Science and Horticulture, The Pennsylvania State University, University Park, 16802. * Corresponding author. Department of Food Science. 341 Food Science Building, University Park, PA 16802. Tel: (814) 863-2960. Fax: (814) 863- 6132. E-mail: [email protected] . † Colgate-Palmolive Company. 909 River Road, Piscataway, NJ 08855-1343. E-mail: [email protected] . ‡ Department of Horticulture, 422 Life Sciences Building, University Park, PA 16802. E-mail: [email protected] .
Transcript of preprint Seed Color as an Indicator of Flavanol Content in ...
1
preprint
Seed Color as an Indicator of Flavanol
Content in Theobroma cacao L.
Melis S. Cakirer†, Gregory R. Ziegler*, Mark J. Guiltinan‡
Departments of Food Science and Horticulture, The Pennsylvania State
University, University Park, 16802.
* Corresponding author. Department of Food Science. 341 Food Science
Building, University Park, PA 16802. Tel: (814) 863-2960. Fax: (814) 863-
6132. E-mail: [email protected].
† Colgate-Palmolive Company. 909 River Road, Piscataway, NJ 08855-1343.
E-mail: [email protected].
‡ Department of Horticulture, 422 Life Sciences Building, University Park, PA
16802. E-mail: [email protected].

2
Abstract
Seed color has long been associated with quality traits of the cacao tree,
Theobroma cacao L., namely disease resistance and the flavor of chocolate
produced from its seeds. Flavanol compounds are central to many of these
quality traits and this study investigates the relationship between seed color and
flavanol content in the seed. Colorimetric data was collected for 200 T. cacao
seeds, each individually analyzed for relative flavanol concentrations by HPLC
MS. A significant positive relationship (p<0.0000) was found between total
flavanols and pigmented anthocyanin compounds. Colorimetric seed color data
showed that "lightness" of the outer seed surface, as measured by L*-values, is
only modestly predictive of flavanol content. Individual seed extracts
consistently revealed the presence of four pigmented anthocyanin compounds;
in order of decreasing abundance, they were a cyanidin arabinoside, cyanidin
galactoside, cyanidin rutinoside, and cyanidin pentoside. The last two, whose
identifications were confirmed by tandem MS, were previously unidentified in
cacao. During this investigation, a method was developed for the efficient
quantification of procyanidins. These compounds, of interest in many foods,
were analyzed from fresh cacao seed extracts. Comparative procyanidin
profiles for each seed were obtained using a polyethylene glycol column to
separate oligomers. Data on retention times and mass chromatographs led to
the identification of procyanidin monomers through pentamers with putative
identifications of hexamers through decamers based on retention time and
3
similar spectral traces. Benefits of this system as a rapid method for
procyanidin characterization are discussed.
Keyword Index: Theobroma cacao L., Malvaceae, flavanols, anthocyanins,
procyanidins, catechins.
Introduction
Fresh cacao seeds range from deep purple, to pink, to white, which is thought to
be associated with economically important, although hard-to-measure traits,
such as chocolate flavor (Scarpari et al., 2005; Butler, 2001; Presilla, 2001;
Ndoumou et al., 1996). These colors are closely linked to genetic identity
(Bartley, 2005) and are widely used to distinguish the major cultivars.
Anthocyanins, the chemical compounds responsible for cacao seed pigment
(Ziegleder and Biehl, 1988), are flavanols themselves, synthesized in the same
metabolic pathway (Stafford, 1990), and their regulation in the seed is
potentially indicative of the entire class of these compounds.
Flavanols are central to the development of quality cacao. Prior to harvest,
flavanols are synthesized in the growing seeds as defense compounds (Scarpari
et al., 2005; Ndoumou et al., 1996). They protect the seed against oxidative
damage and can act as a gustatory deterrent, keeping predators from eating the
seeds (Stafford, 1990). During chocolate processing, flavanol levels decrease
4
substantially (Kealey et al., 1998), but those remaining contribute to the
chocolate flavor through their known bitter and astringent properties (Stark et
al., 2005). Flavanols also alter the course of flavor development by binding
with protein and enzymes and decreasing the number of aroma precursors
generated (Zak and Keeney, 1976). The significance of flavanols in flavor
development, disease resistance and bioactive properties make them a
potentially important indicator of favorable traits for selection and breeding of
cacao.
Pigments in unfermented seeds were first characterized during polyphenol
analyses conducted in Trinidad during the period 1949-1968 (Ziegleder and
Biehl, 1988). Paper chromatographic techniques were used to separate
extracted purple pigments, later attributed to the anthocyanins, 3-α-L-
arabinosidyl cyanidin and 3-β-D-galactosidyl cyanidin (Forsyth and Quesnel
1957). Each was estimated to comprise 0.3% and 0.1% of seed dry weight,
respectively (Ziegleder and Biehl, 1988). Despite the fact that the chemical
agents responsible for purple color have been identified, an explanation for the
full range of T. cacao seed color is still lacking. Anthocyanins identified in
purple seeds do not explain the existence of white, pink or mottled seeds. One
might assume that lighter seed colors are due to decreased levels of
anthocyanins, yet under certain conditions, anthocyanins may appear colorless
(Stafford, 1990). Therefore, it is not known whether white seeds are due to a

5
mutation in the synthesis of anthocyanins or merely another form of the
compounds.
Procyanidins, as a subclass of flavonoids, have gained much attention in recent
years due to reported health benefits (Hannum and Erdman, 2000). Oligomeric
procyanidins, specifically, have been shown to decrease blood pressure and
confer protective effects in the veins (Zhu et al., 2002). Their natural
occurrence in plant-based foods like red wine, sorghum, apples, cranberry,
blueberry and tea have led to procyanidin characterization in a number of food
products (Degenhardt et al., 2001; Gu et al., 2002; Guyot et al., 2001; Peng et
al., 2001). Chocolate has recently been recognized as a food high in
procyanidins and has been a leading model system used to develop techniques
(Hammerstone et al., 1999; Adamson et al., 1999; Wollgast et al., 2001).
Analysis of procyanidins presents a number of challenges. First, extraction of
these compounds from natural sources is limited by their solubility. As chain
length increases, procyanidins are increasingly insoluble in extraction solvents.
Second, procyanidins are unstable, easily polymerizing, especially in response
to oxidative conditions (Rohr et al., 1999). Finally, the number of isomers
generated during polymerization creates a significant problem for
chromatographic separation. Resolution is typically poor for procyanidins
(Rohr et al., 1999) with higher mass procyanidins spread out over the whole
chromatogram (Peng et al., 2001; Rohr et al., 1999).

6
Column choice plays a significant role in separation of analytes. Previous
attempts have been made to separate procyanidins on both polar (Hammerstone
et al., 1999; Adamson et al., 1999) and non-polar (Degenhardt et al., 2001;
Wollgast et al., 2001) stationary phases. These studies have shown poor
selectivity for procyanidins on non-polar columns (Degenhardt et al., 2001), but
a satisfactory separation using polar columns (Hammerstone et al., 1999;
Adamson et al., 1999). Unfortunately, polar columns require a long analysis
time, show evidence of column damage over time, and require detection by
fluorescence (Adamson et al., 1999).
This study investigates how seed color may be indicative of native flavanol
concentrations in the fresh seed. Many studies have looked at flavanol contents
in cacao in recent years (Sánchez-Rabaneda et al., 2003, Whitacre et al., 2003;
Gotti et al., 2006; Kelm et al., 2006; Niemenak et al., 2006). This study
analyzes seeds individually in order to assess the genetic variation in the
species. Relative concentrations of flavanols were measured for 200 cacao
seeds to determine if 1) anthocyanins are coregulated with other flavanols and
2) if seed color may be used as a practical indicator of flavanol content. For
these purposes, a medium polarity column containing a polyethylene glycol
stationary phase was used to separate procyanidin oligomers from monomers to
decamers. Use of this column is presented here as an alternative method for
procyanidin analysis.

7
Results and Discussion
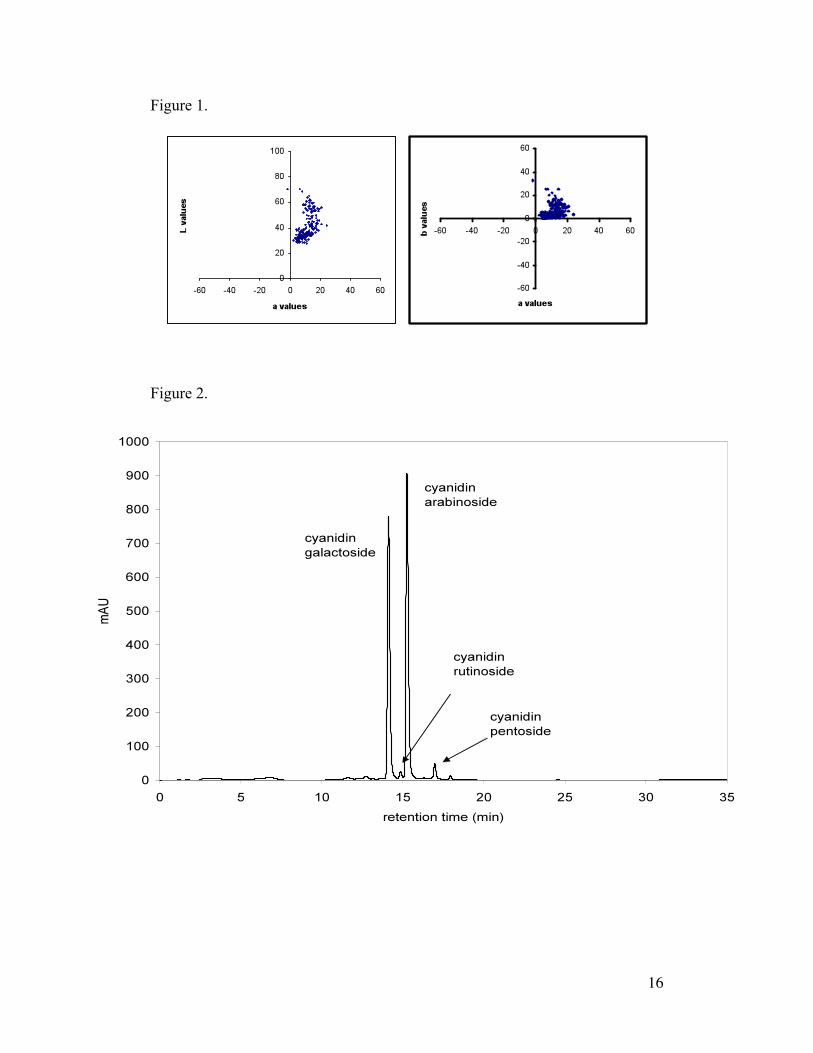
Seed cotyledons sampled from 16 varieties of cacao ranged in color from deep
purple to ivory. L*a*b* colorspace mapping of individual seeds Figure 1
shows a weighted sampling of purple seeds consistent with the natural
population (ICGD, 2002). Error due to oxidation during color measurement was
estimated to be -2% for L-values, -3% for a-values and -3 % error for b-values.
HPLC revealed two major peaks with max UV absorbance at 520 nm (Figure
2). Major ions for the first peak (retention time = 14.82 min) were [M]+ m/z =
449 and [M-hexoside]+ m/z=287. The second anthocyanin (RT = 15.97 min)
showed ions at [M]+ m/z=419, [M-pentoside]+ m/z = 287. These ion fragments
correspond to those found for a cyanidin-3-O-glucoside and cyanidin-3-O-
pentoside, respectively (Mazzuca et al., 2005).
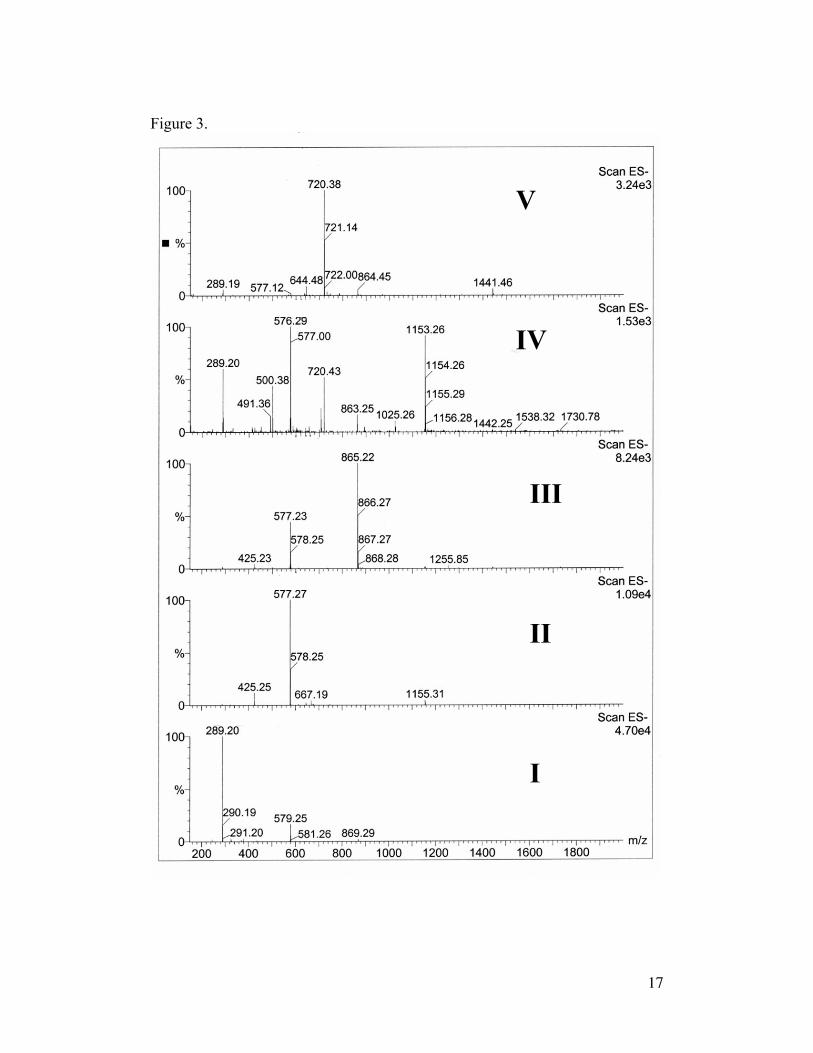
Positive identification of procyanidin compounds was established through
negative ion mass spectra (Figure 3). Detection at 280 nm revealed peaks
eluting from the column (Figure 4) with masses corresponding to procyanidin
monomers through pentamers (Figure 5: monomers [M]+ m/z = 289; dimer
[M]+ m/z = 577; trimer [M]+ m/z = 865, [M-monomer]+ m/z = 577; tetramer
[M]+ m/z = 1153, [M-dimer]+ m/z = 576; pentamer [M]+ m/z = 1441). The
pentamer showed a dominant ion fragment at m/z = 720.38 likely due to fission

8
by a reverse Diels-Alder reaction. Proposed cleavage sites between base units
and in ring B of the oligomers are known fragmentation patterns of
procyanidins, Figure 6 (Friedrich et al., 2000). Pure (-)-epicatechin run on the
polyethylene glycol column showed similar retention times to that of the
compound identified as the monomer. Furthermore, the UV spectral
absorbance of the standard was almost a perfect match for all the procyanidins
identified.
Although a reverse-phase gradient was used, retention patterns of the identified
procyanidins seem to indicate that the polyethylene glycol column works like a
normal-phase separation. Previous reverse-phase studies using non-polar C18
columns (Degenhardt et al., 2001; Wollgast et al., 2001) as well as our own
studies (not included), have shown that procyanidins are not separated well
based on hydrophobicity. Since solubility of procyanidins in the mobile phase
seems to be very similar, separation of procyanidins on the polyethylene glycol
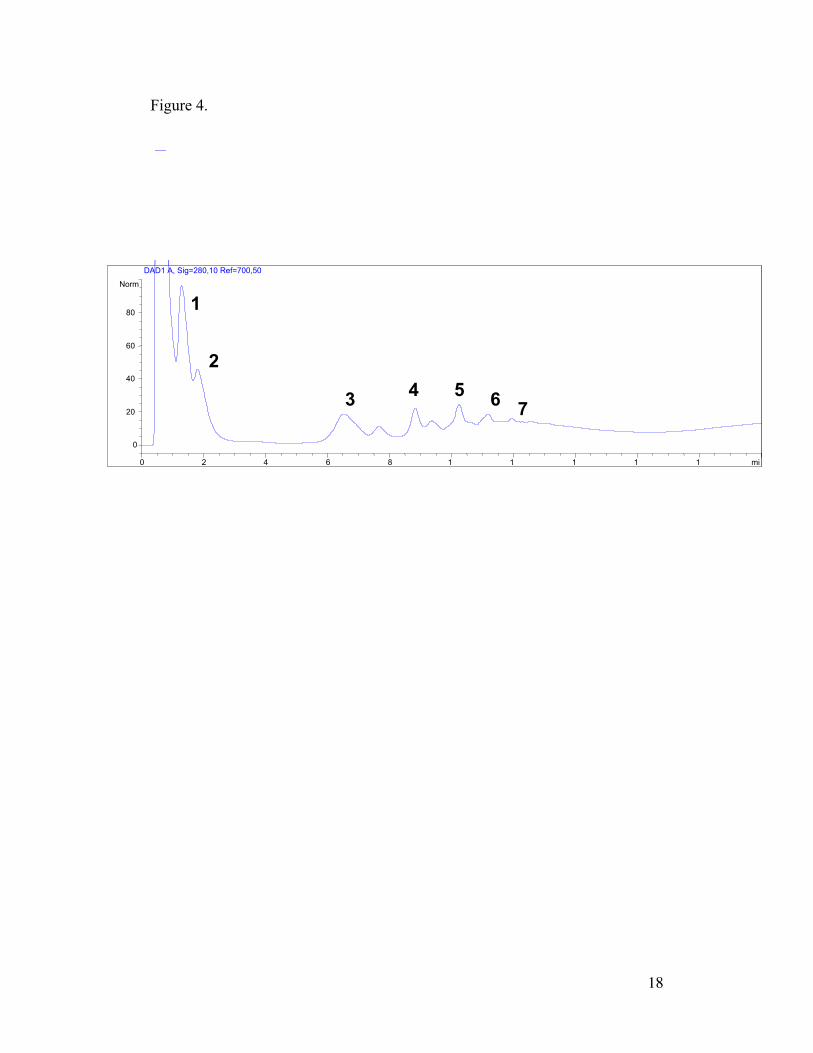
column is likely mediated by interactions with the stationary phase.
The column stationary phase, comprising short polyethylene glycol chains,
separated the procyanidins according to chain length with an unusually long
retention time between dimers and trimers (Figure 4). It seems that
procyanidins with a degree of polymerization equal to or greater than three
interact differently with the column in comparison with monomers and dimers.
While lower molecular weight procyanidins pass easily through the column

9
with the mobile phase, trimers demonstrate an added degree of interactions with
the column stationary phase.
There is also reason to believe that the polyethylene column is able to separate
isomers of the procyanidins. Unidentified, paired peaks were observed for
compounds III and IV in Figure 4, and sometimes observed for higher
oligomers as well. These peaks could well contain structural isomers of
procyanidins, perhaps glycosylated forms. Because the absorbance at 280
reveals any type of phenolic compound present in a cacao seed extract (Peng et
al., 2001), of which there are many (Hannum and Erdman, 2000) it is difficult
to determine the exact identity of these minor compounds.
One advantage of the polyethylene glycol column is that procyanidins can be
reasonably separated using solvents which are friendly to the mass
spectrometer. For extracts in which there were large quantities of procyanidins,
there was some difficulty in separating monomers from dimers. Separation of
this impurity, confirmed by the peak in the monomer's fragmentation spectra
(Figure 3), could perhaps be improved through a modification of the mobile
phase or by injecting smaller sample volumes.
Two major anthocyanin species were identified in extracts for nearly every seed
sampled. MS results were consistent with the presence of anthocyanidins
previously identified in cacao, 3-β-D-galactosidyl cyanidin and 3-α-L-
10
arabinosidyl cyanidin (Niemenak et al., 2006; Forsyth and Quesnel, 1957).
Relative anthocyanin concentrations measured by peak area were most closely
correlated with L* values of the seed surface demonstrating an inverse linear
relationship between anthocyanin content and lightness of the seed (Figure 7).
From these results, it seems that the intensity of seed color, concentrated on the
outer surfaces of the seed, is significantly related to anthocyanin concentrations
of the total seed. Anthocyanin contents are not perfectly correlated with
colorimetric data, however. This could be due to the difference in analytical
techiniques; colorimetric measurements were taken on specific surfaces of the
seed, while anthocyanin concentrations were a result of a total seed extraction.
One important factor to consider are other factors involved in the expression of
seed color. It is known that the color of anthocyanins can be modified based on
pH (Figure 8), metal chelation, co-pigmentation with proteins and other
flavanols (Gross, 1987).
Other phenolics separated on a polyethylene glycol column and visualized at
280 nm were recognized as cacao procyanidins based on similar traces from
chocolate extracts using other column systems (Hammerstone et al., 1999;
Wollgast et al., 2001). Negative ion mass spectrometry identified monomers
through pentamers with maximum chain length likely limited by the solubility
of large polymers in the extraction. A relative measure of total procyanidin
11
content for each seed was based on the sum of peak areas for all procyanidins
polymers.
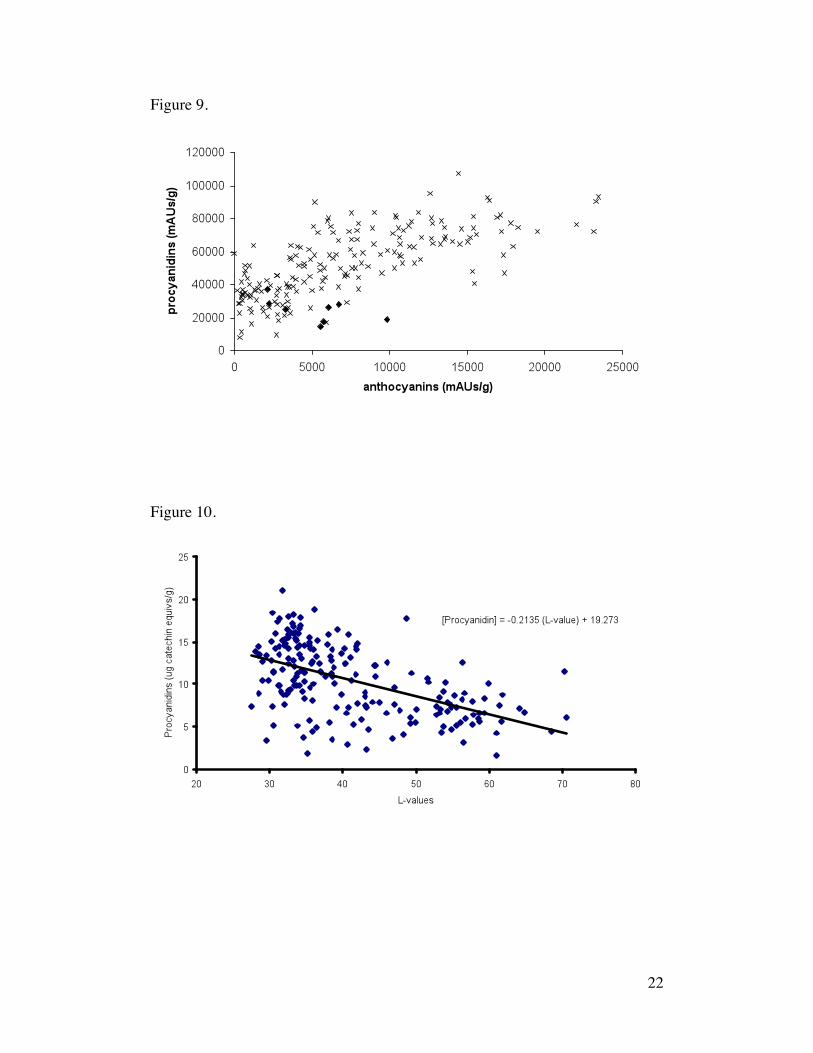
The relationship between anthocyanins and procyanidins within a single seed
was positive (p < 0.0000) with high variance (r2 = 0.5346) (Figure 9). This
result is a strong indicator that the chemical classes are generally co-regulated
in the seed. The high degree of variance, however, suggests additional
mechanisms for fine-tuning control at the point where their metabolic pathways
branch (Stafford, 1990). One Amelonado pod from Cameroon (AML) showed
an inverse relationship with low procyanidin contents even for more pigmented
seeds and represents an interesting lead for further study. In general,
spectroscopic L-values were only modestly predictive of procyanidin content
(Figure 10).
Experimental
General Experimental Procedures. Colorimetric measurements were made
using either a Minolta Chroma Meter CR-200 or Spectrophotometer CM-3500d
(Minolta, Ramsey, NJ, USA). Seed extract preparation included lyophilization
in a VirTis Genesis 25 XL Freeze-Drier (SP Industries, Gardiner, NY, USA).
Acidified extracts were injected into a Hewlett Packard series 1100 HPLC
(Brinkmann Instruments, Westbury, NY, USA) coupled to an ESI-TOF
12
PerSeptive Biosystem Mariner Mass Detector (Perseptive Biosystem, Boston,
MA, USA).
Cacao seed samples. Two hundred fresh cacao seeds were obtained from
clonal accessions identified by cacao research stations and included the
following varieties (number of pods in parentheses): from IRAD, Cameroon:
AML(2), SNK 10, SNK 16, SNK 413, UPA 134 (2); from CRU, Trinidad: DR
2 (2), ICS 16, ICS 39, ICS 40; from USDA, Puerto Rico: ICS 16, ICS 39 (3),
ICS 40 (2), P 19, PA 4, SCA 6 (4), SCA 12, UF 613.
Colorimetric analysis. Colorimetric data for fresh seed cotyledons was taken 1-
13 days after harvest. Reflectance measurements were made within 2 minutes
of peeling seed testa, twice on seed outer surface using an 11mm diameter
aperture and excluding specular reflection. Extensive preliminary experiments
were carried out to determine the effect of time after pod opening and seed
peeling on the colorimetric data, and estimates of the error associated with
browning reactions is given in the results.
Seed storage. Immediately following colorimetric analysis, seeds were quick
frozen in liquid nitrogen and stored at -70°C. Lyophilization was accomplished
under vacuum (300 mT) through a cycle of -40°C, 120 min; -12°C, 2230 min;
0°C, 130 min; 10°C, 75 min. Freeze-dried seed masses were recorded in a
humidity-controlled environment.

13
Polyphenol extraction. A polyphenol extraction procedure was adapted from
(Adamson et al., 1999, Wollgast and Anklam, 2000). Individual seeds were
ground using a Brinkmann Polytron Kinematica GmbH PCU 1 with a probe
3/4" in diameter (Brinkmann Instruments, Westbury, NY) under 10 mL hexane
Optima grade (Fisher Scientific, Pittsburgh, PA, USA) in a 50 mL
polypropylene tube (Dimensions: D = 30 mm, length = 115 mm) (VWR
International, Inc., Bridgeport, NJ, USA). Seeds were individually ground at a
controlled speed for 10 seconds. Lipids were removed in three hexane washes,
using a Beckman GPR Centrifuge (Global Medical Instrumentation, Inc.,
Albertville, MN) for 10 min, 4000-5000 RPM at <0°C to settle the particulate
between each wash. After the final hexane supernatant was discarded,
polyphenols were extracted in 10 mL of HPLC grade MeOH:H2O (75:25, v/v)
for 24 hours at 5°C. Recovery in the second extract were determined to be less
than 5-10% of the first extract, and not included in the analysis.
HPLC MS analysis. Polyphenol extracts were passed through a non-sterile 15
mm syringe filter with a 0.45 micron PTFE membrane (VWR International,
Inc., Bridgeport, NJ, USA) into 2 mL microfuge tubes, and stored at -70°C.
Injection samples consisting of extracts dissolved in 10% HCO2H solution
(Fisher Scientific, Pittsburgh, PA, USA) (1:4, v/v) were placed in 2mL screw
cap vials (Agilent Technologies, Palo Alto, CA, USA).
14
Ten µL of filtered extract were injected by autosampler into a Hewlett Packard
series 1100 HPLC system (Agilent Technologies, Palo Alto, CA, USA).
Anthocyanins were separated on a Keystone BetaBasic C18 column (1 x
150mm) using a mobile phase based on a gradient program which included
solvent A: 10% HCO2H solution, solvent B: H2O/HCO2H/acetonitrile (4/1/5),
and solvent C: MeOH. Samples were run at a flow rate of 0.750 mL/min and
visualized at 520 nm with a diode array detector.
Procyanidin monomers through heptamers were separated on a Supelco®
polyethylene glycol column ((1.0 x 50mm) 120 Ǻ) using a reverse phase
gradient and visualized at 280 nm. The limit of detection for the diode array
detector operating in the linear range of 0.24-700 ng/mL was 1.2 pg at a signal-
to-noise ratio of 2. Relative amounts of anthocyanins, catechins and
procyanidins were quantified in terms of catechin equivalents by comparison of
peak areas with an authentic (-)-epicatechin standard.
Statistical analysis. All regression and principal component analysis performed
on data was accomplished using Minitab software, version 13.32 (Minitab, Inc.,
State College, PA, USA). Statistics on non-linear regressions for the
correlation of anthocyanins with seed color were performed using SAS
software, version 8.2 (SAS Institute, Inc., Cary, NC, USA).

15
Acknowledgements The authors would like to thank the scientists who
graciously offered their assistance from cocoa research stations: Wilbert Philips
(CATIE, Costa Rica); David Butler, Miguel Roman and Darin Sukha (Cocoa
Research Unit (CRU), University of the West Indies, Trinidad); Salamon
Nyasse and Jean-Philippe Marelli (INRA, Cameroon); and Heber Irrizarry,
Ricardo Goenaga and Angel Marrero (USDA Tropical Research Station,
Mayaguez, Puerto Rico). Thanks to A. Daniel Jones, currently at the Mass
Spectrometry Facility, 209 Biochemistry Building, Michigan State University,
for assistance with HPLC-MS while at Penn State.
16
Figure 1.
Figure 2.
17
Figure 3.
18
Figure 4.
min 0 2 4 6 8 1
0 12 1
4 16 1
8
Norm.
0
200
400
600
800
DAD1 A, Sig=280,10 Ref=700,50 (D:\MELIS\1004MC25.D)
1
2
3 5 4 6 7
min 0 2 4 6 8 1
0 12 1
4 16 1
8
Norm.
0
200
400
600
800
DAD1 A, Sig=280,10 Ref=700,50 (D:\MELIS\1004MC25.D)
1
2
3 5 4 6 7

19
Figure 5.

20
Figure 6.
Figure 7.

21
Figure 8.
22
Figure 9.
Figure 10.

23
Figure Legends
Figure 1. T. cacao seed color measurements (average of two data points on
outer surface) mapped onto an L*a*b* colorspace where "lightness" of the seed
is indicated by L-values (L=0 is black, and L=100 is pure white), and
chromaticity coordinates are given by a-values and b-values (+a is red, -a is
green, +b is yellow, -b is blue). Any distance of 2 equals a perceptible
difference based on a standard observer.
Figure 2. Chromatograph of T. cacao seed extract resolved on a Betabasic C18
column. Absorbances are observed at 520 nm and anthocyanins identified by
tandem MS.
Figure 3. Negative ion mass spectrum of fresh cacao seed extract. Compound
I: catechin monomers, compounds II-V: procyanidin oligomers (dimer through
pentamer)
Figure 4. Chromatograph of procyanidins. T. cacao seed extracts were
resolved on polyetheylene glycol column and observed at 280 nm. Peaks were
identified by mass spectroscopy and are labeled according to degree of
polymerization
Figure 5. Mass chromatograms of catechin monomers (m/z 289) and
procyanidin oligomers (dimer through hexamers m/z 577 to 1441).

24
Figure 6. Likely fragmentation patterns for procyanidin oligomers (Friedrich et
al., 2000): cleavage of the interflavonic bond (a), Retro-Diels-Alder fission of
the C ring (b).
Figure 7. Relationship between "lightness" of the outer seed surface, as
measured by L-values, and total anthocyanin content, given in relative units of
milli Absorbance Units sec per gram seed dry weight. R2=0.58.
Figure 8. The effect of pH on anthocyanin color. Seed extracts were placed in
different buffered solutions, pH 1-7, from left to right.
Figure 9. Comparison of relative amounts of anthocyanins and procyanidins
for 200 T. cacao seed extracts. Figure 5-10. Seeds from Amelonado pod (♦)
are highlighted with respect to seeds from the entire sample set (x).
Figure 10. Prediction of procyanidins using L-values for the outer seed
surface.

25
References
Adamson, G.E., Lazarus, S.A., Mitchell, A.E., Prior, R.L., Cao, G.H., Jacobs, P.H., Kremers, B.G., Hammerstone, J.F., Rucker, R.B., Ritter, K.A., Schmitz, H.H., 1999. HPLC method for the quantification of procyanidins in cocoa and chocolate samples and correlation to total antioxidant capacity. J. Agric. Food Chem. 47, 4184-4188.
Bartley, B.G.D., 2005. The Genetic Diversity of Cacao and its Utilization. Cabi, Portugal. pp. 368.
Butler, D. 2001. Personal communication.
Degenhardt, A., Engelhardt, U.H., Winterhalter, P., Ito, Y. 2001. Centrifugal Precipitation Chromatography − a Novel Chromatographic System for Fractionation of Polymeric Pigments from Black Tea and Red Wine. J. Agric. Food Chem. 49, 1730-1736.
Friedrich, W., Eberhardt, A., Galensa, R., 2000. Investigation of proanthocyanidins by HPLC with electrospray ionization spectrometry. Eur. Food Res. Technol. 211, 56.
Forsyth, W.C.G., Quesnel, V.C., 1957. Cacao polyphenolic substances. 4. the anthocyanin pigments. Biochem. J. 65, 177-179.
Gotti, R., Furlanetto, S., Pinzauti, S., Cavrini, V., 2006. Analysis of catechins in Theobroma cacao beans by cyclodextrin-modified micellar electrokinetic chromatography. J. Chromatogr., A. 1112, 345-352.
Gu, L., Kelm, M., Hammerstone, J.F., Beecher, G., Cunningham, D., Vannozzi, S., Prior, R.L. 2002. Fractionation of Polymeric Procyanidins from Lowbush Blueberry and Quantification of Procyanidins in Selected Foods with an Optimized Normal-Phase HPLC−MS Fluorescent Detection Method. J. Agric. Food Chem. 50, 4852-4860.
Guyot, S., Marnet, N., Drilleau, J. 2001. Thiolysis−HPLC Characterization of Apple Procyanidins Covering a Large Range of Polymerization States. J. Agric. Food Chem. 49, 14-20
Hammerstone, J.F., Lazarus, S.A., Mitchell, A.E., Rucker, R., Schmitz, H.H., 1999. Identification of procyanidins in cocoa (Theobroma cacao) and chocolate using high-performance liquid chromatography/mass spectrometry. J. Agric. Food Chem. 47, 490-496.
Hannum, S.M., Erdman, J.W. 2000. Emerging health benefits from cocoa and chocolate. J. Med. Food 3, 73-75.
International Cocoa Germplasm Database (ICGD) 2002. http://www.icgd.reading.ac.uk/ (accessed 3/13/03).

26
Kealey, K.S., Snyder, R.M., Romanczyk, L.J., Geyer, H.M., Myers, M.E., Withacre, E.J., Hammerstone, J.F. & Schmitz, H.H., 1998. Cocoa components, edible products having enhanced polyphenol content, methods of making same and medicinal uses. Patent Cooperation Treaty (PCT) WO 98/09533.
Kelm, M.A., Johnson, J.C., Robbins, R.J., Hammerstone, J.F., Schmitz, H.H., 2006. High-performance liquid chromatography separation and purification of cacao (Theobroma cacao L.) procyanidins according to degree of polymerization using a diol stationary phase. J. Agric. Food Chem. 54, 1571-1576.
Mazzuca, P., Ferranti, P., Picariello, G., Chianese, L., Addeo F., 2005. Mass spectrometry in the study of anthocyanins and their derivatives: differentiation of Vitis vinifera and hybrid grapes by liquid chromatography/electrospray ionization mass spectrometry and tandem mass spectrometry. J. Mass Spectrom. 40, 83-90.
Ndoumou, D.O., Ndzomo, G.T., Djocgoue, P.F. 1996. Changes in carbohydrate, amino acid and phenol contents in cocoa pods from three clones after infection with Phytophthora megakarya Bra. And Grif. Annals of Botany 77, 153-158.
Niemenak, N., Rohsius, C., Elwers, S., Ndoumou, D.O., Lieberei, R., 2006. Comparative study of different cocoa (Theobroma cacao L.) clones in terms of their phenolics and anthocyanins contents. J. Food Comp. Anal. 19, 612-619.
Peng, Z. Hayasaka, Y., Iland, P.G., Sefton, M., Høj, P., Walters, E.J. 2001. Quantitative Analysis of Polymeric Procyanidins (Tannins) from Grape (Vitis vinifera) Seeds by Reverse Phase High-Performance Liquid Chromatography. J. Agric. Food Chem. 49, 26-31.
Presilla, M.E. 2001. The New Taste of Chocolate: A Cultural and Natural History of Cacao with Recipes. Ten Speed Press, Berkeley.
Rohr, G.E., Meier, B., Sticher, O. 1999. Quantitative reversed-phase high-performance liquid chromatography of procyanidins in Crataegus leaves and flowers. J. Chromatography A 835, 59-65.
Sánchez-Rabaneda, F., Jáuregui, O., Casals, I., Andrés-Lacueva, C., Izquierdo-Pulido, M., Lamuela-Raventós, R.M., 2003. Liquid chromatographic/electrospray ionization tandem mass spectrometric study of the phenolic composition of cocoa (Theobroma cacao). J. Mass Spectrom. 38, 35-42.
Scarpari, L.M., Meinhardt, L.W., Mazzafera, P, Pomella, A.W.V., Schiavinato, M.A., Cascardo, J.C.M., Pereira, A.G. 2005. Biochemical changes during the development of witches’ broom:the most important disease of cocoa in Brazil caused by Crinipellis perniciosa. J. Exp. Botany 56, 865-877.

27
Stafford, H. 1990. Flavonoid Metabolism. CRC, Boca Raton.
Stark, T., Bareuther, S., Hofmann, T., 2005. Sensory guided decomposition of roasted cocoa nibs (Theobroma cacao) and structure determination of taste-active polyphenols. J. Agric. Food Chem. 53, 5407-5418.
Whitacre, E., Oliver, J., van den Broek, R., van Engelen, P., Kremers, B., van der Horst, B., Stewart, M., Jansen-Beuvink, A., 2003. Predictive analysis of cocoa procyanidins using near-infrared spectroscopy techniques. J. Food Sci. 68, 2618-2622.
Wollgast, J., Pallaroni, L., Agazzi, M. & Anklam, E., 2001. Analysis of procyanidins in chocolate by reversed-phase high-performance liquid chromatography with electrospray ionization mass spectrometric and tandem mass spectrometric detection. J. Chromatogr. A 926, 211-220.
Wollgast, J., Anklam, E., 2000. Review on polyphenols in Theobroma cacao: changes in composition during the manufacture of chocolate and methodology for identification and quantification. Food Res. Int. 33, 423-447.
Zak, D.L., Keeney, P.G., 1976. Changes in cocoa proteins during ripening of fruit, fermentation, and further processing of cocoa beans. J. Agric. Food Chem. 24, 483-486.
Zhu, Q.Y., Holt, R.R., Lazarus, S.A., Orozco T.J., Keen, C.L. 2002. Inhibitory effects of cocoa flavanols and procyanidin oligomers on free radical-induced reythrocyte hemolysis. Exp. Biol. Med. 227, 321-329.
Ziegleder, G., Biehl, B., 1988. Analysis of cocoa flavour components and flavour precursors. In: Linskens, H. F., Jackson, J. P. (Eds.), Analysis of Non-Alcoholic Beverages, Springer Verlag, Berlin. pp 321-393.