
Preparation and Evaluation of Sol-Gel Made Nickel ...
123
Preparation and Evaluation of Sol-Gel Made Nickel Catalysts for Carbon Dioxide Reforming of Methane A Thesis Submitted to the College of Graduate Study and Research for Partial Fulfillment of the Requirements for the Degree of Master of Science in the Department of Chemical Engineering University of Saskatchewan Saskatoon By Haijun Sun ©Copyright Haijun Sun, July 2005. All rights reserved.
Transcript of Preparation and Evaluation of Sol-Gel Made Nickel ...

Preparation and Evaluation of Sol-Gel Made Nickel
Catalysts for Carbon Dioxide Reforming of Methane
A Thesis Submitted to the College of Graduate Study and Research
for Partial Fulfillment of the Requirements
for the Degree of Master of Science
in the Department of Chemical Engineering
University of Saskatchewan
Saskatoon
By
Haijun Sun
©Copyright Haijun Sun, July 2005. All rights reserved.

I
PERMISSION TO USE
In presenting this thesis in partial fulfillment of the requirements for a postgraduate
degree from the University of Saskatchewan, I agree that the libraries of this University
may make it freely available for inspection. I further agree that permission for copying
of this thesis in any manner, in whole or in part, for scholarly purposes may be granted
by the professor or professors who supervised my thesis work or, in their absence, by the
Head of the Department or the Dean of the College in which my thesis work was done.
It is understood that any copying or publication or use of this thesis or parts thereof for
financial gain shall not be allowed without my written permission. It is also understood
that due recognition shall be given to me and to the University of Saskatchewan in any
scholarly use which may be made of any material in my thesis.
Requests for permission to copy or to make other use of material in this thesis in whole
or part should be addressed to:
Head of the Department of Chemical Engineering___________________
University of Saskatchewan
Saskatoon, Saskatchewan (S7N 5A9)

II
ABSTRACT
Sol-gel (solution-gelation) method was used to prepare Ni-Ti and Ni-Ti-Al catalysts for
reforming of methane with carbon dioxide. This method, after optimizing the parameters
such as hydrolysis and acid/alkoxide ratio, is able to make a Ni-Ti catalyst with a surface
area as high as 426m2/g when calcined at 473K; but calcination at higher temperature
lead to dramatic decrease in surface area. XRD, XPS, TEM and SEM were used to
understand this change.
Using a packed bed reactor, the catalysts were evaluated with the reforming reaction. It
was found that the activity of the Ni-Ti catalyst increases with the Ni loading in the
range of 1-10wt%. The reduction temperature has strong effect on activity of the reduced
catalyst. Up to 973K, the activity increases with the reduction temperature; but after
973K, the activity decreases and become 0 when the temperature is over 1023K. The
Ni-Ti catalyst also deactivated as 15% after 4h of time on stream. The XRD analysis
shows that Ti3O5 formed in the catalyst after higher-temperature reduction as well as
after the reaction for a period of time. The formation of Ti3O5 may render the catalyst to
loss its activity. However, further study is expected to understand the mechanism.
TG/DTA analysis shows that both Ni-Ti and Ni-Ti-Al catalysts had carbon deposition;
but the latter maintained higher activity in a longer period of time.

III
ACKNOWLEDGEMENTS
I wish to give my sincere gratitude to my supervisor Dr. Hui Wang. I thank him for his
valuable advices and patient tutoring on such a wonderful project. His enthusiasm and
support kept me on track and his standard of excellence has given me the momentum to
pursue to higher level.
My sincere thanks go to other professors in my advisory committee, Dr. Ajay K. Dalai
and Dr. Todd Pugsley. Their encouragement, continuous instructions and ideas were
invaluable for the completion of this project.
I would also like to thank the colleagues and fellow students I had the pleasure to work
with during this project: Christian Botchwey, Abena Owusu-Boakye, Ramin Azargohar,
Dr. Deena Ferdous, Dr. Rajesh Gopinath, Nikhil Das, Dragan Cekic, Richard Blondin,
Ted Wallentiny. I would specially thank Jianguo Zhang for his friendship and support
both in and out of the workplace.
I also thank the Natural Sciences and Engineering Research Council (NSERC) for its
financial support to this project.

IV
DEDICATION
TO MY WIFE JUAN AND MY DAUGHTER CATHERINE-LE
V
TABLE of CONTENT
PERMISSION TO USE ..........................................................................................I
ABSTRACT ..........................................................................................................II
ACKNOWLEDGEMENTS ...................................................................................III
DEDICATION...................................................................................................... IV
TABLE OF CONTENT......................................................................................... V
LIST OF TABLES.............................................................................................. VII
LIST OF FIGURES ........................................................................................... VIII
ABBREVIATIONS .............................................................................................. XI
NOMENCLATURE ............................................................................................ XII
CHAPTER 1 INTRODUCTION .............................................................................1
1.1 Background of the Project.................................................................................................................... 1
1.2 Scope and Outline of the Work............................................................................................................ 4
CHAPTER 2 LITERATURE REVIEW...................................................................6
2.1 Reaction Chemistry............................................................................................................................... 6
2.2 Catalyst Development ........................................................................................................................... 8
2.3 Catalysts Preparation ......................................................................................................................... 16
2.4 Catalyst System Selection ................................................................................................................... 18
2.5 Sol-gel Method..................................................................................................................................... 19
2.6 Objectives of the Work ....................................................................................................................... 22
CHAPTER 3 EXPERIMENTAL DESCRIPTIONS...............................................24
3.1 Catalyst Preparation........................................................................................................................... 24

VI
3.2 Sol-gel Optimization Process.............................................................................................................. 26
3.3 Catalyst Characterization Techniques .............................................................................................. 28 3.3.1 BET Analysis .................................................................................................................. 28 3.3.2 Temperature Programmed Reduction ............................................................................ 28 3.3.3 Thermogravity/Differential Thermogravity Analysis........................................................ 28 3.3.4 X-ray Diffraction .............................................................................................................. 29 3.3.5 X-ray Photoelectron Spectroscopy ................................................................................. 29 3.3.6 Scanning Electron Microscopy ....................................................................................... 30 3.3.7 Transmission Electron Microscopy................................................................................. 30
3.4 Catalyst Evaluation............................................................................................................................. 30
CHAPTER 4 RESULTS AND DISCUSSION......................................................34
4.1 Catalyst Preparation and Characterization...................................................................................... 34 4.1.1 Effect of Hydrolysis Ratio and Acid/alkoxide on Catalyst Surface Area and Pore Structure................................................................................................................................................. 34 4.1.2 Thermogravity and Differential Thermogravity Analysis................................................. 41 4.1.3 Effect of Calcination on Surface Area and Pore Structure ............................................. 41 4.1.4 Effect of Calcination on Crystallite Structure .................................................................. 45 4.1.5 Effect of Calcination on Surface Composition ................................................................ 47
4.2 Catalyst Evaluation............................................................................................................................. 54 4.2.1 Thermodynamic Calculations of the Reactions .............................................................. 54 4.2.2 Effect of Reduction Temperature on Catalyst Reactivity................................................ 56 4.2.3 Effect of Reduction Time on Catalyst Reactivity............................................................. 61 4.2.4 Effect of Flow Rate of Feed Gases on Catalyst Reactivity............................................. 64 4.2.5 Effect of Nickel Load on Catalyst Reactivity ................................................................... 69 4.2.6 Effect of the Integration of Aluminium on Catalyst Reactivity......................................... 76
CHAPTER 5 CONCLUSIONS AND RECOMMENDATIONS .............................85
REFERENCES ...................................................................................................88 APPENDIX…………………………………………………………………………......95

VII
LIST of TABLES
Table 2.1 Ni-containing catalysts investigated for DRM………………………….……..9 Table 2.2 Performance of catalysts made by different methods………………...………17 Table 3.1 Experimental design using Design Expert……………………………….......27 Table 4.1 Effect of hydrolysis ratio and acidity on surface area and pore diameter……35 Table 4.2 Effect of gellation condition on surface area and porosity of Ni-Ti xerogel
composite……………………………………………………………………...40 Table 4.3 Heat effect on the textural properties of sol-gel made Ni-Ti xerogel
catalysts…………………………………………………………………….....43 Table 4.4 XPS Analysis of the Ni-Ti composite xerogel catalysts treated under different
conditions……………………………………………………………………..50
VIII
LIST of FIGURES
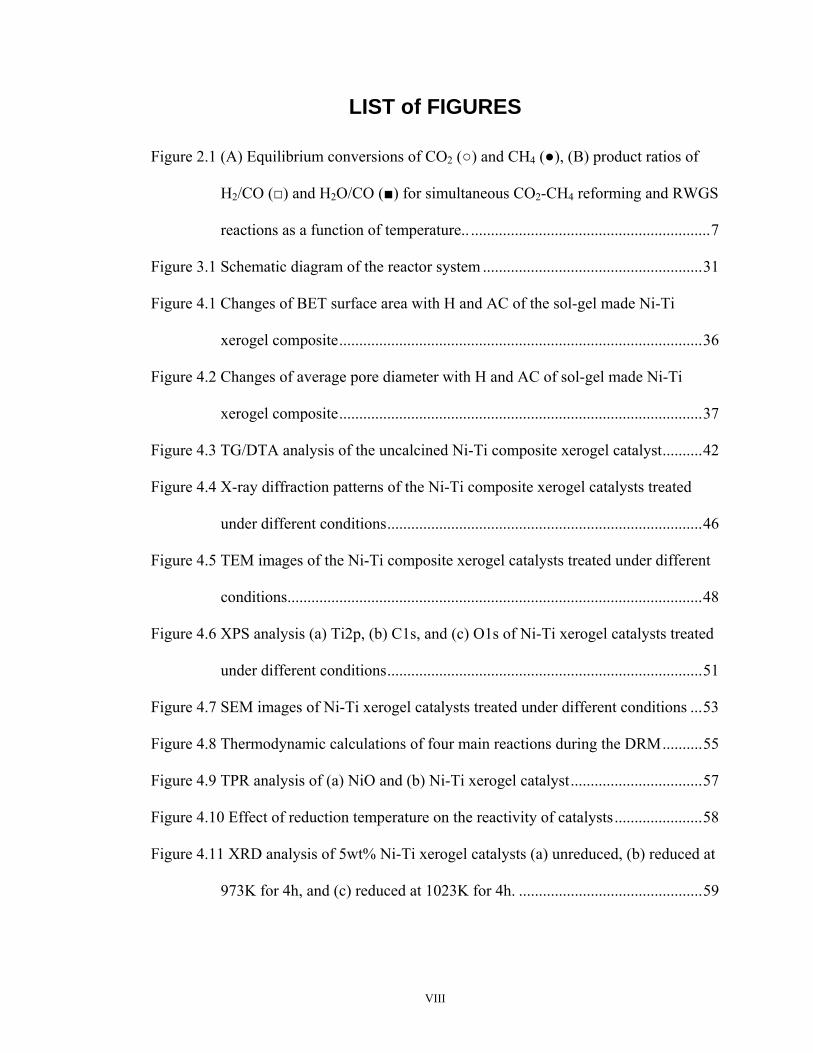
Figure 2.1 (A) Equilibrium conversions of CO2 (○) and CH4 (●), (B) product ratios of
H2/CO (□) and H2O/CO (■) for simultaneous CO2-CH4 reforming and RWGS
reactions as a function of temperature.. ............................................................7
Figure 3.1 Schematic diagram of the reactor system .......................................................31
Figure 4.1 Changes of BET surface area with H and AC of the sol-gel made Ni-Ti
xerogel composite...........................................................................................36
Figure 4.2 Changes of average pore diameter with H and AC of sol-gel made Ni-Ti
xerogel composite...........................................................................................37
Figure 4.3 TG/DTA analysis of the uncalcined Ni-Ti composite xerogel catalyst..........42
Figure 4.4 X-ray diffraction patterns of the Ni-Ti composite xerogel catalysts treated
under different conditions...............................................................................46
Figure 4.5 TEM images of the Ni-Ti composite xerogel catalysts treated under different
conditions........................................................................................................48
Figure 4.6 XPS analysis (a) Ti2p, (b) C1s, and (c) O1s of Ni-Ti xerogel catalysts treated
under different conditions...............................................................................51
Figure 4.7 SEM images of Ni-Ti xerogel catalysts treated under different conditions ...53
Figure 4.8 Thermodynamic calculations of four main reactions during the DRM..........55
Figure 4.9 TPR analysis of (a) NiO and (b) Ni-Ti xerogel catalyst.................................57
Figure 4.10 Effect of reduction temperature on the reactivity of catalysts......................58
Figure 4.11 XRD analysis of 5wt% Ni-Ti xerogel catalysts (a) unreduced, (b) reduced at
973K for 4h, and (c) reduced at 1023K for 4h. ..............................................59

IX
Figure 4.12 Ratio of H2/CO in effluent over 5wt% Ni-Ti catalysts reduced at different
temperatures....................................................................................................62
Figure 4.13 Effect of reduction time at 973K on the reactivity of catalysts ....................63
Figure 4.14 XRD analysis of 5wt% Ni-Ti xerogel catalysts (a) unreduced, (b) reduced at
973K for 2h, (c) reduced at 973K for 4h, and (d) reduced at 973K for 6h.....65
Figure 4.15 Effect of flow rate of feed gas on the reaction rate of catalysts reduced at
973K for 2h.....................................................................................................66
Figure 4.16 Effect of flow rate of feed gas on the conversion of catalysts reduced at
973K for 2h.....................................................................................................68
Figure 4.17 Effect of Ni load on the reaction rate with respect to CH4, (×): 10wt%, (∆):
5wt%, (■): 3wt%, and (♦): 1wt% ...................................................................70
Figure 4.18 Effect of Ni load on the reaction rate with respect to CO2, (×): 10wt%, (∆):
5wt%, (■): 3wt%, and (♦): 1wt%. ..................................................................71
Figure 4.19 XRD analysis of 5wt% Ni-Ti xerogel catalyst (a) blank, (b) reduced at 973K
for 2h, and (c) after 4h reaction…………………………………………..…72
Figure 4.20 DTA analysis of 10wt% Ni-Ti xerogel catalyst (a) blank, (b) reduced at
973K for 2h, and (c) after 4h reaction ............................................................74
Figure 4.21 TG analysis of 10wt% Ni-Ti xerogel catalyst (a) blank, (b) reduced at 973K
for 2h, and (c) after 4h reaction ......................................................................75
Figure 4.22 Reaction performance of 5wt% Ni-Ti-Al catalyst over DRM......................77
Figure 4.23 XRD analysis of 5wt% Ni-Ti-Al xerogel catalyst (a) blank, (b) reduced at
973K for 2h, and (c) after 10h reaction ..........................................................79
Figure 4.24 The ratio of H2 to CO in effluent over 5wt% Ni-Ti-Al catalyst. ..................81

X
Figure 4.25 DTA analysis of 5wt% Ni-Ti-Al catalyst (a) blank, (b) reduced at 973K for
2h, and (c) after 10h reaction..........................................................................82
Figure 4.26 TG analysis of 5wt% Ni-Ti-Al catalyst (a) blank, (b) reduced at 973K for 2h,
and (c) after 10h reaction................................................................................83

XI
ABBREVIATIONS
CCD: Central Composite Design
DRM: Dry Reforming of Methane
GHGs: Greenhouse gases
LV: Linear Velocity, m/s
MFC: Mass Flow Controller
RSM: Methodology of Response Surface
RWGS: Reverse Water-Gas Shift
SA: Surface Area (m2/g)
SEM: Scanning Electron Microscopy
SMSI: Strong Metal-Support Interaction
SV: Space Velocity, SCCM/g-cat/h
TEM: Transmission Electron Microscopy
TGA: Thermogravimetric Analysis
TG/DTA: Thermal Gravity/Differential Thermogravimetric Analysis
TOF: Turn Over Frequency
TPO: Temperature Programmed Oxidation
TPH: Temperature Programmed Hydrogenation
WGS: Water Gas Shift
XRD: X-ray Diffraction
XPS: X-ray Photoelectron Spectroscopy
XII
NOMENCLATURE
ABET BET surface area (m2/g)
AC Acid/alkoxide ratio
at% Atomic percentage
H Hydrolysis ratio, the ratio of water to alkoxide
∆H Reaction enthalpy (kJ/mol)
m Coordination number
M Transition metals
R Alkyl or aryl group
Raverage Average pore diameter (Å)
wt% Weight percentage
X Alkyl group or hydrogen

1
CHAPTER 1
INTRODUCTION
1.1 Background of the Project
Carbon dioxide is released into the atmosphere when fossil fuels such as oil, natural gas,
and coal are burned. As a result of the tremendous world-wide consumption of such
fossil fuels, the concentration of CO2 in the atmosphere has increased over the past
century, now rising at a rate of about 1ppm per year, estimated to be around 2 ×10¹⁵g of
carbon per annum [1]. The increase in the concentration of greenhouse gases (GHGs),
particularly CO2, in the atmosphere is believed to be responsible for the major changes
in global climate. A correlation of mean global temperature rise with atmospheric CH4
and CO2 concentration, drastic changes in the annual temperature cycle of the Northern
Hemisphere, and increasing volatility of global weather patterns have been reported [1].
In order to reduce the emitting rate of CO2 into the atmosphere, most industrialized
countries were required to reduce their GHGs emissions by the Kyoto Protocol, in which
Canada is expected to reduce its GHGs emissions to 6% below the 1990 levels in the
coming decade. Tremendous adverse impacts on national and provincial economy would
be resulted if the emissions are forced to be reduced without economically justifiable
technologies which are able to transfer CO2 into value-added materials or with low
2
operation cost. Consequently, there has been increased interest in a better understanding
of CO2 removal, disposal, utilization and CO2 permanent sequestration.
A lot of new initiatives for CO2 sequestration have been raised, examples including CO2
sequestration in geological formations including oil and gas reservoirs, unmineable coal
seams, and deep saline reservoirs; direct injection of CO2 into deep ocean and
stimulation of phytoplankton growth; terrestrial sequestration of CO2 with natural
resources like vegetation and soils [2]; and mineral carbonation [3,4] to permanently
sequester CO2 by injecting it into deep underground well and detained by reacting with
stones to form carbonate. However, all these initiatives are far from mature with
tremendous technical and scientific difficulties to overcome. Possible spill of CO2 in the
future is another concern of these technologies. Thus it is more attractive to sequester
CO2 by converting it into value added products via chemical reactions.
Reforming of CH4 with CO2, also known as dry reforming of methane (DRM), which
was originally initiated by J. Lang in 1888 and thoroughly explored by Fischer and
Tropsch in 1928 [5], has become the preeminent reaction to convert these two reactants.
DRM, combining two prominent greenhouse gases, CO2 and CH4, is regarded as a
potential route to sequester CO2 by converting them into value added products, synthesis
gas (CO+H2), from which many commodity chemicals and products can be produced.
As the advanced and cost effective CO2 separation technologies are developed, pure CO2
feed stream can be obtained for the DRM. In addition, DRM unit can be built along with
the power plant, which discharges one third of the total CO2 emission, to save the cost
for storage and transportation.

3
DRM also demonstrates the other advantages. Due to its strong endothermic character, it
is regarded as a potential route to store and transmit energy. The effluent syngas, with a
ratio of H2/CO less than unit, is a preferred feedstock for the Fischer-Tropsch reaction to
produce higher hydrocarbons and oxygenated derivatives [6]. DRM also supplies an
alternative to produce hydrogen which is widely used in different industries, such as
bitumen upgrading, refining, and now in proton exchange membrane fuel cells.
Although DRM has shown great economic and environmental advantages, realization of
this process is full of difficulties. DRM is a strong endothermic reaction. It requires a
very high temperature (>1123K) to obtain an acceptable conversion. Without the
presence of a catalyst, the reaction rate is too slow to be economically justifiable, and, in
addition, a large amount of char may form due to the crack of CH4 and
disproportionation of CO. These difficulties necessitate the presence of a catalyst which
can accelerate the reaction at an industrially feasible temperature (<1023K) and
kinetically inhibit the char formation.
During the past two decades, numerous studies have been conducted attempting to
understand the mechanism of the DRM reaction on different catalysts and to develop
industrially usable catalysts [1,7,8]. Most group VIII metals are catalytically active for
this reaction. The characters of active metals, supports and methods of preparations have
significant effect on the performance of catalysts [1]. Though noble metals, such as Pt,
and Rh, were reported more resistant to char deposition [1], nickel is regarded as the
most prominent active component due to its wider availability and lower cost. As one of
the most used catalyst supports, titania has been proven the ability to decrease carbon

4
deposit [1]. It was also reported that the strong metal-support interaction could promote
the dispersion of active metal and mitigate the carbon formation, and the sol-gel catalyst
preparation method can improve the interaction between metals. Although Ni-Ti catalyst
made by sol-gel has been investigated for other reactions [9], its performance for DRM
at high temperature (above 900K) remains unknown.
1.2 Scope and Outline of the Work
The hypothesis for this project is that Ni-Ti catalyst made by sol-gel has stronger
interaction between components and the interaction would help to inhibit carbon
formation, thus prolonging the life of the catalyst. The work of this project comprises of
two parts: preparation of Ni-Ti catalysts using sol-gel method and evaluation of the
sol-gel made Ni-Ti catalysts with DRM. In the catalyst preparation part, the factors
which influence the surface area and pore structures are to be optimized. The results will
provide reference for future preparation of sol-gel Ni-Ti catalysts as well as nano
materials. Instrumental characterizations which could help understand the correlations
between influential factors will be conducted. In the catalyst evaluation part, several
factors which influence the performance of catalysts will be evaluated. The post reaction
characterizations will be conducted to explain the experimental results. Based on the
experimental results, in order to improve the performance of catalyst, some
modifications to the catalyst system will be conducted.
This thesis consists of 5 chapters, including the literature review, experimental
procedures, results and discussion, conclusions and recommendations. Following this
chapter, chapter 2 discusses the fundamentals of DRM including the reactions involved

5
and their chemistry and thermodynamics, the development in catalysts for DRM, and the
sol-gel method of catalyst preparation, reasoning out the objectives of this research.
Chapter 3 introduces the experimental procedures and instrumental analysis used in this
research, including equipment, chemicals and other materials. Chapter 4 presents the
experimental results, gives the respective discussion and leads to conclusions. Chapter 5
lists the research conclusions drawn from Chapter 4, and also includes recommendations
for future research.

6
CHAPTER 2
LITERATURE REVIEW
2.1 Reaction Chemistry
The reaction equilibrium for the production of synthesis gas from CH4 and CO2,
CH4 + CO2 2H2 + 2CO (∆H0=247.3 kJ/mol CH4) (1)
is influenced by the simultaneous occurrence of the reverse water-gas shift (RWGS)
reaction
CO2 + H2 CO + H2O (∆H0= 41.17 kJ/mol) (2)
which results in H2/CO ratio less than unity. The overall equilibrium conversion of CH4
and CO2 and the H2/CO and H2O/CO ratios of these two reactions for a feed stream at
a total pressure of 1 atm (CH4/ CO2/He = 1/1/1.8) are shown in Figure 2.1 [1]. The
conversion of CO2 is always greater than that of CH4, due to the RWGS equilibrium. In
practice, this is advantageous when producing gas streams with a H2/CO ratio of 1 or
lower are necessary. For example, to produce alkanes directly from synthesis gas, the
following reaction stoichiometry is observed:
2nCO + (n + 1)H2 C n H (2n+2) + nCO2 (3)
and the required H2/CO feed ratio is (n + 1)/2n, which is less than or equal to unity.

7
T (K)
Figure 2.1. (A) Equilibrium conversions of CO2 (○) and CH4 (●), (B) product ratios of
H2/CO (□) and H2O/CO (■) for simultaneous CO2-CH4 reforming and RWGS reactions
as a function of temperature. Reaction conditions: Ptot = 1atm; CH4/CO2/He = 1/1/1.8
[1].

8
As shown in Figure 2.1, it is thermodynamically preferable for DRM when the reaction
temperature is more than 1000K. However, due to safety and economic concerns, it is
preferred to operate the reaction at low temperature from the industrial standpoint. In
addition to the DRM and RWGS reactions, there are two other side reactions which
occur simultaneously. The CH4 decomposition
CH4 C(s) + 2H2 (∆H0 = 74.85 KJ/mol) (4)
and CO disproportionation
2CO CO2 + C (s) (∆H0 = -173.46 KJ/mol) (5)
These two reactions are directly responsible for the carbon deposition on the catalyst. If
the reaction temperature is lowered to a range from 800~900K, it is more preferential to
carbon depositions than to DRM. Therefore, a catalyst which can kinetically inhibit the
carbon formation and simultaneously improve the DRM reaction rate appears very
necessary.
2.2 Catalyst Development
Most group VIII metals are active for DRM. Although noble metal containing catalysts,
such as Pt [10] and Rh [7], have shown better properties in stability and carbon
deposition resistance than Ni catalysts, Ni was chosen as the active metal in this project
due to its wider availability. Table 2.1 shows the Ni-containing catalysts have been
investigated for DRM. Most Ni catalysts have shown competitive activity [1], and some
of them are relatively stable when certain type of supports are employed [11,12].

9
Table 2.1. Ni-containing catalysts investigated for DRM
Support Reference Support Reference
Al2O3 13,14 MgO/CaO 15
Al2O3-CaO 16,17 MgO/SiO2 18
Al2O3-CaO-MgO 19 MgO/SiO2/Al2O3 29
Al2O3-CeO2 20 MgCO3 5
Al2O3-La2O3 20,8,21 La2O3 22
Al2O3-MgO 20,19 Nb2O5 23
Al2O3-MnO 24,25 SiC 26
MgAl2O4 27 SiO2 28
Al2O3-SiO2 29 SrO 30
BaO 30 SrO-SiO2 31
C 32,33 TiO2 34,11,32,33
CaO 30 ZnO 34
CeO2 35 ZrO2 35
ZrO2-CeO2 35,36,37 Zeolite 38
MgO 12,30,
32,33,

10
The mechanism for CH4 adsorption and dissociation on transition metal surface has been
claimed to be both directed [39] and precursor mediated [40]. Studies of the interaction
of CH4 with a Ni(111) surface suggested that in order to dissociate, CH4 must be
distorted from it tetrahedral shape to form a trigonal pyramidal structure, after which
tunnelling of an H atom through the activation barrier occurs [1]. Nevertheless, neither a
quantitative model nor a general consensus exists concerning the mechanism for CH4
adsorption and dissociation on transition metal surfaces. It has been proven that CH4
decomposition preferentially occurs on small Ni crystallites, and that the structure
sensitivity of CH4 dissociation on Ni surfaces, along with activity decrease is in the
order of Ni(110)> Ni(100)> Ni(111) [1]. It was suggested that CHx fragments are more
likely to locate at a site on the metal surface which completes its tetravalency [1]. It is
also observed that different CHx species during the adsorption of hydrocarbons formed
on different Ni catalysts and concluded that CHx intermediates with lower values of x
were more likely to form carbonaceous deposits [1].
The stepwise adsorption of CH4 and then its decomposition into CHx fragments on a
metal surface are shown as follows [1]:
CH4 + 2M CH3-M + H-M (6)
CH3-M + 2M CH2-M2 + H-M (7)
CH2-M2 + 2M CH-M3 + H-M (8)
CH-M3 + 2M C-M4+ H-M (9)

11
where Mn is an ensemble of n surface metal atoms. This mechanism demonstrates the
high probability of structure sensitivity in the formation of surface carbon because of the
large ensemble of metal atoms needed.
The decomposition of CH4 on supported transition metals has been studied extensively.
In general, the decomposition yields surface carbon, H2, C2H6, and C2H4 [27]. In DRM,
CO and H2 are major components in the effluent mixture. The CO comes from both CH4
and CO2. Thus, it seems plausible that during CO2-CH4 reforming, CHx species formed
on a transition metal surface may react with either oxygen species or hydroxyl groups,
generated via dissociative adsorption of CO2, on the support to yield CO and H2 [1].
It is generally accepted that CO2 chemisorption and dissociation on a transition metal
surface is dominated by electron transfer and requires the formation of an anionic CO2-
precursor , and CO2 activation is reported to be structure sensitive [1].
As mentioned earlier, the origin of inactive carbon during DRM may occur via either
CH4 decomposition or CO disproportionation. CO disproportionation is exothermic;
thus, the equilibrium constant decreases with increasing temperature. Conversely, CH4
decomposition is endothermic; thus the equilibrium constant increases with increasing
temperature. The calculation illustrates that for any reaction mixture of H2, CO, H2O,
CO2, and CH4 at thermodynamic equilibrium, the extent of graphitic carbon deposition
during reforming decreases at higher reaction temperatures, in agreement with
experimental observations reported in the literature [1]. This would suggest that the main
contributor to carbon deposition is CO disproportionation. CO dissociation on transition

12
metal surface is initiated via adsorption at a multiple coordinated site [1]. This adsorbed
CO species then proceeds through a bent transition state lying essentially parallel to the
surface prior to dissociation [1]. After dissociation on Ni, for example, subsequent CO
adsorption on the C/Ni surface induces migration of carbon to subsurface Ni layers [41].
These adsorbed carbon atoms induce local reconstruction of the Ni surface, thereby
lengthening nearby Ni-Ni bond and permitting a deeper carbon penetration into the Ni
lattice [1]. At this point, carbon diffusion through the metal lattice may occur until the
carbon atoms deposit in eventual graphitic layers on the back side of the metal
crystallite. It has been suggested that carbon atoms, formed by CH4 decomposition on
the (100) and (110) Ni surfaces, diffuse across the Ni particle surface and by deposition
on the (111) surfaces form ordered graphite layers aligned parallel to the metal–carbon
interface [42]. The driving force for carbon diffusion in this process has been assumed to
be a carbon concentration gradient.
To evaluate the effect of promoters and supports, modifications to the support, as shown
in Table 2.1, have been investigated. It was observed that carbon deposition is
suppressed when the metal is supported on a metal oxide with strong Lewis basicity
[43]; i.e., increasing Lewis basicity of the support increases the ability of the catalyst to
chemisorb CO2 [1,16,25]. Increasing the concentration of adsorbed CO2 reduces carbon
formation via CO disproportionation by shifting the equilibrium concentrations.
However, Tang et al. [19], and Zhang et al. [44] illustrated that the addition of MgO or
CaO to Ni/Al2O3 greatly increased both catalyst activity and carbon deposition during
CO2 reforming of CH4. Attempting to clarify the issue of carbon deposition during CO2
reforming of CH4, Swaan et al. [45] and Tsipouriari et al. [46] independently used
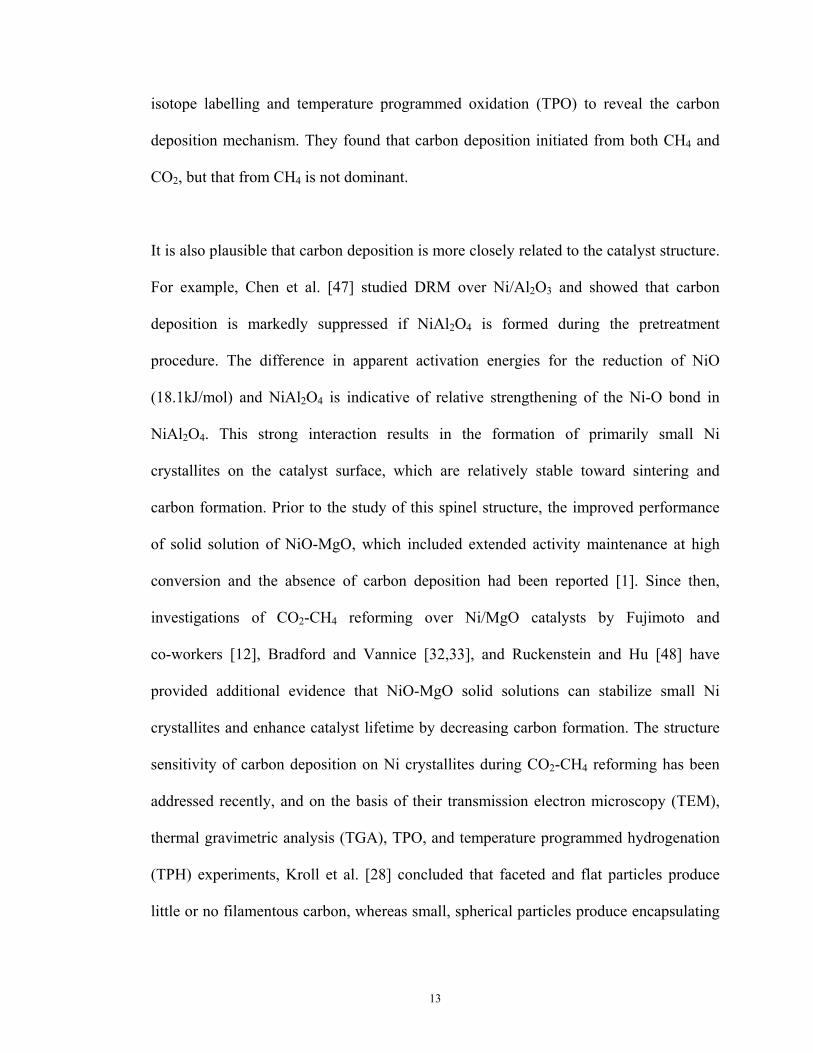
13
isotope labelling and temperature programmed oxidation (TPO) to reveal the carbon
deposition mechanism. They found that carbon deposition initiated from both CH4 and
CO2, but that from CH4 is not dominant.
It is also plausible that carbon deposition is more closely related to the catalyst structure.
For example, Chen et al. [47] studied DRM over Ni/Al2O3 and showed that carbon
deposition is markedly suppressed if NiAl2O4 is formed during the pretreatment
procedure. The difference in apparent activation energies for the reduction of NiO
(18.1kJ/mol) and NiAl2O4 is indicative of relative strengthening of the Ni-O bond in
NiAl2O4. This strong interaction results in the formation of primarily small Ni
crystallites on the catalyst surface, which are relatively stable toward sintering and
carbon formation. Prior to the study of this spinel structure, the improved performance
of solid solution of NiO-MgO, which included extended activity maintenance at high
conversion and the absence of carbon deposition had been reported [1]. Since then,
investigations of CO2-CH4 reforming over Ni/MgO catalysts by Fujimoto and
co-workers [12], Bradford and Vannice [32,33], and Ruckenstein and Hu [48] have
provided additional evidence that NiO-MgO solid solutions can stabilize small Ni
crystallites and enhance catalyst lifetime by decreasing carbon formation. The structure
sensitivity of carbon deposition on Ni crystallites during CO2-CH4 reforming has been
addressed recently, and on the basis of their transmission electron microscopy (TEM),
thermal gravimetric analysis (TGA), TPO, and temperature programmed hydrogenation
(TPH) experiments, Kroll et al. [28] concluded that faceted and flat particles produce
little or no filamentous carbon, whereas small, spherical particles produce encapsulating

14
carbon. Oh-Shim Joo et al. [49] observed that the amorphous carbon could cover all the
active metal sites and that the filament carbon does not cover the active metal.
Several recent investigations of supported Ni [11,12] catalysts have shown that carbon
deposition can be greatly suppressed when TiO2 or MgO is used as the catalyst support.
As mentioned earlier, DRM more preferentially occurs on small Ni particles than the
carbon formation reactions. The decomposition of CHx requires large assembles of metal
atoms. When TiO2 or MgO is used as the support, it is helpful to form well dispersed
and small Ni particles on the surface of catalysts. The SMSI effect facilitates the
elimination of large ensembles of nickel on the surface of TiO2 based catalyst [50] and a
solid solution formed in the MgO based catalyst which induce very small active sites
during the activation of the catalyst [12]. TiO2, a support with the back spill-over
property, can also influence the carbon deposition behaviour on the surface of active
metals. TiO2 can act as an O donor, from which O atoms will spill back to the surface Ni
atom, which is acting as an O acceptor. The back spilled O can react with the carbon
formed on the surface of the catalysts or the decomposed CHx so as to suppress the
carbon formation.
In order to remove the deposited carbon on the Ni/α-Al2O3 catalyst, L. Mleczko initiated
the integration of fluidized bed reactor into syngas production [51]. Combustion of
deposited carbon from the surface of catalysts can not only expose the active sites to the
reacting molecules but also provide certain heat to sustain this high endothermic
reaction. However, it was found that the unreduced catalyst had significant lower
activity than the reduced catalyst [52]. So the external catalyst regeneration might be

15
necessary. In addition, the problem of metal dusting due to the high CO content in the
reformed gas has to be taken into account with respect to the construction of the
reformed gas boiler. These concerns make the development of a catalyst with low
carbon deposition more attractive.
In summary, it appears that both CH4 decomposition and CO disproportionation can
contribute to the formation of inactive carbon deposits during DRM, with the relative
contribution of each depending on the reaction conditions. Available data indicate that
carbon formation is dependent on several parameters, such as the metal, metal crystallite
structure, metal–support interactions, support acidity and basicity. Although the precise
mechanism by which the dissociative adsorption of CH4 occurs on a metal surface is
unknown, it is reasonable to expect that CH4 decomposition is dependent on the
properties of geometric structure of the metal surface, and it is very likely to be a
structure-sensitive reaction. Dissociation of CH4 under CO2-CH4 reforming conditions
yields a distribution of CHx species that depends on both the metal and the support.
Two types of carbon can form during the DRM, amorphous and filament carbon. The
amorphous carbon can encapsulate the Ni crystallite to deactivate the catalyst and the
filament carbon can grow without significant influence on the activity of the catalyst.
Sinter of Ni crystallite may also deactivate the catalyst. Supports which may interact or
form solid solution with Ni can stabilize the Ni crystallites from carbon deposition and
sintering.

16
2.3 Catalysts Preparation
In practice, different catalyst preparation methods have been used to adjust the structure
of supports. Consequently, physical and chemical properties of the catalysts are modified.
As discussed formerly, the status of the existence of Ni in the catalyst, the particle size
of Ni, and the environment of the Ni particle have great effect on the performance of the
catalyst. Ni catalyst prepared by different methods has demonstrated different activity
and stability, as shown in Table 2.2. Wet impregnation [12], co-precipitation [12,53],
sol-gel [6,36], and their combinations of these methods [54] are mostly reported. Some
other methods [55,56] were also found in literature.
Tomishige et al. [12] investigated the Ni/MnO2 catalyst prepared by co-precipitation and
impregnation methods. The co-precipitated solid solution catalyst containing low nickel
load has shown low carbon deposition for 3000h of time on stream, attributing to the
small nickel particles dispersed on the support which inhibits carbon formation.
Comparing to the wet impregnated catalyst, the co-precipitated catalyst has shown
comparable advantage in catalyst activity and life.
Tang et al. [6] investigated γ -Al2O3 based Ni catalyst made by different techniques. The
catalyst by impregnating Ni onto sol-gel made γ-Al2O3 showed the highest activity and
stability with the lowest coke deposition. The catalyst made by sol-gel had compatible
activity and stability. However, the catalyst made by impregnating Ni onto the
commercial γ-Al2O3 demonstrated the poorest performance and the reactor was plugged
within 3.5h by the formed carbon.

17
Table 2.2. Performance of catalysts made by different methods
Catalyst Preparation
method
Activity Carbon
Formation
Time on
Stream (h)
Reference
Ni0.03Mg0.97O Coprecipitation 240R 0.05CR1 3000 12
3mol% Ni/MgO Impregnation 138R 0.15CR1 240 12
10wt% Ni/γ-Al2O3
Impregnation N/A 0.095CR2 3.5 6
10wt% Ni/γ- Al2O3
Sol-gel N/A 0.003CR2 N/A 6
10wt% Ni/γ- Al2O3
Sol-gel + Impregnation
N/A 0 80 6
Ni/ Al2O3 Sol-gel N/A low 60 13
8wt% Ni/TiO2 Impregnation N/A Very low 110 11
R: Reaction rate (µmol.g-1.s-1), TO: Turn over frequency (s-1)
CR1: Carbon deposition rate (µmol-C. g-1.s-1), CR2: Carbon formation rate (g-C.g-cat-1.h-1)

18
Hwang et al. [55] applied the supported Ni catalyst with the pillared clay base to DRM.
It was found that the structure and properties of supports obtained by this method
affected carbon deposition behaviour on the surface of the catalyst [53,55].
In conclusion, catalyst preparation method has shown significant effect on inhibiting
carbon formation and stabilizing the Ni crystallites. Co-precipitation and sol-gel
methods, which can promote the interaction between precursors, have shown better
suitability for the catalysts for DRM than wet impregnation method.
2.4 Catalyst System Selection
In this thesis work, Ni-Ti system was chosen to be investigated. The catalyst was made
using sol-gel method. The initiative was based on the following reasons.
First, although noble metals have shown superior performance to the Ni catalysts, the
wide availability and cheap price of nickel make the latter more attractive.
Second, various researches have demonstrated that TiO2 supported Ni catalyst posses
good stability and lower carbon formation rate as shown in Table 2.2. It was concluded
that the low carbon formation rate was due to the SMSI effect between TiO2 and Ni. The
SMSI effect facilitates the formation of small active sites. It can not only inhibit the
carbon formation but also stabilize the Ni crystallite.
Third, the sol-gel method provides close reaction between precursors and has the nature
to improve interaction between them. As shown in the previous part, the sol-gel made

19
catalysts have shown better performance than the wet impregnation made catalysts for
DRM. The sol-gel made Ni-Ti catalyst has shown good activity and stability for other
reactions [9].
2.5 Sol-gel Method
The sol-gel method is a versatile solution process for making ceramic, glass materials,
and catalysts. In general, the sol-gel process involves the transition of a system from a
liquid “sol” (mostly colloidal) into a solid “gel” phase. Applying the sol-gel process, it is
possible to fabricate ceramic or glass in a wide variety of forms: ultra-fine or spherical
shaped powders, thin film coatings, ceramic fibres, microporous inorganic membranes,
monolithic ceramics and glasses, or extremely porous aerogel materials. The starting
materials, known as precursors, used in the preparation of the “sol” are usually inorganic
metal or metal compounds. The most obvious precursors are molecules having already
metal-oxygen bonds, namely metal alkoxides M(OR)n or oxoalkoxides MO(OR)n ( R=
saturated or unsaturated organic group, alkyl or aryl). At its simplest level, sol-gel
chemistry with metal alkoxides can be described in terms of two classes of reactions:
Hydrolysis: -M-OR + H2O -M-OH +ROH (10)
Condensation: -M-OH + XO-M- -M-O-M- + XOH (11)
where X can be either H or R (alkyl group).
Such a description oversimplifies the overall process because it does not correctly
represent the molecular formulas of the intermediates and end products, nor does it
depict the simultaneous occurrence of the two reactions. However, this

20
oversimplification captures the key phenomenological idea that a three-dimensional gel
network comes from the condensation of partially hydrolyzed species.
The main advantages of sol-gel techniques for the preparation of materials are low
temperature of processing, versatility, flexible rheology allowing easy shaping and
embedding. This technique has been widely employed in catalysis field. The most
important characteristic of the sol-gel preparation of catalytic materials is its ease of
control that translates into the following advantages:
(1) the ability to maintain high purity (because of purity of starting materials);
(2) the ability to change physical characteristics such as pore size distribution and
pore volume;
(3) the ability to vary compositional homogeneity at a molecular level;
(4) the ability to prepare samples at low temperatures;
(5) the ability to introduce several components in a single step;
(6) the ability to produce samples in different physical forms.
Factors that influence the properties of final products prepared using sol-gel technique
include hydrolysis ratio, acidity of the hydrolysant, gelation condition, drying condition
and procedures, and solvent property.
Hydrolysis ratio, H, defined as the moles of water per mole of metal alkoxide, M(OR)m,
is considered one of the most important influential factors on the properties of the
sol-gel made composite. When H<1, infinite network seldom forms due to the low
functionality of the precursor towards condensation. Few M-OH groups are available for

21
cross-linking gelation or precipitation when there is no local excess of water. When
1<H<m, polymeric gels can form. And when H>m, cross-linked polymers, particulate
gels, or precipitates can form due to the existence of excess amount of water.
pH value, usually the acidity of the precursor solution or hydrolysant (AC) affects the
gelation time, defined as the time it takes for a solution to undergo a rapid rise in
viscosity that corresponds to the transition from a viscous fluid to an elastic gel. This
effect may improve the cross-link of precursors so as to result in a better porous
structure. It has been found that an acidic precursor solution promotes the formation of
small metal crystallites [57].
Gelation is a complex process that may combine a number of physical and chemical
sub-processes. Varying gelation temperature effectively alters the relative rate of these
competing processes. Solvent can change the nature of an alkoxide through solvent
exchange or affect the condensation reaction directly.
Drying process affects the porous structure due to the different extent to which the
original structure is destroyed in the removal of solvent from it. Materials dried by
different techniques are named differently. Aerogel means the composite dried in the
supercritical solvent medium. This drying process preserves the fine porous structure
developed during the gelation by reducing the surface tension between the solvent and
the solid. Xerogel is given to the composite after conventional drying by heating the
material in air, where the structure of micropores cannot be preserved. So some solvent
with low surface tension may help xerogel to preserve the porous structures. Calcination

22
procedure can also greatly affect the surface area of the sol-gel made composite. It was
reported [9] that the Ni-Ti aerogel heated at 1K/min posses much higher surface area
than the one heated at 5K/min.
2.6 Objectives of the Work
This thesis work is to prepare Ni-Ti catalysts which are stable for the DRM using sol-gel
method. To develop an industrially usable catalyst, the following requirements have to
be met. First of all, the raw material must be available and relatively cheap. Secondly,
the preparation process should be as simple as possible. Thirdly, the catalyst must have
acceptable activity, selectivity, and stability. Literature review has shown that nickel is
one of the cheapest metals which are active for DRM and that the sol-gel made Ni-Ti
catalyst would mitigate carbon formation and thus facilitate longer catalyst life.
However, the performance of Ni-Ti sol-gel made catalyst needs to be evaluated with
DRM at higher temperature around 900 to 1000K. If the Ni-Ti catalyst wouldn’t reach
the expectation, some adjustment to this system should be conducted.
The research work is planned as follows:
1. Because surface area is a very important property for catalyst and calcination
temperature has significant effect on the final surface area of sol-gel made catalysts, two
important parameters of sol-gel synthesis, the hydrolysis ratio and the hydrolysant
acidity, will optimized in terms of the surface area of the catalyst. Then the effect of
calicination temperature on surface area and pore size will be studied.
2. Instrumental analyses such as X-ray diffraction (XRD), X-ray photoelectron
spectroscopy (XPS), TG/DTA, scanning electron microscopy (SEM) and TEM will be

23
used to characterize both surface and bulk properties so as to further understand the
impact of sol-gel processing and calcination conditions on the catalyst properties.
3. The reduction of catalyst will be studied and the optimal catalyst reduction condition
such as reduction temperature, reduction time in terms of catalyst activity will be
determined.
4. The effect of feed gas flow rate and reaction temperature will be evaluated in terms of
catalyst activity, selectivity and stability for DRM reaction.
5. Adjustment to the Ni-Ti system by adding the third component to improve the catalyst
activity and stability will conducted when necessary.

24
CHAPTER 3
EXPERIMENTAL DESCRIPTIONS
3.1 Catalyst Preparation
The catalysts used in this study were prepared by sol-gel method. The precursors were
Ni(NO3)2·6H2O (98%, Lancaster, Lancaster Synthesis Inc., Pelham, NH) or
Ni(Ac)2.6H2O (99+%, Alfa Aesar, A Johnson Mathey Company, Ward Hill, MA),
Ti(BuO)4 (99+%, Alfa Aesar, A Johnson Mathey Company, Ward Hill, MA) and
Al(NO3)3.9H2O (>98%, EMD, Gibbstown, NJ). MeOH (>99.9%, Burdick & Jackson,
Muskegon, MI) was used as the solvent for both the precursors solution and the
hydrolysant. The molar ratio of Ti/MeOH in the precursor solution was kept at 0.12.
Hydrolysis process was catalyzed by HNO3 (69-70%, EMD Chemicals Inc., Gibbstown,
NJ). For every batch of preparation, the amount of each reactant was calculated in order
to obtain 10g of catalysts. The hydrolysant was made of proper amount of distilled
water, nitric acid and 20mL MeOH. The Ni load was 10wt% for all catalysts during the
sol-gel optimization, where the Ni load is defined as weight percent of elemental Ni in
the catalyst. Catalysts with different Ni load, varied from 1wt% to 10wt%, for the
activity and stability evaluation were prepared under the determined condition.

25
The catalyst preparation procedure is described below. Required amounts of Ti(BuO)4
and Ni(NO3)2·6H2O were dissolved in MeOH (Recipe of each run is shown in Appendix
A). The transparent green solution was stirred for 24h in a covered flask for a thorough
reaction between precursors. The hydrolysis of the alkoxide solution was carried out in a
covered flask. The hydrolysant was added drop wise into the alkoxide solution (the
recipes of hydrolysants are also shown in Appendix A) under strong stirring. A green
bouncy transparent gel was formed shortly after the addition of hydrolysant. The formed
gel was aged in the sealed flask for 24h, and then dried in ambient condition at 453K for
10h. The dried catalyst was calcined in air at 573K for 24h. Selected samples were
calcined in air at 773K and 973K for 24h respectively. Catalysts were dark grey after
calcination below 773K and were bright yellow after calcination at 973K. The catalysts
after calcination at 973K were denoted as xwt% Ni-Ti, where x represents the value of
Ni load of the catalyst.
For the preparation of aluminium integrated catalyst, the required amount of
Al(NO3)3.9H2O was added into the well mixed Ti(BuO)4 and Ni(NO3)2.6H2O solution in
MeOH. A green colloidal suspension formed after the addition of Al(NO3)3.9H2O since
the crystal water from Al(NO3)3.9H2O was sufficient for the partial hydrolysis of Ti4+.
The colloidal mixture was kept under inert protection for 24h before the hydrolysant
made with the above mentioned recipe was added to obtain thorough hydrolysis. No
firm gel had formed after stirring for 24h. The thick colloidal was calcined at 1023K for
10h with a ramp rate of 1K/min from 298K. The catalyst was bright green after the
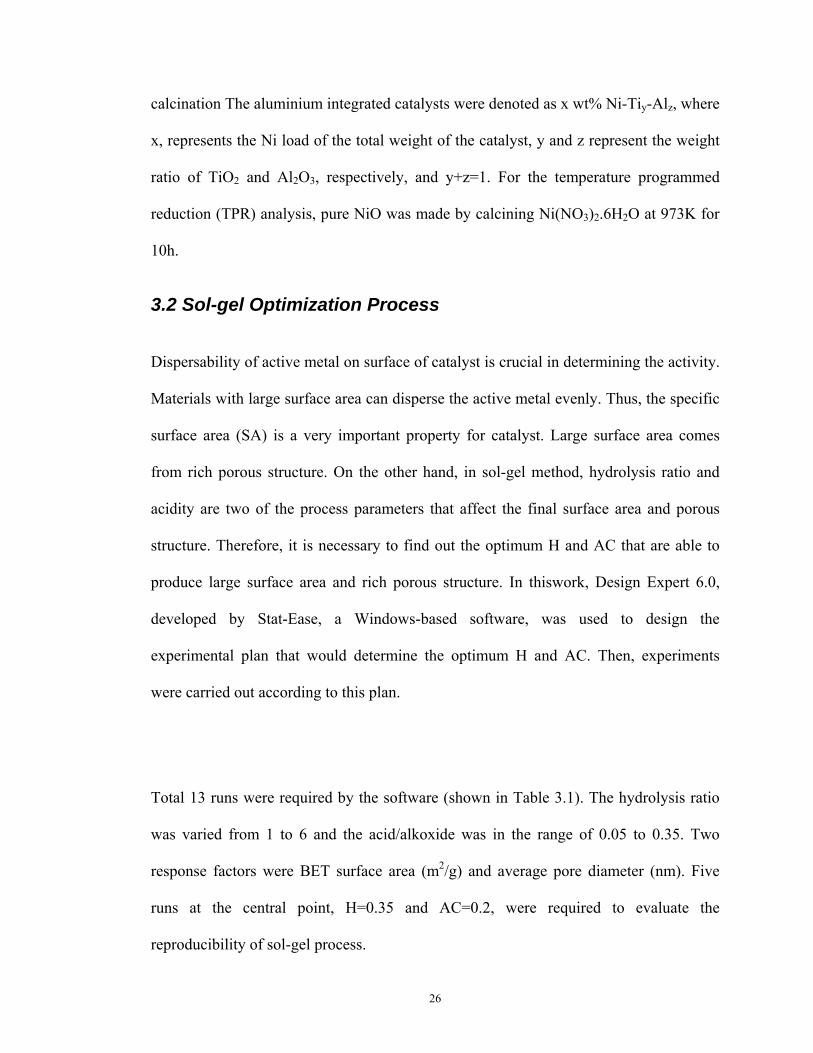
26
calcination The aluminium integrated catalysts were denoted as x wt% Ni-Tiy-Alz, where
x, represents the Ni load of the total weight of the catalyst, y and z represent the weight
ratio of TiO2 and Al2O3, respectively, and y+z=1. For the temperature programmed
reduction (TPR) analysis, pure NiO was made by calcining Ni(NO3)2.6H2O at 973K for
10h.
3.2 Sol-gel Optimization Process
Dispersability of active metal on surface of catalyst is crucial in determining the activity.
Materials with large surface area can disperse the active metal evenly. Thus, the specific
surface area (SA) is a very important property for catalyst. Large surface area comes
from rich porous structure. On the other hand, in sol-gel method, hydrolysis ratio and
acidity are two of the process parameters that affect the final surface area and porous
structure. Therefore, it is necessary to find out the optimum H and AC that are able to
produce large surface area and rich porous structure. In thiswork, Design Expert 6.0,
developed by Stat-Ease, a Windows-based software, was used to design the
experimental plan that would determine the optimum H and AC. Then, experiments
were carried out according to this plan.
Total 13 runs were required by the software (shown in Table 3.1). The hydrolysis ratio
was varied from 1 to 6 and the acid/alkoxide was in the range of 0.05 to 0.35. Two
response factors were BET surface area (m2/g) and average pore diameter (nm). Five
runs at the central point, H=0.35 and AC=0.2, were required to evaluate the
reproducibility of sol-gel process.

27
Table 3.1. Experimental design using Design Expert®
Standard Run Hydrolysis ratio Acid/alkoxide
2 1 5.27 0.09
5 2 1 0.2
13 3 3.5 0.2
7 4 3.5 0.05
10 5 3.5 0.2
6 6 6 0.2
3 7 1.73 0.31
12 8 3.5 0.2
8 9 3.5 0.35
4 10 5.3 0.31
1 11 1.73 0.09
11 12 3.5 0.2
9 13 3.5 0.2

28
3.3 Catalyst Characterization Techniques
In order to understand the changes in both chemical and physical properties and
structure of the catalysts during the preparation and pre- or post-reaction, the following
instrumental analyses were applied.
3.3.1 BET Analysis
The BET surface area (SA) and pore distribution were measured by N2 adsorption at the
temperature of 77K using Micromeritics ASAP 2000. Around 0.5g catalyst was used for
each analysis. The degassing temperature was 473K to remove the moisture and other
adsorbed gases from the catalyst surface. The sample tube was evacuated to 20µmHg
during the analysis.
3.3.2 Temperature Programmed Reduction
The reduction behaviour of catalysts was studied by TPR with the CHEMBET-3000.
Around 0.1g catalyst was used for each analysis. The loaded sample tube was placed in
the middle of a furnace and heated at a rate of 10K/min from room temperature to
1273K. A gas mixture of H2(3%)/N2 continuously flowed through the catalyst bed at a
rate of 30NmL/min. The whole process was controlled by the software and the data were
collected automatically.
3.3.3 Thermogravity/Differential Thermogravity Analysis
The thermal behaviour of pre- and post-reaction catalysts was studied using TG/DTA
analysis. The data were obtained by a PerkinElmer, Pyris Diamond TG/DTA equipment.

29
Air continuously flowed through the sample holder during the process. The platinum
sample holder was fully loaded after the equipment was balanced. The temperature was
increased from 303K to 1223K at a rate of 5K/min. The data were collected
automatically by the software.
3.3.4 X-ray Diffraction
The crystalline structure of catalysts was studied using XRD analysis. The diffraction
patterns were obtained by a Rigaku/Rotaflex Cu rotatory anode equipment with a
generator voltage of 40V and tube current of 40mA. For the preparation of the sample,
catalyst was grounded into powder and mixed with methanol to form a mud. The mud
was loaded to the coarse side of a glass plate and placed under ambient condition for
drying. The dried sample plate was then loaded in the analysis chamber. Each sample
was scanned at a rate of 7o/min. The 2θ, also denoted as 2 Theta, was varied from 10 to
90o.
3.3.5 X-ray Photoelectron Spectroscopy
The composition and oxidation status of surface components of the catalysts were
studied using XPS analysis. The spectra were obtained using an Axis-165 spectrometer
(Kratos Analytical) at room temperature with an Al-Kα radiation source. The initial
photon energy was 1486.71eV at the operation power of 210W. For the survey spectra,
the pass energy was 160eV with a binding energy range 0-1,100eV and a step of 0.33eV.
For the high resolution spectra, the pass energy was 20eV and the step was 0.1eV.

30
3.3.6 Scanning Electron Microscopy
The surface particle property of the catalysts was studied using SEM analysis. The SEM
was conducted using a Philips SEM 505 instrument at a voltage of 30kV. The powdered
sample was loaded onto a copper sample plate. Before the analysis, the sample plate was
coated with gold to form a conductive layer.
3.3.7 Transmission Electron Microscopy
The bulk particle property of catalyst was studied using TEM (Philip CM10). For the
preparation of the sample grid, the catalyst was grounded into fine powder and dissolved
in water. A very small drop of water with suspended particles was dropped onto a
copper grid coated with a layer of polyethylene. The grid was loaded into the sample
chamber after it was dried. The analysis was conducted under high vacuum.
3.4 Catalyst Evaluation
The schematic of the reactor system is shown in Figure 3.1. The feed gases are supplied
from cylinders and the flow rate of each gas is controlled by a mass flow controller
(MFC) (Read Out & Control Electronics 0154, Brooks Instrument). The feedstock is
mixed in a mixer before entering the reactor. Mixer, preheater, and furnace are enclosed
in a bench top reactor system (BTSR-jr, Autoclave Engineers, Erie, PA). The furnace is
put in a well insulated box which can be heated up to 523K to preheat the feed gases.
The temperature of the pre-heater is controlled by a temperature controller (2132,
EURITHERM). The temperature of the furnace is controlled by a temperature controller
(2416, EURITHERM) which has 8 segments. The temperature of the catalyst bed is read

31
Figure 3.1. Schematic diagram of the reactor system.
Mass Flow Controller
He CH4 CO2
Gas Chromatograph
Data Recorder
Reactor
Catalyst Bed
Furnace
Thermocouple
Vent
Preheater
Mixer
Gas Feeding Reactor Online Analysis
Water Trap
Gas FlowMeter
32
out by an indicator (2132, EURITHERM). A quartz tube with an innner diameter of
5.6mm, external diameter of 9.5mm and length of 255mm (Autoclave Engineers, Erie,
PA) was used as the reactor. Both ends of the tube were connected with the inlet and
outlet tubes, respectively, using SwageLog fittings and graphite ferrules (Autoclave
Engineers, Erie, PA). A safety valve is installed before the quartz tube reactor which
could open once the pressure was over 7psig so as to protect the quartz reactor. Moisture
in the effluent can be trapped down by an ice bathed water trap. However, in this
research, no significant amount of water was observed and this trap wasn’t used. A
6890N gas chromatograph (GC) (Agilent Technologies) equipped with a thermal
conductivity detector (TCD) is used to analyze the effluent gas on line. All effluent
gases were discharged into vent.
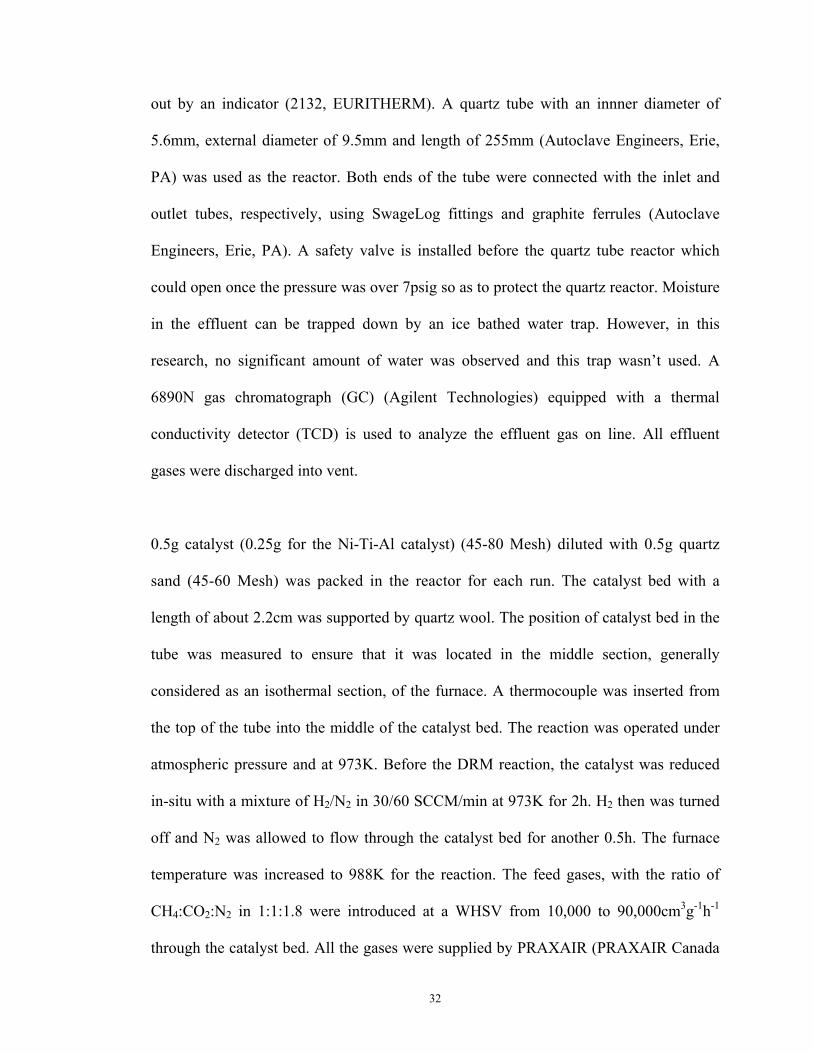
0.5g catalyst (0.25g for the Ni-Ti-Al catalyst) (45-80 Mesh) diluted with 0.5g quartz
sand (45-60 Mesh) was packed in the reactor for each run. The catalyst bed with a
length of about 2.2cm was supported by quartz wool. The position of catalyst bed in the
tube was measured to ensure that it was located in the middle section, generally
considered as an isothermal section, of the furnace. A thermocouple was inserted from
the top of the tube into the middle of the catalyst bed. The reaction was operated under
atmospheric pressure and at 973K. Before the DRM reaction, the catalyst was reduced
in-situ with a mixture of H2/N2 in 30/60 SCCM/min at 973K for 2h. H2 then was turned
off and N2 was allowed to flow through the catalyst bed for another 0.5h. The furnace
temperature was increased to 988K for the reaction. The feed gases, with the ratio of
CH4:CO2:N2 in 1:1:1.8 were introduced at a WHSV from 10,000 to 90,000cm3g-1h-1
through the catalyst bed. All the gases were supplied by PRAXAIR (PRAXAIR Canada

33
Inc., Mississauga, ON) and the purities of CH4, CO2, N2, H2, were 99.2%, 99.9+%,
99.9+%, and 99.9%, respectively.
A GS-GASPRO capillary column (J&W Scientific) with 60m in length and 0.32mm in
inner diameter was employed to separate the effluent components. Helium (Ultra high
purity 5.0, PRAXAIR Canada Inc., Mississauga, ON) was used as the carrier gas. In
order to separate CO from N2 peak, the column needs to work at low temperature. Thus,
a pressure relief valve is installed in the GC to introduce liquid CO2 into the oven. An
eductor tube is installed inside the cylinder by which liquid CO2 can be drawn. A filter is
installed between the cylinder and the relief valve to prevent fine particles from entering
the GC. The sampling loop is controlled by an air powered 8-port valve. The on-line
analysis is controlled by the HP ChemStation. The method for GC analysis was as
follows: The oven temperature was kept at 213K for 3 minutes before ramping it to
303K at a rate of 25K/min, and then the oven was kept at 303K for 5 minutes. The
column was operated under a constant pressure mode. The pressure of helium flow
through the column was 20psig at a rate of 3.0mL/min and the outlet was at ambient
condition. The average velocity of the helium flow was 35 cm/sec. The GC inlet was
heated to 473K at a pressure of 20psig. A split flow mode was applied with a split ratio
of 20:1. The total flow was 65.3mL/min. The sequences of gases coming out of the
column are H2, N2, CO, CH4, and CO2. The GC signals were calibrated prior to the
analysis of product gases. The calibrations are shown in Appendix A. The raw data of
each run are given in Appendix B.

34
Chapter 4
Results and Discussion
4.1 Catalyst Preparation and Characterization
4.1.1 Effect of Hydrolysis Ratio and Acid/Alkoxide on Catalyst Surface Area and
Pore Structure
13 runs were conducted according to the experimental plan developed by using the
Design Expert software. Because the calcination temperature dramatically affects the SA
and pore structure, relatively low calcination temperature (613K) was used for this part
of the experiment so as to be able to observe the changes in SA and pore size
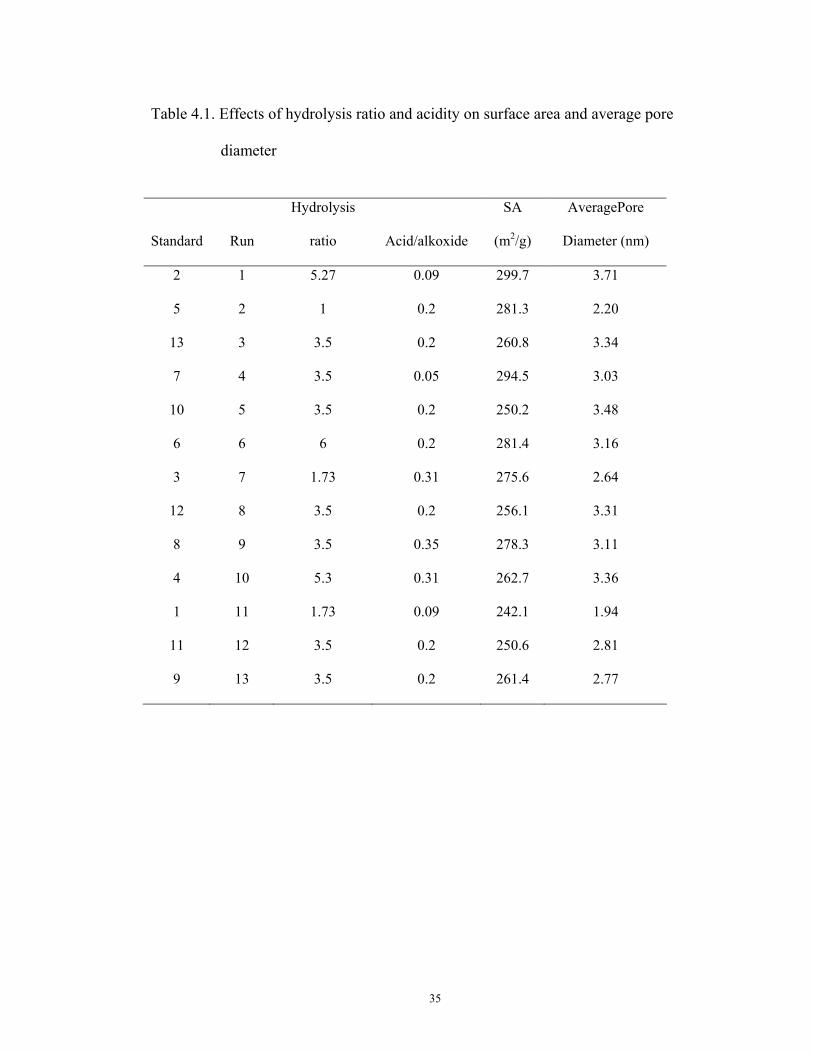
distribution resulted from the change of H and AC. Table 4.1 shows the experimental
results of the 13 runs in SA and average pore diameter, based on which two 3-D
diagrams were generated by the Design Expert software. One is the quadratic relation
between surface area and H, and AC (Figure 4.1) and the other is the linear relation
between average pore diameter and H, and AC (Figure 4.2). Surface area of the sol-gel
made Ni-Ti can reach at least 242m2/g. The highest surface area can reach around
300m2/g. Most pores distribute between the meso-pore range, 2-15nm. Statistic analysis
by the software shows that the correlations are significant with a 95% confidence level.
These effects can be explained qualitatively as follows:
35
Table 4.1. Effects of hydrolysis ratio and acidity on surface area and average pore
diameter
Standard Run
Hydrolysis
ratio Acid/alkoxide
SA
(m2/g)
AveragePore
Diameter (nm)
2 1 5.27 0.09 299.7 3.71
5 2 1 0.2 281.3 2.20
13 3 3.5 0.2 260.8 3.34
7 4 3.5 0.05 294.5 3.03
10 5 3.5 0.2 250.2 3.48
6 6 6 0.2 281.4 3.16
3 7 1.73 0.31 275.6 2.64
12 8 3.5 0.2 256.1 3.31
8 9 3.5 0.35 278.3 3.11
4 10 5.3 0.31 262.7 3.36
1 11 1.73 0.09 242.1 1.94
11 12 3.5 0.2 250.6 2.81
9 13 3.5 0.2 261.4 2.77

36
Figure 4.1. Chang of the BET surface area with H and AC of the sol-gel made Ni-Ti
xerogel composite.
254.688
266.886
279.085
291.283
303.481
BE
T S
urfa
ce A
rea
(m
2 /g)
0.09
0.15
0.20
0.25
0.31
1.73
2.62
3.50
4.38
5.27
AC:Acid/Alkoxide
H:Hydrolysis ratio

37
Figure 4.2. Change of the average pore diameter with H and AC of sol-gel made Ni-Ti
xerogel composite.
24.513 27.1957 29.8785 32.5612 35.244
P
ore
Dia
met
er (Ǻ
)
1.73
2.62 3.50
4.38 5.27
0.09
0.15
0.20
0.25
0.31
H:Hydrolysis Ratio AC: Acid/Alkoxide

38
Tim+, as a highly electronphilic functional group, can condensate very quickly once
sufficient amount of OH- were supplied. Typically, the following reactions take place
during the hydrolysis and condensation:
≡Ti-OR + H2O ≡Ti-OH + ROH (hydrolysis) (12)
≡Ti-OH + HO-Ti≡ ≡Ti-O-Ti≡ + H2O (water condensation) (13)
≡Ti-OH + RO-Ti≡ ≡Ti-O-Ti≡ + ROH (alcohol condensation) (14)
Water condensation is completed before the alcohol condensation takes place due to
electronic and steric effects [58]. At low AC, if insufficient water is supplied, i.e.,
1<H<4, alcohol condensation would occur after water condensation is completed. Two
different condensation processes would lead to an inhomogeneous structure which is
more vulnerable for the drying and calcination procedures. When H is larger than
titanium coordination number, 4, only water condensation exists, leading to a
homogeneous structure of the catalyst. Thus, more water supplied for the hydrolysis,
more homogeneous and stable structure can be obtained. As a result, higher BET surface
area can be obtained as H increased.
However, the application of acid catalyst greatly affects the gel rate and morphology of
the final products [59]. When acid is present, different condensation reactions occur
[59]:
≡Ti-OH + H3O+ ≡Ti+ + 2H2O (15)
≡Ti+ + HO-Ti≡ ≡Ti-O-Ti≡ + H+ (16)
When the solution is strong acidic, i.e., low AC and low H or high AC and low H, high
concentration of H+ in the solution keeps breaking down the interlayer bonds (Reverse
reaction of reaction 16), leading to a monolayer structure. Consequently, a poor

39
networking structure would form, resulting in a relatively lower surface area. When
excessive amount of water exists, i.e., high H and low AC, acid is diluted and the
catalytic role is weakened. The fast water condensation reaction (Reaction 13), rather
than reaction 16, is dominant. As discussed previously, the water condensation would
lead to a homogeneous networking structure, resulting in a relatively larger surface area.
We were looking for a condition under which material with high surface area can be
obtained, an optimal operation condition was desired. Table 4.1 shows this condition is
at H=5.22 and AC=0.10 when other parameters such as temperature for hydrolysis ,
drying and calcination are fixed. It is realized that these temperatures, especially the one
of calcination, would significantly impact the surface area. However, we assume that the
optimized H and AC will give relatively higher surface area even at other calcination
temperature. Therefore, the catalysts samples from now on would be prepared at H=5.22
and AC=0.10.
The BET results of two catalysts hydrolyzed under different temperatures (273K and
298K) but calcined at a higher temperature, 773K, are shown in Table 4.2. The catalyst
geled under lower temperature posseses a higher surface area, but it took longer time to
form a transparent gel because lower temperature slows down the hydrolysis rate. The
prolonged gelation time facilitated the formation of polymerized structure. As a result,
higher surface area was obtained. The two samples have the same pore volume but the
lower gelation temperature leads to smaller pore diameters, which indicates a better
porous structure. The average pore diameters of these two catalysts are 2.39 and 2.63
nm, respectively, and most pores are located in the meso-pore range. Although

40
Table 4.2. Effect of gellation temperature on surface area and porosity of Ni-Ti xerogel
composite
Gel Temperature (K) BET surface area
(m2/g)
Pore volume (cc/g) Average pore
diameter (nm)
273 182.2 0.11 2.39
298 161.5 0.11 2.63
(Other preparation parameters: H=5.22; AC=0.10; Drying temperature: 453K; Ni load:
10wt%)

41
continuing to lower the hydrolysis temperature may increase more in surface area,
hydrolysis at room temperature gives much ease in preparation and thus is preferred.
4.1.2 Thermogravity and Differential Thermogravity Analysis
The TG/DTA pattern of the uncalcined xerogel catalyst is shown in Figure 4.3. The TG
pattern shows an obvious weight drop from the starting point to 723K, due to the
evaporation of moistures, methanol solvent, and BuOH generated during hydrolysis and
the decomposition of nitrate. A steady horizontal TG line after 723K shows no further
weight loss. In the DTA pattern, the negative peak at 373K indicates the occurance of an
endothermic process, which is reasonablly attributed for the evaporation of moisture
since the reaction temperature occurs below 473K. The first positive peak from 473 to
563K is related to the decomposition of nitrate. The second positive peak, which is
broader than the first one, is associated with the decomposition of hydrocarbons which is
derived from the the precursors or the couplings during the calcination. The broadness of
the second peak indicates the complexity of the decomposition procedure of
hydrocarbons. A steady horizontal DTA line after 723K indicates that the catalyst is
thermally stable after calcination at 723K. However, DRM would take place at 973K.
Therefore, the catalyst should be finally calcined at an equivalant or higher temperature
to avoid any possible crystalline transformation during the reaction.
4.1.3 Effect of Calcination on Surface Area and Pore Structure
Specific surface areas, average pore diameter, and pore volume of catalysts calcined
under different temperatures were presented in Table 4.3. The BET surface area of the
catalyst is 426m2/g after calcination at 453K. It dropped to 282, 81, and 2m2/g as

42
Figure 4.3. TG/DTA analysis of the uncalcined Ni-Ti composite xerogel catalyst.
(Other preparation parameters: H=5.22; AC=0.10; Hydrolysis temperature:298K;
Drying temperature: 453K; Ni load: 10wt%)
TG
Temp (K
1073 973873773673573373
uV
120.0
100.0
80.0
60.0
40.0
20.0
0.0
TG mg15.50
15.00
14.50
14.00
13.50
13.00
12.50
12.00DTA
TG
Temp ( )
473
DTA uV
120.0
100.0
80.0
60.0
40.0
20.0
0.0
TG mg15.50
15.00
14.50
14.00
13.50
13.00
12.50
12.00DTA
273

43
Table 4.3. Heat effect on the textural properties of sol-gel made Ni-Ti xerogel catalysts
(Other preparation parameters: H=5.22; AC=0.10; Hydrolysis temperature:298K;
Drying temperature: 453K; Ni load: 10wt%)
Calcination
Temperature (K)
Surface Area
(m2/g)
Average Pore
Diameter (nm)
Pore Volume
(mL/g)
453 426.1 2.1 0.22
613 282.4 3.3 0.24
773 81.5 6.2 0.13
973 1.9 15.3 0.01

44
calcination temperature increased to 613, 773, and 973K, respectively. The average pore
diameter increases from 2.1 nm at 453K to 15.2nm at 973K. The results also show that
the pore adsorption volume decreases as calcination temperature increases. It is obvious
that higher temperature calcinations crushed the pore structure of the catalyst. The
steady increase of average pore diameter indicates the loss of pores of relatively small
diameter and the drastic decrease of pore adsorption volume indicates the loss of total
amount of pore volume. It was observed that pore volume slightly increased from 0.22
to 0.24 as calcination temperature increased from 453 to 613K before it steadily
dropped. This increase is due to the removal from the pores of nitrogen and carbon
brought in by precursors.
As shown in Table 4.3, the surface area dropped to 2m2/g and pore volume is very small
as calcination temperature increased to 973K. It means that the porous structure of the
sol-gel made catalyst is very sensitive to calcination temperature. A poor porous
structure of the catalyst directly leads to its poor surface area. Lee et al. [9] reported that
aerogel catalyst could maintain high surface area when it was calcined under a strict
temperature ramping, for example, 1K/min, and under inert protection, for example,
keeping He or N2 flowing through the whole calcination. However, such efforts for this
project didn’t prove that observation. Lee and coworkers also reported that if the
catalyst was dried by low temperature CO2 supercritical fluid, surface area as high as
49m2/g could be maintained even when the catalyst was calcined at 973K. Drying the
aerogel in supercritical fluid can reduce the damage to the porous structure by
eliminating surface tension between liquid and vapour phases and it can help to remain

45
the whole gel structure intact. Because this project was to seek a simple catalyst
preparation method, supercritical drying was not attempted. The xerogel showed a bright
yellow color after calcination at 973K, indicating the formation of nickel titanate [11].
4.1.4 Effect of Calcination on Crystallite Structure
Figure 4.4 shows the XRD patterns of the catalysts calcined at different temperatures. It
is observed that the catalyst is still amorphous after calcination at 573K. Crystallization
starts at 673K and small amount of brookite titania (Br) was observed. The amount of
titania crystallite grew and nickel titanate began to form at 773K. The peaks became
more intensive as calcination temperature increased. After the catalyst was calcined
under 973K for 10h, only small amount of brookite (TiO2) can still be observed, and
most TiO2 has transformed into the form of rutile (R). Nickel titanate was the dominant
phase and no bunsenite was observed during the whole calcination process. This is in
agreement with the colour changes of the catalyst. Catalyst made by wet impregnation,
with no presence of nickel titanate, is shown dark brown after calcination at 973K [11].
Though, in this project, the catalyst shows dark colour after calcination at 773K,
yellow particles can be observed, which is a typical indication of the presence of
nickel titanate [11]. The catalyst calcined at 873K is shown light yellow and that
calcined at 973K is bright yellow.
It is worth noting that the peaks in pattern (d) are narrower compared to patterns in (c)
and it is even narrower in pattern (e) in the XRD analysis. The decrease of peak width

46
10 20 30 40 50 60 70 80 90
2 Theta
Inte
nsity
(Arb
itray
Uni
ts)
Figure 4.4. X-ray diffraction patterns of the Ni-Ti composite xerogel catalysts calcined
at (a): 573K for 10 h; (b): 673K for 10 h; (c): 773K for 10 h; (d): 873K for 10 h; (e):
973K for 10 h.
(Other preparation parameters: H=5.22; AC=0.10; Hydrolysis temperature:298K;
Drying temperature: 453K; Ni load: 10wt%)
(b)
(d)
(c)
NT1: NiTiO3; NT2: Ni2Ti4O R: Rutile titania; Br: BrookiteA: Anatase
NT1
A/Br
R
A
R R
Br
R RR R
R Br
NT2
NT1
(e)
(a)

47
indicates that the particles of both TiO2 and nickel titanate grew up. This can well
explain the phenomena of the decrease of BET surface area as calcination temperature
increased. Lee et al. [9] reported that the Ni-Ti aerogel catalyst is still X-ray amorphous
even after the calcination at 773K under an inert protection. In this study, crystallization
of titania started at 673K, which may be due to the calcination in air. Three phases of
titania were observed in this study rather than only rutile even after calcination at 973K.
It was reported that, brookite, anatase, and rutile can coexist in the temperature from 673
to 973K [60] and anatase TiO2 transforms to rutile between 903 and 973K [61]. The
extension of the co-existing range of brookite, anatase, and rutile in this study may be
due to the integration of Ni.
The TEM images (Figure 4.5) are in agreement with the XRD results. A large cluster
was observed after calcination at 613K, indicating a good networking and amorphous
structure of the material. After calcination at 973K, the big cluster crushed and divided
into small particles with poor network. Some small particles which can be seen
differently might be nickel titanate decorating on TiO2, with an average particle size of
80nm. Those large particles might be the aggregated TiO2 with an average particle size
of 250nm. The aggregation of TiO2 could decrease the dispersibility of Ni on catalyst so
as to decrease its activity.
4.1.5 Effect of Calcination on Surface Composition
The catalysts with a Ni content of 4wt%, which conresponds a bulk Ni/Ti ratio of 0.042,
were analysed using XPS. The elements detected on the surface were Ti, Ni, O, C and N,
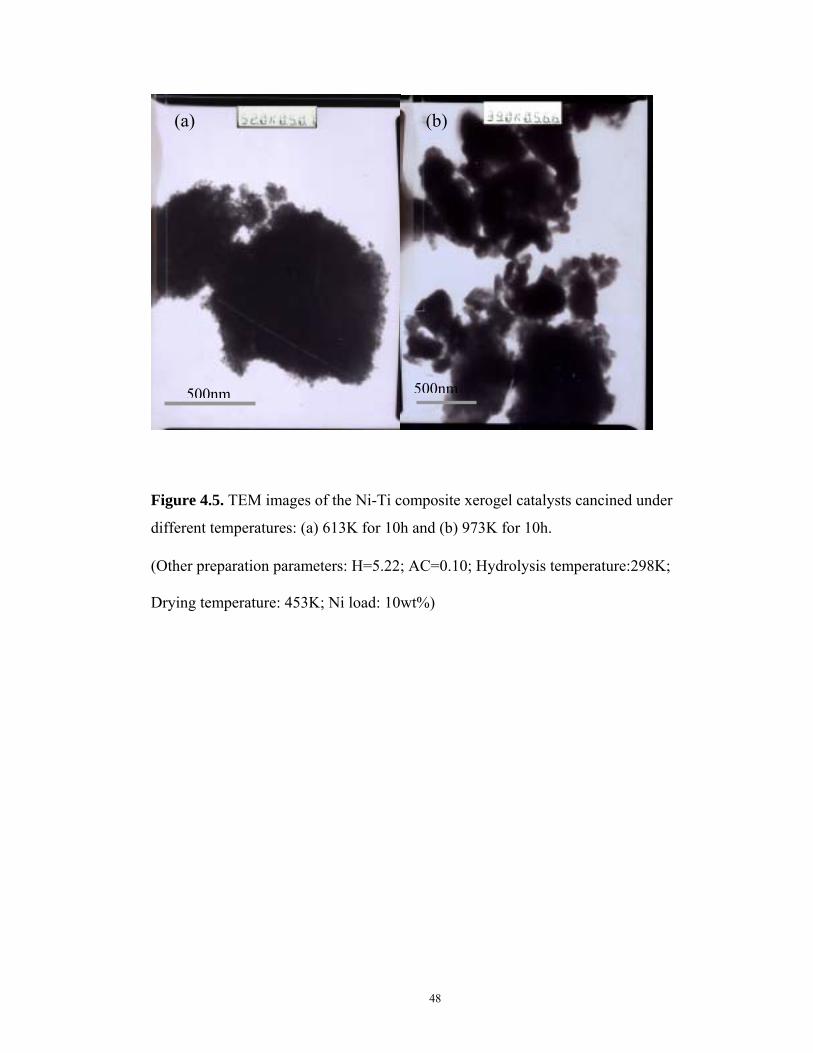
48
Figure 4.5. TEM images of the Ni-Ti composite xerogel catalysts cancined under
different temperatures: (a) 613K for 10h and (b) 973K for 10h.
(Other preparation parameters: H=5.22; AC=0.10; Hydrolysis temperature:298K;
Drying temperature: 453K; Ni load: 10wt%)
(a) (b)
500nm 500nm

49
whose respective atomic ratios over Ti are presented in Table 4.4. The XPS spectra of
individual elements were shown in Figure 4.6. The catalyst calcined at 673K has the
highest Ni/Ti ratio, 0.143, which is much larger than the bulk value, 0.042. The Ni/Ti
ratios of the catalyst calcined at 473 and 973K are 0.079 and 0.059, respectively, which
are close to the bulk value. The change of the surface Ni/Ti ratio may be indicative of
the crystalline chages of the catalyst during the calcination. Results from XRD showed
that the catalyst remains amorphous after calcination at 473K. The amorphous structutre
helps to maintain the surface properites similar to the bulk. After calcination at 673K,
only a distinctive brookite TiO2 peak was observed from the XRD analysis and no
significant Ni containg phase was observed. It may indicate that the crystallization of Ni
occures from the surface of the catlyst first and that those in the bulk are still amorphous
after calcination at 643K, leading to a higher Ni/Ti ratio. All components were totally
crystallized after calcination at 973K and the surface ratio of Ni/Ti draws back close to
the bulk level.
As indicated in the Ti2p pattern of the XPS spectra, peaks at the binding energy (BE) of
around 463.5EV and 458.0EV, were typical of titanium (IV). The lower energy level of
number 3 pattern at 457.9EV is attributed for the existence of TiO32- [62], which is
indicative of the existence of nickel titanate when calcination temperature was increased.
This agrees with the XRD results. A third peak in pattern 1 was observed at 460.2EV,
which is the attribution of titanium nitride [63]. The existence of titanium nitride was not
detected in catalyst by X-ray analysis which may be due to its small amount.
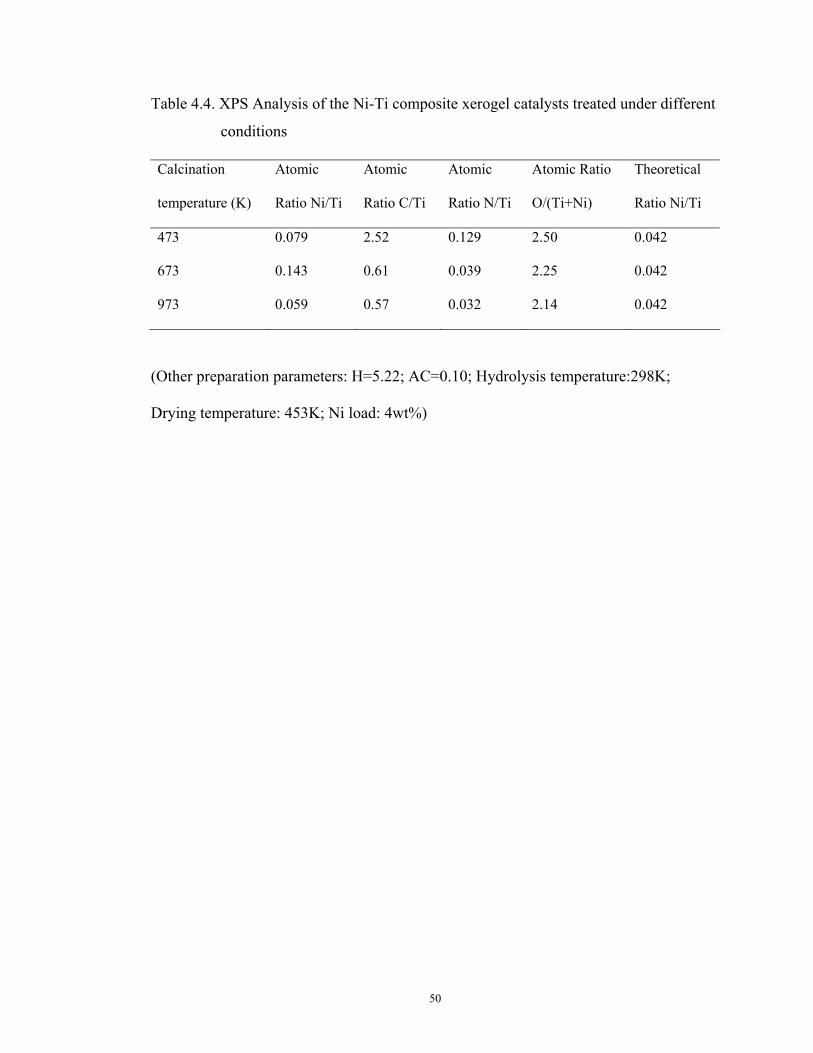
50
Table 4.4. XPS Analysis of the Ni-Ti composite xerogel catalysts treated under different
conditions
Calcination
temperature (K)
Atomic
Ratio Ni/Ti
Atomic
Ratio C/Ti
Atomic
Ratio N/Ti
Atomic Ratio
O/(Ti+Ni)
Theoretical
Ratio Ni/Ti
473 0.079 2.52 0.129 2.50 0.042
673 0.143 0.61 0.039 2.25 0.042
973 0.059 0.57 0.032 2.14 0.042
(Other preparation parameters: H=5.22; AC=0.10; Hydrolysis temperature:298K;
Drying temperature: 453K; Ni load: 4wt%)

51
0
50
100
150
200
250
452456460464468
Binding Energy (EV)
Inte
nsity
(C/S
)
x1000
1
3
2
O1s
0
3
6
9
12
15
526528530532534536
x10000
Binding Energy (EV)
Inte
nsity
(C/S
)
1
2
3
0
2000
4000
6000
8000
10000
280282284286288290292
Binding Energy (EV)
Inte
nsity
(C/S
) 1
2
3
Figure 4.6. XPS analysis (a) Ti2p, (b) C1s, and (c) O1s of Ni-Ti xerogel catalysts
treated under different conditions: (1): 473K for 10h; (2): at 673K for 10h; (3): at 973K
for 10h. (Other preparation parameters are as the same as shown in Table 4.4)
a
b
c

52
Further examinations of C1s (c) and O1s (d) spectra indicate that multiple C and O
species were present on the surface of catalysts after calcination at 473 and 673K
(pattern 1&2). The C1s peak at the BE of 288.6EV indicates the existence of organic
carbons. Since sample 1 and 2 were calcined at 473 and 673K, at which the calcination
temperature was not high enough to decompose hydrocarbons, the shoulders in C1s and
O1s of pattern 1 and 2, at 286.4EV and 531.1EV are indicative of complex species
present on the surface. The symertic C1s and O1s peaks of the catalyst calcination after
973K indicate the simplicity of C and O species present on the surface, attributed to
carbon in TiO2 environment and oxygen in TiO2 crystalline structure [64], respectively.
The atomic ratio of O/(Ni+Ti), ranging from 2.14 to 2.5, in disagreement with the
nominal atomic composition of nickel titanium oxide, between 1.5 and 2, is indictive of
excessive amount of O2 present that could be attributed to the presence of OH groups on
the surface. It is known that hydroxyl groups, such as Ti-OH, remain in the sol-gel
prepared materials and promote the osteointegration process [65]. The decrease of the
O/(Ni+Ti) as the calcination temperature increases is due to the “drying” effect which
expels the –OH from the surface of the catalyst.
The surface property change can also be reflected by the SEM images shown in Figure
4.7. The catalyst calcined at 473K has shown bigger and even dispersed particles due to
its amorphous structure. A large amount of small particles can be seen as calcination
temperature increased to 773K due to the formation of small crystallites. As calcination
temperature increased to 973K, the average particle is much larger than at 773K. It was

53
Figure 4.7. SEM images of Ni-Ti xerogel catalysts calcined at (a) 473K for 10h, (b)
773K for 10h and (c) 973K for 10h.
(a)
(b)
(c)

54
resulted by the aggregation of small particles due to the high temperature calcination.
All these observations are in agreement with N2 adsorption and XRD results. It was
noticed that some sooth like material appears after the catalyst calcined at 773K. It
doesn’t attribute to carbon since XPS shows that most carbon has been removed at this
point. XRD indicates that crystallization has developed and it has a significant smaller
particle size comparing to catalyst calcined at 973K. It is reasonable to conclude that
those fine powder like particles are the crystallized titania and nickel titanate.
4.2 Catalyst Evaluation
4.2.1 Thermodynamic Calculations of the Reactions
The equilibrium conversions of the four possible reactions, DRM, RWGS, CH4
decomposition and CO disproportionation versus temperature are shown in Figure 4.8.
Conclusions drawn from these calculations suggest that operation at high temperature,
~1100K, and with CO2/CH4 ratios far above unity can avoid regions where there is a
thermodynamic potential for carbon formation; however, these conditions are not
preferable from the industrial standpoint where lower operation temperature and
CO2/CH4 ratio close to unity are expected. In addition, catalyst would sinter to
deactivate itself if the reaction was operated over 1100K. In this thesis work, the catalyst
evaluation process was operated at 973K, at which the equilibrium conversion of DRM
is 80%.

55
0
0.2
0.4
0.6
0.8
1
400 700 1000 1300
Temperature (K)
Equ
ilibr
ium
Con
vers
ion
Figure 4.8. Thermodynamic calculations of four main reactions during the DRM.
Reaction condition: P=100KPa, CH4:CO2=1:1.
DRM
RWGS CH4=C+2H2
2CO=CO2+C

56
4.2.2 Effect of Reduction Temperature on Catalyst Reactivity
It is believed that reduced Ni on catalyst surface is the active site for DRM. Thus the
catalyst was reduced in the gas mixture of H2 and N2 (H2/N2=30/60 SCCM/min) before
the reaction was carried out. To understand the catalyst reduction behaviour, the TPR
analysis was conducted. As indicated in Figure 4.9, Ni in the sol-gel made catalyst
requires higher temperature to get reduced than pure NiO. The difference is around
300K. In addition, not only the reduction peak of NiTiO3 (at around 973K) was
observed, but also the reduction of TiO2 is present at around 1110K. The reduction of
TiO2 may have adverse impact on catalyst reactivity [35] while reduction at higher
temperature gives more complete Ni reduction which favours the reaction. Therefore, it
is meaningful to investigate the effect of reduction temperature on the reactivity of the
catalyst.
Figure 4.10 indicates that the catalyst activity, with respect to the reaction rate of CH4
and CO2 (µmol/s/g-cat), increased as the reduction temperature was raised up from
823K to 973K. However, further increase in the reduction temperature to 1003K resulted
in a dramatic decrease in the catalyst activity. The catalyst showed no activity at all
after it had been reduced at 1023K and 1073K. When the reduction temperature was
low, at 823K, as indicated by the TPR spectrum, the reduction level of the highly
interacted catalyst was very low. The low reducibility of the NiTiO3 at lower
temperature directly contributes to its low activity. As the reduction temperature
increases, the reduction level of the catalyst would increase. The XRD analysis in Figure
4.11 has proven that the catalyst reduced at 1023K for 4h obtained a 100% reduction

57
300 500 700 900 1100 1300
Temperature (K)
Inte
nsity
(arb
itray
uni
ts)
Figure 4.9. TPR analysis of (a) NiO and (b) 5 wt% Ni-Ti xerogel catalyst
(a) (b)

58
Figure 4.10. Effect of reduction temperature on the reactivity of catalysts. Reaction
conditions: 5wt% Ni-Ti catalyst, P=1atm, T=973K, N2:CH4:CO2=1.8:1:1,
WHSV=10,000 SCCM/h/g-cat
0
5
10
15
20
25
30
800 850 900 950 1000 1050 1100Reduction Temperature (K)
Rea
ctio
n R
ate
(µm
ol/s
/g-c
at)
CO2
CH4

59
10 30 50 70 902 Theta
Inte
nsity
(Arb
itrar
y U
nit)
Ru
Ru
Ru
Ru
Ru
Ru
RuRu Ru
Ru
Ru
NiTi NiTi NiTi
Ni TOTO
Ni: NickelNiTi: NiTiO3
Ru: Titania/RutileTO: Ti3O5
Figure 4.11. XRD analysis of 5wt% Ni-Ti xerogel catalysts (a) unreduced, (b) reduced at 973K for 4h, and (c) reduced at
1023K for 4h.
(b)
(c)
(a)

60
since no NiTiO3 phase was observed but there was still some NiTiO3 remaining
unreduced after 4h at 973K. The higher reducibility indicates more active sites created.
Thus, it can be theoretically said that the activity of the catalyst should increase with the
reduction temperature. The XRD analysis of the catalyst reduced at 973K for 4h, pattern
(b), shows very weak peaks appearing at the 2θ of 51.95 and 52.8. Both of them are
attributed to the presence of Ti3O5. To the catalyst which was reduced at 1023K for 4h,
the Ti3O5 peaks became more intensive, indicating that more Ti3O5 had formed. It was
reported that TiO2 can be reduced to form an oxide of TiOx, where x is between 0 and 2
[33]. For example, Bradford et al. [33] has identified Ti4O7, Ti3O5, and Ti5O7 from the
supported Ni/TiO2 catalyst after 1h in H2 stream at 773K, and assumed that these species
would migrate to the surface of catalyst to cover active sites, so as to deactivate the
catalyst. Since the only difference observed from the XRD patterns between the catalyst
reduced at 973K and the one reduced at 1023K is that the latter one has higher intensity,
corresponding to higher amount of Ti3O5, it seems that the formation of this new species
has something to do with the loss of activity of the catalyst when it was reduced at a
temperature over 973K. However, further studies are required to clarify the mechanism
of this deactivation.
The other result drawn from the TPR and XRD characterizations is that the interaction
between Ni and Ti is very strong. Pattern (a) of the XRD analysis shows NiTiO3 is the
only Ni-containing compound existing in the catalyst and no NiO is present. The
temperature required for the reduction of NiTiO3 is 973K, compared to 683K for the
pure NiO. The broadness of the NiTiO3 is indicative of not only the strong interaction
61
between Ni and Ti, but also the broad spread of the particle size in the catalyst after
calcination at 973K.
Figure 4.12 shows the effect of reduction temperature on the ratio of H2 to CO in
product stream. It has the similar trend as the catalyst activity. The ratio increased as the
temperature was elevated from 823 to 973K and dropped as the temperature increased to
1003K. Obviously, no H2/CO ratio was presented for the catalysts reduced at 1023 and
1073K since the reaction rate was approaching 0. As discussed in the literature review,
the RWGS reaction consumes the produced H2 resulting in a higher conversion of CO2
than CH4 and a ratio of H2/CO less than unit. When the catalyst was reduced at 973K,
the catalyst showed higher activity and thus, large amount of CO2 has been consumed
for the DRM. So the amount of CO2 left for the RWGS reaction is limited. This leads to
a higher H2/CO ratio. However, when the catalyst was reduced at a lower or higher
temperature than 973K, the net available active sites was reduced, resulting in a lower
activity. Consequently, the amount of CO2 participating in the DRM reaction was
reduced. The relatively larger amount of CO2 remaining would stoichiometrically lead
the RWGS reaction to the right side and result in the lower H2/CO ratio.
4.2.3 Effect of Reduction Time on Catalyst Reactivity
Since reduction temperature has shown significant impact on the activity of catalysts, it
seems that the reduction time can also affect their activities. The activities of the 5wt%
Ni-Ti catalyst reduced in H2 stream for various length of time (at 973K for 2, 4, and 6
hours) are shown in Figure 4.13. The results suggest that the longer reduction time

62
0.6
0.7
0.8
0.9
1
800 900 1000
Reduction Temperature (K)
H2/C
O
Figure 4.12. Ratio of H2/CO in effluent over 5wt% Ni-Ti catalysts reduced at different
temperatures. The reaction condition: P=1atm, T=973K, N2:CH4:CO2=1.8:1:1,
WHSV=10,000 SCCM/h/g-cat.
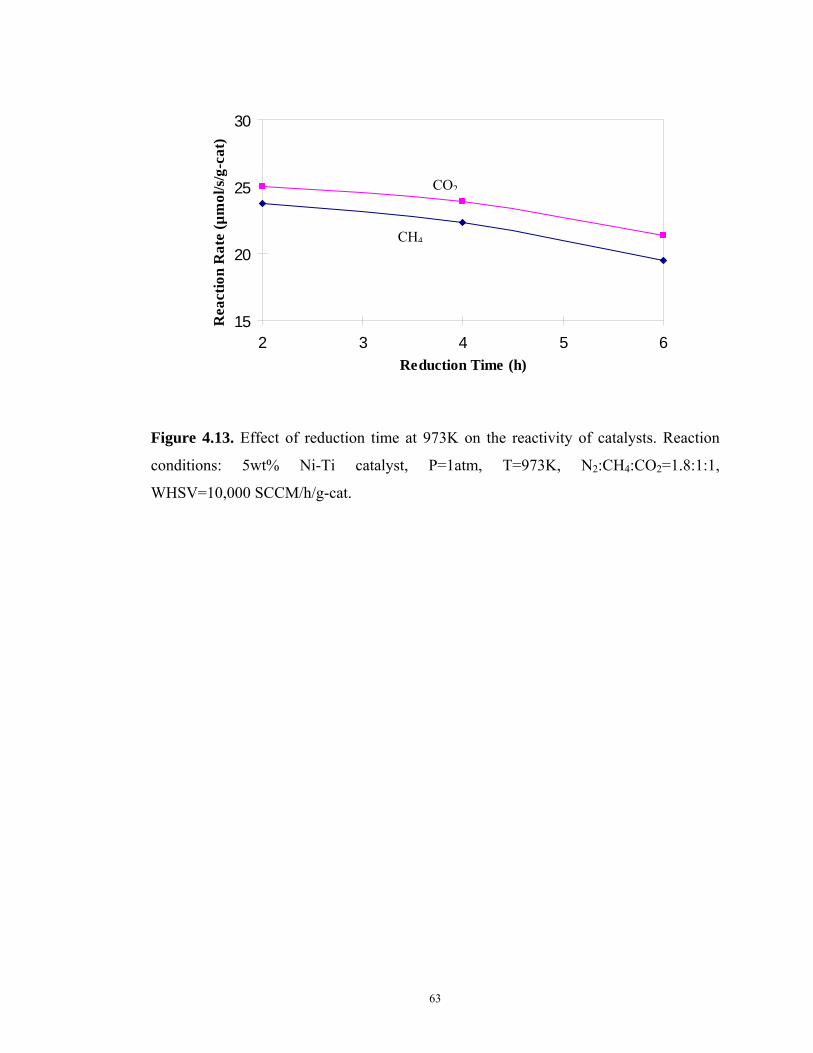
63
15
20
25
30
2 3 4 5 6
Reduction Time (h)
Rea
ctio
n R
ate
(µm
ol/s
/g-c
at)
Figure 4.13. Effect of reduction time at 973K on the reactivity of catalysts. Reaction
conditions: 5wt% Ni-Ti catalyst, P=1atm, T=973K, N2:CH4:CO2=1.8:1:1,
WHSV=10,000 SCCM/h/g-cat.
CO2
CH4

64
would lead to the lower activity of the catalyst. The catalyst reduced for 2h has shown
relatively higher activity for both CH4 and CO2. The XRD analysis of the fresh catalyst
and those reduced for different lengths of time is shown in Figure 4.14. It suggests that
NiTiO3 was reduced into elemental Ni, and the longer the reduction time, the higher
the reduction level, possibly leading to a higher activity. However, the catalyst which
had undergone longer reduction shows lower activity. Again, the observation of Ti3O5
formation on the catalyst that has been reduced for 6h may confirm that the appearance
of Ti3O5 adversely impacts the catalyst activity. Since the reactant CH4 and product H2
supply a reduction environment for the catalyst, it raises a concern that Ti3O5 may
form in the catalyst during DRM and thus lead to catalyst deactivation.
In summary, in order to obtain a high activity, the optimal reduction condition of the
catalyst is 973K for 2h in H2 and N2 mixture. Thus, in the following experiments the
catalysts were reduced under this condition.
4.2.4 Effect of Flow Rate of Feed Gas on Catalyst Reactivity
In order to find an area in which the reaction is controlled by the reaction rate of DRM,
experiments of the effect of linear velocity of feed gas on the reaction rate with respect
to CH4 and CO2 were conducted and the results are shown in Figure 4.15. Both CH4 and
CO2 have a reaction rate of 25µmol/s/g-cat at a flow rate of 0.05m/s. The reaction rate of
CH4 and CO2 increases to 55 and 75µmol/s/g-cat, respectively, when the linear velocity
was increased from 0.05 to 0.25m/s. The reaction rate remains unchanged for CH4 and
keeps increasing for CO2 when the linear velocity continues to increase. The stable stage
of the reaction rate for CH4 is indicative of a reaction control condition.

65
1 0 3 0 5 0 7 0 9 0
2 T h e ta
Inte
nsity
(Arb
itrar
y U
nit)
N iT i N iT i
R u
T O
N iT i
N i
R u
R u
R u
R u
R u
R uR u
R u
R uR u
N i: N ick e lN iT i: N iT iO 3
R u : T ita n ia /R u tileT O : T i3O 5
Figure 4.14. XRD analysis of 5wt% Ni-Ti xerogel catalysts (a) unreduced, (b) reduced at 973K for 2h, (c) reduced at 973K
for 4h, and (d) reduced at 973K for 6h.
(d)
(c)
(b)
(a)
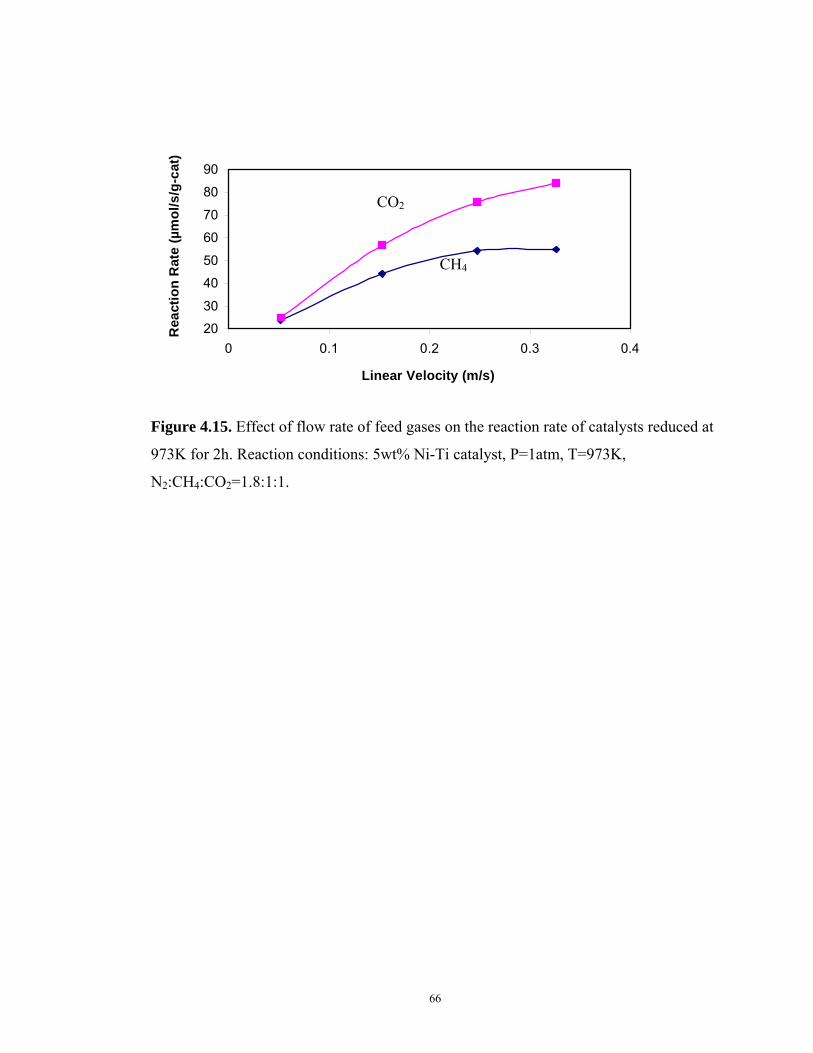
66
20
30
40
50
60
70
80
90
0 0.1 0.2 0.3 0.4
Linear Velocity (m/s)
Rea
ctio
n R
ate
(µm
ol/s
/g-c
at)
Figure 4.15. Effect of flow rate of feed gases on the reaction rate of catalysts reduced at
973K for 2h. Reaction conditions: 5wt% Ni-Ti catalyst, P=1atm, T=973K,
N2:CH4:CO2=1.8:1:1.
CO2
CH4

67
However the reaction rate of CO2 continues to increase and no stable stage was
observed. And it was also seen that the difference of reaction rate between CO2 and CH4
became larger with the increasing linear velocity. These phenomena are due to the
existence of RWGS reaction. As indicated in Figure 4.16, a reverse trend was observed
between the conversions of both CH4 and CO2 and linear velocity. When the linear
velocity is 0.05m/s, the conversion of CH4 and CO2 is high, closing to the equilibrium
conversion. As a result, the concentration of CO2 in the stream is very low and,
thermodynamically, it isn’t preferential for the RWGS reaction. Reversely, when the
linear velocity is 0.25m/s and the conversions of both CH4 and CO2 are low, the
concentration of CO2 in the stream is high. This is preferential for the RWGS reaction to
consume the produced H2. So the gap of the conversions between CH4 and CO2 becomes
larger. As discussed previously, the reaction rate of DRM is the rate limit step when the
linear velocity is over 0.25m/s. So the amount of CH4 and CO2 participating in the DRM
reaction in the reaction control area is fixed. On the other word, when the linear velocity
becomes even larger, 0.33m/s, the amount of CO2 in the stream is more excessive, and,
inevitably promotes the RWGS to the right side. So an unchanged reaction rate of CO2
won’t be reached until all produced H2 is consumed by the RWGS if feed gas velocity
keeps increasing.
In the following evaluation operations, in order to avoid the mass transfer control area,
all runs were proceeded at a linear velocity of 0.25m/s, at which reaction rate of DRM is
the rate limit step.

68
0.2
0.3
0.4
0.5
0.6
0.7
0.8
0.9
0 0.1 0.2 0.3 0.4
Linear Velocity (m/s)
Con
vers
ion
Figure 4.16. Effect of flow rate of feed gases on the conversion of catalysts reduced at
973K for 2h. Reaction conditions: 5wt% Ni-Ti catalyst, P=1atm, T=973K,
N2:CH4:CO2=1.8:1:1.
CO2
CH4

69
4.2.5 Effect of Nickel Load on Catalyst Reactivity
Catalysts with different Ni-loading were evaluated and the reaction rates of CH4 and
CO2 are presented in Figure 4.17 and Figure 4.18, respectively. The catalysts were
reduced at 973K for 2h. As discussed previously, due to the involvement of RWGS, the
reaction rate of CO2 is higher than CH4. The reaction rate of both CH4 and CO2 is
closely related with the Ni content and the higher the nickel content, the better the
activity.
After 4h of time on stream, all evaluated catalysts have shown detectable deactivation.
Especially during the first hour on stream, the 5wt% Ni-Ti catalysts lost 15% of its
initial activity. Attempts have been made to understand the mechanism of catalyst
deactivation during the use; but the results remain ambiguous. The XRD analysis of the
5wt% Ni-Ti catalyst before and after reaction is shown in Figure 4.19. By comparing
pattern (b) to pattern (c), the unreduced NiTiO3 peak disappeared and a couple of new
peaks representing Ti3O5 appeared. It seems that the reaction mixture continues to
reduce the catalyst during the reaction. And at the same time, reduction of TiO2 to
Ti3O5 was also occurring. As the concern brought previously, the formation of Ti3O5
may be responsible for the decrease of the catalyst activity. And this effect appears to be
significant compared to continuing reduction that supposed to improve the activity. The
deactivation rate of the catalyst became less after the first hour on stream as indicated in
Figure 4.17. One possible reason for the decrease of deactivation rate is the slow down
of the formation of Ti3O5. The other possible reason for this is that the catalysts need

70
0
20
40
60
80
100
120
0 60 120 180 240Time on stream (min)
CH4 r
eact
ion
rate
(µm
ol/s
/g-c
at)
Figure 4.17. Effect of Ni load on the reaction rate with respect to CH4, (×): 10wt%, (∆): 5wt%,
(■): 3wt%, and (♦): 1wt%. Reaction conditions: P=1atm, T=973K, N2:CH4:CO2=1.8:1:1.

71
0
20
40
60
80
100
120
0 60 120 180 240
Time on stream (min)
CO2
reac
tion
rate
(µm
ol/s
/g-c
at)
Figure 4.18. Effect of Ni load on the reaction rate with respect to CO2, (×): 10wt%, (∆): 5wt%,
(■): 3wt%, and (♦): 1wt%. Reaction conditions: P=1atm, T=973K, N2:CH4:CO2=1.8:1:1.

72
10 30 50 70 902 Theta
Inte
nsity
(Arb
itrar
y U
nit)
NiTiNiTi
Ru
RuRu
Ru
Ru
Ru
Ru
RuRuRu
NiTi
NiTi
Ni: NickelNiTi: NiTiO3
Ru: Titania/RutileSO: SilicaTO: Ti3O5
SO
SOTOTO
Ni
Figure 4.19. XRD analysis of 5wt% Ni-Ti xerogel catalyst (a) unreduced, (b) reduced at 973K for 2h, and (c) after 4h reaction.
(a)
(b)
(c)

73
time to get stabilized. Once they are stabilized, their activity may maintain constant.
Longer experiment is required to prove this.
The other reason that may cause the deactivation of the catalysts is carbon deposition. A
broad positive peak of pattern (c) starting from 773K to 923K in DTA analysis (Figure
4.20) was observed for the post-reaction catalyst. Compared to pattern (b) in the same
figure for the catalyst before reaction, this peak corresponds an exothermic process that
may be the combustion of carbon that has been deposited on the catalyst during the
reaction. The TG results (Figure 4.21) support this view. To both the reduced and the
post-reaction catalysts, the oxidation of elemental Ni into NiTiO3 is the only source of
weight increase. So the weight increase of the reduced catalyst from 773 to 110K was
due to the oxidation of Ni into NiTiO3 since the sample showed bright yellow after the
TG/DTA analysis. From 773 to 923K, the slope of pattern (c) is smaller than that of
pattern (b), indicating that the post-reaction catalyst gained less weight in this section.
The post-reaction catalyst should have gained more weight since the reaction
environment continues reducing it. So the only cause for the mitigation of the weight
gain during 773 to 923K is due to combustion of the deposited carbon on the
post-reaction catalysts. The gap between the two patterns at the end, 4.1mg/g-cat, can be
used to estimate the amount of carbon that has been burned, indicating the amount of
carbon that was deposited on the catalyst during the reaction. The average carbon
deposition rate is 1.02mg/h/g-cat during the 4h. We realize that errors exist when this
estimation was made. For example, the compositions of the pre- and post-reaction
catalysts are slightly different due to the carbon deposition itself, and it was assumed
that the diluting material and catalyst were well mixed.

74
-20
-18
-16
-14
-12
-10
-8
-6
-4
-2
0
250 450 650 850 1050 1250
Temperature (K)
Inte
nsity
Figure 4.20. DTA analysis of 10wt% Ni-Ti xerogel catalyst (a) unreduced, (b) reduced
at 973K for 2h, and (c) after 4h reaction.
(a)
(b)
(c)

75
-30
-20
-10
0
10
20
30
250 450 650 850 1050 1250
Temperature (K)
Rel
ativ
e G
ravi
ty (m
g/g-
cat)
Figure 4.21. TG analysis of 10wt% Ni-Ti xerogel catalyst (a) unreduced, (b) reduced at
973K for 2h, and (c) after 4h reaction.
(a)
(b)
(c)

76
Quartz sands, which were used as the diluting material, could not be separated from the
catalyst after reaction. The existence of quartz has been proven by the XRD analysis of
the post-reaction catalyst sample which shows two silicon oxide peaks. It should be
mentioned that the broad negative peak observed for all three samples from 300 to 500K
are attributed to the evaporation of the moisture adsorbed on the samples when they
were exposed to the atmosphere.
4.2.6 Effect of the Integration of Aluminium on Catalyst Reactivity
, Comparison shows that the Ni-Ti xerogel catalyst has lower reaction rate than the Ni
catalysts supported by porous supports [33]. This may be due to the low surface area
resulted from the high temperature calcinations which is inevitable for CO2 reforming of
CH4. However, other measures that improve the catalyst surface area may increase the
activity of the catalyst. In addition, since the interaction between nickel and titania is too
strong resulting in poor reducibility, a third component which may help relieve the
interaction between Ni and Ti so as to increase the reducibility of the catalyst is desired.
Most importantly, a third component which could inhibit the reduction of TiO2 into
Ti3O5 would improve catalyst stability. Alumina has the nature of high surface area and
developed porous structure. It was also reported that NiAl2O4 can form after calcination
at 973K [6] which is easier to reduce than NiTiO3. Therefore, the 5wt% Ni loading
Ni-Ti0.5-Al0.5 catalyst was prepared using sol-gel method and evaluated under the same
condition. The reaction activity is presented in Figure 4.22. Comparison with Figure
4.17 and 4.18 shows that the reaction rate is more than doubled as that of the 5wt%
Ni-Ti catalyst. This is indicative that more active sites are available on the Ni-Ti-Al

77
catalyst than on the Ni-Ti catalyst. The surface area of this catalyst was not measured
due to the failure of the BET apparatus. But from the physical observation, the
0
40
80
120
160
200
0 2 4 6 8 10Time on stream (h)
Rea
ctio
n Ra
te (µ
mol
/s/g
-cat
)
CO2
CH4
Figure 4.22. Reaction performance of 5wt% Ni-Ti-Al catalyst over DRM at the
condition: P=1atm, T=973K, N2:CH4:CO2=1.8:1:1, WHSV=90,000 SCCM/h/g-cat.

78
aluminium integrated catalyst has a much larger volume per mass since the addition of
aluminium can help build porous structures and increase surface area of catalyst. The
porous structure and high surface area can facilitate the dispersion of Ni and create more
active sites with small particle size. In addition, the Ni-Ti-Al catalyst is more stable than
the Ni-Ti catalyst. There wasn’t noticeable deactivation observed to the aluminium
integrated catalyst after 10h of time on stream.
The XRD analyses of the fresh, reduced and post-reaction Ni-Ti-Al catalyst are
presented in Figure 4.23. There is still no pure NiO in the catalyst. Only small amount of
NiTiO3 was observed. Most Ni was present as the format of NiAl2O4. The Ni-Ti-Al
catalyst was easier to reduce than the Ni-Ti catalyst since no nickel containing oxide was
observed after the same reduction procedure. The high reducibility generated more
active sites, attributing to its higher activity. Different to the Ni-Ti catalyst, no Ti3O5
observed after 2h reduction, and even after 10h reaction, further confirms the role of
Ti3O5 that plays in catalyst deactivation. In other words, the addition of aluminium is
able to inhibit the reduction of TiO2. This may be the main reason that the Ni-Ti-Al
catalyst can maintain higher activity and longer stability than the Ni-Ti catalyst. By
comparing the XRD results of Ni-Ti catalyst and Ni-Ti-Al catalyst, all patterns in
Figure 4.23 have shown broader peak wideness than those in Figure 4.19. The wider
peaks suggest smaller particle size. As elaborated in the literature research, the smaller
particles are preferential for the DRM rather than other side reactions [1]. As a result, the
selectivity of H2 and CO reaches as high as 0.83 and 1, respectively (Figure 4.24).
The selectivity of CO above 1 in this figure may be due to the errors in GC calibration
and analysis.

79
10 30 50 70 902 T he ta
Inte
nsity
(Arb
itrar
y un
it)SOAn
An An
Ru
Ru
Ru
Ni
Ni
C C
A l1NiTi NiA lA l2NiTi
Al1 : a -Al2O3 Al2: ß-Al2O 3
An : Ti ta n ia /An a ta s e C : C arb o n N iTi : N iTiO3 N iAl: N iAl2O4
R u : Ti ta n ia /R utile SO: S ilica
Figure 4.23. XRD analysis of 5wt% Ni-Ti-Al xerogel catalyst (a) unreduced, (b) reduced at 973K for 2h, and (c) after 10h
reaction.
(a)
(b)
(c)

80
0
0.2
0.4
0.6
0.8
1
0 2 4 6 8 10
Time on stream (h)
Sele
ctiv
ity
Figure 4.24. The ratio of H2 to CO in effluent over 5wt% Ni-Ti-Al catalyst at the
reaction condition: P=1atm, T=973K, N2:CH4:CO2=1.8:1:1, WHSV=90,000
SCCM/h/g-cat.
CO
H2

81
As a consequence of the high reducibility, the reverse path of Ni reduction, presented in
the DTA (Figure 4.25) and TG (Figure 4.26), is also easier. By comparing the TG/DTA
analysis of Ni-Ti-Al catalyst to the pattern of Ni-Ti catalyst (Figure 4.20 and Figure
4.21), the oxidation of elemental Ni into NiAl2O4 occurred at temperature 500 to 750K,
lower than the temperature 800 to 1050K for Ni-Ti catalyst to oxide Ni into NiTiO3. It
suggests that NiAl2O4 requires lower activation energy to reduce, corresponding to its
higher reducibility than NiTiO3. As shown in the XRD pattern, some carbon species
formed on the Ni-Ti-Al catalyst after 10h of time on stream. The TG pattern of the
post-reaction Ni-Ti-Al catalyst was observed a weight loss stage after the temperature at
720K. The weight loss is attributed to the removal of deposited carbon. Using the same
estimation, the total carbon formed for a gram of catalyst in 10h is 20.8mg, or
2.1mg-C/h/g-cat in average, which is faster than the Ni-Ti catalyst. By comparing with
the reported alumina supported 5wt% nickel catalyst at a rate of 11.3mg-C/h/g-cat [66]
and co-precipitated 33wt% Ni-Al catalyst at a rate of 213 mg-C/h/g-cat [67], the sol-gel
made Ni-Ti-Al catalyst has a much lower carbon deposition rate. The combination of
Ni, Ti and Al in the catalyst using sol-gel method not only maintains the competitive
activity but also improve the stability of the catalyst by suppressing the carbon
deposition and preventing the reduction of TiO2.
It is interesting to observe that titania presents as the crystallite of anatase in the
Ni-Ti-Al catalyst after the calcination at 973K for 10h (Figure 4.23), but as rutile in the
Ni-Ti catalyst shown in Figure 4.11. Rutile is a more stable and final phase of titania,
and anatase transforms into rutile before 973K. As discussed in 4.1.3 Heat Effect on

82
-25
-20
-15
-10
-5
0
250 500 750 1000 1250
Temperature (K)
Inte
nsity
Figure 4.25. DTA analysis 5wt% Ni-Ti-Al catalyst (a) unreduced, (b) reduced at 973K
for 2h, and (c) after 10h reaction.
(a)
(b)
(c)

83
-30
-25
-20
-15
-10
-5
0
5
10
250 500 750 1000 1250
Temperature (K)
Rel
ativ
e G
ravi
ty (m
g/g-
cat)
Figure 4.26. TG analysis of 5wt% Ni-Ti-Al catalyst (a) unreduced, (b) reduced at 973K
for 2h, and (c) after 10h reaction.
(a)
(b)
(c)

84
Crystallite Structure, the extent of the coexistence of rutile and anatase may be due to
the integration of aluminium. The existence of anatase, not rutile, may also contribute to
the better performance of the catalyst.
It is worth noting that there is a sharp negative peak observed at the position of 850K in
the DTA analysis for the post reaction Ni-Ti and Ni-Ti-Al catalysts, corresponding to an
endothermic process. The possible chemical processes in the DTA analysis for the post
reaction catalyst include the oxidation of elemental nickel, and the combustion of
deposited elemental carbon. Both the combustion and the oxidation reactions are
exothermic. So the possible contribution to this sharp negative peak may be due to
desorption of a compound formed during the reaction.

85
CHAPTER 5
CONCLUSIONS AND RECOMMENDATIONS
The conclusions from this research can be drawn as follows:
1. Without rigorous care, such as supercritical CO2 drying, inert gas protected
calcination, and slow ramping of temperature in calcination process, sol-gel made Ni-Ti
catalyst can reach as high as 426m2/g BET surface area as long as the calcinations
temperature maintains at no more than 473K.
2. The two important parameters in sol-gel process, the hydrolysis ratio, H, and
the ratio of acid/alkoxide, AC, influence the resultant catalyst surface area and pore size.
The optimum values of H and AC to obtain possible largest surface area have been
determined in the particular range that this research chose.
3. Calcination temperature has a very significant impact on the surface area of the
resultant catalyst. The Ni-Ti catalyst only have 2m2/g surface area when made using
sol-gel process described in this research followed by the calcination at 973K in air for
10h. Such calcination is inevitable for CO2 reforming of CH4 which would be carried out
at a temperature close to 973K to obtain a reasonable conversion. Collapse of porous
structure and crystallization during the high temperature calcinations lead to the surface
area loss.

86
4. The Ni loading up to 10wt% in sol-gel made Ni-Ti xerogel catalysts show
different properties than pure TiO2. For example, the phase transformation temperatures,
such as from amorphous to brookite and from brookite to anatase and rutile have been
increased and anatase and rutile coexist even after being calcined at 973K for 10h. The
formation of NiTiO3 has been observed. It seems that no NiO exists in the catalysts.
5. The reduction temperature has strong effect on the Ni-Ti catalyst activity. The
activity increases as the reduction temperature increases up to 973K. But further
increasing the reduction temperature renders the drastic decrease in activity till the
catalyst losses all the activity when it had been reduced at 1023K or higher. Longer
reduction time than 2h also causes the activity to decrease. The formation of Ti3O5
during reduction may be one of the reasons that lead to this activity losses; but to clarify
the mechanism needs further studies.
6. The reaction rate controlling regime is determined when the linear velocity is
0.25m/s or larger. At this regime, more Ni loading gives higher activity.
7. Carbon deposition is observed and activity decay is detected during the 4h of
time on stream of the Ni-Ti catalyst.
8. The sol-gel made Ni-Ti-Al catalyst gives more than 2 times higher activity than
the Ni-Ti catalyst and no noticeable deactivation is observed after 10h of time on stream.
Carbon deposition is also found in the reaction over this catalyst.
Based on this research, further investigations should focus on the following respects:
1. Determining the optimum composition of Ni-Ti-Al sol-gel made catalyst,
evaluating this catalyst in a longer time period, and studying the mechanism of the
activity and stability improvement.

87
2. Further studying the mechanism of the effect of reduction temperature on
reaction activity for Ni-Ti sol-gel catalyst.
3. Completing the standardization of the sol-gel process in preparation of Ni-
based catalysts for the dry reforming of CH4 reaction.

88
REFERENCE
1 M.C.J. Bradford, and M.A. Vannice, CO2 Reforming of CH4 Catal. Rev.: Sci. Eng 41
(1) (1999), p.1.
2 “Carbon sequestration projects” DOE Fossile office Web Site. <http://www.fossil.
energy.gov/fred/feprograms.jsp?prog=Carbon+Sequestration> 16 Dec 2004
3 “Carbon sequestration projects” DOE Fossile office Web Site. <http://www.fossil.
energy.gov/fred/feprograms.jsp?prog=Carbon+Sequestration> 16 Dec 2004
4 Y. Soong, A.L. Goodman, J.R. McCarthy-Jones, J.P. Baltrus, Energy Conversion and
Management 45 (11-12) (2004), P.1845.
5 F. Fischer, and H. Tropsch, Brennstoff Chem. 3 (39) (1928)
6 S. Tang, L. Ji, J. Lin, H.C. Zeng, k.L. Tan, and K. Li, CO2 Reforming of methane to
synthesis gas over Sol-gel made Ni/γ-Al2O3 catalysts from organometallic precursors
J. of Catal. 194 (2000), p.424.
7 J.T. Richardson, M. Garrait, J.-K. Hung, Carbon dioxide reforming with Rh and
Pt–Re catalysts dispersed on ceramic foam supports Appl. Catal. A: General 255
(2003), p.69.
8 R. Martínez, E. Romero, C. Guimon and R. Bilbao, CO2 reforming of methane over
coprecipitated Ni–Al catalysts modified with lanthanum Appl. Catl. A: General 274,
(1-2) (2004), p.139.
9 S-H, Lee, D.J., Suh, T-J Park, and K-L Kim, The effect of heat treatment conditions
on the textural and catalytic properties of Nickel-titania Composite aerogel catalysts
Catal. Communi. 3 (2002), p.441.

89
10 M. C. J., Bradford, and M. A., Vannice, CO2 reforming of CH4 over supported Pt
catalysts J. Catal. 173 (1998), p.157.
11 Q.G. Yan, W.Z. Weng, H.L. Wan, H.Toghiani, R.K. Toghiani, and C.U. Pittman, Jr.,
Activation of methane to syngas over a Ni/TiO2 catalyst Appl. Catl. A: General 239
(2003), p.43.
12 K. Tomishige, and K. Fujimoto, Ultra-stable Ni catalysts for methane reforming by
carbon dioxide Catalysis surveys from Japan 2 (1998), p.3.
13 D.J. Suh, T.J. Park, Y.H. Yoon, and J.H. Kim, Nickel-alumina aerogel catalyst for
carbon dioxide reforming of methane and the preparation method thereof, US patent, #
6-355-219, (2002).
14 S. Wang, G.Q. Lu, Reforming of methane with carbon dioxide over Ni/Al2O3
catalysts: Effect of nickel precursor Appl. Catl. A: General 169 (1998), p.271.
15 O. Yamazaki, T. Nozaki, K. Omata, and K. Fujimoto, Chem. Lett., 1953 (1992).
16 A. A. Lemonidou, I. A. Vasalos, Carbon dioxide reforming of methane over 5 wt.%
Ni/CaO-Al2O3 catalyst Appl. Catl. A: General 228 (2002), p.227.
17 J. A. C. Dias, and J. M. Assaf, Influence of calcium content in Ni/CaO/γ -Al2O3
catalysts for CO2-reforming of methane Catal. Today 85 (2003), p.59.
18 A. Takano, T. Tagawa, and S. Goto, J. Chem. Eng. Japan 27 (1994), p.727.
19 S.-B. Tang, F.-L. Qiu, and S.-J. Lu, Effect of supports on the carbon deposition of
nickel catalysts for methane reforming with CO2 Catal. Today 24 (1995), p.253.
20 Z. Chang, Q. Wu, J. Li, and Q. Zhu, Effects of promoters and preparation procedures
on reforming of methane with carbon dioxide over Ni/Al2O3 catalyst Catal. Today, 30,
147 (1996).

90
21 C. Batiot-Dupeyrat, G. Valderrama, A. Meneses, F. Martinez, J. Barrault, J.M.
Tatibouët, Pulse study of CO2 reforming of methane over LaNiO3 Appl. Catl. A:
General 248 (2003), p.143.
22 V. A. Tsipouriari, and X. E. Verykios, Kinetic study of the catalytic reforming of
methane with carbon dioxide to synthesis gas over Ni/La2O3 catalyst Catal. Today 64
(2001), p.83.
23 M. C. J. Bradford, Ph.D. thesis, The Pennsylvania State University (1997)
24 S.-H Seok, S.H. Choi, E.D. Park, S.H. Han, and J.S Lee, Mn-promoted Ni/Al2O3
catalysts for stable carbon dioxide reforming of methane J. Catal. 209 (2002), p.6.
25 S.-H Seok, S.H. Han, J.S. Lee, The role of MnO in Ni/MnO-Al2O3 catalysts for
carbon dioxide reforming of methane Appl. Catl. A: General 215 (2001), p.31.
26 R. Moene, Ph.D dissertation, Delft University of Technology (1995).
27 J. R. Rostrup-Nielsen and J.-H. Bak Hansen, CO2-Reforming of Methane over
Transition Metals J. Catal., 144 (1993), p.38.
28 V. C. H. Kroll, H. M. Swaan, and C. Mirodatos, Methane reforming reaction with
carbon dioxide over Ni/SiO2 catalyst: I. deactivation studies J. Catal. 161 (1996),
p.409.
29 V. R. Choudhary, B. S. Uphade, and A. S. Mamman, Catal. Lett. 32 (1995), P.387.
30 E. Ruckenstein, and Y. H. Hu, Carbon dioxide reforming of methane over
nickel/alkaline earth metal oxide catalysts Appl. Catal. A. General 133 (1995), p.149.
31 Q. Jing, H. Lou, J. Fei, Z. Hou, X. Zheng, Syngas production from reforming of
methane with CO2 and O2 over Ni/SrO–SiO2 catalysts in a fluidized bed reactor
International J. of Hydrogen Energy 29 (2004), p.1245.

91
32 M. C. J. Bradford and M. A. Vannice, Catalytic reforming of methane with carbon
dioxide over nickel catalysts II. Reaction kinetics Appl. Catal. A.: General 142 (1996),
p.97.
33 M. C. J. Bradford and M. A. Vannice, Catalytic reforming of methane with carbon
dioxide over nickel catalysts I. Catalyst characterization and activity Appl. Catal. A.:
General 142 (1996), p.73.
34 T. Osaki, H. Masuda, and T. Mori, Catal. Lett. 29 (1994), p.33.
35 H-S Roh, H.S. Potdar, K-W Jun, Carbon dioxide reforming of methane over
co-precipitated Ni–CeO2, Ni–ZrO2 and Ni–Ce–ZrO2 catalysts Catal. Today 93-95
(2004), p.39.
36 J. A. Montoya, E. Romero-Pascual, C. Gimon, P. Del Angel and A. Monzón,
Methane reforming with CO2 over Ni/ZrO2–CeO2 catalysts prepared by sol–gel Catal.
Today 63 (2000), p.71.
37 H-S Roh, H.S. Potdar, K-W Jun, J-W Kim, and Y-S Oh, Carbon dioxide reforming
of methane over Ni incorporated into Ce–ZrO2 catalysts Appl. Catal. A: General 276
(2004), p.231.
38 J.-S. Chang, S.-E. Park, and H. Chon, Catalytic activity and coke resistance in the
carbon dioxide reforming of methane to synthesis gas over zeolite-supported Ni
catalysts Appl. Catal. A: General 145 (1996), p.111.
39 B. Ølgaard Nielsen, A. C. Luntz, P. M. Holmblad, and I. Chorkendorff, Catal. Lett.
32 (1995), p.15.
40 D. C. Seets, M. C. Wheeler, and C. B. Mullins, Chem. Phys. Lett. 266 (1997), p.431.

92
41 E. O. F. Zdansky, A. Nilsson, and N. Mårtensson, CO-induced reversible surface to
bulk transformation of carbidic carbon on Ni(100) Surf. Sci. 310 (1994), L583.
42 V. V. Chesnokov, V. I. Zaikovskii, R. A. Buyanov, V. V. Molchanov, and L. M.
Plyasova, Morphology of carbon from methane on nickel-containing catalysts Catal.
Today 24 (1995), p.265.
43 T. Horiuchi, K. Sakuma, T. Fukui, Y. Kubo, T. Osaki, and T. Mori, Suppression of
carbon deposition in the CO2-reforming of CH4 by adding basic metal oxides to a
Ni/Al2O3 catalyst Appl. Catal. A: General 144 (1996), p.111.
44 Z. L. Zhang, and X. E. Verykios, Carbon dioxide reforming of methane to synthesis
gas over supported Ni catalysts Catal. Today 21 (1994), p.589.
45 H. M. Swaan, V. C. H. Kroll, G. A. Martin, and C. Mirodatos, Deactivation of
supported nickel catalysts during the reforming of methane by carbon dioxide Catal.
Today 21 (1994), p.571
46 V. A. Tsipopuriari, A. M. Efstathiou, Z. L. Zhang, and X. E. Verykios, Morphology
of carbon from methane on nickel-containing catalysts Catal. Today 21 (1994), p.579
47 Y.-G. Chen, and J. Ren, Catal. Lett. 29 (1994), p.39.
48 Y. H. Yu, and E. Ruckenstein, Temperature-Programmed desorption of CO adsorbed
on NiO/MgO J. Catal. 163 (1996), p.306.
49 O.-S. Joo, and K.-D. Jung, CH4 dry reforming on alumina-supported nickel catalyst
Bull. Korean Chem. Soc. 23, (8) (2002), P.1149.
50 J. R. Rostrup-Nielsen, Stud. Surf. Sci. Catal. 68 (1991), p.85.
51 L. Mleczko, S. Malcus, and T. Wurzel, Catalytic reformer-combustor: a novel
reactor concept for synthesis gas production. Ind. Eng., Chem. Res. 36 (1997), p.4459.

93
52 T. Wurzel, S. Malcus, L. Mleczko, Reaction engineering investigations of CO2
reforming in a fluidized-bed reactor Chem. Eng. Sci. 55 (2000), p.3955.
53 A.I. Tsyganok, K. Suzuki, S. Hamakawa, K. Takehira, and T. Hayakawa, Mg-Al
layerer double hydroxide intercalated with [Ni(edta)]2- chelate as a precursor for an
efficient catalyst of methane reforming with carbon dioxide Catalysis Letters 77
(2001), p.1.
54 W-S Dong, H-S Roh, K-W Jun, S-E Park, and Y-S Oh, Methane reforming over
Ni/Ce-ZrO2 catalysts: effect of nickel content Applied catal. A: General 226 (2002),
p.63.
55 K. Hwang, H.Y. Zhu, and G.Q.Lu, New nickel catalysts supported on highly porous
alumina intercalated laponite for methane reforming with CO2 Catal. Today 68
(2001), p.183.
56 P. Zheng, H.Y. Zhu, and G.Q.Lu, Zr-Laponite pillared clay-based catalysts for
methane reforming with carbon dioxide Applied Catal. A: General 242 (2003), p. 275.
57 G. Ertl, H. Knözinger, J. Weitkamp, in Preparation of Solid Catalysts (1999), P.95.
58 C.J., Brinker, G.W., Scherer, in Sol-Gel Science – the physics and chemistry of
sol-gel processing Academic press, INC (1990)
59 M., Schneider, A., Baiker Review, Yitania-based aerogels Catal. Today 35 (1997),
P.339.
60 D.J. Taylor, P.F. Fleig, R.A. Page, Thin Solid Films 408 (2002), p.104.
61 Y. Zhang, and A. Reller, Chem. Commun (2002), p.606.
62 M. Wakamatsu, N. Takeuchi, G.-C. Lai, Yogio-kyokaishi 95 (1987), p.1181.
63 B.J. Burrow, A.E. Morgan, R.C. Ellwanger, J. vac. Sci. Technol. A4 (1986), p.2463.

94
64 V.I. Nefedov, D. Gati, B.F. Dzhurinskii, N.P. Sergushin, Y.V. Salyn, Russian
Journal of Inorganic Chemistry 20 (1975), p.2307.
65 E. Milella, F. Cosentino, A. Licciulli, C. Massaro, Biomaterials 22 (2001), p1425.
66 T. Tanaka, Z. Hou, O. Yokota, T. Yashima, Study of durable catalyst Internal
Reference
67 R. Martinez , E. Romero, C. Guimon, R. Bilbao, CO2 reforming of methane over
coprecipitated Ni–Al catalysts modified with lanthanum Appl. Catal. A: General 274
(2004), p.139.

95
Appendix A This section contains equations employed for calculations and all of the data obtained
from the catalyst preparation and equipment calibration.
1 Equations employed for calculations 1-A: Equation for Conversion
I
OI
FFF
A−
=
A : Conversion of respective reactant IF : Inlet flow rate of respective reactant (SCCM)
OF : Outlet flow rate of respective reactant (SCCM)
1-B: Equation for Selectivity
)(2,4,4
2
2
OI CHCH
HH FF
FS
−×=
)()(,2,2,4,4 OIOI COCOCHCH
COCO FFFF
FS
−+−=
ICHF
,4: Inlet flow rate of CH4 (SCCM)
OCHF,4
: Outlet flow rate of CH4 (SCCM)
COF : Outlet flow rate of CO (SCCM)
ICOF,2
: Inlet flow rate of CO2 (SCCM)
OCOF,2
: Outlet flow rate of CO2 (SCCM)
2HF : Outlet flow rate of H2 (SCCM)
2HS : Selectivity of H2
COS : Selectivity of CO

96
1-C: Equation for Reaction Rate
Cat
xx W
FR
×××∆
=604.221000
xF∆ : Flow rate of respective reactant consumed during the reaction (SCCM)
xR : Reaction rate of respective reactant (mol/g-cat/s)
CatW : Weight of catalyst (g-cat) 2 Introduction to Design Expert 6.0
Design Expert is a Windows-based program, owned by Stat-Ease, which can be used to
optimize a process. It provides many powerful statistical tools:
1, Two-level factorial screening studies -- Identify the vital factors that affect the
process or product.
2, General factorial studies -- Discover the ideal combination of categorical factors,
such as source versus type of raw material supply. Identify the vital factors that affect
your process or product.
3, Response surface methods (RSM) -- Find the ideal process settings. Achieve
optimal performance.
4, Mixture design techniques -- Discover the optimal formulation.
5, Combinations of process factors, mixture components, categorical factors --
Tailor the design of experiments to what you need to know.
This part of the project was designed using the methodology of RSM with a standard
RSM design, Central Composite Design (CCD). CCD’s are designed to estimate the
coefficient of a quadratic model. A CCD has three groups of design points:

97
1, Factorial design points—Consists of all possible combinations of the +1 and -1
levels of factors. For this case of two factors there are four design points: (-1,-1), (+1,-1),
(-1,+1), and (+1,+1).
2, Axial points—For the two factors design, four axial points are: (-α,0), (α,0), (0,-
α), (0,α). The value for α is calculated in each design for both rotatatibility and
orthogonality of the blocks. The value of α is 1.41421 in this case.
3, Central points—The middle point of each factor (0,0). Central points are usually
repeated 4-6 times to get a good estimate of experimental error. There are five central
points generated in this case.
3 Equation Predicted by Design Expert 6.0
ACHACHACHSABET **3.94*1051*97.2*7.12214.17.263 22 −++−∗+=
ACHDAve *41.5*71.23.19 ++=
AC : Acid/Alkoxide (0.05-0.35)
AveD : Average pore diameter (Ǻ)
H : Hydrolysis ratio (1-6)
BETSA : BET surface area (m2/g)

98
Table A-1 Recipe of the optimization of the sol-gel process for making 4g 10wt% Ni-Ti
catalyst
Precursor solution Hydrolysant
Run # Ti(BuOH)4
(mL)
Ni(NO3)2.6H2O
(g)
MeOH
(mL)
H2O
(mL)
HNO3
(mL)
MeOH
(mL)
Run 1 1.98 15.4 15 4.9 0.25 5
Run 2 1.98 15.4 15 0.93 0.56 5
Run 3 1.98 15.4 15 3.26 0.56 5
Run 4 1.98 15.4 15 3.26 0.14 5
Run 5 1.98 15.4 15 3.26 0.56 5
Run 6 1.98 15.4 15 5.58 0.56 5
Run 7 1.98 15.4 15 1.61 0.87 5
Run 8 1.98 15.4 15 3.26 0.56 5
Run 9 1.98 15.4 15 3.26 0.98 5
Run 10 1.98 15.4 15 4.9 0.87 5
Run 11 1.98 15.4 15 1.61 0.25 5
Run 12 1.98 15.4 15 3.26 0.56 5
Run13 1.98 15.4 15 3.26 0.56 5

99
Table A-2 Recipe of the sol-gel process for making 10g of Ni-Ti catalyst under the
optimal operation condition
1wt% 3wt% 5wt% 10wt%
Ti(BuOH)4 (mL) 42.3 41.4 40.6 38.4
Ni(NO3)2.6H2O (g) 0.5 1.5 2.5 5
Precursors
solution
MeOH (mL) 41.8 40.9 40.1 38
H2O (mL) 11.6 11.4 11.2 10.6
HNO3 (mL) 0.55 0.54 0.53 0.50
Hydrolysant
MeOH (mL) 20 20 20 20
Table A-3 Recipe of the 10g 5wt% NixTiyAlz catalyst
Precursor Solution Hydrolysant
Ti(BuOH)4
(mL)
Ni(AC)2.4H2O
(g)
Al2(NO3)3.9H2O
(g)
MeOH
(mL)
H2O
(mL)
HNO3
(mL)
MeOH
(mL)
20.28 2.12 17.47 40 5.29 0.25 15

100
0
50
100
150
200
250
0 50 100 150 200 250
MFC Readout
Flow
rate
(SC
CM
)N2 Port
Figure A-1. MFC calibration — N2 port
0
20
40
60
80
100
120
140
0 20 40 60 80 100 120 140
MFC readout
Flow
rat
e (S
CCM
)
CH4 Port
Figure A-2. MFC calibration — CH4 port

101
0
20
40
60
80
100
120
0 20 40 60 80 100 120
MFC readout
Flow
rat
e (S
CCM
)CO2
Figure A-3. MFC calibration — CO2 port
Amount[mol%0 25
Area
0
10
20
30
40
50
60
10
11
15
1314
16
18
H2, TCD1 A
Correlation: 0.99938
Rel. Res%(10): 1.857
Area = 0.92207499*Amt -1.1037471
Figure A-4. GC calibration – H2
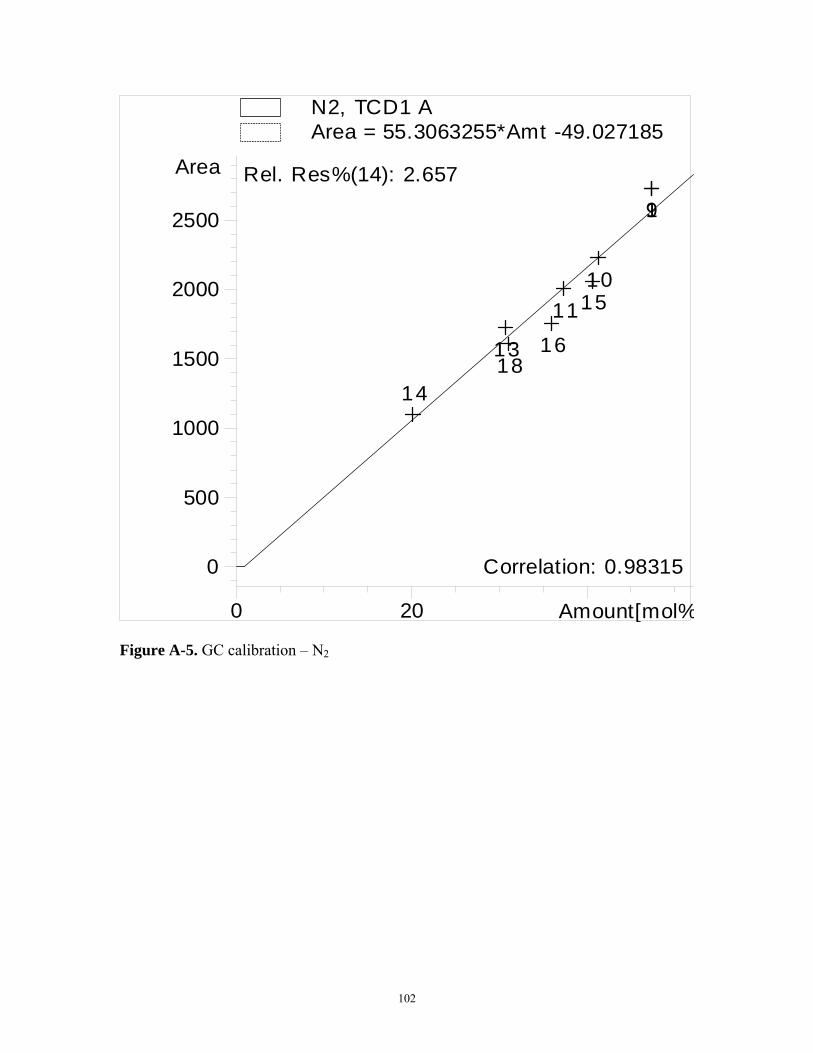
102
Amount[mol%0 20
Area
0
500
1000
1500
2000
2500
14
1318
16
111510
19
N2, TCD1 A
Correlation: 0.98315
Rel. Res%(14): 2.657
Area = 55.3063255*Amt -49.027185
Figure A-5. GC calibration – N2

103
Amount[mol%0 20
Area
0
500
1000
1500
2000
10
11
13
14
CO, TCD1 A
Correlation: 0.99912
Rel. Res%(10): 8.1229e-1
Area = 53.6522346*Amt +27.039079
Figure A-6. GC calibration – CO

104
Amount[mol%0 20
Area
0
200
400
600
800
1000
1200
1400
18
16
15 11
9
10
CH4, TCD1 A
Correlation: 0.99853
Rel. Res%(18): 1.674
Area = 43.1443944*Amt -26.499801
Figure A-7. GC calibration – CH4

105
Amount[mol%0 10
Area
0
250
500
750
1000
1250
1500
1750
18
16
15
9
CO2, TCD1 A
Correlation: 0.99469
Rel. Res%(18): 2.743
Area = 66.1086588*Amt +6.8622591
Figure A-8. GC calibration – CO2

106
Appendix B
This section contains all of the raw data calculated by GC from the catalyst evaluations
Table B-1 Concentration of gases in effluent for the evaluation of reduction temperature
Temp (K) H2(%) N2(%) CO(%) CH4(%) CO2(%)
823 9.42 41.72 13.47 17.5 17.89
893 22.71 35.5 28.24 7.21 6.33
97 24.74 34.8 30.07 5.56 4.48
1003 17.1 38.21 23.09 11.57 10.07
1023 1.71 45.91 0.33 25.32 26.72
1073 1.65 45.88 0.31 26.09 26.06

107
Table B-2 Concentration of gases in effluent for the evaluation of reduction time
Time (h) H2(%) N2(%) CO(%) CH4(%) CO2(%)
2 26.59 33.81 31.04 4.55 4.01
4 24.74 34.8 30.07 5.56 4.84
6 21.78 36.1 27.82 7.63 6.68
Table B-3 Concentration of gases in effluent for the evaluation of feed rate
Linear velocity (m/s) H2(%) N2(%) CO(%) CH4(%) CO2(%)
0.05 25.62 34.41 31.18 4.67 4.1
0.15 18.05 38.78 23.64 11.19 8.34
0.25 13.87 41.32 19 14.51 11.3
0.35 11.02 42.39 16.2 16.91 13.47
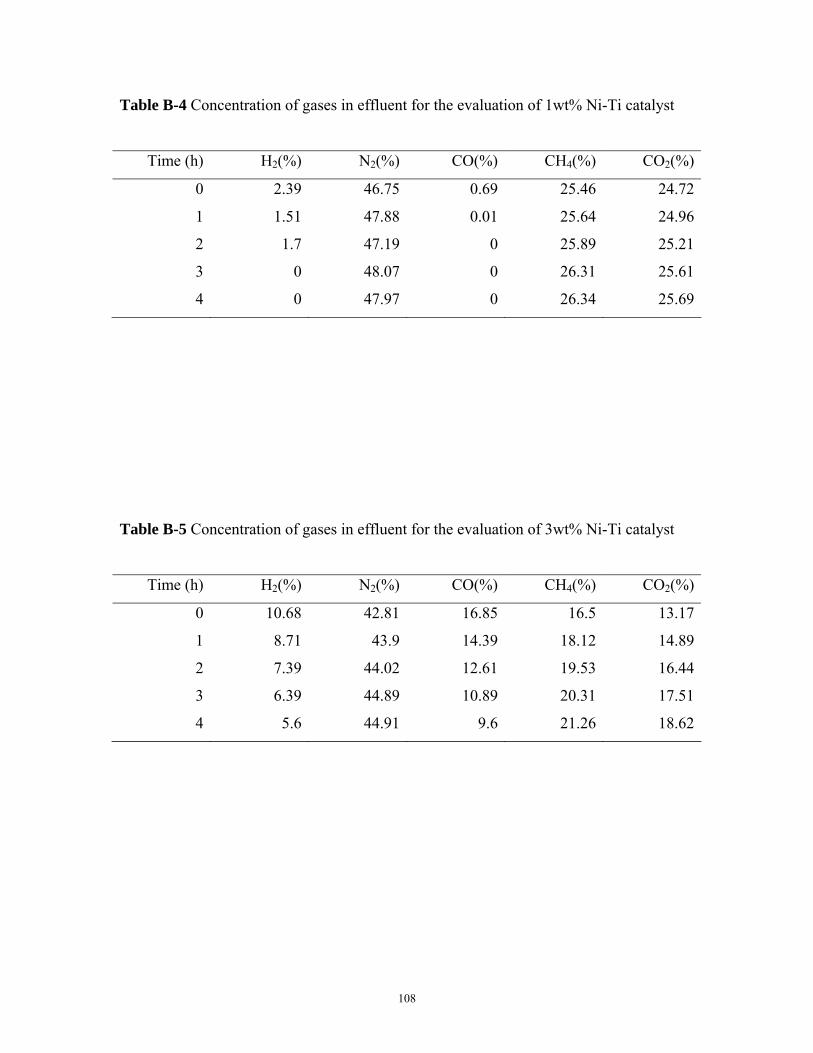
108
Table B-4 Concentration of gases in effluent for the evaluation of 1wt% Ni-Ti catalyst
Time (h) H2(%) N2(%) CO(%) CH4(%) CO2(%)
0 2.39 46.75 0.69 25.46 24.72
1 1.51 47.88 0.01 25.64 24.96
2 1.7 47.19 0 25.89 25.21
3 0 48.07 0 26.31 25.61
4 0 47.97 0 26.34 25.69
Table B-5 Concentration of gases in effluent for the evaluation of 3wt% Ni-Ti catalyst
Time (h) H2(%) N2(%) CO(%) CH4(%) CO2(%)
0 10.68 42.81 16.85 16.5 13.17
1 8.71 43.9 14.39 18.12 14.89
2 7.39 44.02 12.61 19.53 16.44
3 6.39 44.89 10.89 20.31 17.51
4 5.6 44.91 9.6 21.26 18.62

109
Table B-6 Concentration of gases in effluent for the evaluation of 5wt% Ni-Ti catalyst
Time (h) H2(%) N2(%) CO(%) CH4(%) CO2(%)
0 12.28 41.67 18.32 15.53 12.21
1 10.02 43.05 15.74 17.24 13.94
2 8.98 43.37 14.65 18.32 14.68
3 8.17 43.82 13.5 18.87 15.65
4 7.3 44.24 12.55 19.53 16.37
Table B-7 Concentration of gases in effluent for the evaluation of 10wt% Ni-Ti catalyst
Time (h) H2(%) N2(%) CO(%) CH4(%) CO2(%)
0 20.35 37.88 25.24 9.63 6.9
1 17.16 39.57 22.55 11.78 8.94
2 15.68 39.97 21.2 13 10.15
3 14.9 40.38 20.17 13.74 10.8
4 13.96 41.23 19.17 14.26 11.37

110
Table B-8 Concentration of gases in effluent for the evaluation of 5wt% Ni-Ti-Al
catalyst
Time (h) H2(%) N2(%) CO(%) CH4(%) CO2(%)
0 19.11 38.12 22.26 11.2 9.32
1 19.9 37.17 23.19 10.81 8.93
2 20.02 37.24 23.27 10.7 8.77
3 19.86 37.48 23.23 10.7 8.73
4 19.95 37.06 23.46 10.77 8.76
7 19.56 37.54 23.29 10.83 8.78
10 19.5 37.22 23.27 10.49 9.51
![sol-gel ¼ö¾÷ÀÚ·á [ȣȯ ¸ðµå]](https://static.fdocuments.in/doc/165x107/577cd0b11a28ab9e7892e134/sol-gel-oeaua-da.jpg)


![by - CORE · The project deals with sol-gel-derived films doped with a ruthenium complex whose ... entrapped in a porous sol-gel-derived film [15]. 1.4 Motivation ... "The Sol-Gel](https://static.fdocuments.in/doc/165x107/60e45eab594d5f4a423a3995/by-core-the-project-deals-with-sol-gel-derived-films-doped-with-a-ruthenium-complex.jpg)