Sol-gel modified Pechini method for obtaining ... · J Sol-Gel Sci Techn (2007) 42:79–88 DOI...
10
J Sol-Gel Sci Techn (2007) 42:79–88 DOI 10.1007/s10971-006-1517-3 Sol-gel modified Pechini method for obtaining nanocrystalline KRE(WO 4 ) 2 (RE = Gd and Yb) M. Galceran · M. C. Pujol · M. Aguil´ o · F. D´ ıaz Received: 23 August 2006 / Accepted: 22 November 2006 / Published online: 1 January 2007 C Springer Science + Business Media, LLC 2007 Abstract KRE(WO 4 ) 2 (RE = Gd and Yb) nanocrys- talline powder was obtained by the modified sol-gel Pechini method. The precursor powder was calcined between 923 and 1023 K for a maximum of 6 h at air atmosphere. DTA- TG of the precursor powder shows that the temperature for total calcination is around 800–850 K. Molar ratio between the complexing agent and the metal ions in the first step of the method and molar ratio between the complexing agent and the ethylene glycol in the second step of the method were studied to optimize the preparation process. X-ray diffraction and IR spectroscopy were used to study the transformation from precursor powder into a crystalline monoclinic phase. Raman spectroscopy was used to study the vibrational struc- ture of the nanoparticles. The Scherrer formula was used to confirm the grain sizes visualized by SEM and TEM tech- niques. Small nanoparticles in the range of 20–50 nm of monoclinic KREW have been successfully obtained by this methodology. Keywords Sol-gel method . Monoclinic double tungstates . Nanocrystals . Ytterbium M. Galceran · M. C. Pujol () · M. Aguil ´ o · F. D´ ıaz F´ ısica i Cristal · lografia de Materials (FiCMA), Universitat Rovira i Virgili, Campus Sescelades c/ Marcel.l´ ı Domingo, s/n E-43007- Tarragona, Spain e-mail: [email protected] M. Galceran e-mail: [email protected] M. Aguil ´ o e-mail: [email protected] F. D´ ıaz e-mail: [email protected] 1 Introduction In recent years KRE(WO 4 ) 2 (RE = Gd and Yb) has been reported in the literature as a promising solid state laser ma- terial [1]. Ytterbium-doped tungstates are an interesting al- ternative to Nd:YAG applications [2]. The monoclinic phase of these materials has an interesting anisotropy in optical ap- plications for obtaining polarized emissions. These materials are also known for their high value of the χ 3 third-order non- linear coefficient, which makes them highly efficient materi- als for Stimulated Raman Scattering (SRS) applications [3, 4]. Moreover, KREW materials can be highly doped with active laser rare earth ions while maintaining their high crys- talline quality and excellent properties. Examples of these materials are KYbW [5], KErW [6], KHoW [7] and KDyW [8]. To expand their applications, several preparations of these materials have been made. KREW bulk crystals were tradi- tionally prepared by the Top Seeded Solution Growth Slow Cooling method (TSSG-SC). Thin films have been synthe- sized by laser ablation [9] and by Liquid Phase Epitaxial growth [10, 11] for waveguide and thin disk applications, re- spectively. To our knowledge, monoclinic KREW (RE = Gd and Yb) tungstates have not been prepared as nanocrystals. Ceramic and nanocrystalline materials provide several al- ternatives to classic bulk laser crystals. YAG ceramic lasers have comparable optical properties to those of bulk laser crystals. In recent years, the output power of these laser ce- ramics doped with Nd has increased to the kW range [12]. Mechanical and thermal properties can be improved in a ceramic configuration for a laser [13]. As is mentioned in the literature, laser ceramics can be obtained in big size and cheaper than single crystal materials. The preparation of ce- ramic anisotropic materials for laser applications currently presents a challenge. Springer
Transcript of Sol-gel modified Pechini method for obtaining ... · J Sol-Gel Sci Techn (2007) 42:79–88 DOI...
J Sol-Gel Sci Techn (2007) 42:79–88DOI 10.1007/s10971-006-1517-3
Sol-gel modified Pechini method for obtaining nanocrystallineKRE(WO4)2 (RE = Gd and Yb)M. Galceran · M. C. Pujol · M. Aguilo · F. Dıaz
Received: 23 August 2006 / Accepted: 22 November 2006 / Published online: 1 January 2007C© Springer Science + Business Media, LLC 2007
Abstract KRE(WO4)2 (RE = Gd and Yb) nanocrys-talline powder was obtained by the modified sol-gel Pechinimethod. The precursor powder was calcined between 923and 1023 K for a maximum of 6 h at air atmosphere. DTA-TG of the precursor powder shows that the temperature fortotal calcination is around 800–850 K. Molar ratio betweenthe complexing agent and the metal ions in the first step ofthe method and molar ratio between the complexing agentand the ethylene glycol in the second step of the method werestudied to optimize the preparation process. X-ray diffractionand IR spectroscopy were used to study the transformationfrom precursor powder into a crystalline monoclinic phase.Raman spectroscopy was used to study the vibrational struc-ture of the nanoparticles. The Scherrer formula was used toconfirm the grain sizes visualized by SEM and TEM tech-niques. Small nanoparticles in the range of 20–50 nm ofmonoclinic KREW have been successfully obtained by thismethodology.
Keywords Sol-gel method . Monoclinic doubletungstates . Nanocrystals . Ytterbium
M. Galceran · M. C. Pujol (�) · M. Aguilo · F. DıazFısica i Cristal · lografia de Materials (FiCMA), Universitat Rovirai Virgili, Campus Sescelades c/ Marcel.lı Domingo, s/n E-43007-Tarragona, Spaine-mail: [email protected]
M. Galcerane-mail: [email protected]
M. Aguiloe-mail: [email protected]
F. Dıaze-mail: [email protected]
1 Introduction
In recent years KRE(WO4)2 (RE = Gd and Yb) has beenreported in the literature as a promising solid state laser ma-terial [1]. Ytterbium-doped tungstates are an interesting al-ternative to Nd:YAG applications [2]. The monoclinic phaseof these materials has an interesting anisotropy in optical ap-plications for obtaining polarized emissions. These materialsare also known for their high value of the χ3 third-order non-linear coefficient, which makes them highly efficient materi-als for Stimulated Raman Scattering (SRS) applications [3,4]. Moreover, KREW materials can be highly doped withactive laser rare earth ions while maintaining their high crys-talline quality and excellent properties. Examples of thesematerials are KYbW [5], KErW [6], KHoW [7] and KDyW[8].
To expand their applications, several preparations of thesematerials have been made. KREW bulk crystals were tradi-tionally prepared by the Top Seeded Solution Growth SlowCooling method (TSSG-SC). Thin films have been synthe-sized by laser ablation [9] and by Liquid Phase Epitaxialgrowth [10, 11] for waveguide and thin disk applications, re-spectively. To our knowledge, monoclinic KREW (RE = Gdand Yb) tungstates have not been prepared as nanocrystals.
Ceramic and nanocrystalline materials provide several al-ternatives to classic bulk laser crystals. YAG ceramic lasershave comparable optical properties to those of bulk lasercrystals. In recent years, the output power of these laser ce-ramics doped with Nd has increased to the kW range [12].Mechanical and thermal properties can be improved in aceramic configuration for a laser [13]. As is mentioned inthe literature, laser ceramics can be obtained in big size andcheaper than single crystal materials. The preparation of ce-ramic anisotropic materials for laser applications currentlypresents a challenge.
Springer
80 J Sol-Gel Sci Techn (2007) 42:79–88
Sol-gel technology, by which composite organic-inorganic materials are made at relatively low temperature,involves the hydrolysis of the constituent molecular pre-cursors and subsequent polycondensation to glass-like form[14]. Sol-gel methods enable homogenous samples to be ob-tained at low temperatures and the starting cationic compo-sition to be maintained by using metal salts as raw materialsand mixing them in a liquid solution. The most obvious ad-vantage of this Sol-gel method is that reagents are mostlymixed in atomic level, which may increase the reaction rateand decrease the synthesis temperature. In 1967, Pechini[15] developed a process for the preparation of the precur-sor polymeric resin. First, a mixture of cations is formed inan organic complexing agent, CA, (citric acid or ethylenedi-aminetetraacetic acid, EDTA) and ethylene glycol solution.Second, the cations become a chelate and the polymeric resinforms. Finally this polymer decomposes at 573 K. Two reac-tions are involved—a complex formation between citric acidor EDTA and metals, and a sterification between citric acidor EDTA and ethylene glycol (EG). The aim of the polymericorganic net by sterification is to reduce any segregation ofthe cations [16].
Nanostructured Yb:YAG materials were obtained by thePechini method by Hreniak et al. [17]. In 2004 year, a thinfilm of Gd2(WO4)3 was prepared using the Pechini method[18].
To our knowledge, KREW (RE = Gd and Yb) have notbeen obtained as nanoparticle powder. As we mentionedabove, the preparation of ceramic anisotropic materials forlaser applications is currently a challenge. With this in mind,the first step to creating an anisotropic laser ceramic ofKREW, a well-known anisotropic solid state laser host, isto obtain monoclinic nanocrystals of KREW tungstates. Theactivity of the grains in the sintering process is known to beenhanced by the nature of nanodimensions [19]. Hence theimportance of obtaining nanocrystals of KREW, which is themain objective of the present paper.
2 Experimental section
2.1 Preparation of the precursor polymeric resin
Powders of K2CO3 (Fluka, 99.0%), RE2O3 (Aldrich, 99.9%)and ammonium (para)tungstate (NH4)10W12O41·7H2O(Riedel-de Haen, 99%) were used as starting materials. Theywere dissolved in concentrated HNO3. As WO3 is insol-uble in HNO3 at room temperature, we used ammonium(para)tungstate. Afterwards, the nitrate solution was totallyevaporated maintaining the solution around 100◦C. Through-out this step, the elements were mixed atomically.
Taking in account the moles of the complexing agent[CA], the moles of the metal cations [METAL], and
the moles of ethylene glycol [EG], two molar ratios:[CA]/[METAL] = CM and [CA]/[EG] = CE can be de-fined. The microstructure of the resulting powder is relatedwith these two ratios. CM describes the degree of the chela-tion process of the metal in the organic product. For solu-tions with low CM ratios (CM < 1), there may be precipi-tation of the metals salts on the solution and, therefore, nouniformity in the chelation of the metals. This is due to in-sufficient organic molecules to chelate metal cations. Twoorganic compounds were used as chelating agents: concen-trated citric acid solution in the first experiment and EDTA,for the following experiments. With one molecule of citricacid, one metal ion can be chelated by three bonds, and withone molecule of EDTA, it can be chelated by six bonds. SoEDTA has a stronger chelating power to metal ions than cit-ric acid. On the other hand, for relatively high CM ratios, itis easy to dissolve the metal ions but the amount of organicsto be removed is excessive [20]. Then, in this paper we havestudied the effect of CM ratio in the range of CM = 1, 2 and3. Higher CM ratios will lead to an excess of organics.
CE describes the degree of sterification between thechelating agent and the ethylene glycol. This created a rigidpolyester net that reduces any segregation of metals dur-ing the polymer decomposition process at high temperatures[21]. The ratio CE affects morphologies in the ceramic pow-der. Equimolar ratio leads to the most porous resin [22, 23].As well the studied range of CE was CE = 1, 2 and 3.
In this study, we used different CM and CE ratios in orderto optimize them and study their effects. The precipitate wasthen dissolved in concentrated citric solution (99.9%) or con-centrated EDTA solution (99.9%), governed by the CM ratio.We then added ethylene glycol to produce a sterification,governed by the CE ratio. The resin formation takes place at363 K; during this reaction the resin gels. Afterwards, goingon with the heating, the resin is dried.
2.2 Preparation of the nanocrystals
The following step was a previous calcination at 573 K duringthree hours to start to decompose the resin. The next step wasto calcine the precursor powder, which is a brown powder,at different temperatures and at air atmosphere for severalhours. Table 1 shows the conditions for these experiments.Experiments 1 to 3 were done to prepare KGdW; experiments4 to 15 were done to prepare KYbW. From the 1, 4, 5, 6 and7, at fixed CM at CE ratios, we determined the optimumcalcination temperature and time. Further experiments werecarried out to study the effects of the various CM and CE.
2.3 Experimental details and apparatus
Thermogravimetric thermal analysis (TA instruments DTA-TG device) of the precursor powder (approximately 10 mg)
Springer
J Sol-Gel Sci Techn (2007) 42:79–88 81
Table 1 Summary of the experiments (CM = [CA]/[METAL] and CE = [CA]/[EG]). (∗In this experiment the complexing agent, CA, was citricacid)
Calcination programMolar ratios Calcination time
Experiment Compound CM CE
Calcinationtemperature (K) t1 t2 t3 t4
1 KGdW 3∗ 2 573–1123 K (6–8 h) Fig. 4(a)2 KGdW 3 2 973 63 KGdW 3 2 973 64 KYbW 3 2 873 3 h 4 h 5 h5 KYbW 3 2 923 3 h 4 h 5 h6 KYbW 3 2 973 2 h 3 h 4 h 5 h7 KYbW 3 2 1023 2 h 3 h 4 h 5 h8 KYbW 3 1 973 30’ 1 h30’ 2 h 3 h9 KYbW 3 3 973 30’ 1 h30’ 2 h 3 h
10 KYbW 1 2 973 2 h 3 h 4 h 5 h11 KYbW 2 2 973 3 h 4 h 5 h12 KYbW 1 1 973 2 h 3 h 4 h 5 h13 KYbW 1 3 973 3 h 4 h 5 h 6 h14 KYbW 2 3 973 3 h 4 h 5 h 6 h15 KYbW 2 1 973 3 h 4 h 5 h 6 h
was conducted using a DTA-TG instrument in an air flow of90 cm3/h at a heating rate of 10 K/min in order to characterizethe thermal decomposition. Al2O3 was used as a reference.
Precursor powder and calcined powder at various stages ofthe calcination process were characterized by Fourier Trans-form Infrared Spectroscopy (FTIR) at room temperature withan FT/IR-680 Plus Fourier Transform Infrared Spectrometerby averaging 32 scans and with a resolution of 4 cm−1 foreach spectrum.
Structural characterization was carried out by powderX-ray diffraction (XRD) using a D-5000 diffractome-ter, with a Bragg-Brentano parafocusing geometry, fromSiemens with θ -θ configuration. This device contained anX-ray standard Cu-tube, so the radiation used was Kα1
(λ1 = 1.540560 Å). The detector was a double collimatedscintillation counter. The measurements were carried out instep-scanning mode. The diffraction angle (2θ ) ranged be-tween 10 and 70◦. The X-ray powder diffraction patternswere recorded at step size = 0.05◦, step time = 3 s for iden-tification of the crystalline phases and at step size = 0.02◦,step time = 16 s for unit cell refinement. Lattice parameterswere calculated using the FULLPROF program [24] basedon the Rietveld method [25]. The number of refined param-eters was 13. The single X-ray diffraction model was usedas the starting structure [5, 26].
The crystallite size L, was measured using Scherrer’sequation L = Kλ/(βcosθB) for peak broadening due to sizeeffects. β is the FWHM (Full width at half maximum) mea-sured in radians on the 2θ scale, λ is the wavelength used,θB is the Bragg angle for the measured hkl peak and K is a
constant equal to 0.9 for L taken as the volume-averaged crys-tallite dimension perpendicular to the hkl diffraction plane[27].
The scanning electronic microscope (SEM) JEOL JSM6400 was used to observe the resulting KREW powder. Thesamples had to be coated by a conductor media, which isusually Au. The device used to sputter Au on our sampleswas Bal-Tec SCD004. SEM equipment was used to observethe degree of homogeneity of the samples through SEM mi-crographs. A transmission electron microscope (TEM) JEOLJEM-1011 with a MegaView III Soft Imaging System wasalso used to observe the nanoparticles of KREW. The im-ages were observed using a current accelerating voltage of90 kV.
Raman scattering was used to study the vibrationalstructure of the nanocrystals obtained. The experimen-tal set-up comprised a Jobin-Yvon T64000 spectrome-ter with excitation in the visible via a CW argon laser(Coherent INNOVA 300, λ = 514 nm). Behind thetriple monochromator (1800 g/mm), the light was de-tected by a two-dimensional CCD matrix cooled with liq-uid N2. A premonochromator eliminated the plasma dis-charge lines of the argon laser. The laser power inci-dent on the sample was about 2 mW. A backward scat-tering scheme was chosen to increase the signal-to-noiseratio.
Along the paper, some aspects of the nanocrystals werecompared with a bulk single crystal of the monoclinic KREWobtained by Top Seeded Solution Growth, grown previously[5, 26].
Springer
82 J Sol-Gel Sci Techn (2007) 42:79–88
Metals-EDTA Complex
Mixed solution
RE2O3, K2CO3 and (NH4)10W12O41·7H2O + HNO3
Nitrates precipitates
Evaporation
Molar ratio [CA]/[METAL] =CM
Molar ratio [CA]/[EG] =CEHeating at 363K
Precursor resin
KREW NANOCRYSTALS
Calcination
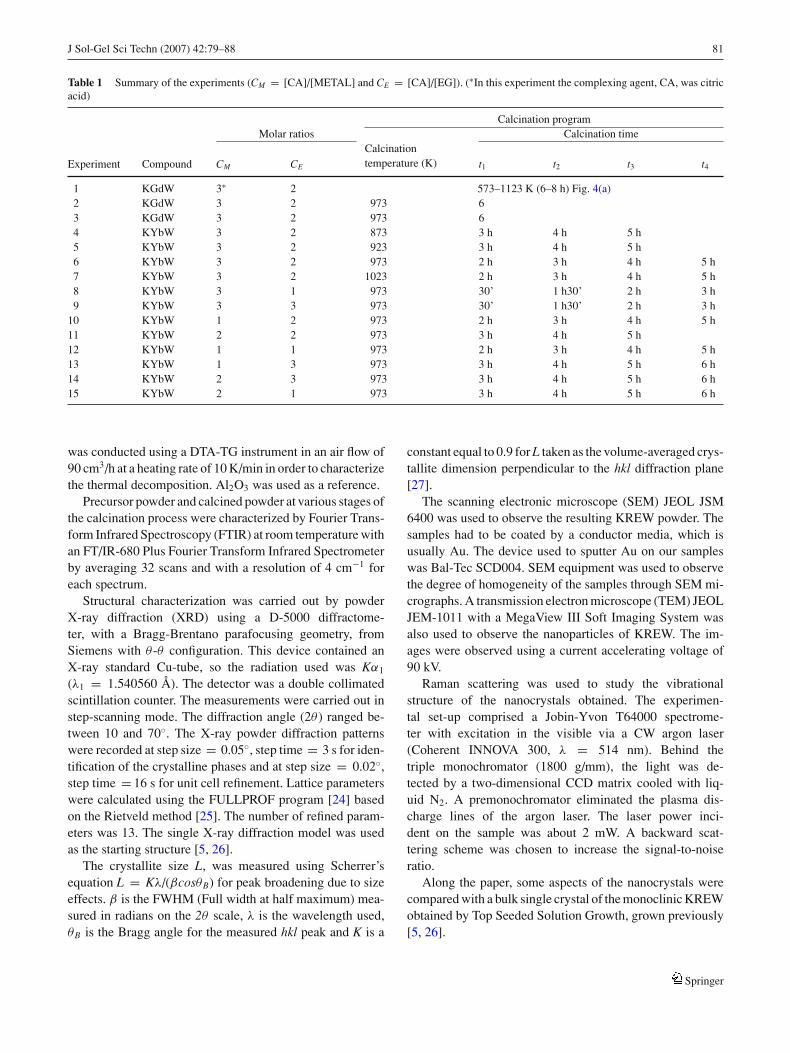
Fig. 1 Flow scheme of thePechini method for KREWnanocrystals synthesis
3 Results and discussion
3.1 Applied modified Pechini method
A flow chart of the procedure for preparing the KREW us-ing the modified Pechini method is shown in Fig. 1. ThePechini method uses the ability of organic acids to formpolybasic acid chelated with several cations. Chelation, orthe formation of complex ring-shaped compounds aroundthe metal cations, then takes place in the solution. Citric acidor EDTA can be used as the chelating agent. Metals ions arechelated by the carboxyl groups and remain homogeneouslydistributed in the polymeric network.
The time and temperature of the calcination procedureaffects the size of the grain. Powders prepared at the low-est temperature have the smallest crystallite size. At highertemperatures, the rates of crystal growth and moleculardiffusion are enhanced, which fuses the small aggregatedcrystallites. This leads to the formation of well-definedcrystals.
3.1.1 Control of modified Pechini method by DTA-TGmeasurements
The ethylenediaminetetraacetic acid (EDTA) (Fig. 2(a)) de-composes endothermically between 500 and 550 K in onestep. The exothermic peak, which began around 780 K, rep-resents the ignition of its derivatives. In the literature it isreported that pure ethylene glycol would present a strongendothermic peak at around 471 K, which represents thebeginning of the boiling process [22, 28].
To determine how metallic cations affect the calcinationprocess, precursor powders without metals were also pre-pared See Fig. 2(a) also for the DTA-TG curves. In allthe DTA-TG curves studied, there are generally two weightlosses. The first weight loss is attributed to the drying pro-cess up to 623 K—i.e. the removal of water. Also in thisfirst step, it cannot be observed any peak attributed to theevaporation of ethylene glycol, which would be in excess.The average weight loss is 10–20%. As no peak at 550 Kbelonging to EDTA was observed, there was no EDTA inthe precursor powder. The next, and most significant, slope,related to a more exothermic reaction, reflects the decompo-sition/combustion of the polyester [29]. Polyester decompo-sition involves a gradual change in the coordination of themetallic cations of the COO– group from the bidentated tothe monodentated complex [30, 31]. At about 700 K, a smallexothermic peak (in DTA) is attributed to self burning. Thisis the decomposition of residual organics, probably carbon-ates, which are formed as intermediate products. As we men-tioned above, the second exothermic broad peak at around750–920 K corresponds to the decomposition/combustion ofthe polyester and reflects a weight loss of 50–60%.
The DTA curves for the KREW precursor powders (seeFig. 2(b)) showed only one peak of between 780–840 Kcorresponding to calcination and ignition. As the crystal-lization process involves no weight loss in TG curve andexothermic peak in DTA curve, we therefore have an over-lapped process in this range temperature. When the molarratio CM dropped to 1, the temperature was around 780 K,which means that there was less organic material than athigher CM . On the other hand, the peak for the calcination of
Springer

J Sol-Gel Sci Techn (2007) 42:79–88 83
300 400 500 600 700 800 900 1000
CM= 3, CE=1 CM= 3, CE=2 CM= 3, CE=3 CM= 1, CE=2
Temperature (K)
-100
-80
-60
-40
-20
0(b)
(a)
endo
exo
DTA
TG
Weight loss(%
)
-100
-80
-60
-40
-20
0
EDTA CE=1 CE=2 CE=3
exo
endo
DTA
TGTe
mpe
ratu
re D
iffer
ence
(K)
Fig. 2 DTA-TG analysis of EDTA and precursor powders (a) withoutmetals, and (b) with metals
precursor powder without metallic cations appeared at highertemperatures (around 850 K) than precursor powders withmetal cations. The presence of metal ions therefore had acatalytic effect on the pyrolysis of organics in the precursorpowder [32]. The fact that the temperature of calcination islower with metals and also decrease with the concentrationof the metals means that the average temperature for pro-
ducing nanocrystals is lower, so a lower cost of the synthesisprocedure.
The overall weight loss was 60–70% of the initial weight.Weight loss increased when the molar ratio CE decreased,which corresponded to an increase in the amount of or-ganic material in the precursor powders. For example, whenCE = 3, the weight loss was around 59% and when CE = 1weight loss increased to 66%.
3.1.2 Control of modified Pechini method by IRspectroscopy
Infrared vibrational spectra of KREW powders and theprecursor KREW powder at different steps of calcinationare shown in Fig. 3. No significant differences were ob-served in any of the IR spectra from any experiment.The IR spectra of the experiment 10 is given as an ex-ample. The characteristic absorption lines of the infraredrays are useful for identifying the functional groups of theorganic compounds. The band at 1640 cm−1, which de-creased during the calcination procedure, is attributed tohydroxyl groups (O–H). The vibrations of the carboxylicgroups (–COO−) were located at around 1726, 1400 and1200 cm−1 and the bands at 1520 and 1400 cm−1 were as-signed to the ionized carboxylates and carbonates [33]. Thesetwo groups of bands disappeared during the calcinationprocess.
KREW formation is illustrated by the appearance of thetypical bands of (WO4)2− in the monoclinic KREW struc-tures [34]. The inset in Fig. 3 shows the infrared vibrationsthat are characteristic of tungstates located at 925, 892, 820,769 and 732 cm−1. These peaks agree with those charac-terized by Macalik et al. [35]. A more detailed discussionof the vibrational structure of the nanocrystals of KREW isprovided below.
4000 3500 3000 2500 2000 1500 1000
973 K 6h
973 K 4h
973 K 3h
973 K 2h
Dry resin
573K
TR
AN
SM
ITT
AN
CE
Wavenumber (cm-1)
900 825 750 675 600
732
769
820
892
925
973 K 6hFig. 3 IR spectra of theprecursors powders at differentcalcinations times and of KYbWnanocrystals
Springer

84 J Sol-Gel Sci Techn (2007) 42:79–88
10 20 30 40 50 60 70
(-53
4)(3
50)(-22
4)
(222
)(-
352)
(-53
2)
(042
)
(-33
3)( -
512)
(330
)
(022
)(-
402)
(-40
2)
(002
)
(-22
2)(2
20)
(-31
1)(-20
2)(2
00)
(111
)
(020
)(-11
1)(1
10)
(a)
KGdW bulk single crystal
1123K
1003K
723K
573K
2θ
2θ10 20 30 40 50 60 70
(b)
(350
)(-
224 )
(222
)(-
352)
(-51
4)(-
5 32)
(-44
2)( 132
)(0
42)
(-33
3)(-
512 )
(330
)
(002
)
(-22
2)
(-40
2)(3
10)
(040
)(1
31)
(-33
2)
(220
)
(11 1
)(-20
2 )(2
00)( 0
20)
(-11
1)(1
10) KYbW bulk
single crystal
923K
973K
1023K
873K
Inte
nsity
(a.
u.)
Inte
nsity
(a.
u.)
Fig. 4 X-ray powderdiffraction of calcinationprocedure of precursor powderfor (a) KGdW (b) KYbW
3.1.3 Control of modified Pechini method by X-Raydiffraction
To study the phase development as the calcination temper-ature and time increase, the precursor powder was calcinedat air atmosphere and at various temperatures up to 1023 K.Crystalline phase analysis was then carried out using XRD.In Fig. 4(a), the X-Ray powder diffraction pattern at 573 Kcorrespond to WO3 and still at this low temperature no othercrystalline phase is formed. At 723 K peaks of KGdW mon-oclinic phase start to appear and the rest of the peaks cor-respond to a mixture of oxide compounds, which can notbe identified. So this calcination temperature is still low toachieve a complete crystallization of monoclinic KGdW. Ac-cording to this approach, the optimum calcination tempera-ture must be between 723 K and 1003 K. Figure 4(b) showsX-Ray powder diffraction patterns of the calcination of theKYbW nanopowders in smaller intervals of temperature thanin Fig. 4(a). At 873 K, the peaks of KYbW monoclinic phasestart to appear and some other peaks also indicate the pres-
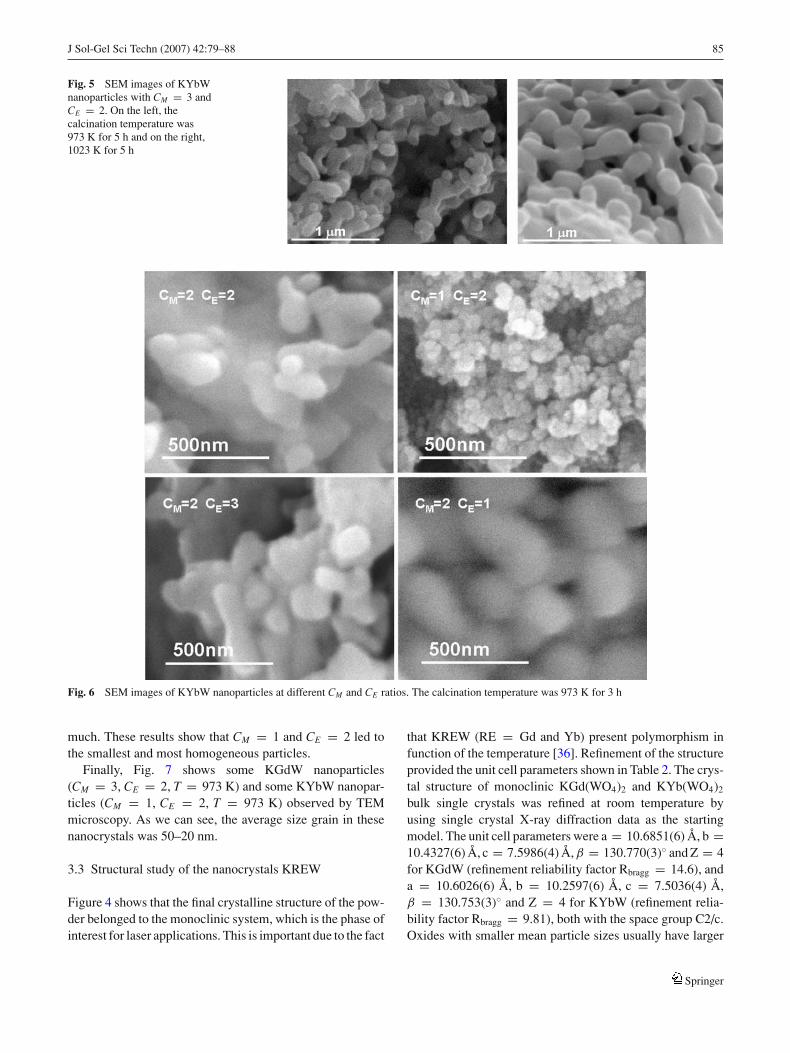
ence of a mixture of oxide compounds not identified. Ataround 923 K, the X-Ray KREW powder diffraction patterncorresponds to the monoclinic phase and the shape of thepeaks indicates a good crystallization. We can see that thecrystallinity of the nanocrystals improves when the calcina-tion temperature increases. On the other hand, an increase incalcination temperature led to an increase in the size of thenanoparticles. Figure 5 shows the SEM photographs of thenanopowders at 973 K and 1023 K. The optimum calcina-tion temperature is therefore 973 K. The particles present anirregular shape, with rather size uniformity and tend towardsaggregation.
3.2 Influence of the ratios CM and CE
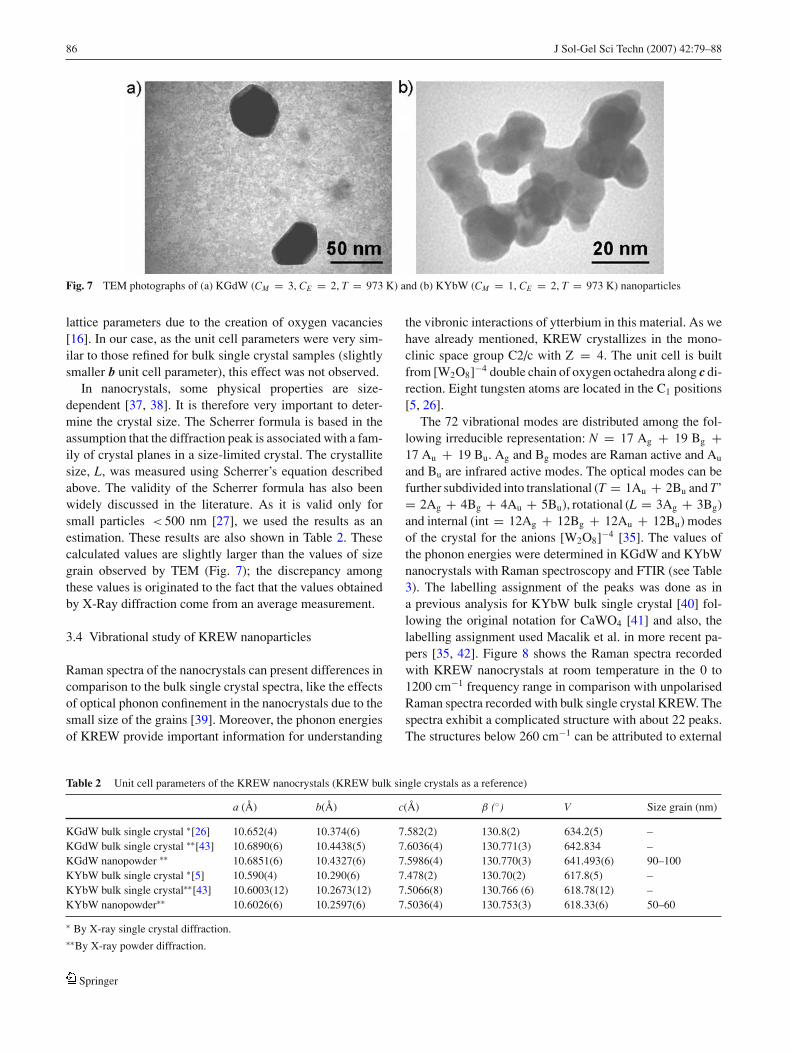
We also analyzed the effects of the different CM and CE ratios.Figure 6 shows the particles at CM = 2, CE = 2; CM = 1,CE = 2; CM = 2, CE = 3 and CM = 2, CE = 1. A lower CM
ratio led to smaller KYbW nanoparticles. However, changingCE did not influence the final size of the KREW particles very
Springer
J Sol-Gel Sci Techn (2007) 42:79–88 85
Fig. 5 SEM images of KYbWnanoparticles with CM = 3 andCE = 2. On the left, thecalcination temperature was973 K for 5 h and on the right,1023 K for 5 h
Fig. 6 SEM images of KYbW nanoparticles at different CM and CE ratios. The calcination temperature was 973 K for 3 h
much. These results show that CM = 1 and CE = 2 led tothe smallest and most homogeneous particles.
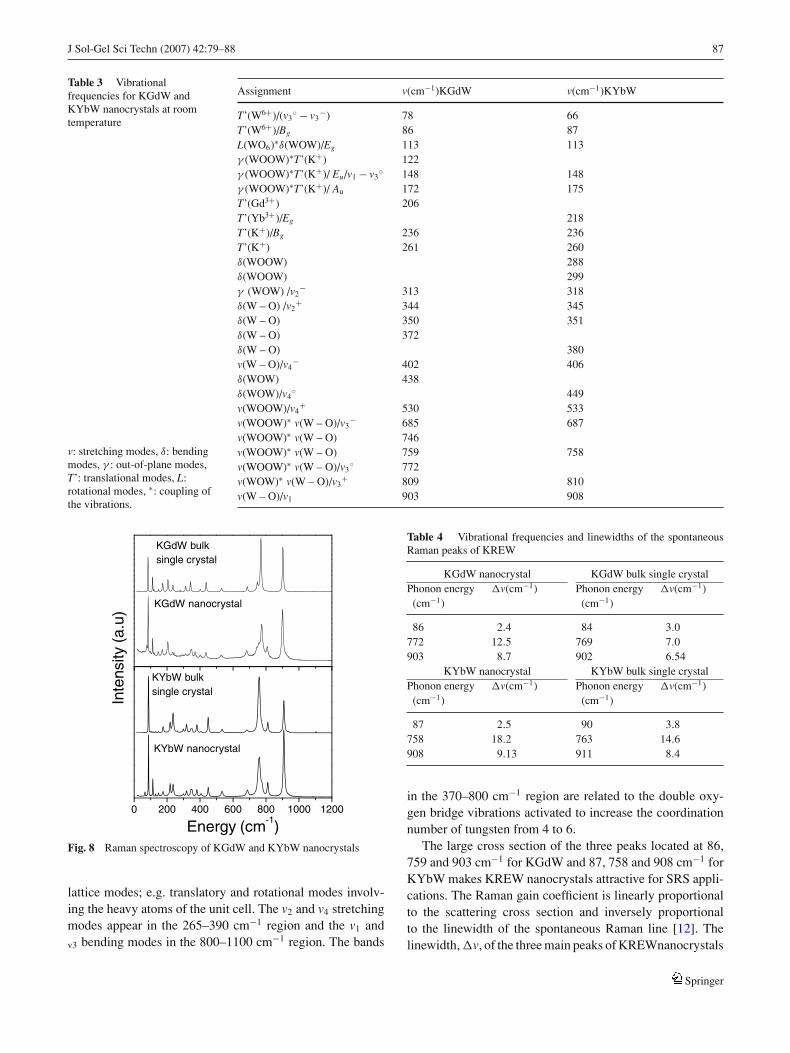
Finally, Fig. 7 shows some KGdW nanoparticles(CM = 3, CE = 2, T = 973 K) and some KYbW nanopar-ticles (CM = 1, CE = 2, T = 973 K) observed by TEMmicroscopy. As we can see, the average size grain in thesenanocrystals was 50–20 nm.
3.3 Structural study of the nanocrystals KREW
Figure 4 shows that the final crystalline structure of the pow-der belonged to the monoclinic system, which is the phase ofinterest for laser applications. This is important due to the fact
that KREW (RE = Gd and Yb) present polymorphism infunction of the temperature [36]. Refinement of the structureprovided the unit cell parameters shown in Table 2. The crys-tal structure of monoclinic KGd(WO4)2 and KYb(WO4)2
bulk single crystals was refined at room temperature byusing single crystal X-ray diffraction data as the startingmodel. The unit cell parameters were a = 10.6851(6) Å, b =10.4327(6) Å, c = 7.5986(4) Å, β = 130.770(3)◦ and Z = 4for KGdW (refinement reliability factor Rbragg = 14.6), anda = 10.6026(6) Å, b = 10.2597(6) Å, c = 7.5036(4) Å,β = 130.753(3)◦ and Z = 4 for KYbW (refinement relia-bility factor Rbragg = 9.81), both with the space group C2/c.Oxides with smaller mean particle sizes usually have larger
Springer
86 J Sol-Gel Sci Techn (2007) 42:79–88
Fig. 7 TEM photographs of (a) KGdW (CM = 3, CE = 2, T = 973 K) and (b) KYbW (CM = 1, CE = 2, T = 973 K) nanoparticles
lattice parameters due to the creation of oxygen vacancies[16]. In our case, as the unit cell parameters were very sim-ilar to those refined for bulk single crystal samples (slightlysmaller b unit cell parameter), this effect was not observed.
In nanocrystals, some physical properties are size-dependent [37, 38]. It is therefore very important to deter-mine the crystal size. The Scherrer formula is based in theassumption that the diffraction peak is associated with a fam-ily of crystal planes in a size-limited crystal. The crystallitesize, L, was measured using Scherrer’s equation describedabove. The validity of the Scherrer formula has also beenwidely discussed in the literature. As it is valid only forsmall particles < 500 nm [27], we used the results as anestimation. These results are also shown in Table 2. Thesecalculated values are slightly larger than the values of sizegrain observed by TEM (Fig. 7); the discrepancy amongthese values is originated to the fact that the values obtainedby X-Ray diffraction come from an average measurement.
3.4 Vibrational study of KREW nanoparticles
Raman spectra of the nanocrystals can present differences incomparison to the bulk single crystal spectra, like the effectsof optical phonon confinement in the nanocrystals due to thesmall size of the grains [39]. Moreover, the phonon energiesof KREW provide important information for understanding
the vibronic interactions of ytterbium in this material. As wehave already mentioned, KREW crystallizes in the mono-clinic space group C2/c with Z = 4. The unit cell is builtfrom [W2O8]−4 double chain of oxygen octahedra along c di-rection. Eight tungsten atoms are located in the C1 positions[5, 26].
The 72 vibrational modes are distributed among the fol-lowing irreducible representation: N = 17 Ag + 19 Bg +17 Au + 19 Bu. Ag and Bg modes are Raman active and Au
and Bu are infrared active modes. The optical modes can befurther subdivided into translational (T = 1Au + 2Bu and T’= 2Ag + 4Bg + 4Au + 5Bu), rotational (L = 3Ag + 3Bg)and internal (int = 12Ag + 12Bg + 12Au + 12Bu) modesof the crystal for the anions [W2O8]−4 [35]. The values ofthe phonon energies were determined in KGdW and KYbWnanocrystals with Raman spectroscopy and FTIR (see Table3). The labelling assignment of the peaks was done as ina previous analysis for KYbW bulk single crystal [40] fol-lowing the original notation for CaWO4 [41] and also, thelabelling assignment used Macalik et al. in more recent pa-pers [35, 42]. Figure 8 shows the Raman spectra recordedwith KREW nanocrystals at room temperature in the 0 to1200 cm−1 frequency range in comparison with unpolarisedRaman spectra recorded with bulk single crystal KREW. Thespectra exhibit a complicated structure with about 22 peaks.The structures below 260 cm−1 can be attributed to external
Table 2 Unit cell parameters of the KREW nanocrystals (KREW bulk single crystals as a reference)
a (Å) b(Å) c(Å) β (◦) V Size grain (nm)
KGdW bulk single crystal ∗[26] 10.652(4) 10.374(6) 7.582(2) 130.8(2) 634.2(5) –KGdW bulk single crystal ∗∗[43] 10.6890(6) 10.4438(5) 7.6036(4) 130.771(3) 642.834 –KGdW nanopowder ∗∗ 10.6851(6) 10.4327(6) 7.5986(4) 130.770(3) 641.493(6) 90–100KYbW bulk single crystal ∗[5] 10.590(4) 10.290(6) 7.478(2) 130.70(2) 617.8(5) –KYbW bulk single crystal∗∗[43] 10.6003(12) 10.2673(12) 7.5066(8) 130.766 (6) 618.78(12) –KYbW nanopowder∗∗ 10.6026(6) 10.2597(6) 7.5036(4) 130.753(3) 618.33(6) 50–60
∗ By X-ray single crystal diffraction.∗∗By X-ray powder diffraction.
Springer
J Sol-Gel Sci Techn (2007) 42:79–88 87
Table 3 Vibrationalfrequencies for KGdW andKYbW nanocrystals at roomtemperature
Assignment v(cm−1)KGdW v(cm−1)KYbW
T’(W6+)/(v3◦ − v3
−) 78 66T’(W6+)/Bg 86 87L(WO6)∗δ(WOW)/Eg 113 113γ (WOOW)∗T’(K+) 122γ (WOOW)∗T’(K+)/ Eu/v1 − v3
◦ 148 148γ (WOOW)∗T’(K+)/ Au 172 175T’(Gd3+) 206T’(Yb3+)/Eg 218T’(K+)/Bg 236 236T’(K+) 261 260δ(WOOW) 288δ(WOOW) 299γ (WOW) /v2
− 313 318δ(W – O) /v2
+ 344 345δ(W – O) 350 351δ(W – O) 372δ(W – O) 380v(W – O)/v4
− 402 406δ(WOW) 438δ(WOW)/v4
◦ 449v(WOOW)/v4
+ 530 533v(WOOW)∗ v(W – O)/v3
− 685 687v(WOOW)∗ v(W – O) 746v(WOOW)∗ v(W – O) 759 758v(WOOW)∗ v(W – O)/v3
◦ 772v(WOW)∗ v(W – O)/v3
+ 809 810v(W – O)/v1 903 908
v: stretching modes, δ: bendingmodes, γ : out-of-plane modes,T’: translational modes, L:rotational modes, ∗: coupling ofthe vibrations.
KGdW nanocrystal
KGdW bulk single crystal
0 200 400 600 800 1000 1200
KYbW bulk single crystal
KYbW nanocrystal
Inte
nsity
(a.u
)
Energy (cm-1)Fig. 8 Raman spectroscopy of KGdW and KYbW nanocrystals
lattice modes; e.g. translatory and rotational modes involv-ing the heavy atoms of the unit cell. The v2 and v4 stretchingmodes appear in the 265–390 cm−1 region and the v1 and
v3 bending modes in the 800–1100 cm−1 region. The bands
Table 4 Vibrational frequencies and linewidths of the spontaneousRaman peaks of KREW
KGdW nanocrystal KGdW bulk single crystalPhonon energy
(cm−1)�v(cm−1) Phonon energy
(cm−1)�v(cm−1)
86 2.4 84 3.0772 12.5 769 7.0903 8.7 902 6.54
KYbW nanocrystal KYbW bulk single crystalPhonon energy
(cm−1)�v(cm−1) Phonon energy
(cm−1)�v(cm−1)
87 2.5 90 3.8758 18.2 763 14.6908 9.13 911 8.4
in the 370–800 cm−1 region are related to the double oxy-gen bridge vibrations activated to increase the coordinationnumber of tungsten from 4 to 6.
The large cross section of the three peaks located at 86,759 and 903 cm−1 for KGdW and 87, 758 and 908 cm−1 forKYbW makes KREW nanocrystals attractive for SRS appli-cations. The Raman gain coefficient is linearly proportionalto the scattering cross section and inversely proportionalto the linewidth of the spontaneous Raman line [12]. Thelinewidth, �v, of the three main peaks of KREWnanocrystals
Springer
88 J Sol-Gel Sci Techn (2007) 42:79–88
are showed in Table 4. Interestingly, in comparison with theRaman spectra of the bulk single crystals, the peaks withhigher phonon energies have bigger linewidths and the peakswith lower phonon energies have smaller linewidths in thenanocrystals. We can see that the peak around 87 cm−1 hasa promisingly low linewidth compared with those reportedin the bibliography for YAG ceramic 5.7 cm−1, sesquioxidesceramics Y2O3 4 cm−1 and Sc2O3 3.7 cm−1 [12].
4 Conclusions
The present paper reports the obtaining of the nanocrystalsof the monoclinic KREW (RE = Gd and Yb) for first timeup to now. Small nanocrystals in the 20–50 nm range weresynthesized using the modified Pechini method. The work-ing temperatures for this process are lower than the temper-ature for crystal growth of bulk single crystals of KREW(RE = Gd and Yb). The optimum range of calcination tem-peratures is 973 K and the optima molar ratios are CM = 1and CE = 2. Also, the use of these ratios in the prepara-tion process implies a reduction of the organic part to beeliminated.
The crystalline structure of the nanocrystals belonged tothe monoclinic phase of these materials. Unit cell parame-ters were refined and were not significantly different fromthe bulk single crystals ones. Also, the vibrational structureof the KREW nanocrystals was very similar to the bulk sin-gle crystals till the studied level and the sharp linewidth ofthe most intense peaks in the spontaneous Raman spectraindicates that these are promising nanocrystals for SRS ap-plications.
Acknowledgments We gratefully acknowledge financial support fromCICyT under Projects MAT 2005-06354-C03-02, MAT2004-20471-E and CiT-020400-2005-14. This paper was also supported by EU-Commission Project DT-CRYS (STRP-NMP3-CT-2003-505580) andthe Catalan Government under the project SGR2005-658. M. C. Pujolis supported by the Education and Science Ministry of Spain underRamon y Cajal programme.
References
1. Kaminskii AA (1996) Crystalline lasers: Physical processes andoperating schemes. CRC Press, New York
2. Krupke WF (2000) IEEE J Sel Top Quant Elec 6:12873. Ustimenko NS, Gulin AV (1998) Instrum Exp Tech 41:3864. Lagatsky AA, Abdolvand A, Kuleshov NV (2000) Opt Lett 25:6165. Pujol MC, Sole R, Massons J, Gavalda Jna, Solans X, Dıaz F,
Aguilo M (2002) J Appl Crystallogr 35:1086. Kaminskii AA, Pavlyuk AA, Butaeva TI, Bobovich LI,
Lyubchenco VV (1979) Neorganicheskie Materialy 15:5417. Majchrowski A, Borowiec MT, Michalski E, Zmija J, Dyakonov
V, Szymczak H, Zayarnyuk T, Baranski M (2001) Cryst ResTechnol 36:283
8. Borowiec MT, Dyakonov V, Fita I, Nabialek A, Pavlyuk A,Szewczyk A, Zaleski M, Zubov E (1999) J Magn Magn Mater195:119
9. Okato T, Atanasov PA, Tomov RI, Obara M (2003) Appl Phys AMater Sci Process 77:775
10. Griebner U, Liu J, Rivier S, Aznar A, Grunwald R, Sole RM,Aguilo M, Dıaz F, Petrov V (2005) IEEE J Quant Elec 41:408
11. Aznar A, Sole RM, Aguilo M, Dıaz F, Griebner U, Grunwald R,Petrov V (2004) Appl Phys Lett 85:4313
12. Kaminskii AA (2003) Phys Status Solidi A 200:21513. Takaichi K, Yagi H, Shirakawa A, Ueda K, Hosokawa S,
Yanagitani T, Kaminskii AA (2005) Phys Status Solidi A 1:R114. Reisfeld R, Jorgensen CK (1992) Optical properties of colorants
or luminescent species in sol-gel glasses, Structure and bonding.Springer-Verlag, Heidelberg
15. Pechini MP (1967) US Patent No.3.330.697 July 116. Vaqueiro PP, Lopez-Quintela MA (1997) Chem Mater 9:283617. Hreniak D, Strek W, Mazur P, Pazik R, Zabkowska-Waclawek
(2004) Opt Mater 26:11718. Pang ML, Lin J, Yu M (2004) J Solid State Chem 177:223719. Stojanovic BD (2003) J Mater Process Technol 143:7820. Roy S, Sigmund WW, Aldinger F (1999) J Mater Res 14:152421. Woon Kwon S, Bin Park S, Seo G, Tai Hwang S (1998) J Nucl
Mater 257:17222. Tai LW, Lessing PA (1992) J Mater Res 7:50223. Laberty-Robert Ch, Ansart F, Deloget C, Gaudon M, Rousset A
(2001) Mater Res Bull 36:208324. Rodriguez-Carvajal J (2000) Reference guide for the computer
program fullprof. Laboratorie Leon Brillouin. CEA-CNRS.Saclay, France
25. Rietveld HM (1969) J Appl Crystallogr 2:6526. Pujol MC, Sole R, Massons J, Gavalda Jna, Solans X, Zaldo C,
Dıaz F, Aguilo M (2001) J Appl Crystallogr 34:127. Cullity BD (1978) Element of x-ray diffraction. Addison-Wesley28. Interranta LV, Jiang Z, Larkin DJ (1998) ACS Symp Ser 77:16829. Quinelato AL, Longo E, Perazolli LA, Varela JA (2000) J Eur
Ceram Soc 20:107730. Cerqueira M, Nasar RS, Longo E, Leite ER, Varela JA (1995)
Mater Lett 22:18131. Fernandez JDG, Melo DMA, Zinner LB, Salustiano CM, Silva
ZR, Martinelli AE, Cerqueira M, Alves Junior C, Longo E,Benardi MIB (2002) Mater Lett 53:122
32. Agarwal V, Liu M (1997) J Mater Sci 32:61933. Nakamoto K (1997) Infrared and Raman Spectra of inorganic and
coordination compounds, 5th edn. Ed. Wiley-Interscience, NewYork
34. Hanuza J, Macalik L (1987) Spectrochim Acta A 43A:36135. Macalik L, Hanuza J, Kaminskii AA (2002) J Raman Spectrosc
33:9236. Klevtsov PV, Kozeeva LP, Kharchenko LP, Yu L, Pavlyuk AA
(1974) Sov Phys-Crystallogr 20:34237. Schoonman J (2000) Solid State Ionics 2135:538. Tissue BM (1998) Chem Mater 10:283739. Pokatilov EP, Klimin SN, Fomin VM, Devreese JT (2002) Phys
Rev B 65:075316-140. Pujol MC, Bursukova MA, Guell F, Mateos X, Sole R, Gavalda
Jna, Aguilo M, Massons J, Dıaz F, Klopp P, Griebner U, Petrov V(2002) Phys Rev B 65:165121
41. Porto SPS, Scott JF (1967) Phys Rev B 157:71642. Macalik L, Deren PJ, Hanuza J, Strek W, Demidovich AA,
Kuzmin AN (1998) J Mol Struct 450:17943. Pujol MC, Mateos X, Sole R, Massons J, Gavalda Jna, Dıaz F,
Aguilo M (2001) Mater Sci Forum 710:378–381
Springer


![web.missouri.eduweb.missouri.edu/~glaserr/vitpub/Activities-Paper_10.1007_s10953... · accompanied by the following text: "The final ... [16], the important Pechini sol–gel method](https://static.fdocuments.in/doc/165x107/5b0406ee7f8b9a89208d028b/web-glaserrvitpubactivities-paper101007s10953accompanied-by-the-following.jpg)