
Prediction of bed pressure drop and top packed bed …ation that has great importance when the gas...
9
1326 † To whom correspondence should be addressed. E-mail: [email protected] Korean J. Chem. Eng., 30(6), 1326-1334 (2013) DOI: 10.1007/s11814-013-0030-y INVITED REVIEW PAPER Prediction of bed pressure drop and top packed bed formation in gas-liquid-solid semi-fluidized bed with irregular homogeneous binary mixtures Deepak Kumar Samal † , Yashobanta Kumar Mohanty, and Gopendra Kishore Roy Department of Chemical Engineering, Gandhi Institute of Engineering and Technology (GIET), Gunupur, Rayagada, Odisha-765022, India (Received 21 November 2012 • accepted 24 February 2013) Abstract -We studied the hydrodynamics of a gas-liquid-solid semi-fluidized bed relating to packed bed formation and bed pressure drop with irregular homogeneous binary mixtures in a 0.05 m internal diameter Perspex column, with water and air (secondary) as fluidizing medium at constant static bed height of 0.08 m. A homogeneous binary mixture has been taken for easy formation of a semi-fluidized bed. Air is supplied centrally below the bottom grid in radial direction with a special design air sparger after the bed is first fluidized by the liquid. Experimental parameters studied included superficial gas and liquid velocities, average particle size and density and the bed expansion ratio. Empirical and semi-empirical models were developed. The calculated values from predicted models were compared with the experi- mental values and fairly good agreement was obtained. Key words: Gas-liquid-solid Semi-fluidization, Irregular Homogeneous Binary Mixtures, Bed Pressure Drop, Top Packed Bed Formation, Dimensional and Statistical Analyses INTRODUCTION Three-phase semi-fluidization is a gas-liquid-solid contacting oper- ation that has great importance when the gas phase has a promi- nent role, especially for fermentation and waste water treatment, where micro-organisms and solid catalysts are involved. A semi- fluidized bed is obtained by increasing the fluid velocity beyond the minimum fluidization condition, and thereafter arresting the move- ment of the solid particles with a restraint fixed at a suitable height towards the top of the conduit. The top packed bed can be formed by increasing fluid velocity alone in the case of two-phase semi- fluidization or by increasing the velocity of one of the fluids or both in case of three-phase semi-fluidization. This results in the forma- tion of a packed bed below the top restraint. The velocity at which the first particle of solid touches the top restraint is called the mini- mum semi-fluidization velocity (U osf ) (as the case). Similarly, when all the solid particles in the column form a packed bed below the top restraint, the corresponding fluid velocity is called the maxi- mum semi-fluidization velocity (U msf ), which is generally obtained by extrapolation of H pa /H s vs G plot to H pa /H s to 1, as in most of the cases total transfer of bed materials to the top may not be feasible due to experimental constraints. The above velocities are defined generally with respect to the continuous phase in case of a three- phase semi-fluidization. Development and advantages of the semi-fluidized bed relating to studies on hydrodynamics and mass transfer started in 1959 [1]. The single size particle hydrodynamic study in solid-liquid system was highlighted by Fan and Wen in 1961 [2]. Investigations relat- ing to various aspects of a semi-fluidized bed involving different systems are available in literature. Considerable work on the hydro- dynamic studies of a semi-fluidized bed has been reported [3-6]. Murthy and Roy presented a review article on semi-fluidization [7]. Most of the above studies relate to a single component, excepting a few relating to binary homogeneous and heterogeneous mixtures [4,5,8,9]. Investigations relating to three-phase semi-fluidization of a single component are limited [10-14], while that for homogeneous binary mixtures is almost absent, though three-phase fluidization with binary mixture particle has been studied [15]. Various appli- cations in different fields have been reported in the literature where semi-fluidization plays an important role [16-20]. Our objective was to study a few aspects of hydrodynamics of gas-liquid-solid semi-fluidization, namely, bed pressure drop and height of top packed bed formation in a semi-fluidized bed using homogeneous binary mixtures of irregular particles of five different materials. Investigations were conducted in a 0.05 m internal diam- eter Perspex column with an initial static bed height of 0.08 m. The effect of the system parameters studied includes superficial liquid velocity (U sfl ), superficial gas velocity (U sfg ), average particle diam- eter (d pav , based on wt %), particle density ( ρ sav ) and bed expansion ratio (R). The bed expansion ratio (R) is defined as the height of top restraint from the bottom grid to the initial static bed height of solid particles, which is also an indication of the top restraint position. The experimental data were correlated with the system parameters by two different approaches: dimensional and statistical analyses. EXPERIMENTAL SETUP AND TECHNIQUE Schematic and pictorial representations of the experimental setup are shown in Fig. 1. The experimental semi-fluidized bed consists of a fluidized bed assembly, a top restraint with fixture, and two U- tube manometers with carbon tetrachloride (for low pressure range) and mercury (for high pressure range) as the manometric fluids. The fluidized bed assembly consists of a fluidizer, a liquid distribu-
Transcript of Prediction of bed pressure drop and top packed bed …ation that has great importance when the gas...
1326
†To whom correspondence should be addressed.
E-mail: [email protected]
Korean J. Chem. Eng., 30(6), 1326-1334 (2013)DOI: 10.1007/s11814-013-0030-y
INVITED REVIEW PAPER
Prediction of bed pressure drop and top packed bed formation in gas-liquid-solidsemi-fluidized bed with irregular homogeneous binary mixtures
Deepak Kumar Samal†, Yashobanta Kumar Mohanty, and Gopendra Kishore Roy
Department of Chemical Engineering, Gandhi Institute of Engineering and Technology (GIET),Gunupur, Rayagada, Odisha-765022, India
(Received 21 November 2012 • accepted 24 February 2013)
Abstract−We studied the hydrodynamics of a gas-liquid-solid semi-fluidized bed relating to packed bed formation
and bed pressure drop with irregular homogeneous binary mixtures in a 0.05 m internal diameter Perspex column, with
water and air (secondary) as fluidizing medium at constant static bed height of 0.08 m. A homogeneous binary mixture
has been taken for easy formation of a semi-fluidized bed. Air is supplied centrally below the bottom grid in radial
direction with a special design air sparger after the bed is first fluidized by the liquid. Experimental parameters studied
included superficial gas and liquid velocities, average particle size and density and the bed expansion ratio. Empirical
and semi-empirical models were developed. The calculated values from predicted models were compared with the experi-
mental values and fairly good agreement was obtained.
Key words: Gas-liquid-solid Semi-fluidization, Irregular Homogeneous Binary Mixtures, Bed Pressure Drop, Top Packed
Bed Formation, Dimensional and Statistical Analyses
INTRODUCTION
Three-phase semi-fluidization is a gas-liquid-solid contacting oper-
ation that has great importance when the gas phase has a promi-
nent role, especially for fermentation and waste water treatment,
where micro-organisms and solid catalysts are involved. A semi-
fluidized bed is obtained by increasing the fluid velocity beyond
the minimum fluidization condition, and thereafter arresting the move-
ment of the solid particles with a restraint fixed at a suitable height
towards the top of the conduit. The top packed bed can be formed
by increasing fluid velocity alone in the case of two-phase semi-
fluidization or by increasing the velocity of one of the fluids or both
in case of three-phase semi-fluidization. This results in the forma-
tion of a packed bed below the top restraint. The velocity at which
the first particle of solid touches the top restraint is called the mini-
mum semi-fluidization velocity (Uosf) (as the case). Similarly, when
all the solid particles in the column form a packed bed below the
top restraint, the corresponding fluid velocity is called the maxi-
mum semi-fluidization velocity (Umsf), which is generally obtained
by extrapolation of Hpa/Hs vs G plot to Hpa/Hs to 1, as in most of
the cases total transfer of bed materials to the top may not be feasible
due to experimental constraints. The above velocities are defined
generally with respect to the continuous phase in case of a three-
phase semi-fluidization.
Development and advantages of the semi-fluidized bed relating
to studies on hydrodynamics and mass transfer started in 1959 [1].
The single size particle hydrodynamic study in solid-liquid system
was highlighted by Fan and Wen in 1961 [2]. Investigations relat-
ing to various aspects of a semi-fluidized bed involving different
systems are available in literature. Considerable work on the hydro-
dynamic studies of a semi-fluidized bed has been reported [3-6].
Murthy and Roy presented a review article on semi-fluidization [7].
Most of the above studies relate to a single component, excepting a
few relating to binary homogeneous and heterogeneous mixtures
[4,5,8,9]. Investigations relating to three-phase semi-fluidization of
a single component are limited [10-14], while that for homogeneous
binary mixtures is almost absent, though three-phase fluidization
with binary mixture particle has been studied [15]. Various appli-
cations in different fields have been reported in the literature where
semi-fluidization plays an important role [16-20].
Our objective was to study a few aspects of hydrodynamics of
gas-liquid-solid semi-fluidization, namely, bed pressure drop and
height of top packed bed formation in a semi-fluidized bed using
homogeneous binary mixtures of irregular particles of five different
materials. Investigations were conducted in a 0.05 m internal diam-
eter Perspex column with an initial static bed height of 0.08 m. The
effect of the system parameters studied includes superficial liquid
velocity (Usfl), superficial gas velocity (Usfg), average particle diam-
eter (dpav, based on wt%), particle density (ρsav) and bed expansion
ratio (R). The bed expansion ratio (R) is defined as the height of top
restraint from the bottom grid to the initial static bed height of solid
particles, which is also an indication of the top restraint position.
The experimental data were correlated with the system parameters
by two different approaches: dimensional and statistical analyses.
EXPERIMENTAL SETUP AND TECHNIQUE
Schematic and pictorial representations of the experimental setup
are shown in Fig. 1. The experimental semi-fluidized bed consists
of a fluidized bed assembly, a top restraint with fixture, and two U-
tube manometers with carbon tetrachloride (for low pressure range)
and mercury (for high pressure range) as the manometric fluids.
The fluidized bed assembly consists of a fluidizer, a liquid distribu-

Prediction of bed pressure drop and top packed bed formation in gas-liquid-solid semi-fluidized bed with irregular …… 1327
Korean J. Chem. Eng.(Vol. 30, No. 6)
tor, a disengagement and recirculation facility, an air compressor, a
pump (2HP), a liquid storage tank (250 lit.) and a set of calibrated
liquid rotameters (max. 600LPH, 1080LPH, 2000LPH).
The fluidizer is a cylindrical Plexiglas column of 0.05 m internal
diameter and 0.62 m height. For achieving uniform flow for the con-
tinuous phase in the column, the bottom conical section is filled
with spherical ceramic pebbles of size 0.005 m diameter to which
the air sparger is centrally fixed. The liquid inlet pipe of 0.0127 m
in internal diameter is located centrally to the conical bottom. The
higher cross-section end of the conical bottom is flanged with the
fluidizer with a 40 mesh (BSS) screen as its bottom grid. The liquid
disengagement section at the top of the column is a rectangular section
of 0.3×0.3×0.2 m dimension, fixed with the column, which allows
holdup of the liquid and the balance is circulated. Air is supplied to
the bottom conical section with the help of an air sparger of diame-
ter 0.005 m as shown in Fig. 1.
The top restraint is made from a Perspex sheet of 0.048 m outer
diameter and 0.038 m inner diameter and is 10mm thick, containing
a number of 0.002 m holes arranged in a square pitch. A 40 mesh
(BSS) screen is attached to it and fixed with perforated iron tube as
shown in Fig. 1. A rubber pipe of diameter 0.004 m is fixed on the
outer circumference of the restraint for smooth movement of the
restraint inside the column and also to not allow solid particles to
go out of the bed along the wall of the column. A photographic view
of the top restraint is presented in Fig. 1.
The scope of the experiment is presented in Table 1. In view of
the fact that a semi-fluidized bed can operate without segregation
only when homogeneous binary mixtures of solids are used with a
particle size ratio less than 1.3 [19], a mixture of particle sizes of
0.001854 m (dp1) and 0.0015405 m (dp2) of different compositions
Fig. 1. Experimental setup.1. Liquid tank 3. Rotameter 5. Semi-fluidized column 7. U-tube manometer 9. Air sparger2. Liquid pump 4. Control valve 6. Semi-fluidized bed 8. Restraint
Table 1. Scope of the experiment
(A) Properties of bed material (B) Binary mixture properties
Particle size
(dp×103, m)Mixture
Composition
(wt%)
Avg. particle size
(dpav×103 m)
dp1 1.8540 Mixture 1 50 : 50 1.6825
dp2 1.5405 Mixture 2 60 : 40 1.7142
Mixture 3 70 : 30 1.7471
Mixture 4 80 : 20 1.7814
Mixture 5 90 : 10 1.8169
(C) Materials
Materials Coal Bauxite Dolomite Chromite Iron ore
ρs, kg/m3 1600 2100 2800 3300 4200
(D) Bed expansion ratio
R 1.5 2.0 2.5 3.0 3.5
1328 D. K. Samal et al.
June, 2013
(wt%) was used in the present investigation. Accurately weighed
amount of material was fed into the column, fluidized and de-fluid-
ized slowly and adjusted for a specific reproducible initial static bed
height of 0.08 m. Liquid was pumped to the fluidizer through a ro-
tameter increasing the flow to the minimum fluidization condition.
Thereafter, air metered through a rotameter was bubbled through
the sparger and the three-phase semi-fluidized bed became opera-
tional. Temperature was maintained at 30±5 oC. To ensure steady
state operation, at least five minutes was allowed before each read-
ing after the onset of semi-fluidization .The readings of the manom-
eters and the top packed bed heights for each liquid as well as gas
flow rate were then noted. The procedure was repeated varying the
superficial liquid and gas velocities, the average particle diameter
and particle density and bed expansion ratio.
In this work, both dimensional and statistical analyses have been
used to predict mathematical models for responses like dimension-
less semi-fluidized bed pressure drop (∆Psf /∆Pmf) and dimension-
less top packed bed height (Hpa/Hs). In dimensional analysis, the
following mathematical model is used for different responses,
∆Psf /Pmf =K'(ρsav/ρl)k1(Dc/dpav)
k2(Usfg/Umf)k3(Usf l/Umf)
k4Rk5 (1)
Hpa/Hs=K''(ρsav/ρl)k6(Dc/dpav)
k7(Usfg/Umf)k8(Usf l/Umf)
k9Rk10 (2)
For statistical analysis, central composite design (CCD) has been
used to develop correlations with five independent dimensionless
variables--ρsav/ρl, Dc/dpav, Usfg/Umf , Usfl/Umf , and R for two depen-
Table 2. Level of independent variables
Variables Symbol −1 0 +1
Density (ρsav/ρl) A 2.1 02.45 2.8
Particle diameter (dpav/Dc) B 28.07 28.60 29.17
Superficial gas velocity (Usfg/Umf) C 00.64 00.80 00.97
Superficial liquid velocity (Usfl/Umf) D 50. 60. 70.
Bed expansion ratio (R) E 20. 2.5 30.
Table 3. Experimantal design matrix and responses (dimensional analysis)
S1
No
Density
(ρsav/ρl)
Particle diameter
(dpav/Dc)
Superficial gas
velocity (Usfg/Umg)
Superficial liquid
velocity (Usfl/Umf)
Restaint
positio (R)
∆Psf/∆Pmf Hpa/Hs
Cal. Expt. Cal. Expt.
01 2.45 0.034942 0.670098 4.160784 2.0 16.932 16 0.681215 0.6375
02 2.45 0.034942 0.670098 4.160784 2.5 11.336 11 0.296140 0.4
03 2.45 0.034942 0.670098 4.160784 3.0 08.167 07.333 0.242833 0.225
04 2.45 0.034942 0.670098 4.160784 3.5 06.190 04.333 0.164057 0.0875
05 2.45 0.034942 0.670098 1.664314 2.5 03.311 02 0.106571 0.1
06 2.45 0.034942 0.670098 2.496471 2.5 05.708 04.333 0.188385 0.225
07 2.45 0.034942 0.670098 3.328627 2.5 08.400 06 0.282219 0.35
08 2.45 0.034942 0.670098 4.160784 2.5 11.336 08 0.386140 0.4375
09 2.45 0.034942 0.670098 4.992941 2.5 14.481 09.333 0.498878 0.55
10 2.45 0.034942 0.670098 5.825098 2.5 17.812 11.333 0.619519 0.625
11 2.45 0.034942 0.670098 6.657255 2.5 21.310 13.333 0.747366 0.775
12 245 0.034942 0.402059 4.160784 2.5 01.684 01.666 0.073033 0.0625
13 2.45 0.034942 0.536078 4.160784 2.5 04.929 03.333 0.186560 0.1375
14 2.45 0.034942 0.670098 4.160784 2.5 11.336 12.333 0.386140 0.525
15 2.45 0.034942 0.804118 4.160784 2.5 22.385 21.666 0.699642 0.725
16 2.45 0.033650 0.670098 4.160784 2.5 13.811 16.666 0.452582 0.7125
17 2.45 0.034284 0.670098 4.160784 2.5 12.524 14.754 0.418347 0.675
18 2.45 0.034942 0.670098 4.160784 2.5 11.336 13.225 0.386140 0.6
19 2.45 0.035628 0.670098 4.160784 2.5 10.237 12.063 0.355765 0.55
20 2.45 0.036338 0.670098 4.160784 2.5 09.231 11.25 0.327379 0.525
21 1.60 0.034942 0.670098 4.160784 2.5 60.337 60 0.923707 0.975
22 2.10 0.034942 0.670098 4.160784 2.5 20.757 22.5 0.529401 0.625
23 2.45 0.034942 0.670098 4.160784 2.5 11.336 12.666 0.386140 0.4375
24 2.80 0.034942 0.670098 4.160784 2.5 06.712 06.25 0.293789 0.3125
25 3.30 0.034942 0.670098 4.160784 2.5 03.522 04 0.209879 0.225
dent dimensionless variables: the bed pressure drop (∆Psf /∆Pmf) and
the top packed bed formation (Hpa/Hs). The response has been used
to develop an empirical model that correlates the response of semi-
fluidized bed with operating variables using a second-degree poly-
nomial equation (Eq. (3)).
(3)
where Y is the predicted response, b'0, the constant coefficient, bi,
the linear coefficients, bij, the interaction coefficients, bii, the quadratic
coefficients and Xi, and Xj are the coded values of the operating
variables. The complete experimental range and levels of indepen-
dent variables are given in Table 2. The design of this experiment
is given in Table 3 (dimensional analysis) and Table 4 (statistical
analysis). The number of tests required for the CCD includes the
standard 2n factorial with its origin at the center, 2n points fixed axially
Y = b'0
+ biXi + biiXi
2 + bijXiXj
j 1>
n
∑i=1
n
∑i=1
n
∑i=1
n
∑
Prediction of bed pressure drop and top packed bed formation in gas-liquid-solid semi-fluidized bed with irregular …… 1329
Korean J. Chem. Eng.(Vol. 30, No. 6)
Table 4. Experimental design matrix and responses for ∆Psf /∆Pmf and Hpa/Hs (statistical analysis)
RunDensity
(ρsav/ρl)
Particle diameter
(dpav/Dc)
Superficial gas
velocity (Usfg/Umf)
Superficial liquid
velocity (Usfl/Umf)
Bed expansion
ratio (R)
Expt.
∆Psf/∆Pmf
Expt.
Hpa/Hs
01 2.1 0.001714 0.010936 3.328627 2 36.336 0.335
02 2.8 0.001714 0.010936 3.328627 2 11.747 0.186
03 2.1 0.001781 0.010936 3.328627 2 29.700 0.285
04 2.8 0.001781 0.010936 3.328627 2 9.602 0.158
05 2.1 0.001714 0.016404 3.328627 2 164.945 1.000
06 2.8 0.001714 0.016404 3.328627 2 53.328 0.697
07 2.1 0.001781 0.016404 3.328627 2 134.823 1.000
08 2.8 0.001781 0.016404 3.328627 2 43.589 0.893
09 2.1 0.001714 0.010936 4.992941 2 62.663 0.592
10 2.8 0.001714 0.010936 4.992941 2 20.259 0.329
11 2.1 0.001781 0.010936 4.992941 2 51.219 0.504
12 2.8 0.001781 0.010936 4.992941 2 16.559 0.279
13 2.1 0.001714 0.016404 4.992941 2 284.451 1.000
14 2.8 0.001714 0.016404 4.992941 2 91.965 1.000
15 2.1 0.001781 0.016404 4.992941 2 232.505 1.000
16 2.8 0.001781 0.016404 4.992941 2 75.170 1.000
17 2.1 0.001714 0.010936 3.328627 3 17.520 0.119
18 2.8 0.001714 0.010936 3.328627 3 5.664 0.066
19 2.1 0.001781 0.010936 3.328627 3 14.321 0.102
20 2.8 0.001781 0.010936 3.328627 3 4.630 0.056
21 2.1 0.001714 0.016404 3.328627 3 79.534 0.448
22 2.8 0.001714 0.016404 3.328627 3 25.713 0.248
23 2.1 0.001781 0.016404 3.328627 3 65.009 0.381
24 2.8 0.001781 0.016404 3.328627 3 21.018 0.211
25 2.1 0.001714 0.010936 4.992941 3 30.215 0.211
26 2.8 0.001714 0.010936 4.992941 3 9.768 0.117
27 2.1 0.001781 0.010936 4.992941 3 24.697 0.179
28 2.8 0.001781 0.010936 4.992941 3 7.984 0.100
29 2.1 0.001714 0.016404 4.992941 3 137.157 0.792
30 2.8 0.001714 0.016404 4.992941 3 44.344 0.439
31 2.1 0.001781 0.016404 4.992941 3 112.110 0.673
32 2.8 0.001781 0.016404 4.992941 3 36.246 0.374
33 1.617555 0.001748 0.013670 4.160784 2.5 189.912 0.845
34 3.282445 0.001748 0.013670 4.160784 2.5 11.809 0.199
35 2.45 0.001668 0.013670 4.160784 2.5 47.581 0.440
36 2.45 0.001828 0.013670 4.160784 2.5 29.446 0.299
37 2.45 0.001748 0.007167 4.160784 2.5 3.346 0.044
38 2.45 0.001748 0.020173 4.160784 2.5 158.986 1.000
39 2.45 0.001748 0.013670 2.181571 2.5 15.630 0.146
40 2.45 0.001748 0.013670 6.139998 2.5 62.802 0.624
41 2.45 0.001748 0.013670 4.160784 1.310793 118.931 1.000
42 2.45 0.001748 0.013670 4.160784 3.689207 18.485 0.134
43 2.45 0.001748 0.013670 4.160784 2.5 37.226 0.361
44 2.45 0.001748 0.013670 4.160784 2.5 37.226 0.361
45 2.45 0.001748 0.013670 4.160784 2.5 37.226 0.361
46 2.45 0.001748 0.013670 4.160784 2.5 37.226 0.361
47 2.45 0.001748 0.013670 4.160784 2.5 37.226 0.361
48 2.45 0.001748 0.013670 4.160784 2.5 37.226 0.361
49 2.45 0.001748 0.013670 4.160784 2.5 37.226 0.361
50 2.45 0.001748 0.013670 4.160784 2.5 37.226 0.361

1330 D. K. Samal et al.
June, 2013
at a distance; say α, from the center to generate the quadratic terms,
and the replicate tests at the center; where n is the number of vari-
ables. The recommended number of tests (nc) at the center is six;
however, for the present study, eight tests have been taken for better
responses.
N=2n+2n+nc (4)
Hence, the total number of tests (N) required for the five indepen-
dent variables as given by Eq. (4) is 50. For statistical analysis, a
statistical software package Design-Expert 6.0.8 Portable, Stat-Ease,
Inc., Minneapolis, USA, has been used for regression analysis of
the semi-fluidized bed responses.
RESULTS AND DISCUSSIONS
Based on the experimental investigation and data processing there-
of, the hydrodynamic parameters for the semi-fluidization bed, i.e.,
the semi-fluidized bed pressure drop and the height of the top packed
bed, have been found to be strong functions of material properties
(average particle density and particle size) and system parameters
(fluid velocities and bed expansion ratio). The detailed result anal-
ysis and the correlations developed are presented below.
1. Semi-fluidized Bed Pressure Drop (∆Psf)
During the investigation we found that the major contribution to
total bed pressure drop in a semi-fluidized bed is due to the top packed
bed. Variation of bed pressure drop with superficial liquid velocity
for different material density with an initial static bed height of 0.08
Fig. 2. Variation of ∆Psf with Usfl for different density material atdpav=0.001717 m, Usfg=0.01367 m/sec and R=2.5.
Fig. 4. Variation of ∆Psf with Usfg at ρsav=2,450 kg/m3, dpav=0.001717m, Usfl=0.08488 m/sec and R=2.5.
Fig. 3. Variation of ∆Psf with Usfl for different particle size at ρsav=2,450 kg/m3, Usfg=0.01367 m/sec and R=2.5.
Prediction of bed pressure drop and top packed bed formation in gas-liquid-solid semi-fluidized bed with irregular …… 1331
Korean J. Chem. Eng.(Vol. 30, No. 6)
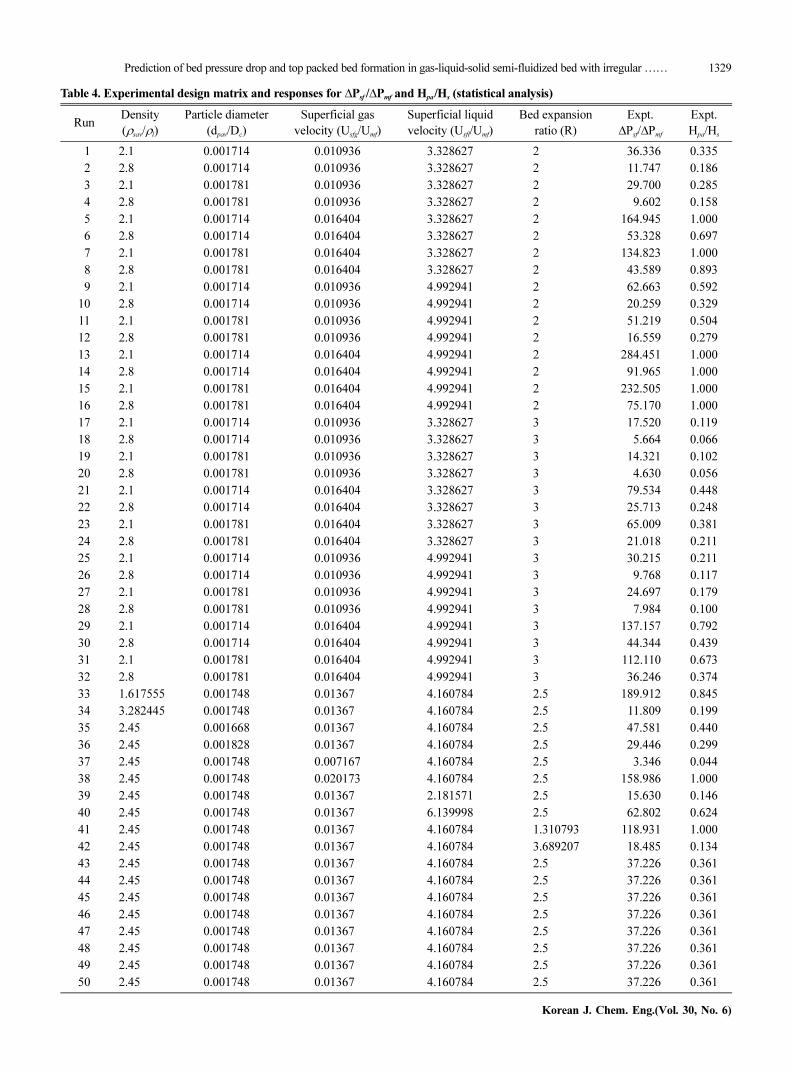
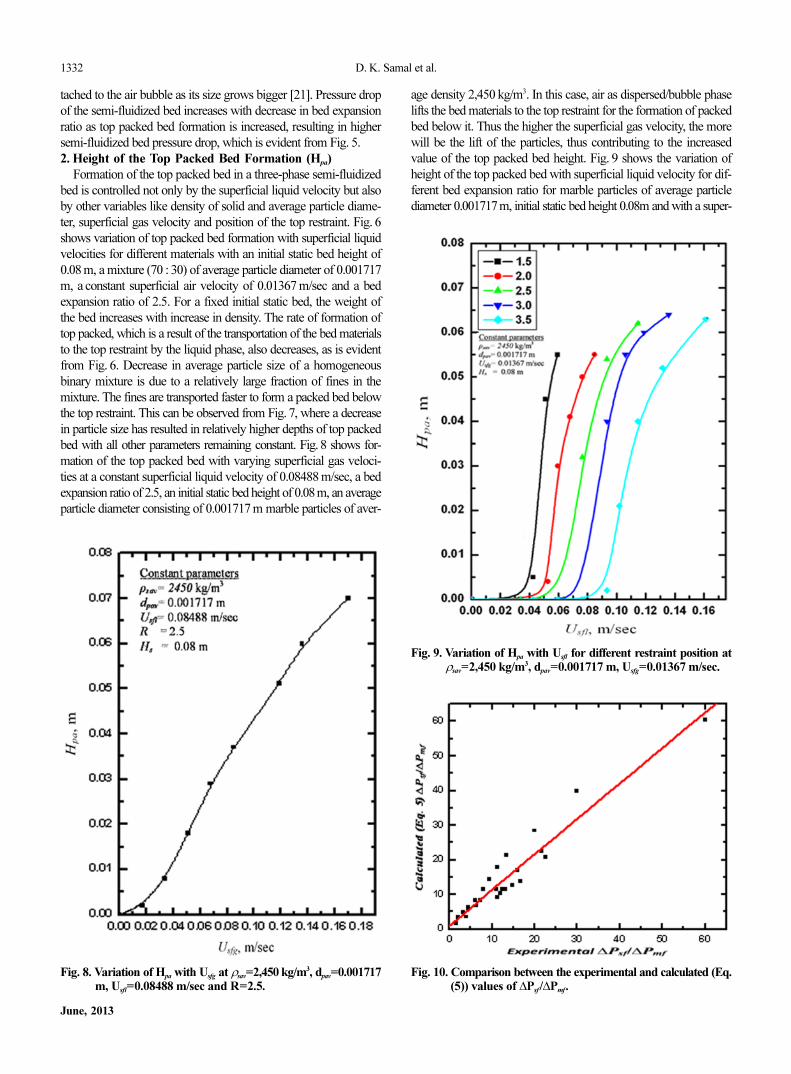
m, a mixture (70 : 30) of average particle diameter of 0.001717 m,
a constant superficial air velocity of 0.01367 m/sec and a bed expan-
sion ratio of 2.5 is shown in Fig. 2. From this, it is clearly observed
that with increase in particle density the pressure drop decreases.
This is because with an increase in particle density the bed weight
increases, resulting in reduced transportation of materials to form a
top packed bed below the top restraint, which is the main contribu-
tor for semi-fluidized bed pressure drop. Similarly, Fig. 3 presents
the variation of semi-fluidized bed pressure drop with respect to
superficial liquid velocities for different particle diameter (average)
with an initial static bed height of 0.08 m marble particles at a con-
stant superficial air velocity of 0.01367 m/sec and a bed expansion
ratio of 2.5. As the average particle diameter increases (with the de-
crease of percentage of fines), the semi-fluidized bed pressure drop
decreases. This is due to the presence of relatively greater number
of large diameter particles in the mixture, resulting in reduced solid
transportation and top packed bed formation. Pressure drop of the
semi-fluidized bed increases with increase in gas velocity (Fig. 4),
which is obviously due to increased material transport to the top.
At low superficial gas velocity the bed pressure drop decreases, and
as the superficial gas velocity increases the pressure drop increases.
This is because as the superficial air velocity increases, the gas hold-
up in the bed increases, which in turn decreases the bed weight com-
pared to minimum fluidization condition. The decreased weight
increases the buoyancy force, thus decreasing the form drag and
hence the bed pressure drop. But after a particular superficial gas
velocity the bed pressure drop increases as the downward thrust
imparted by the air bubble, which is because more particles are at-
Fig. 5. Variation of ∆Psf with Usfl for different restraint position atρsav=2,450 kg/m3, dpav=0.001717 m, Usfg=0.01367 m/sec.
Fig. 7. Variation of Hpa with Usfl for different particle size at ρsav=2,450 kg/m3, Usfg=0.01367 m/sec and R=2.5.
Fig. 6. Variation of Hpa with Usfl for different density material atdpav=0.001717 m, Usfg=0.01367 m/sec and R=2.5.
1332 D. K. Samal et al.
June, 2013
tached to the air bubble as its size grows bigger [21]. Pressure drop
of the semi-fluidized bed increases with decrease in bed expansion
ratio as top packed bed formation is increased, resulting in higher
semi-fluidized bed pressure drop, which is evident from Fig. 5.
2. Height of the Top Packed Bed Formation (Hpa)
Formation of the top packed bed in a three-phase semi-fluidized
bed is controlled not only by the superficial liquid velocity but also
by other variables like density of solid and average particle diame-
ter, superficial gas velocity and position of the top restraint. Fig. 6
shows variation of top packed bed formation with superficial liquid
velocities for different materials with an initial static bed height of
0.08 m, a mixture (70 : 30) of average particle diameter of 0.001717
m, a constant superficial air velocity of 0.01367 m/sec and a bed
expansion ratio of 2.5. For a fixed initial static bed, the weight of
the bed increases with increase in density. The rate of formation of
top packed, which is a result of the transportation of the bed materials
to the top restraint by the liquid phase, also decreases, as is evident
from Fig. 6. Decrease in average particle size of a homogeneous
binary mixture is due to a relatively large fraction of fines in the
mixture. The fines are transported faster to form a packed bed below
the top restraint. This can be observed from Fig. 7, where a decrease
in particle size has resulted in relatively higher depths of top packed
bed with all other parameters remaining constant. Fig. 8 shows for-
mation of the top packed bed with varying superficial gas veloci-
ties at a constant superficial liquid velocity of 0.08488 m/sec, a bed
expansion ratio of 2.5, an initial static bed height of 0.08 m, an average
particle diameter consisting of 0.001717 m marble particles of aver-
Fig. 8. Variation of Hpa with Usfg at ρsav=2,450 kg/m3, dpav=0.001717m, Usfl=0.08488 m/sec and R=2.5.
Fig. 10. Comparison between the experimental and calculated (Eq.(5)) values of ∆Psf/∆Pmf.
Fig. 9. Variation of Hpa with Usfl for different restraint position atρsav=2,450 kg/m3, dpav=0.001717 m, Usfg=0.01367 m/sec.
age density 2,450 kg/m3. In this case, air as dispersed/bubble phase
lifts the bed materials to the top restraint for the formation of packed
bed below it. Thus the higher the superficial gas velocity, the more
will be the lift of the particles, thus contributing to the increased
value of the top packed bed height. Fig. 9 shows the variation of
height of the top packed bed with superficial liquid velocity for dif-
ferent bed expansion ratio for marble particles of average particle
diameter 0.001717m, initial static bed height 0.08m and with a super-
Prediction of bed pressure drop and top packed bed formation in gas-liquid-solid semi-fluidized bed with irregular …… 1333
Korean J. Chem. Eng.(Vol. 30, No. 6)
ficial gas velocity of 0.01367 m/sec. For a particular superficial liquid
velocity, the closer is the position of the top restraint with respect to
the initial static bed (i.e., lesser value of R), the particles are to be
lifted through a shorter distance resulting in the formation of a size-
able top packed bed.
3. Development of Correlations by the Dimensional Analysis
In case of three-phase semi-fluidization, bed pressure drop and
top packed bed height are found to be dependent on five operating
parameters. Values of the parameters and responses for the devel-
oping correlations are given in Table 3 and the developed correla-
tions are represented as Eqs. (5) and (6).
For dimensionless semi-fluidization pressure drop, the equation is
∆Psf /∆Pmf =3×10⁻⁵(ρsav/ρl)−3.924(dpav/Dc)
−5.243
∆Psf /∆Pmf =(Usfg/Umf)3.732(Usfl/Umf)
1.343R−1.798 (5)
For dimensionless top packed bed height, the equation is
Hpa/Hs=9×10−6(ρsav/ρl)−2.047(dpav/Dc)
−4.214(Usfg/Umf)3.260(Usfl/Umf)
1.405R−2.544 (6)
Fig. 10 shows the comparison between the experimental and cal-
culated values of ∆Psf /∆Pmf . The coefficient of correlation is found
to be 0.961. Fig. 11 shows the comparison between experimental
and calculated values of Hpa/Hs with a coefficient of correlation of
0.921.
4. Development of Correlations by the Statistical Analysis
The method of experimentation is based on statistical design of
experiments (factorial design analysis) in order to bring out inter-
action effects of the variables, which would not otherwise be found
by conventional experimentation, and to explicitly find the effect
of each of the variables quantitatively on the response. In addition,
the number of experiments required is far less when compared with
the conventional method of data analysis and development of corre-
lations.
The equations developed by the statistical analysis approach are:
For dimensionless semi-fluidized bed pressure drop:
∆Psf /∆Pmf =37.06−32.86×A−5.53×B+37.38×C+14.59×D−21.28
∆Psf /∆Pmf =×E+11.10×A2+0.075×B2+7.61×C2−0.20×D2+5.41
∆Psf /∆Pmf =×E2+3.14×A×B−19.96×A×C−8.31×A×D+10.91
∆Psf /∆Pmf =×A×E−3.92×B×C−1.63×B×D+2.14×B×E+10.38
∆Psf /∆Pmf =×C×D−13.64×C×E−5.68×D×E (7)
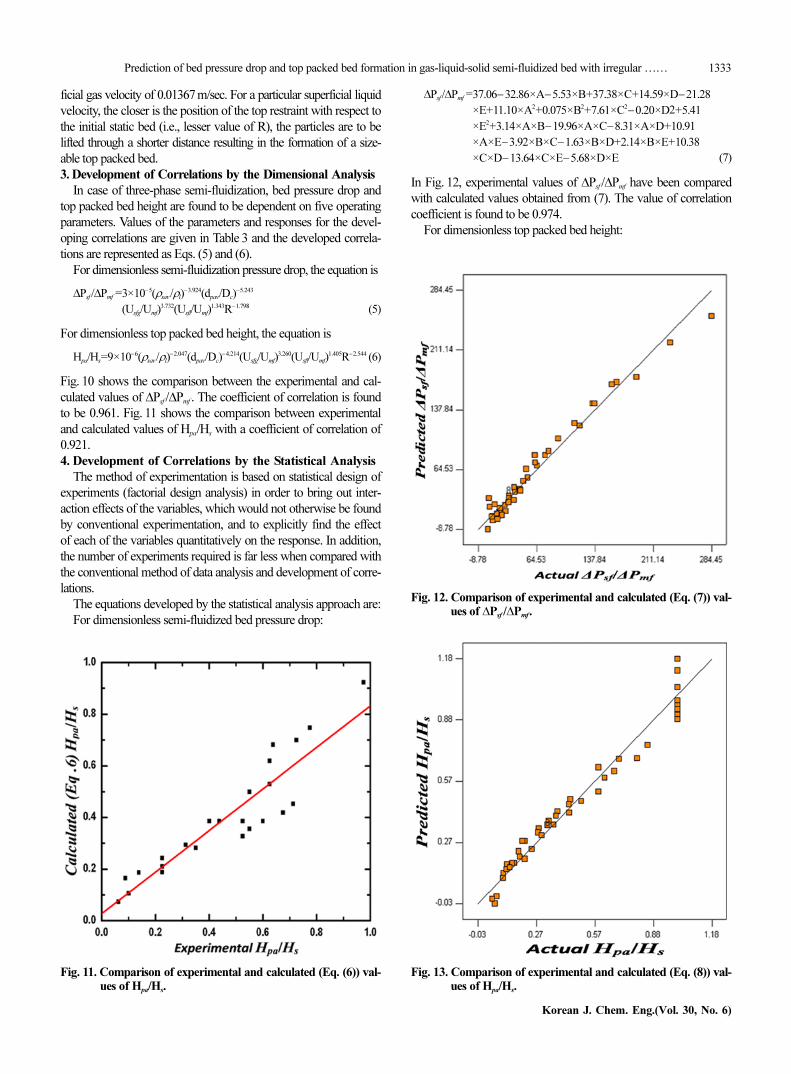
In Fig. 12, experimental values of ∆Psf /∆Pmf have been compared
with calculated values obtained from (7). The value of correlation
coefficient is found to be 0.974.
For dimensionless top packed bed height:
Fig. 12. Comparison of experimental and calculated (Eq. (7)) val-ues of ∆Psf /∆Pmf.
Fig. 11. Comparison of experimental and calculated (Eq. (6)) val-ues of Hpa/Hs.
Fig. 13. Comparison of experimental and calculated (Eq. (8)) val-ues of Hpa/Hs.
1334 D. K. Samal et al.
June, 2013
Hpa/Hs=0.36−0.099×A−0.24×B+0.22×C+0.089×D−0.17×E+0.027
Hpa/Hs=×A2+5.498×10−4×B2+0.027×C2+3.263×10−3×D2+0.035
Hpa/Hs=×E2−1.936×10−3×A×B−0.022×A×C+4.369×10−3
Hpa/Hs=×A×D+5.652×10−3×A×E−3.126×10−3×B×C−1.775×10−3
Hpa/Hs=×B×D−1.413×10−3×B×E+0.022×C×D−0.063
Hpa/Hs=×C×E−6.613×10−3×D×E (8)
In Fig. 13, experimental values of Hpa/Hs have been compared with
calculated values obtained from Eq. (8). The value of correlation
coefficient is 0.966.
CONCLUSIONS
We studied the behavior of homogeneous binary mixtures with
superficial fluid velocities in a gas-liquid-solid semi-fluidized bed
with particles of different size and densities. Correlations for calcu-
lation of bed pressure drop and height top packed bed have been
proposed. The values calculated from the developed correlations
were compared with the experimental ones and the coefficients of
correlations were found to be greater than 0.92 in each case, thus
emphasizing the validity of the developed correlations over the range
of the operating parameters investigated.
The present hydrodynamics study along with the correlations
developed can find potential applications in unit operations and pro-
cesses involving homogeneous binary mixtures of varying sizes
for different materials over the present range of investigation for the
design of three-phase semi-fluidized bed in which the gas phase
plays an important role.
NOMENCLATURE
d : diameter [m]
G : mass velocity [kg/m2·sec]
H : height [m]
K, ki : constant, (i=1, 2…10)
P : pressure [N/m2]
R : bed expansion ratio
U : velocity [m/sec]
Greek Letters
ρ : density [kg/m3]
∆ : difference
Subscripts
av : average
g : gas phase
l : liquid phase
mf : minimum fluidization
msf : maximum semi-fluidization
osf : onset semi-fluidization
p : particle
pa : top packed bed
s : solid/static
sf : semi-fluidization
REFERENCES
1. L. T. Fan, Y. C. Yang and C. Y. Wen, AIChE J., 5, 407 (1959).
2. L. T. Fan and C. Y. Wen, AIChE J., 7, 606 (1961).
3. G. K. Roy and K. J. R. Sarma, J. I. Inst. Engrs., (India), 54 (1974).
4. G. K. Roy and H. N. Saratchandra, Chem. Eng. J., 12, 77 (1976).
5. J. Dash and G. K. Roy, Indian Chem. J., 1 (1977).
6. T. C. Ho, S. J. Yau and J. R. Hopper, Department of Chemical Engi-
neering, Lamar University, 25 (1987).
7. J. S. N. Murthy and G. K. Roy, Indian Chem. Eng., 29(2), 1 (1986).
8. J. Mydlarz, Chem. Eng. J., 34, 155 (1987).
9. K. C. Biswal, S. N. Sahoo, P. Verma, J. S. N. Murthy and G. K. Roy,
Chem. Eng. J., 70, UDC 66.096.5:531.3 (1990).
10. S. H. Chern, K. Muroyama and L. S. Fan, Chem. Eng. Sci., 38, 1167
(1983).
11. S.-H. Chern, L.-S. Fan and K. Muroyama, AIChE J., 30, 288 (1984).
12. H. M. Jena, G. K. Roy and B. C. Meikap, Indian Chem. Eng.
Congress (2006).
13. R. K. Singh, A. K. Maharathy and A. K. Mahapatra, Chem. Eng.
World, 40(9), 86 (2005).
14. M. Schubert and F. Larachi, Ind. Eng. Chem. Res., 48(18), 8393
(2009).
15. L.-S. Fan, A. Matsuura and S.-H. Chern, AIChE J., 31, 1801 (1985).
16. S. M. M. Dias, Extractive fermentation of ethanol by immobilized
yeast cells, NTIS. Report, Dept. Eng., Tech. Univ. Lisbon, Lisbon,
218 (1991).
17. S. Dehkissia, A. Baçaoui, I. Iliuta and F. Larachi, AIChE J., 54, 2120
(2008).
18. S. J. Kim, K. R. Hwang, S. Y. Cho and H. Moon, Korean J. Chem.
Eng., 16, 664 (1999).
19. S. J. Kim, K. R. Hwang and S. Y. Cho, J. Chem. Eng. Japan, 34,
193 (2001).
20. R. L. Is’emin, N. A. Zaitseva, A. D. Osipov and A. P. Akol’zin,
Promyshlennaya Energetika, 2, 37 (1995).
21. D. T. K. Dora, Y. K. Mohanty and G. K. Roy, Chem. Eng. Sci., 79,
210 (2012).

![The Sun. (New York, N.Y.) 1908-04-26 [p ].€¦ · UPrince falOr Irlloll studying movement promi-nent arlw1 meantime Mhavealr ninetyfive credentials rom biittonn-ooon happiest hepttidle](https://static.fdocuments.in/doc/165x107/5f92e17f10f6f13a9467bc9f/the-sun-new-york-ny-1908-04-26-p-uprince-falor-irlloll-studying-movement.jpg)