Predicting disease dynamics in African lion … · Predicting disease dynamics in African lion...
139
Predicting disease dynamics in African lion populations A DISSERTATION SUBMITTED TO THE FACULTY OF THE GRADUATE SCHOOL OF THE UNIVERSITY OF MINNESOTA BY Meggan E. Craft IN PARTIAL FULFILLMENT OF THE REQUIREMENTS FOR THE DEGREE OF DOCTOR OF PHILOSOPHY Craig Packer December 2008
Transcript of Predicting disease dynamics in African lion … · Predicting disease dynamics in African lion...
Predicting disease dynamics in African lion populations
A DISSERTATION SUBMITTED TO THE FACULTY OF THE GRADUATE SCHOOL
OF THE UNIVERSITY OF MINNESOTA BY
Meggan E. Craft
IN PARTIAL FULFILLMENT OF THE REQUIREMENTS FOR THE DEGREE OF
DOCTOR OF PHILOSOPHY
Craig Packer
December 2008

© Meggan E. Craft, 2008
i
Acknowledgements
This thesis was a huge team effort. From the myriad funding sources to the
logistical, academic and emotional support on two continents, it is difficult to know
where to start with the acknowledgements. I’ve got numerous friends, family,
colleagues, mentors, and institutions to thank for the assistance and guidance in
completing this dissertation.
A field-based PhD is an expensive undertaking. This research was supported by
NSF grants (DEB-0225453, DEB-0343960, DEB-0749097, BE-0308486, EF-0225453,
DEB-0710070) with additional funding from Lincoln Park Zoo, Sigma Xi (Grants-In-
Aid of Research), Grumeti Community and Wildlife Conservation Fund, the University
of Minnesota’s Graduate School (including Anderson, Smith, and Doctoral Dissertation
Fellowships), and Department of Ecology, Evolution and Behavior (including Dayton,
McKinney, Pletcher, Rothman, and Wilkie Fellowships). Thanks also to the Santa Fe
Institute for providing a working visit for M. Craft and L.A. Meyers.
For permission to conduct research in the Serengeti Ecosystem, I thank Tanzania
Wildlife Research Institute (TAWIRI), Tanzania National Parks (TANAPA),
Ngorongoro Crater Area Authority (NCAA), and the Division of Wildlife. I am
indebted to both Grumeti Reserves (specifically Ed and Claire) and Frankfurt
Zoological Society for providing logistical support and. Markus Borner in particular
provided generous use of the facilities for me for over 10 years, and endless hours of
radio-tracking hyenas by plane; Simon Thirgood showed me how catch jackals without
catching myself; and Chris Shelton graciously let me use her exercise machine to keep
sane. Also, I am grateful to Richard Hoare and Sian Brown for their many hours of
assistance trying to catch clever hyenas, jackals, and leopards--only to find out that
these predators are much smarter than lions. To my friends on the Lion Project, Peyton
West, Grant Hopcraft, Karyl Whitman, Bernard Kissui, Dennis Ikanda, Iain Taylor,
Anna Mosser, Henry Brink, Kirsten Skinner, Ingela Janssen, and Patrik Jigsveld, I’m
fortunate to have spent some of my most cherished memories in your company. I also
thank Sarah Durant, Anne Hilborn, Sultana Bashir, Tom Maddox, Harriet Auty,
Stephanie Eby, Tony Sinclair, Simon Mduma, Greg Sharam, Kris Metzger, Denne
ii
Reed, Karen Laurenson, Dan Haydon, Ray Hilborn, and John Fryxell for keeping me
well-fed and providing invaluable advice (scientific and other) from various porches or
kopjes around sunset. I thank India Howell and Robyn Stewart for a lifelong friendship
and accommodation when I was out of the Serengeti.
I thank Andy Dobson, Katie Hampson, Tiziana Lembo, Christine Mentzel,
Ernest Eblate, Dominic Travis, and especially Sarah Cleaveland, for teaching me about
diseases and helping me expand my realm of knowledge from ‘lionologist’ into ‘disease
ecologist.’ I thank the field crew of ‘Team Rabid’ and Andrew Ferdinands for showing
me around the villages, providing non-stop laughter, and showing me the human and
domestic animal side of carnivore diseases. I must acknowledge my admiration and
respect for our late friend, Magai Kaare, whose untimely death leaves the rabies
community with a huge void.
Back in the ‘predictable land’ of computers and offices, I am so grateful to have
teamed up with some amazing scientists. Peter Hawthorne and Erik Volz were crucial in
programming both CDV models with finesse—and even without complaint. Dan
Haydon created a multi-host disease model with a wonderful user interface, which,
although did not get included in this thesis, sparked a successful NSF-IRFP fellowship.
Thanks to Melissa Anderson, Bernard Kissui, Anna Mosser, Alessandra Sorensina, and
Chris Souther for raw data or help with data extraction. Thanks to Jennifer Troyer for
input on FIV, Ottar Bjornstad for assistance with the ncf-package, and Tony Starfield
for initial guidance.
Lauren Ancel Meyers deserves special recognition for being an exceptional
(informal) advisor, and also an incredible role model for me. Thanks to the members of
my committee over the years: Steve Polasky, Tony Starfield, Claudia Neuhauser, Jeff
Bender, Clarence Lehman, and Susan Jones. I am ever-so-thankful to Craig Packer for
taking a leap of faith when hiring me in 1998 as a field assistant. Craig handed me $50
at Barbie Allen’s house in Nairobi and wrote out my job instructions on a piece of
paper: (1) go to Dar; (2) get permits; (3) go to Serengeti. This note was the precedent
showing Craig’s advising style. Craig gave me the freedom and independence to thrive

iii
and pursue my own interests, yet he provided the basic structure and expected nothing
but scientific excellence.
I cannot thank Russ and Gena Lemker and Susan James and Carrie Wunsch
enough for opening up their homes to me for extended periods of time. The flexibility in
my housing situation allowed me to travel back and forth from Africa. Thanks also to
Susan Jones and Kevin Reitz for providing emotional (and financial) support while
watching Phil grow up. I also thank my friends in Minnesota, Emily Wroblewski, Dan
McNulty, the Behavior Group, Mark Bee, Colleen McLinn, Holly MacCormick, Brian
Barber, Dennis Rentsch, Jennifer Schmitt, and Hadas Kushnir for providing excellent
support through the sometimes trying times. I am ecstatic that my friends Allison and
Pete Yoder and my family, Ryan, Cortney, and my mom, visited me in Africa, and saw
why I love the Serengeti ecosystem; it means the world to me that these folks that can
connect these disparate worlds of mine. Thanks to my brother, Ryan, for helping
format this thesis; he has so much untapped potential as a Lion Project fix-it man...
And, most of all, thanks to my parents, Jim and Sharon Craft, for their love and support
over the years.

iv
Dedication
This dissertation is dedicated to my mother, Sharon Craft, who is ‘my number
one fan’. She has relentlessly pursued the best educational opportunities for me.
Without her personal sacrifices for my education during my youth, I am convinced I
would not be where I am today.
v
Abstract
In 1994, one-third of Serengeti lions died from canine distemper virus (CDV). I
estimated the epidemiological network structure of the Serengeti lion population using
long-term data. I found that the lion population is a mix of local pride-to-pride contacts
(driven by territory adjacencies) and transient nomad-to-pride contacts (driven by
gamma variance process). When canine distemper virus (CDV) was introduced into the
network, I found that although nomads are numerous, travel long distances, and are
likely candidates to be considered “superconnectors” (connecting distant parts of a
network), their impacts on CDV disease dynamics were surprisingly low.
Analysis of the data-driven, Levins-type network model demonstrates that the
epidemic probably was not propagated solely by within-species transmission but rather
involved multiple introductions from other carnivore species, such as jackals and
hyenas. The social network model further suggests that the epidemiological
observations from the 2000 km2 Serengeti study area may not have reflected the larger-
scale dynamics because the sample was (1) located at the periphery of the pride-pride
contact network and (2) confined to a small region relative to the scale of the
ecosystem.
If lions could not produce the observed CDV outbreak, and other wild
carnivores were repeatedly involved in transmission to the lion population, could a
multi-host spatial model account for the patchy pattern of CDV spread seen in lions in
1994? A stochastic susceptible-infected-recovered model was constructed which
allowed transmission between a highly territorial species, like lions, and 1-2 more
gregarious hosts, such as hyenas and jackals. When other gregarious species were
coupled with lions with low interspecific contact rates, the erratic patterns of CDV
spatial spread were similar to those seen in lions in 1994.
The results of both the network and the multi-host models suggest that lions are
a non-maintenance population for canine distemper virus, and more broadly address
issues of spatial disease ecology and multi-host pathogens in complex ecosystems.
vi
Table of Contents
CHAPTER 1: Ecology of Infectious Diseases in Serengeti Lions .............................. 1
Chapter Introduction..................................................................................................... 1
Study system................................................................................................................. 2
Endemic and epidemic diseases: viruses and parasites ................................................ 4
A low impact pathogen or an insidious threat: bovine tuberculosis............................. 8
One-host, one-pathogen: feline immunodeficiency virus ............................................ 8
Co-infections are not always harmful: trypanosomes ................................................ 11
Case study: canine distemper virus ............................................................................ 12
Co-infection increases virulence in a multi-host pathogen .................................... 12
Integrating biology and epidemiology into models................................................ 15
Lion network and contact structure .................................................................... 15
Epidemiological model....................................................................................... 16
Nomads—are they superspreaders? ................................................................... 17
Did lions maintain the 1994 CDV outbreak themselves? .................................. 18
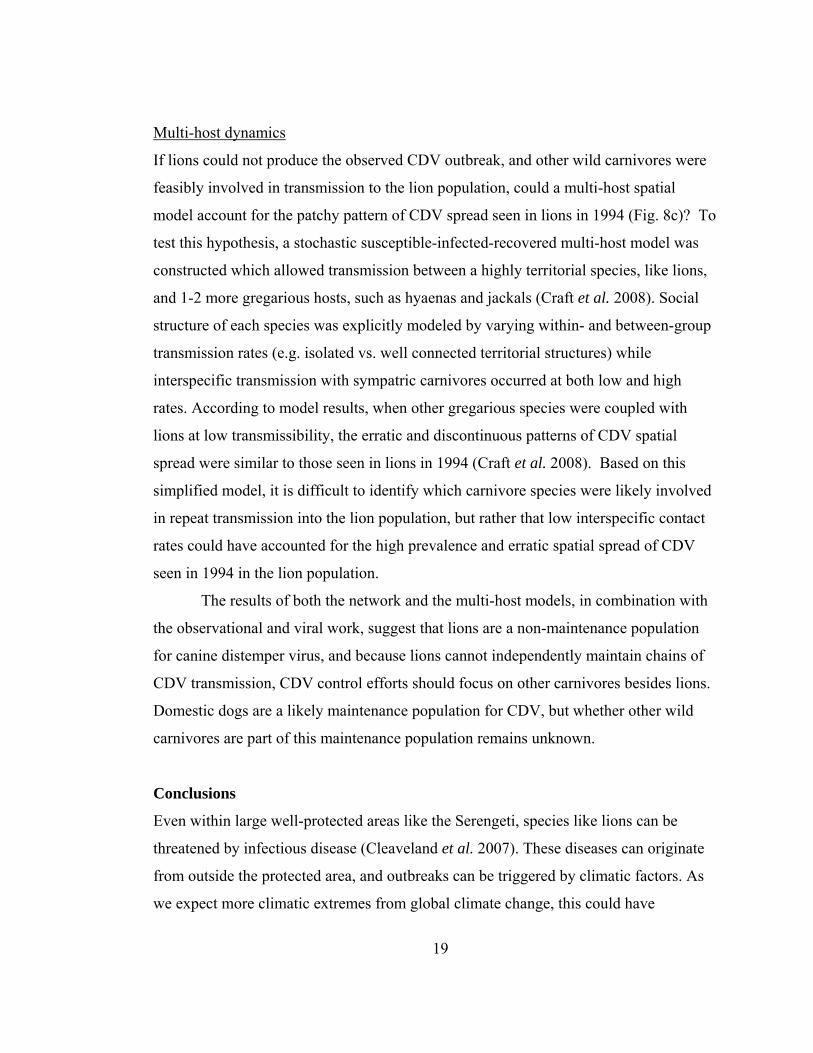
Multi-host dynamics ........................................................................................... 19
Conclusions ................................................................................................................ 19
CHAPTER 2: Networks and Nomads: epidemiological structure and disease
dyanamics of a lion population ............................................................................... 40
Abstract....................................................................................................................... 40
Introduction ................................................................................................................ 41
Materials & methods .................................................................................................. 42
Estimating Lion Population Structure .................................................................... 42
Demographics and spatial distribution of prides ................................................ 43
Pride-to-pride contacts........................................................................................ 44
Territorial males ................................................................................................. 46
Nomadic lions..................................................................................................... 47
Simulating disease spread....................................................................................... 48
vii
Results ........................................................................................................................ 49
Discussion................................................................................................................... 51
CHAPTER 3: Distinguishing epidemic waves from disease spillover in a wildlife
population ................................................................................................................. 63
Summary..................................................................................................................... 63
Introduction ................................................................................................................ 64
Results ........................................................................................................................ 66
Edge effects ............................................................................................................ 67
Small sample size ................................................................................................... 68
Spatial scale ............................................................................................................ 68
Model versus data: Did lions sustain the 1994 outbreak themselves? ................... 69
Discussion................................................................................................................... 70
Are Serengeti lions a percolating population for CDV? ........................................ 70
Do disease dynamics scale?.................................................................................... 71
Materials & methods .................................................................................................. 73
Modeling Lion Population Structure ...................................................................... 73
Epidemiological Model .......................................................................................... 75
Statistical Methods ................................................................................................. 76
Supporting information .............................................................................................. 88
CHAPTER 4: Dynamics of a multihost pathogen in a carnivore community ........ 90
Summary..................................................................................................................... 90
Introduction ................................................................................................................ 91
Questions .................................................................................................................... 92
Modeling Approach.................................................................................................... 93
Results ........................................................................................................................ 96
Single-species models. ........................................................................................... 96
Multi-species models.............................................................................................. 97
Do within- and between-group contact patterns influence the impact of a
pathogen?................................................................................................................ 97
viii
Do within- and between-group contact patterns influence the rate of spread of the
pathogen through the system or the probability of an epidemic?........................... 98
Do within- and between-group contact patterns change the spatial spread of a
pathogen?................................................................................................................ 98
Comparison with observed outbreak ...................................................................... 99
Discussion................................................................................................................. 100
REFERENCES ........................................................................................................... 111
ix
List of Tables
Chapter 1
Table 1. Prevalence of trypanosome infection in lions ..................................... 22
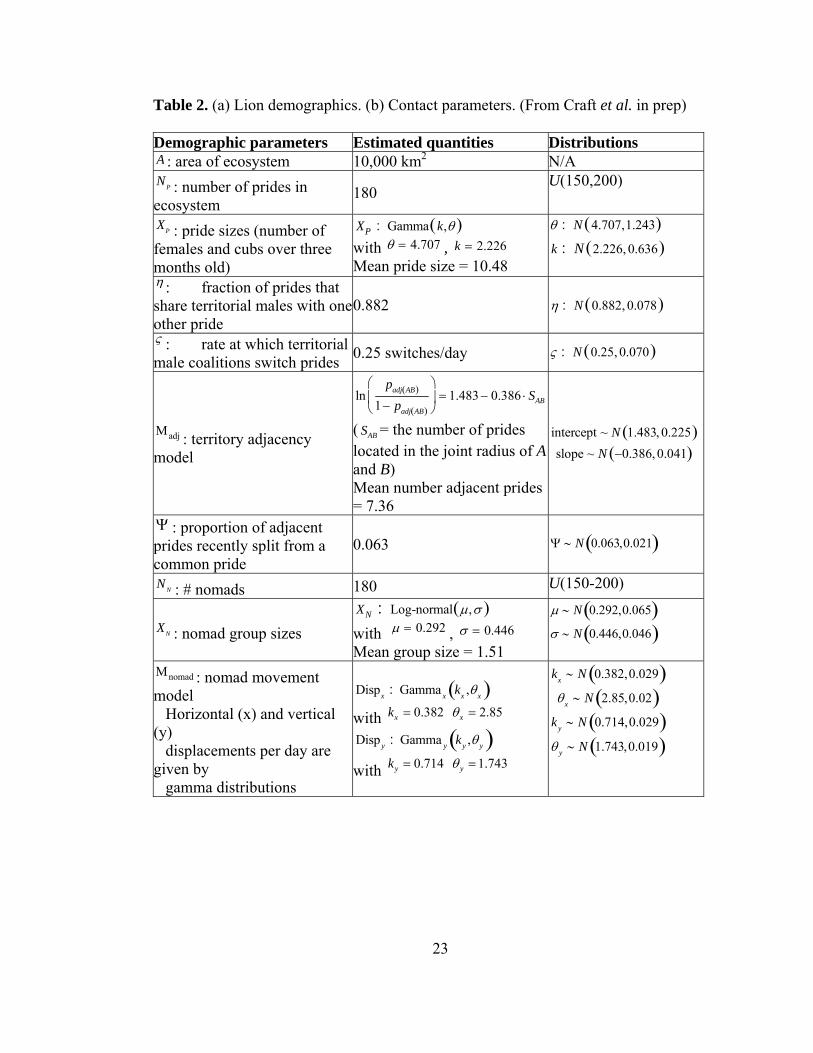
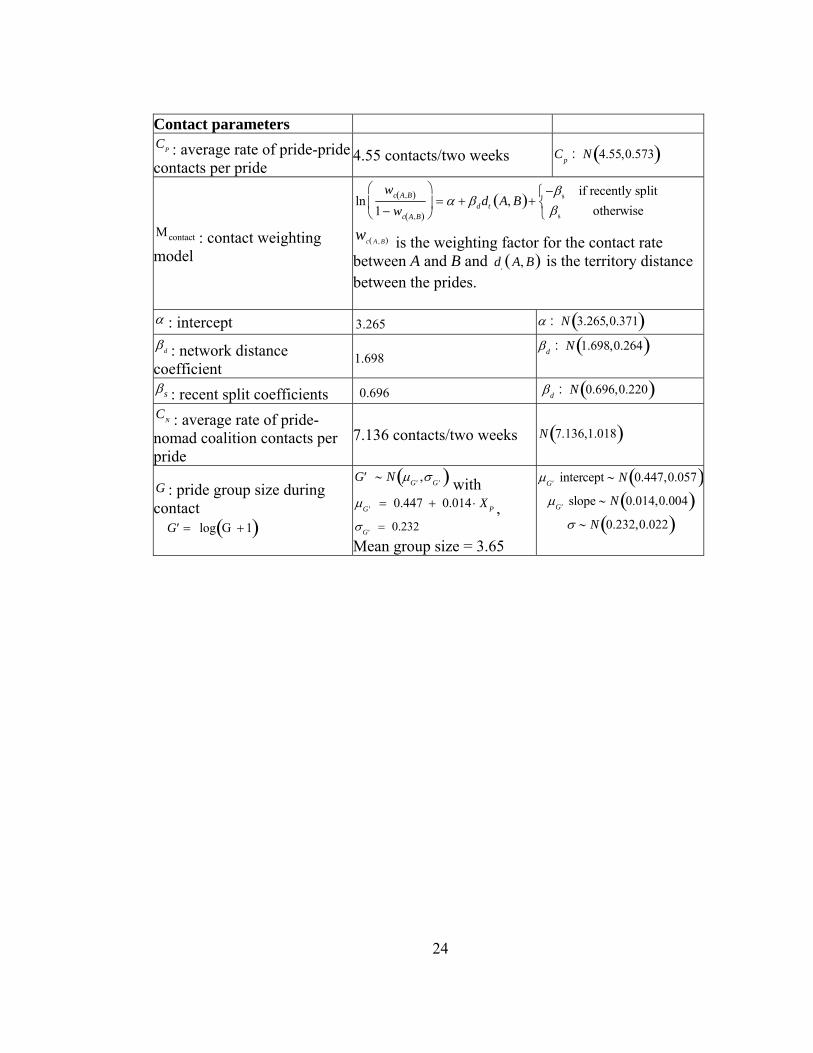
Table 2. (a) Lion demographics. (b) Contact parameters. .................................. 23
Chapter 2
Table 1. (a) Lion demographics, (b) contact parameters, (c) epidemiological
parameters........................................................................................................... 52
Chapter 3
Table 1. Demographic, contact, and epidemiological parameters for Serengeti
lion prides. .......................................................................................................... 78
Table S1. Logistic regression of population structure on epidemiological risk. 88
Chapter 4
Table 1. Relative rates of within- and between-group transmission ................ 102
Table S1. Pairwise comparison between means for 95% CI’s. ........................ 110
x
List of Figures
Chapter 1
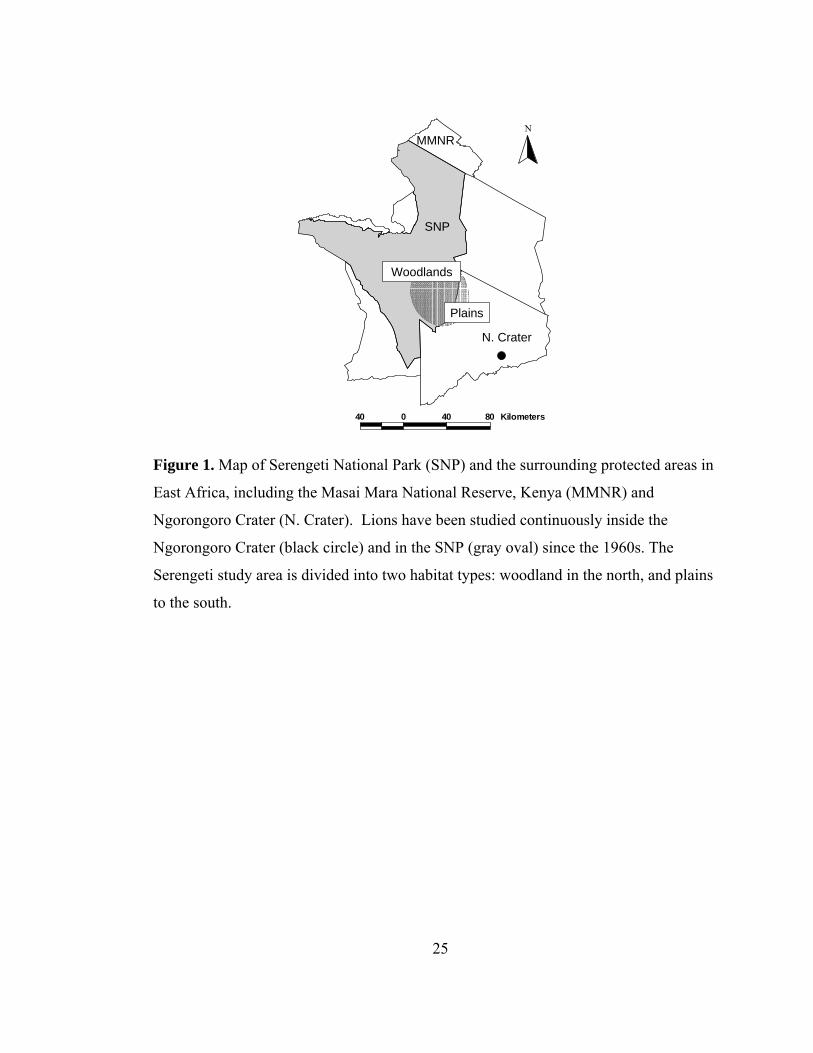
Figure 1. Map of Serengeti National Park (SNP) and the surrounding protected
areas ..................................................................................................... 25
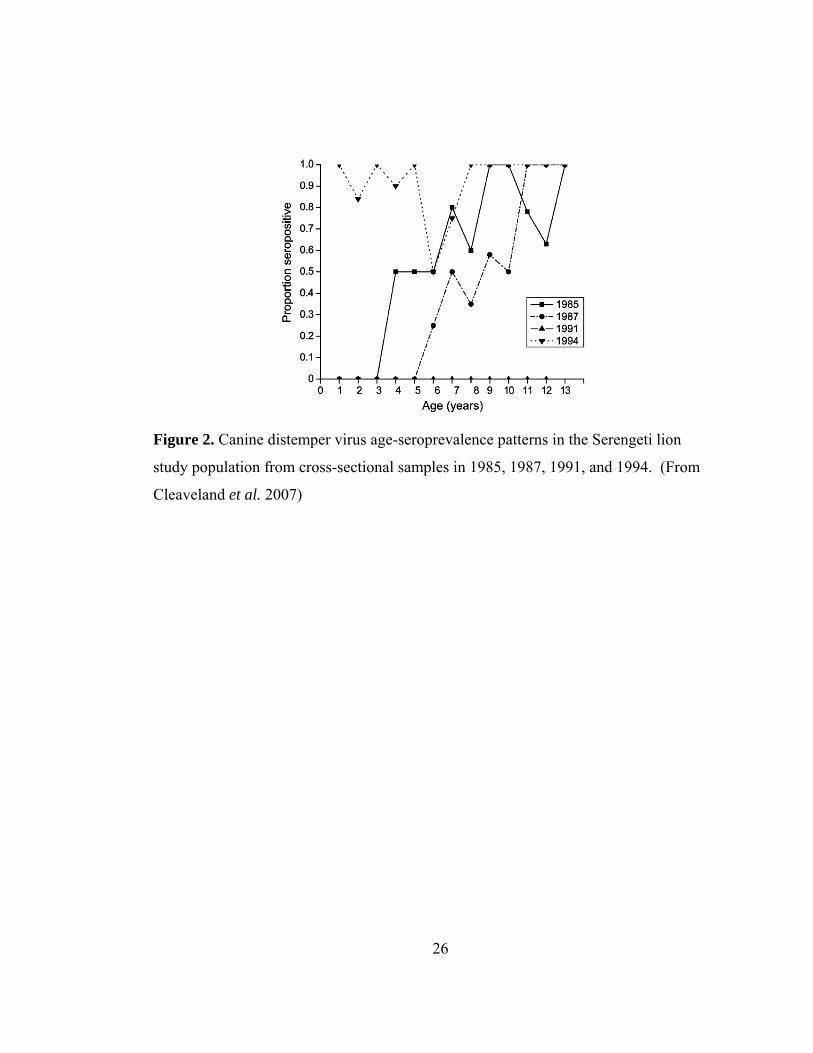
Figure 2. Canine distemper virus age-seroprevalence patterns .......................... 26
Figure 3. Annual seroprevalence rates in the Serengeti for feline herpesvirus .. 27
Figure 4. Annual seroprevalence rates in the Serengeti for (a) coronavirus (b)
parvovirus and (c) calicivirus............................................................... 28
Figure 5. Representative seroprevalence curves ............................................... 29
Figure 6. Age-prevalence curves for FIV.......................................................... 30
Figure 7. Model fitted to T. brucei and T. congolense age-prevalence curves . 31
Figure 8. Spatiotemporal spread of CDV. .......................................................... 32
Figure 9. Abiotic and biotic factors in the Ngorongoro Crater which led to
mortality in Crater lions ....................................................................... 34
Figure 10. Movement patterns of a Serengeti nomadic lion .............................. 35
Figure 11. Prevalence across a range of transmissibilities ................................. 36
Figure 12. Network correlograms for simulated epidemics. ............................. 37
Figure 13. Velocity across a range of transmissibilities..................................... 38
Figure 14. Probability of observed epidemic values across a range of
transmissiblities.................................................................................... 39
Chapter 2
Figure 1. Distributions of (a) pride size and (b) nomadic group size................. 54
Figure 2. Comparison of actual (a,c) and simulated (b,d) lion populations. ...... 55
Figure 3. Adjacency Model. ............................................................................... 56
Figure 4. Total pride size vs. group size participating in an interaction. ........... 57
Figure 5. Movement patterns of a Serengeti nomadic lion ................................ 58
Figure 6. Proportion of transmission events...................................................... 59
Figure 7. Prevalence of CDV in prides across a range of transmissibilities ...... 60
xi
Figure 8. Network distance vs. average correlation at two transmissibility
values. .................................................................................................. 61
Figure 9. Velocity across a range of transmissibility values. ............................. 62
Chapter 3
Figure 1. The ecosystem and study area (subset) in both the Serengeti and the
model.................................................................................................... 80
Figure 2. Epidemiological risk versus the geographic and network location of a
pride. .................................................................................................... 81
Figure 3. The prevalence of CDV in the population and subset as a function of
transmissibility ..................................................................................... 82
Figure 4. Spatial spread of CDV. ....................................................................... 83
Figure 5. Spatio-temporal progression of CDV in both the observed study area
and a model subset. .............................................................................. 85
Figure 6. Epidemic velocity. .............................................................................. 86
Figure 7. Probability of observed epidemiological patterns in a simulated
outbreak maintained solely by lion-to-lion transmission. .................... 87
Figure S1. Probability of observed epidemic values across a range of
transmissiblities.................................................................................... 89
Chapter 4
Figure 1. The observed dynamics of a canine distemper outbreak in the
Serengeti lion study population.......................................................... 103
Figure 2. Temporal dynamics of simulated epidemics.................................... 105
Figure 3. Cumulative number of infecteds, velocity, and percentage of
simulations causing an epidemic for each combination of species.... 107
Figure 4. Spatial spread simulations and correlations. .................................... 108

1
CHAPTER 1
Ecology of infectious diseases in Serengeti lions*
Chapter Introduction
Diseases that affect lions (Panthera leo) are often connected with much larger
ecosystem processes. Pathogens often infect more than one host species; these multi-
host pathogens (e.g. rabies, canine distemper virus) link lions to domestic animals and
also to populations of endangered wildlife (e.g. African wild dogs) (Cleaveland et al.
2002). Second, each host species is commonly infected by more than one pathogen,
which can change expected disease transmission rates and virulence (Graham et al.
2007). Such multi-host/multi-pathogen systems are difficult to study in the wild because
information on the full range of hosts is lacking, and because pathogens may interact
differently with each other and each host species. Third, environmental perturbations
can change the interplay between the host and pathogen and trigger disease outbreaks in
ways that can only be understood through long-term monitoring. Fortunately in East
Africa’s Serengeti ecosystem, data on lions has been collected for over 40 years and lies
within a framework of long-term studies of other predatory species, herbivores, human
populations, and climatic conditions (Sinclair et al. 2008). Hence data collected from
the Serengeti Lion Project provides the rare opportunity to tackle complex issues of
disease dynamics in wild animal populations, with the ultimate aim towards conserving
lions in their natural habitat.
This chapter will begin with an exploration of a wide variety of diseases in
Serengeti lions. It will highlight differences between endemic and epidemic pathogens,
show that pathogenicity is often difficult to discern and could vary by ecosystem
(bovine tuberculosis), illustrate that some pathogens still fit the one- host, one-pathogen
traditional disease model (feline immunodeficiency virus), and highlight that co-
* This chapter was accepted as a book chapter as: Craft, M. (in press) Ecology of infectious diseases in Serengeti lions. In: Biology and Conservation of Wild Felids (Eds. Macdonald, D.W. & A. Loveridge), Oxford University Press, Oxford.
2
infections are not always harmful to the host (trypanosomes). The second part of the
chapter will provide an in-depth case study on the dynamics of canine distemper virus
in the Serengeti lion population, and will conclude with new research synthesizing
biology and epidemiology through the use of detailed mathematical models.
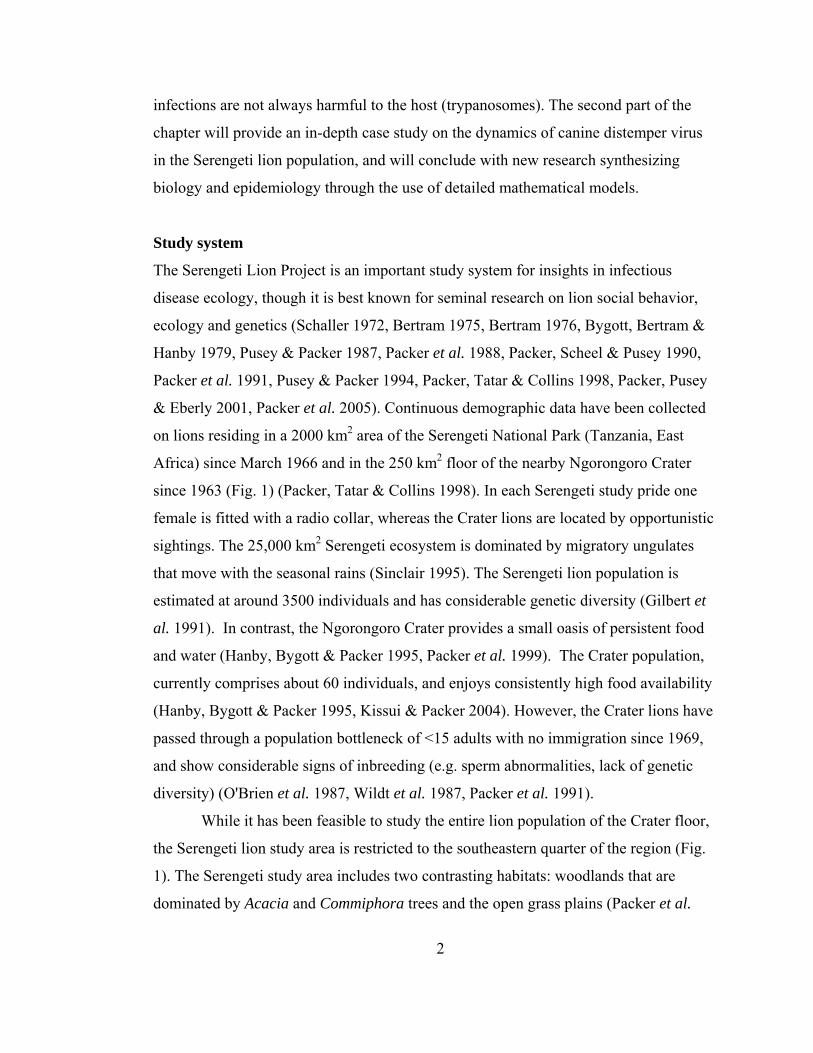
Study system
The Serengeti Lion Project is an important study system for insights in infectious
disease ecology, though it is best known for seminal research on lion social behavior,
ecology and genetics (Schaller 1972, Bertram 1975, Bertram 1976, Bygott, Bertram &
Hanby 1979, Pusey & Packer 1987, Packer et al. 1988, Packer, Scheel & Pusey 1990,
Packer et al. 1991, Pusey & Packer 1994, Packer, Tatar & Collins 1998, Packer, Pusey
& Eberly 2001, Packer et al. 2005). Continuous demographic data have been collected
on lions residing in a 2000 km2 area of the Serengeti National Park (Tanzania, East
Africa) since March 1966 and in the 250 km2 floor of the nearby Ngorongoro Crater
since 1963 (Fig. 1) (Packer, Tatar & Collins 1998). In each Serengeti study pride one
female is fitted with a radio collar, whereas the Crater lions are located by opportunistic
sightings. The 25,000 km2 Serengeti ecosystem is dominated by migratory ungulates
that move with the seasonal rains (Sinclair 1995). The Serengeti lion population is
estimated at around 3500 individuals and has considerable genetic diversity (Gilbert et
al. 1991). In contrast, the Ngorongoro Crater provides a small oasis of persistent food
and water (Hanby, Bygott & Packer 1995, Packer et al. 1999). The Crater population,
currently comprises about 60 individuals, and enjoys consistently high food availability
(Hanby, Bygott & Packer 1995, Kissui & Packer 2004). However, the Crater lions have
passed through a population bottleneck of <15 adults with no immigration since 1969,
and show considerable signs of inbreeding (e.g. sperm abnormalities, lack of genetic
diversity) (O'Brien et al. 1987, Wildt et al. 1987, Packer et al. 1991).
While it has been feasible to study the entire lion population of the Crater floor,
the Serengeti lion study area is restricted to the southeastern quarter of the region (Fig.
1). The Serengeti study area includes two contrasting habitats: woodlands that are
dominated by Acacia and Commiphora trees and the open grass plains (Packer et al.
3
2005). Because lion prides are highly territorial, residential lions are not able to access
the migratory prey year round. Hence, prides of lions residing in the woodlands have
year-round access to residential prey, while the plains prides face ‘feast or famine’,
depending on the location of the migratory herds (Scheel & Packer 1995). As a result,
lions live at higher densities in the woodlands and lower densities on the plains (Scheel
& Packer 1995, Packer et al. 2005).
Serengeti lions live in gregarious groups (prides) composed of one to 21 related
females, their dependent offspring, and a resident coalition of one to nine males. Prides
are territorial and infrequently contact their neighbours (Packer, Lewis & Pusey 1992);
inter-pride encounters can be deadly (Schaller 1972, McComb et al. 1993, Grinnell,
Packer & Pusey 1995). When prides grow too large, cohorts of young females split off
and form a neighbouring pride (Pusey & Packer 1987) and are more tolerant of their
non-pride relatives (VanderWaal, Mosser & Packer in press). Coalitions of males can
be resident in more than one pride (Bygott, Bertram & Hanby 1979), and distribute their
time between their various prides (Schaller 1972). In contrast, nomads are adult male
and female lions that do not maintain a territory and move great distances though the
ecosystem (Schaller 1972). Residents and nomads occasionally interact during mating,
territorial defense, and at kills.
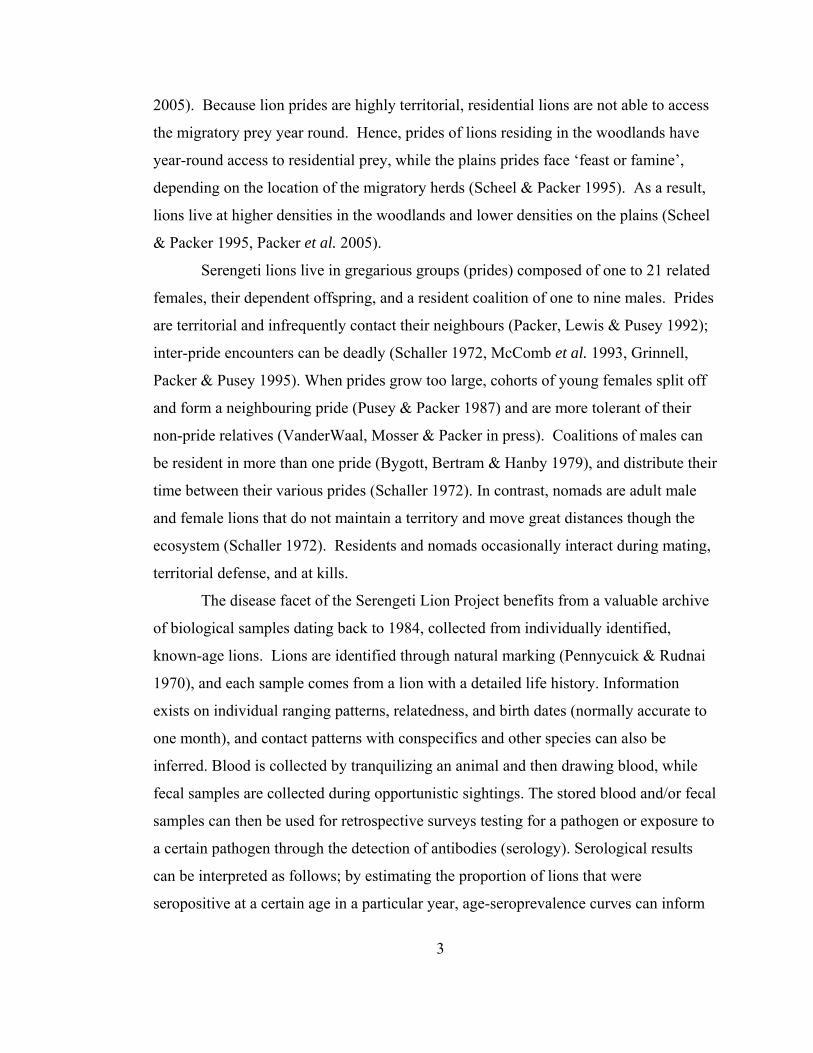
The disease facet of the Serengeti Lion Project benefits from a valuable archive
of biological samples dating back to 1984, collected from individually identified,
known-age lions. Lions are identified through natural marking (Pennycuick & Rudnai
1970), and each sample comes from a lion with a detailed life history. Information
exists on individual ranging patterns, relatedness, and birth dates (normally accurate to
one month), and contact patterns with conspecifics and other species can also be
inferred. Blood is collected by tranquilizing an animal and then drawing blood, while
fecal samples are collected during opportunistic sightings. The stored blood and/or fecal
samples can then be used for retrospective surveys testing for a pathogen or exposure to
a certain pathogen through the detection of antibodies (serology). Serological results
can be interpreted as follows; by estimating the proportion of lions that were
seropositive at a certain age in a particular year, age-seroprevalence curves can inform
4
whether diseases persist or are transient in the lion population (endemic vs. epidemic)
(Packer et al. 1999). In addition, the timing of epidemic disease outbreaks can be
estimated by plotting each year’s annual seroprevalence rate (Packer et al. 1999).
Because snapshot studies of exposure can be misleading, these data must be collected
through the highs and lows in prevalence over prolonged periods (Cleaveland et al.
2007).
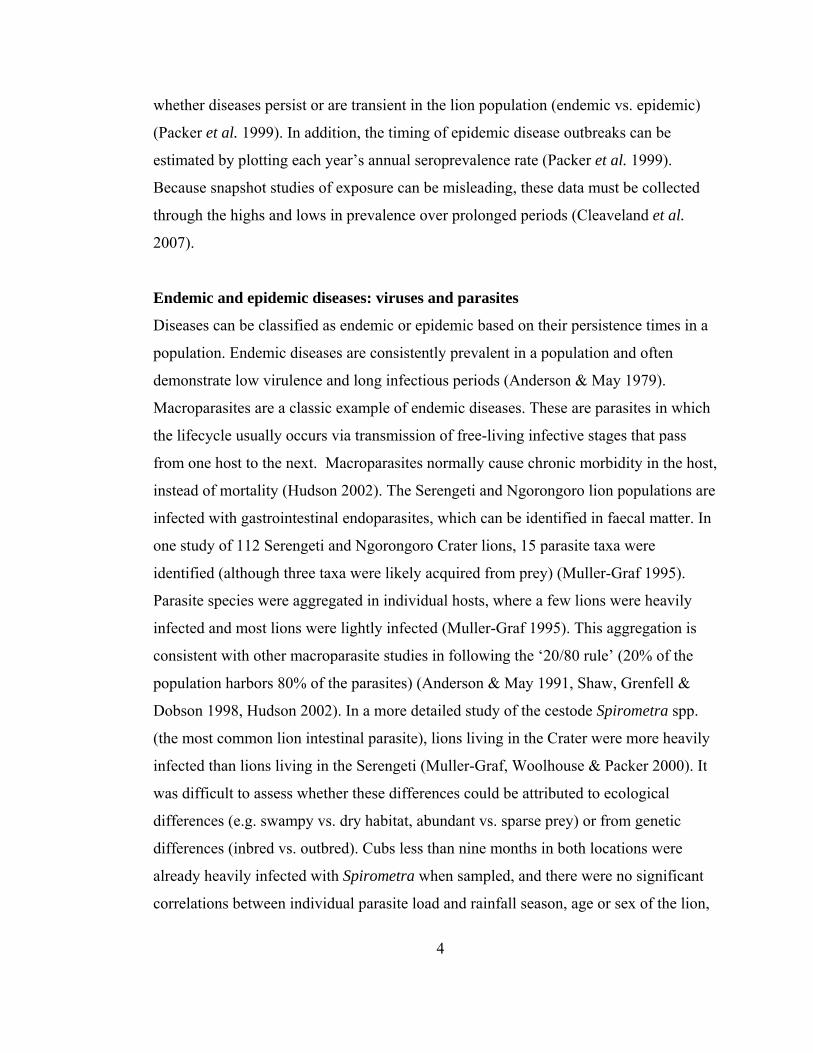
Endemic and epidemic diseases: viruses and parasites
Diseases can be classified as endemic or epidemic based on their persistence times in a
population. Endemic diseases are consistently prevalent in a population and often
demonstrate low virulence and long infectious periods (Anderson & May 1979).
Macroparasites are a classic example of endemic diseases. These are parasites in which
the lifecycle usually occurs via transmission of free-living infective stages that pass
from one host to the next. Macroparasites normally cause chronic morbidity in the host,
instead of mortality (Hudson 2002). The Serengeti and Ngorongoro lion populations are
infected with gastrointestinal endoparasites, which can be identified in faecal matter. In
one study of 112 Serengeti and Ngorongoro Crater lions, 15 parasite taxa were
identified (although three taxa were likely acquired from prey) (Muller-Graf 1995).
Parasite species were aggregated in individual hosts, where a few lions were heavily
infected and most lions were lightly infected (Muller-Graf 1995). This aggregation is
consistent with other macroparasite studies in following the ‘20/80 rule’ (20% of the
population harbors 80% of the parasites) (Anderson & May 1991, Shaw, Grenfell &
Dobson 1998, Hudson 2002). In a more detailed study of the cestode Spirometra spp.
(the most common lion intestinal parasite), lions living in the Crater were more heavily
infected than lions living in the Serengeti (Muller-Graf, Woolhouse & Packer 2000). It
was difficult to assess whether these differences could be attributed to ecological
differences (e.g. swampy vs. dry habitat, abundant vs. sparse prey) or from genetic
differences (inbred vs. outbred). Cubs less than nine months in both locations were
already heavily infected with Spirometra when sampled, and there were no significant
correlations between individual parasite load and rainfall season, age or sex of the lion,

5
reproductive status, or pride size. In another cross-sectional study of 33 lions, over 19
species of parasites were identified in the lion population (although some were likely
acquired from prey) (Bjork, Averbeck & Stromberg 2000). Again, the number of
gastrointestinal parasite species per lion did not change significantly with respect to sex,
habitat, or age of the lion.
The ecology of endemic diseases in natural populations is difficult to study
without controlled experiments and intervention as it seems lions are constantly infected
and the lion population and their gastrointestinal parasites likely remain near
equilibrium. In order to detect the effects of genetic (inbred vs. outbred) or ecological
factors (high vs. low prey densities) on levels of parasite infections, there would have to
be a much wider array of study populations, covering a wider range of genetic or
ecological factors (Muller-Graf, Woolhouse & Packer 2000). To assess whether
macroparasites in any way ‘regulate’ the lion population, either lions or their parasites
would have to be experimentally perturbed to detect any effects on morbidity and
mortality (Tompkins et al. 2002). Long-term eradication/control of the lions’
gastrointestinal parasites would not be feasible and experimental infections would be
impossible to justify.
In studies of disease in wildlife, it is often difficult to detect sick animals, locate
carcasses for post-mortem exams, and to isolate the viral pathogens. In contrast,
serological studies can be performed by screening large numbers of living individuals.
However, serology merely determines whether an individual possesses antibodies to a
certain pathogen and was therefore exposed sometime in the past; a positive serological
result is unlikely to indicate current infection. As Serengeti lions have been known to
live up to 20 years, a serological cross-sectional study could potentially be misleading.
For example, the proportion of lions with antibodies for canine distemper virus (CDV)
in 1985 could have been attributed to a constantly circulating (endemic) disease with
increased cumulative exposure in adults, when, in fact, CDV had been absent from the
population for several years, and the older age classes retained antibodies from an
earlier epidemic (Fig. 2).
6
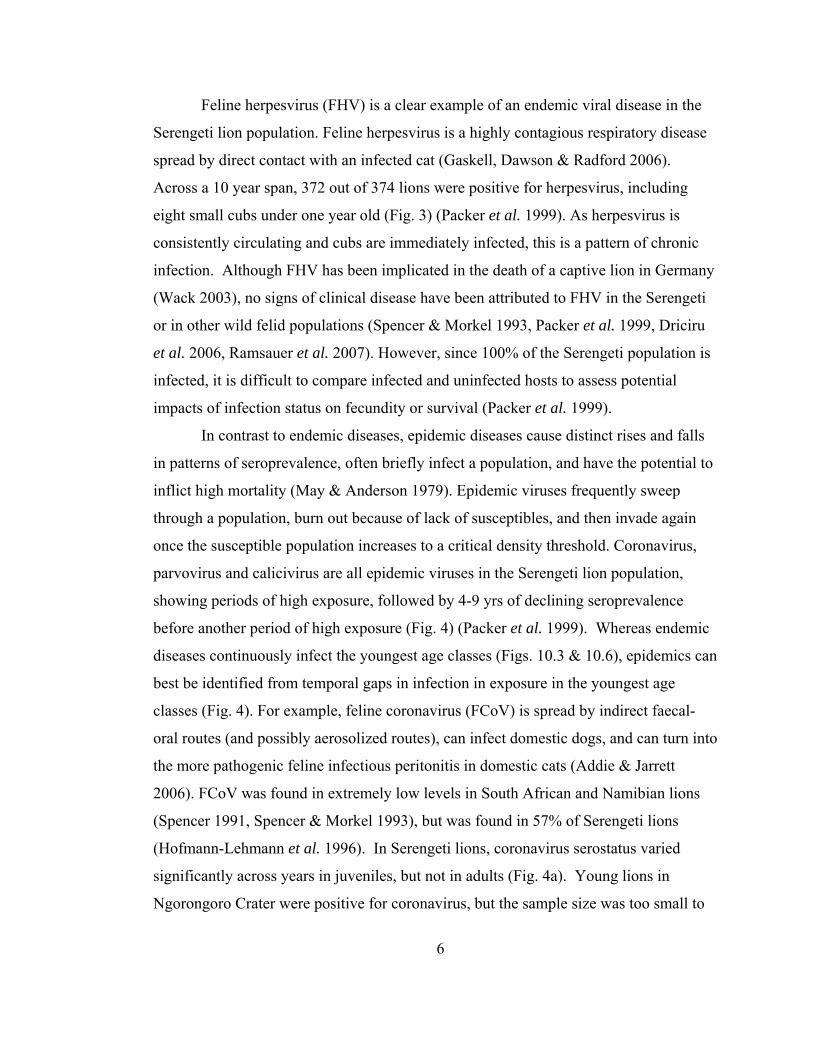
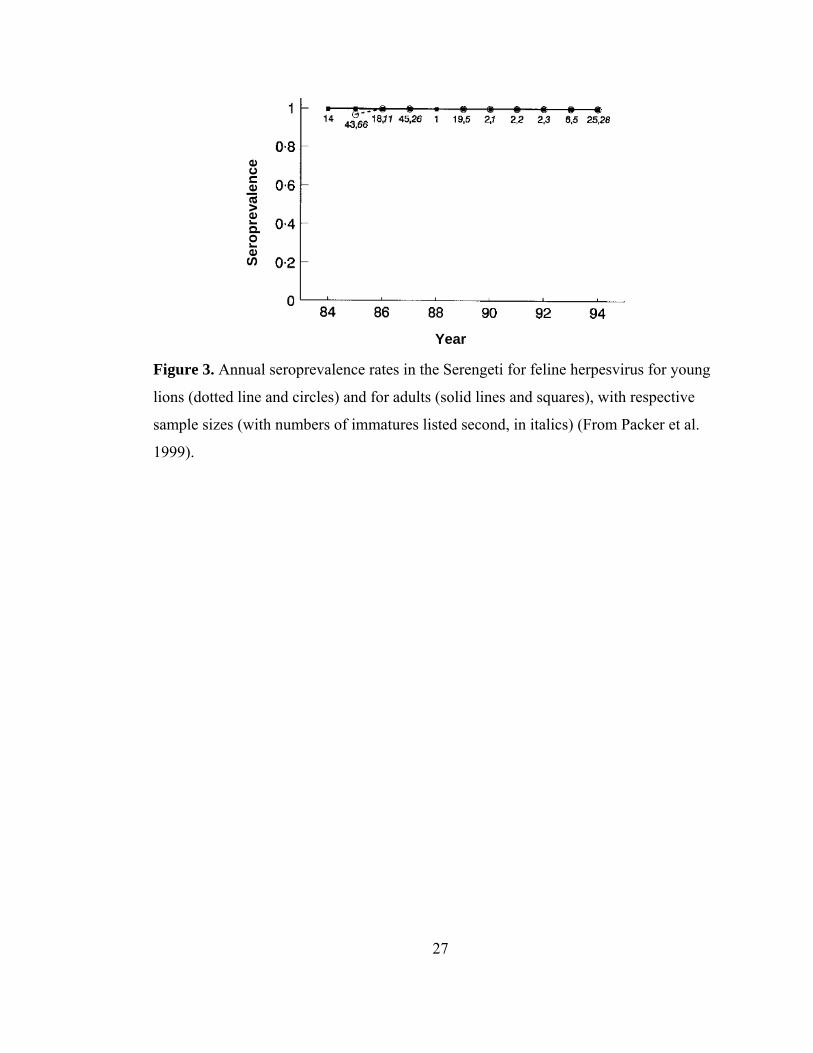
Feline herpesvirus (FHV) is a clear example of an endemic viral disease in the
Serengeti lion population. Feline herpesvirus is a highly contagious respiratory disease
spread by direct contact with an infected cat (Gaskell, Dawson & Radford 2006).
Across a 10 year span, 372 out of 374 lions were positive for herpesvirus, including
eight small cubs under one year old (Fig. 3) (Packer et al. 1999). As herpesvirus is
consistently circulating and cubs are immediately infected, this is a pattern of chronic
infection. Although FHV has been implicated in the death of a captive lion in Germany
(Wack 2003), no signs of clinical disease have been attributed to FHV in the Serengeti
or in other wild felid populations (Spencer & Morkel 1993, Packer et al. 1999, Driciru
et al. 2006, Ramsauer et al. 2007). However, since 100% of the Serengeti population is
infected, it is difficult to compare infected and uninfected hosts to assess potential
impacts of infection status on fecundity or survival (Packer et al. 1999).
In contrast to endemic diseases, epidemic diseases cause distinct rises and falls
in patterns of seroprevalence, often briefly infect a population, and have the potential to
inflict high mortality (May & Anderson 1979). Epidemic viruses frequently sweep
through a population, burn out because of lack of susceptibles, and then invade again
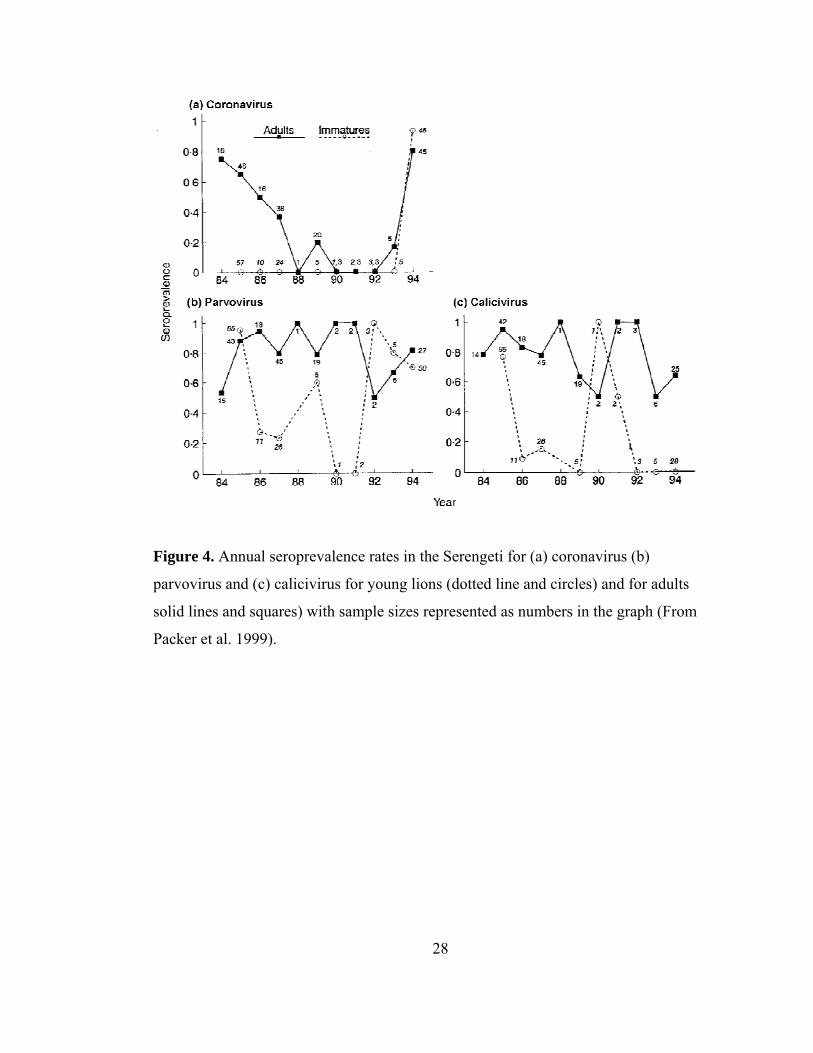
once the susceptible population increases to a critical density threshold. Coronavirus,
parvovirus and calicivirus are all epidemic viruses in the Serengeti lion population,
showing periods of high exposure, followed by 4-9 yrs of declining seroprevalence
before another period of high exposure (Fig. 4) (Packer et al. 1999). Whereas endemic
diseases continuously infect the youngest age classes (Figs. 10.3 & 10.6), epidemics can
best be identified from temporal gaps in infection in exposure in the youngest age
classes (Fig. 4). For example, feline coronavirus (FCoV) is spread by indirect faecal-
oral routes (and possibly aerosolized routes), can infect domestic dogs, and can turn into
the more pathogenic feline infectious peritonitis in domestic cats (Addie & Jarrett
2006). FCoV was found in extremely low levels in South African and Namibian lions
(Spencer 1991, Spencer & Morkel 1993), but was found in 57% of Serengeti lions
(Hofmann-Lehmann et al. 1996). In Serengeti lions, coronavirus serostatus varied
significantly across years in juveniles, but not in adults (Fig. 4a). Young lions in
Ngorongoro Crater were positive for coronavirus, but the sample size was too small to
7
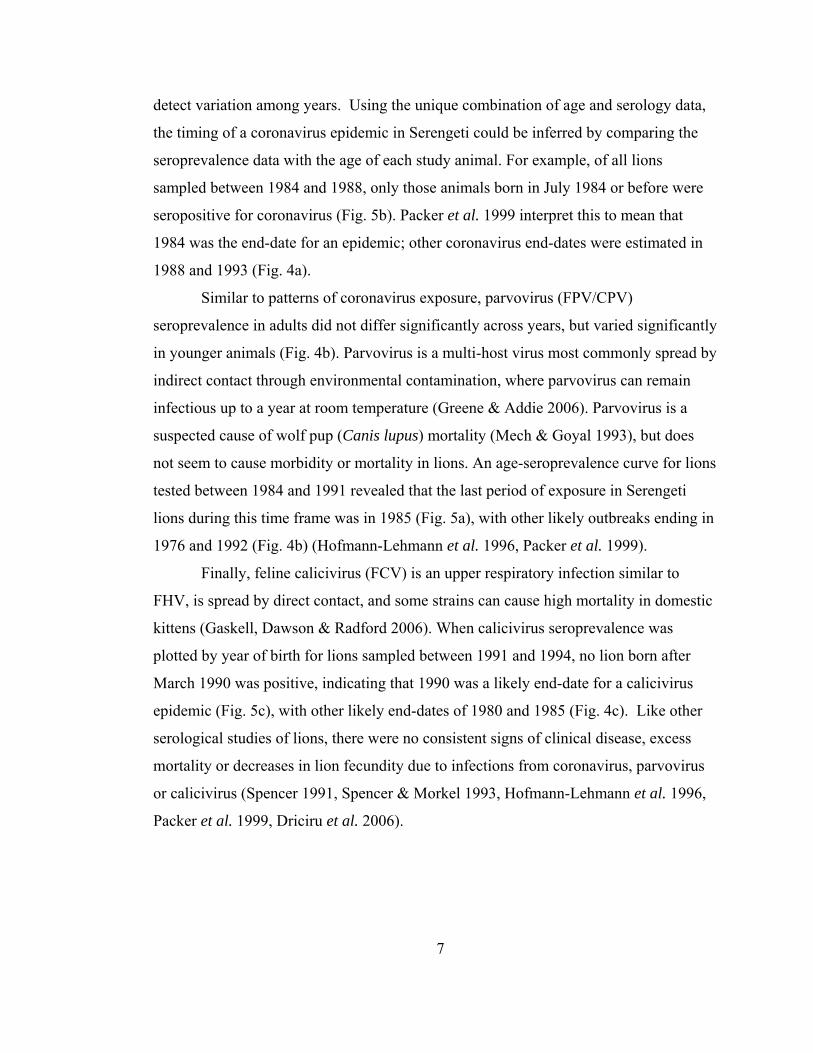
detect variation among years. Using the unique combination of age and serology data,
the timing of a coronavirus epidemic in Serengeti could be inferred by comparing the
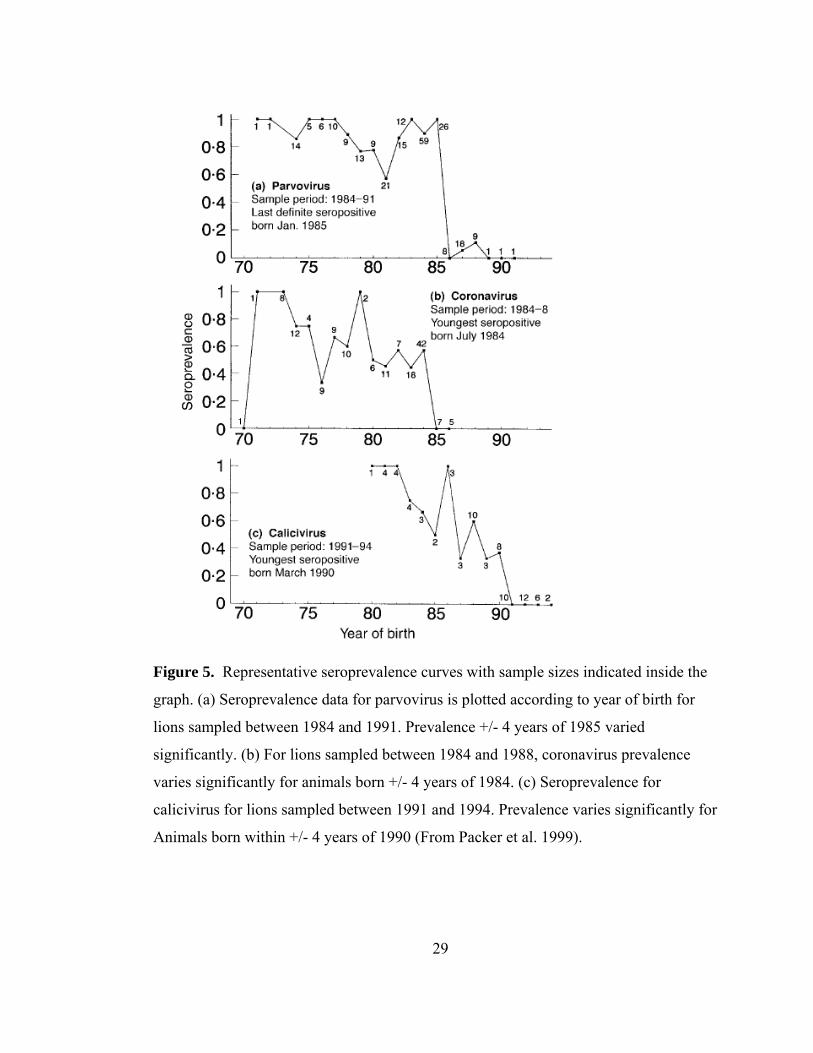
seroprevalence data with the age of each study animal. For example, of all lions
sampled between 1984 and 1988, only those animals born in July 1984 or before were
seropositive for coronavirus (Fig. 5b). Packer et al. 1999 interpret this to mean that
1984 was the end-date for an epidemic; other coronavirus end-dates were estimated in
1988 and 1993 (Fig. 4a).
Similar to patterns of coronavirus exposure, parvovirus (FPV/CPV)
seroprevalence in adults did not differ significantly across years, but varied significantly
in younger animals (Fig. 4b). Parvovirus is a multi-host virus most commonly spread by
indirect contact through environmental contamination, where parvovirus can remain
infectious up to a year at room temperature (Greene & Addie 2006). Parvovirus is a
suspected cause of wolf pup (Canis lupus) mortality (Mech & Goyal 1993), but does
not seem to cause morbidity or mortality in lions. An age-seroprevalence curve for lions
tested between 1984 and 1991 revealed that the last period of exposure in Serengeti
lions during this time frame was in 1985 (Fig. 5a), with other likely outbreaks ending in
1976 and 1992 (Fig. 4b) (Hofmann-Lehmann et al. 1996, Packer et al. 1999).
Finally, feline calicivirus (FCV) is an upper respiratory infection similar to
FHV, is spread by direct contact, and some strains can cause high mortality in domestic
kittens (Gaskell, Dawson & Radford 2006). When calicivirus seroprevalence was
plotted by year of birth for lions sampled between 1991 and 1994, no lion born after
March 1990 was positive, indicating that 1990 was a likely end-date for a calicivirus
epidemic (Fig. 5c), with other likely end-dates of 1980 and 1985 (Fig. 4c). Like other
serological studies of lions, there were no consistent signs of clinical disease, excess
mortality or decreases in lion fecundity due to infections from coronavirus, parvovirus
or calicivirus (Spencer 1991, Spencer & Morkel 1993, Hofmann-Lehmann et al. 1996,
Packer et al. 1999, Driciru et al. 2006).
8
A low impact pathogen or an insidious threat: bovine tuberculosis
Mycobacterium bovis, the causative agent of bovine tuberculosis (bTB), is a bacterium
of growing concern in African wildlife (Michel et al. 2006). In Kruger National Park,
South Africa, an epidemic of bTB infection in African buffalo (Sycerus caffer) has been
moving northwards across the park since 1990 (Michel et al. 2006). Monitored lions
from the same area have become infected (Cleaveland et al. 2005, Michel et al. 2006),
and although the Kruger lion population currently seems stable (Ferreira & Funston, in
press), both lions and buffalos show mortality and morbidity. In contrast, between 1985
and 2000 none of the 19 lions sampled in the Ngorongoro Crater were seropositive for
bTB and only eight of 184 (4%) Serengeti lions were seropositive for bTB (Cleaveland
et al. 2005). The Tanzanian samples were collected over a period of 15 years and,
although one of the positive lions was sampled in 1984, there were no significant
differences between average prevalences from 1984-1996 and 1997-2000. This
indicates that bTB has been rare in the population for a long time, and is not spreading
quickly. While clinical signs were seen in four out of eight seropositive animals, and
seropositive animals survived for a shorter (but non-significant) amount of time than did
non-infected individuals, with such a low sample size of positives, it is difficult to
quantify the pathogenicity of bTB in Serengeti lions (Cleaveland et al. 2005).
Cleaveland et al. suspect that exposure in lions was due to eating infected prey.
One-host, one-pathogen: feline immunodeficiency virus
Serengeti lions are infected with a lentivirus, feline immunodeficiency virus (FIV),
which is genetically homologous and functionally analogous to human
immunodeficiency virus (HIV) (Brown et al. 1994). Like HIV, once infected, FIV
permanently infects the host. FIV has species-specific strains, and the strain infecting
lions is named FIV-Ple (Olmsted et al. 1992). In contrast to recent work showing
frequent FIV transmission from bobcats to pumas in the United States (Franklin et al.
2007), phylogenetic analysis suggest that cross-species transmission is unlikely
between lions and other large African carnivores (Troyer et al. 2005).
9
Although lions have been likely hosts to FIV since the late Pleistocene (Brown
et al. 1994, Pecon-Slattery et al. 2008), not all populations of lions are currently
infected. African lions in Namibia and Asiatic lions in India test negative for FIV. On
the other hand, FIV is extremely prevalent in East African and South African lions, and
the incidence in these populations is higher than in any other wild or domestic felid
population (Olmsted et al. 1992, Driciru et al. 2006). Serengeti lions not only have
exceptionally high incidence of FIV (84-93%), but because these high levels are
consistently maintained over many years, FIV is endemic in the Serengeti (Olmsted et
al. 1992, Brown et al. 1994, Hofmann-Lehmann et al. 1996, Packer et al. 1999, Troyer
et al. 2005). FIV infection rates do not change significantly by sex or across years and
this is true for both adult and juvenile lions (Packer et al. 1999). Although not all
juvenile lions test positive, the vast majority of lions in Serengeti and Ngorongoro are
infected by four years of age. Because the entire adult Serengeti and Ngorongoro
population is FIV-positive, there is no control group in which to assess effects of
infection status on fecundity (Packer et al. 1999).
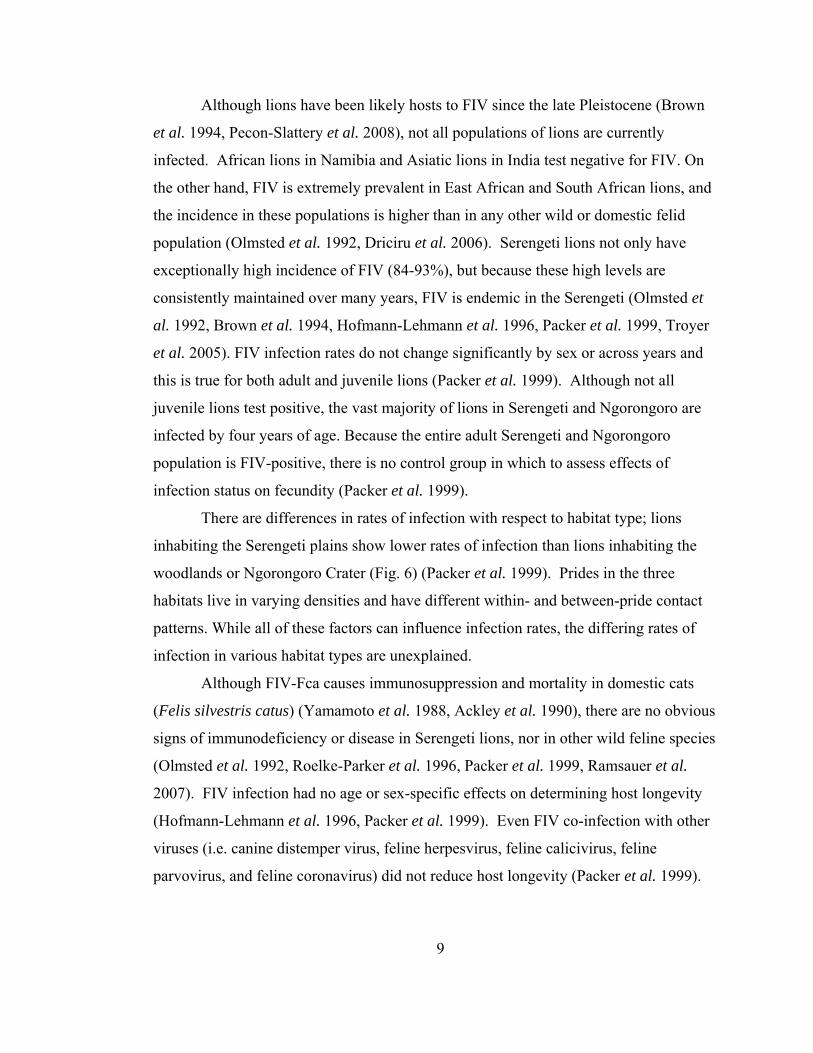
There are differences in rates of infection with respect to habitat type; lions
inhabiting the Serengeti plains show lower rates of infection than lions inhabiting the
woodlands or Ngorongoro Crater (Fig. 6) (Packer et al. 1999). Prides in the three
habitats live in varying densities and have different within- and between-pride contact
patterns. While all of these factors can influence infection rates, the differing rates of
infection in various habitat types are unexplained.
Although FIV-Fca causes immunosuppression and mortality in domestic cats
(Felis silvestris catus) (Yamamoto et al. 1988, Ackley et al. 1990), there are no obvious
signs of immunodeficiency or disease in Serengeti lions, nor in other wild feline species
(Olmsted et al. 1992, Roelke-Parker et al. 1996, Packer et al. 1999, Ramsauer et al.
2007). FIV infection had no age or sex-specific effects on determining host longevity
(Hofmann-Lehmann et al. 1996, Packer et al. 1999). Even FIV co-infection with other
viruses (i.e. canine distemper virus, feline herpesvirus, feline calicivirus, feline
parvovirus, and feline coronavirus) did not reduce host longevity (Packer et al. 1999).
10
Lions can be co-infected with different strains of FIV. Six FIV-Ple strains or
subtypes occur throughout Africa (Antunes et al. 2008). These subtypes (based on pol
gene sequence divergences) come from a common FIV-Ple lion ancestor, but are
distinct from each other (Brown et al. 1994). There is high genetic diversity within and
between the subtypes (Brown et al. 1994). Three different clades are present in the
Serengeti population (Brown et al. 1994), and multiple subtypes are found within the
same pride, and within the same individual (Troyer et al. 2004). In a recent study, 43%
of FIV-positive individuals in the Serengeti were infected with multiple strains of FIV
(Troyer et al. 2004). Thus co-infection with one subtype of FIV does not necessarily
confer immunity against secondary infection from another subtype (Troyer et al. 2004).
It is unknown whether FIV is spread primarily through horizontal transmission
(neighbour-to-neighbour) or from vertical transmission (parent-offspring). Both in
domestic cats and in lions, horizontal transmission seems to be the major route of
infection and likely occurs during biting (Yamamoto et al. 1988, Brown et al. 1994).
As evidence of horizontal transmission, two male Serengeti lions born in 1982 and in
1986 both tested negative for FIV in 1987 but tested positive in 1989 (Brown et al.
1994). In addition, FIV-positive cubs were born from FIV-negative mothers, and FIV-
negative cubs were born from FIV-positive mothers (Brown et al. 1994). There was
evidence of both between-pride and within-pride transmission though phylogenetic
analysis of sequences (Troyer et al. 2004). The strains were well mixed across all
prides: six out of 13 prides were infected with all three strains. In contrast, one pride
showed evidence of monophyletic clustering. Although closely-related lions often had
closely-related viral sequences (e.g. three sibling pairs and a mother-daughter pair),
indicating a common viral ancestor, it is hard to determine if these individuals were
infected by each other (vertical transmission in case of the parent-offspring) or by
another lion (Troyer et al. 2004). The identification of transmission routes can be
difficult because closely related lions are often found in close association with each
other.
According to phylogenetic analyses, lions have been infected with FIV-Ple virus
for long periods of time, and the three FIV subtypes diverged a long time ago—maybe
11
as far as the radiation of the genus Panthera (Olmsted et al. 1992, Brown et al. 1994).
Because there is no evidence for immune pathology or mortality from this ‘ancient’
virus, the interactions between lions and FIV-Ple could be an example of ‘modern
symbiosis’ or commensalism between a host and pathogen (Olmsted et al. 1992, Brown
et al. 1994). This attenuation makes the FIV-Ple host-virus relationship a great contrast
to the high pathogenicity of the recent HIV epidemic (Carpenter & O'Brien 1995).
Co-infections are not always harmful: trypanosomes
Trypanosomes are protozoan parasites that cause substantial economic and public health
problems in sub-Saharan Africa due to the morbidity and mortality of ‘sleeping
sickness’ in humans and livestock (Schmunis 2004, Shaw 2004). Because trypanosomes
have extremely complex antigenic surface proteins that change composition every 3-5
days, they can evade attack by the host’s immune system (Morrison et al. 2005).
Trypanosomes have a long history of infection in the Serengeti; in fact, the presence of
trypanosomiasis influenced the initial gazetting of the Serengeti National Park. The
tsetse fly (Glossina spp.), the vector that transmits the disease, kept the Serengeti un-
inhabitable for humans and their livestock, yet available for wildlife (Matzke 1979).
Sleeping sickness still circulates in the Serengeti, as seen in 2001 when 23 people died
from trypanosome infection (Jelinek et al. 2002, Mlengeya et al. 2002).
Trypanosomiasis is thought to be maintained in livestock in other parts of sub-Saharan
Africa (Welburn et al. 2001) and in wildlife populations in the Serengeti (Kaare et al.
2007).
Lions are likely infected with trypanosomes in one of two ways: through the bite
of an infected tsetse fly, or via oral inoculation when eating infected prey. Tsetse flies
need shade and woody vegetation to survive and thus do not inhabit the plains or the
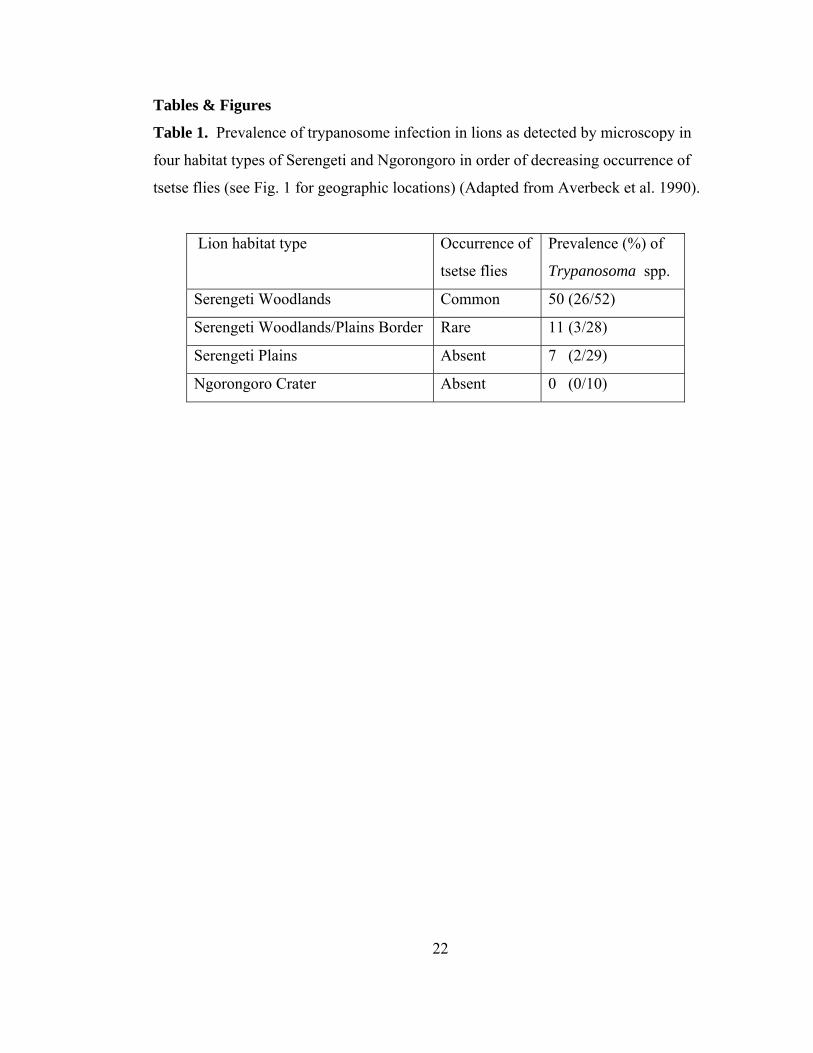
Crater. In a study of 123 Serengeti and Ngorongoro lions, trypanosomes were found by
microscopy in 32 individuals (Averbeck et al. 1990). While trypanosome prevalence
did not vary with respect to the lion’s age or sex, prevalence was highest in the
Serengeti woodlands, lower in the Serengeti plains and absent in the Crater (Table 1).
Prevalence of trypanosome infection correlated with increasing levels of tsetse flies
12
(Table 1), suggesting infection directly from tsetse bites. Two out of 29 plains lions,
however, did get infected, suggesting that lions might also be inoculated by consuming
infected prey that migrates to the plains from the woodlands. Prey such as wildebeest
(Connochaetes taurinus), grants gazelle (Gazella granti), Thompson gazelle (Gazella
thomsonii), and warthogs (Phacochoerus aethiopicus) are known to be infected with
trypanosomes (Baker 1968, Kaare et al. 2007). However, plains lions sometimes make
short forays to tsetse fly habitat during droughts (Averbeck et al. 1990, Packer, Scheel
& Pusey 1990), making it difficult to infer the mode of trypanosome transmission.
While microscopy could not identify trypanosomes to the species level,
molecular techniques have identified multiple Trypanosoma spp. that co-infect the
Serengeti lions: Trypanosoma congolense, T. brucei rhodesiense, the causative agent of
human sleeping sickness, and the non pathogenic T. brucei brucei (Welburn et al.
2008). Welburn et al. identify different age-prevalence patterns of exposure to T. brucei
and T. congolense (Fig. 7). Lions are rapidly exposed at a young age to T. brucei, and
then prevalence decreases, while prevalence of T. congolense increases steadily with
age. Because T. congolense is more common, and more genetically diverse than T.
brucei, Welburn et al. conclude that T. congolense infection confers protective
immunity against infection with T. brucei. In addition, cross-immunity likely explains
why lions are not infected with the human-pathogenic T. brucei rhodesiense after the
age of six. Lions do not show increased mortality due to infection. Welburn et al. show
the first evidence of acquired immunity to natural infection for trypanosomes, and more
broadly, this study is a useful way to rethink the assumption that all co-infections
necessarily harm the host.
Case study: canine distemper virus
Co-infection increases virulence in a multi-host pathogen
Infectious disease was not a major research focus when the Serengeti Lion Project was
founded in 1966. However, things changed in 1994 with the observation of six lions
experiencing violent symptoms such as grand-mal seizures and three lions with
13
myoclonus (recurrent twitching) (Roelke-Parker et al. 1996). Over a period of eight
months, one-third of the study lions died; a huge deviation from normal mortality rates,
and a sign of a previously unappreciated threat from infectious disease (Roelke-Parker
et al. 1996). When canine distemper virus (CDV) was identified as the causative agent,
it was the first time that CDV had been detected in wild lions (Appel & Summers
1995). At the end of the outbreak, CDV had spread extensively across the Serengeti
ecosystem, infecting 85% of survivors (Roelke-Parker et al. 1996).
Domestic dogs (Canis familiaris) were the likely source of infection into the lion
population. In 1992 and 1993, CDV was circulating in the high-density domestic dog
population to the northwest of the park and was not present elsewhere in the ecosystem
(Fig. 8a) (Roelke-Parker et al. 1996, Cleaveland et al. 2000). While it made intuitive
sense that domestic dogs were the source of CDV, the exact mechanism of transmission
between dogs and lions remained a mystery. As CDV is transmitted by aerosol or
droplet exposure (or possibly by eating an infected carcass) (Appel 1987, Greene &
Appel 2006), and domestic dogs and lions do not occupy the same habitat, it seemed
unlikely that a dog could transmit CDV directly to a lion, suggesting an intermediate
link, such spotted hyaenas, which are known to ‘commute’ long distances and to enter
agricultural areas outside the national park (Hofer & East 1993b). Another question
remained unanswered: was this the first time that lions had been exposed to CDV?
A retrospective serological study showed discrete periods of CDV exposure in
the study population (as evidenced by declining CDV seroprevalence levels in the
1980s reflecting earlier exposure possibly from a 1981 outbreak), although no
symptoms or excess mortality were observed during these earlier periods (Roelke-
Parker et al. 1996, Packer et al. 1999). Why then was the 1994 outbreak so harmful to
the lion population? Was this simply a new, more virulent strain of CDV (Packer et al.
1999)?
Then 40% of Crater lions died in 10 weeks in 2001, and 10 out of 10 sampled
lions tested positive for CDV antibodies (Kissui & Packer 2004, Munson et al. 2008).
Retrospective serological results of stored lion samples showed that Ngorongoro lions
were exposed to distemper at least once in the past (before 1984, most likely 1980), but
14
had not died or shown symptoms in the earlier period (Packer et al. 1999). In total, out
of at least seven CDV outbreaks in the Serengeti and Crater lion populations since
1975, lions only experienced symptoms and high mortality in the Serengeti in 1994 and
in the Crater in 2001.
New results indicate that the two periods of mass mortalities were due to a
convergence of biotic and abiotic conditions to create a ‘perfect storm’ where CDV
exacerbated the impacts of a tick-borne pathogen (Munson et al. 2008). Lions are
consistently infected with low levels of Babesia, a tick-borne parasite that can be
transferred from herbivores. Severe droughts led to large-scale starvation and mass
mortalities in African buffalo (Syncerus cafer) in the Serengeti in 1993 and the Crater in
2000; the weakened buffalo reached unprecedented heights in the lions’ diet and
exposed the lions to high levels of Babesia infection. CDV is immunosuppressive, and
the outbreaks in early 1994 and early 2001 allowed already high levels of Babesia to
overwhelm the co-infected lions. Serengeti prides in 1994 showed no increase in
mortality if they were only exposed to CDV or only to high levels of Babesia (Munson
et al. 2008).
Levels of Babesia were consistently higher in the Crater than the Serengeti.
Fyumagwa et al. 2007 trace the build up in Ngorongoro Crater to the 1970s (Fig. 9)
when management authorities embarked upon a policy of fire suppression and evicted
the pastoralist Masai from the Crater floor, removing the effects of fire, allowing the
grass to grow taller and increasing tick survival. Meanwhile, the buffalo population
grew in size, and hence the numbers of tick-infested buffalos also increased, especially
during the El Niño wet years (1997/98). This was followed by the drought of
1999/2000, which caused the death of buffalos, wildebeest, and rhinos, and the
consequent die-off in the Ngorongoro lion population (due to disease rather than
drought) (Fig. 9) (Fyumagwa et al. 2007). Although the Serengeti lion population was
large enough to return to its original population size by the middle of 1997 (Packer et
al. 1999, Packer et al. 2005), frequent outbreaks of disease seem to have kept the Crater
population below carrying capacity for the past 14 years (Kissui & Packer 2004).
15
Integrating biology and epidemiology into models
In order to manage disease threats effectively (e.g. to prevent CDV/Babesia from
causing mass mortalities again), it is important to understand which populations
maintain multi-host pathogens in the greater Serengeti ecosystem (Cleaveland et al.
2007, Cleaveland et al. 2008). The maintenance population is the species, or set of
species, in which the infection can independently persist (Haydon et al. 2002). In light
of this goal, a mass vaccination program was initiated in 2003, vaccinating >35,000
domestic dogs per year for CDV, parvovirus, and rabies with an aim of reducing disease
transmission to Serengeti wildlife (Cleaveland et al. 2007). By 2008, the program
appeared to have successfully eliminated canine rabies from wildlife in the Serengeti
ecosystem (Lembo et al. 2008) and it is not yet clear whether there has been any impact
on parvovirus exposure in the lions; however, CDV struck the Serengeti lions in 2006
(Munson et al. 2008).
Because CDV still seems to be a threat to lions (despite the dog vaccinations),
identification of a maintenance population is crucial. Some researchers claim that CDV
can be maintained solely within the lion population (without transmission from other
species such as hyenas or jackals), fuelled by occasional spill-over from the domestic
dog population (Guiserix et al. 2007). If so, lion-to-lion transmission alone should
account for the observed dynamics of the 1994 CDV outbreak inside the Serengeti
National Park. To test this hypothesis, an empirically-parameterized network model
was constructed to represent the demographic, spatial, and contact structure of the
Serengeti lion population before the 1993/4 outbreak (Craft et al, in prep). In contrast
to Guiserix’s model, where all lions in the ecosystem have an equal chance of
contacting other lions, the network model explicitly defines the different lion social
groups and assigns contacts between groups according to network adjacencies.
Lion network and contact structure
The observed population structure and contact patterns of the Serengeti lions were
estimated using empirical data from the Lion Project (Table 2). The network model
placed NP = 180 prides and NN = 180 coalitions of nomads at random locations in an
16
A = 10,000 km2 region of the Serengeti. Prides were assigned to be adjacent according
to the estimated adjacency model ( Μadj ). A fraction of adjacent pairs of prides ( Ψ )
were randomly assigned to have recently split. Each pride was given a group size ( XP )
drawn from an empirical distribution. Contacts between prides occurred at an average
of Cp = 4.55 contacts per two-week period per pride, as estimated from a study in
which 16 lionesses were observed continuously for a total of 2213 hours (Packer,
Scheel & Pusey 1990, Scheel & Packer 1991). Contacts between pairs of prides
occurred stochastically at rates weighted by a logistic function of the network distance
between the centroids of their territories ( Μcontact ).
Coalitions of resident males and nomads were treated separately from prides of
females and cubs. Male coalitions were represented as single units that increase
connectivity between prides. Each territorial coalition belonged to either one or two
prides; an estimated fractionη of all prides shared their territorial coalition with one of
their adjacent prides, and every other pride had a territorial coalition to itself. If a
territorial coalition was associated with more than one pride, it would switch between
prides according to ς , the territorial male migration rate. Nomadic lions were assigned
group sizes ( XN ) averaging 1.5 members and were assumed to migrate via a variance
gamma process ( Μnomad ) as estimated from a GPS-collared nomad (Fig. 10). Nomads
were assumed to contact their local pride according to the average rate of pride-nomad
contacts per pride (CN ).
When a pride contacted another pride or nomadic coalition, only a subset of the
pride was involved in the interaction (G ), and the number of lions involved depended
on the size of that pride. When nomads contacted prides, all members of the coalition
were assumed to be present. Inter-group contacts of resident males were incorporated
into the pride contact patterns.
Epidemiological model
In this network model, prides move through each susceptible, exposed, infectious, and
recovered class as a unit; prides contact other prides as a function of their distance
17
within territory adjacency networks; male coalitions transmit disease between their
residential prides; and nomads migrate and contact prides according to empirically-
estimated rates. CDV was introduced into this network and was transmitted among
prides according to incubating/infectious parameters estimated from the domestic dog
literature. Simulations were run across a range of transmissibility values (probability
that an infection is passed during a contact between a susceptible and infectious
individual). Model output was compared to three characteristics of the 1994 outbreak:
(1) 17/18 study prides were infected, (2) infection spread in a discontinuous pattern
through the study area (Fig. 8c), and (3) CDV took 35 weeks to spread 100 km to the
Maasai Mara National Reserve (MMNR) (Cleaveland et al. 2007, Craft et al. 2008).
Nomads—are they superspreaders?
Although nomads are numerous, travel long distances, and are likely candidates to be
considered superspreaders (Lloyd-Smith et al. 2005), their impacts on model CDV
disease dynamics were surprisingly low. In fact, for extensive outbreaks with 95%
prevalence, nomads only accounted for 10% of all transmissions, whereas the vast
majority of transmissions were pride-to-pride (neighbors, 53.1%; second degree
neighbors, 27.8%, and third degree neighbors 8.3%) and prides four prides away or
greater and shared males only accounted for less than 1% of transmissions. To assess
the effects of nomads on CDV prevalence, spatial spread, and velocity, simulations
were run where nomads migrated at an unrealistically fast rate and were removed
altogether. In the simulations (regardless of the presence or migration rate of nomads)
it was possible to infect at least 95% of prides, as seen in 1994. Accelerating the
migration rate of nomads only slightly increased overall CDV prevalence among prides
and removing nomads from the simulations slightly decreased overall prevalence (Fig.
11). The spatial spread of CDV, driven by pride-to-pride transmission, was wave-like
throughout the ecosystem and when we either increased the nomad migration rate or
removed nomads from the simulations, the overall spread in the population remained
wave-like, however was correlated at longer network distances with the high nomad
migration rate (Fig. 12). Finally, the model results produced a wave of CDV that
18
traveled at a velocity consistent with the observed velocity. However, because there was
no difference in the velocity of the epidemic when nomads were removed from the
simulations, this again showed that nomads were not driving the spatial spread (Fig.
13). For diseases with relatively short infectious periods, like the two weeks for CDV,
nomads to not appear to be superspreaders.
Did lions maintain the 1994 CDV outbreak themselves?
Model results showed that the observed 1994 CDV spatial spread pattern and velocity
were likely to occur at low transmissibilities, while the observed prevalence was likely
at higher transmissibilities, and only a select few simulations exhibited both the
observed prevalence and velocity (Fig. 14). The results from the model suggest that
epidemics could not have been as large and as slow as the observed 1993-94 outbreak;
hence the lion-to-lion transmission model lacked a critical component of the actual
transmission dynamics. Lions could not maintain distemper on their own, and the
missing piece of transmission was presumably multiple introductions of disease from
other wild carnivore species, such as spotted hyaenas (Crocuta crocuta) and jackals
(Canis spp.).
It is reasonable that other carnivores were involved in the fatal Serengeti
outbreak, as all families in the order Carnivora are susceptible to CDV (Williams 2001),
and lions frequently interact with hyaenas and jackals at carcasses (Cleaveland et al.
2008). A multi-host explanation for the observed CDV dynamics is also consistent with
(a) a genetic analysis of a single CDV variant found in lions, hyaenas, bat-eared foxes
(Otocyon megalotis), and domestic dogs at the time of the epidemic (Haas et al. 1996,
Roelke-Parker et al. 1996, Carpenter et al. 1998); (b) observations of a few sick
carnivores at the time of the epidemic (but no known effects on hyaena or jackal
populations) (Roelke-Parker et al. 1996); (c) serological reconstruction of an epidemic
in hyaenas, dogs, and lions (Fig. 8b) (Kock et al. 1998, Harrison et al. 2004); and (d)
the concept of morbilliviruses requiring a much larger critical community size than
3,000 lions (Bartlett 1960, Grenfell, Bjornstad & Kappey 2001). In other words, the
1994 CDV epidemic observed in lions was likely fuelled by multiple carnivore species.
19
Multi-host dynamics
If lions could not produce the observed CDV outbreak, and other wild carnivores were
feasibly involved in transmission to the lion population, could a multi-host spatial
model account for the patchy pattern of CDV spread seen in lions in 1994 (Fig. 8c)? To
test this hypothesis, a stochastic susceptible-infected-recovered multi-host model was
constructed which allowed transmission between a highly territorial species, like lions,
and 1-2 more gregarious hosts, such as hyaenas and jackals (Craft et al. 2008). Social
structure of each species was explicitly modeled by varying within- and between-group
transmission rates (e.g. isolated vs. well connected territorial structures) while
interspecific transmission with sympatric carnivores occurred at both low and high
rates. According to model results, when other gregarious species were coupled with
lions at low transmissibility, the erratic and discontinuous patterns of CDV spatial
spread were similar to those seen in lions in 1994 (Craft et al. 2008). Based on this
simplified model, it is difficult to identify which carnivore species were likely involved
in repeat transmission into the lion population, but rather that low interspecific contact
rates could have accounted for the high prevalence and erratic spatial spread of CDV
seen in 1994 in the lion population.
The results of both the network and the multi-host models, in combination with
the observational and viral work, suggest that lions are a non-maintenance population
for canine distemper virus, and because lions cannot independently maintain chains of
CDV transmission, CDV control efforts should focus on other carnivores besides lions.
Domestic dogs are a likely maintenance population for CDV, but whether other wild
carnivores are part of this maintenance population remains unknown.
Conclusions
Even within large well-protected areas like the Serengeti, species like lions can be
threatened by infectious disease (Cleaveland et al. 2007). These diseases can originate
from outside the protected area, and outbreaks can be triggered by climatic factors. As
we expect more climatic extremes from global climate change, this could have
20
unexpected effects on disease dynamics in wild animal populations (Munson et al.
2008). Disease dynamics are complex and understanding them requires coordinated and
integrated ecosystem-level approaches (Cleaveland et al. 2008). In order to conserve
free-ranging lions, and wild felids in general, we need to effectively integrate veterinary
epidemiology into carnivore conservation and management, and focus our efforts on
long-term, integrative, cross-species, cross-pathogen research (Cleaveland et al. 2007).
Which management approach should be adopted to protect wild felids from
infectious disease threats? It is logistically infeasible to protect all cats from all
diseases—some diseases are non-pathogenic and resources are limited. For a start, it is
important to understand the potential impacts of disease on long-term population
viability (Driciru et al. 2006). Ironically, this does not necessarily mean the total
elimination of a pathogen from a system. Studies have shown that depending on
reservoir dynamics and resource availability, instead of attempting to eliminate a
disease, prevention of the largest outbreaks that would decrease population numbers
below a viable threshold may be more practical (Vial et al. 2006, Cleaveland et al.
2007). So how do we prioritize which diseases, and in which situations, to focus our
efforts? Maybe we should focus interventions on diseases that are of anthropogenic
origin (i.e. viruses associated with humans and their domestic dogs like rabies, CDV,
and parvovirus) and focus concerted effort on small, fragmented populations that might
not recover from a decline in population size due to disease. Specifically, what lessons
can we learn from the Serengeti Lion Project’s disease studies?
First, studies of disease dynamics in Serengeti lions show that endemic diseases
like gastrointestinal macroparasites, FIV, and FHV can persist in low-density or small
populations, such as the small population of Crater lions and the low-density lions on
the Serengeti plains. On the other hand, epidemic diseases either need a large number of
susceptibles in order to persist (FCV), or the ability to infect a suite of hosts (CDV,
FPV/CPV, FCoV). Ecological studies in Serengeti lions also illustrate that co-infection
can either lessen or increase virulence, as seen with examples from trypanosomes and
CDV/Babesia.
21
Secondly, disease status should be considered in lion relocations, as different
viruses are present in different populations, as seen when comparing the nearby lion
populations of Ngorongoro Crater and Serengeti (Hofmann-Lehmann et al. 1996). In
addition, FIV, FHV, and rarely FCV and FPV/CPV infections can persist in
seropositive hosts and asymptomatic carriers can continue to transmit, or shed, the virus
(Driciru et al. 2006, Gaskell, Dawson & Radford 2006). A translocation could turn into
a conservation disaster if a shedding individual was introduced into a totally susceptible
population.
Finally, we have learned that in the Serengeti some diseases are harder to control
than others. This is likely related to the concept of R0 (the number of secondary
infections produced by one infectious individual in a completely naïve population).
Through the domestic dog vaccination campaign, Hampson has demonstrated that
because the R0 for rabies is surprisingly low (around 1.1-1.2) the elimination of canine
rabies is logistically feasible (Hampson 2007). On the other hand, despite extensive
dog vaccinations, Serengeti lions were still exposed to CDV in 2006 (Munson et al.
2008). If CDV is similar to other morbilliviruses like measles with its high R0 (Lloyd-
Smith et al. 2005), then CDV is more contagious than rabies. If we want to eliminate
CDV to protect lions and other carnivores, we would likely need to increase vaccination
coverage of domestic dogs (and other carnivores?). However, it may be that the total
elimination of CDV from the ecosystem is not practical, and efforts should instead be
placed on protecting small, fragmented populations, like wild dogs, from CDV.
Alternatively, if we wanted to protect an isolated population of lions from excess
mortality from CDV/Babesia co-infection, instead of focusing on the CDV, we could
reduce lion tick load by keeping levels of ticks to a minimum in the ecosystem, as the
Ngorongoro Crater authorities are currently doing with controlled burns (Fyumagwa et
al. 2007).
22
Tables & Figures
Table 1. Prevalence of trypanosome infection in lions as detected by microscopy in
four habitat types of Serengeti and Ngorongoro in order of decreasing occurrence of
tsetse flies (see Fig. 1 for geographic locations) (Adapted from Averbeck et al. 1990).
Lion habitat type Occurrence of
tsetse flies
Prevalence (%) of
Trypanosoma spp.
Serengeti Woodlands Common 50 (26/52)
Serengeti Woodlands/Plains Border Rare 11 (3/28)
Serengeti Plains Absent 7 (2/29)
Ngorongoro Crater Absent 0 (0/10)
23
Table 2. (a) Lion demographics. (b) Contact parameters. (From Craft et al. in prep) Demographic parameters Estimated quantities Distributions A : area of ecosystem 10,000 km2 N/A NP : number of prides in ecosystem
180 U(150,200)
XP : pride sizes (number of females and cubs over three months old)
XP : Gamma k,θ( ) with θ = 4.707 , k = 2.226 Mean pride size = 10.48
θ : N 4.707,1.243( )k : N 2.226, 0.636( )
η : fraction of prides that share territorial males with one other pride
0.882
η : N 0.882, 0.078( )
ς : rate at which territorial male coalitions switch prides 0.25 switches/day ς : N 0.25, 0.070( )
Μadj : territory adjacency model
lnpadj AB( )
1− padj AB( )
⎛
⎝⎜
⎞
⎠⎟ = 1.483 − 0.386 ⋅ SAB
( SAB = the number of prides located in the joint radius of Aand B) Mean number adjacent prides = 7.36
intercept ~ N 1.483, 0.225( )slope ~ N −0.386, 0.041( )
Ψ : proportion of adjacent prides recently split from a common pride
0.063 Ψ ∼ N 0.063,0.021( )
NN : # nomads 180 U(150-200)
XN : nomad group sizes XN : Log-normal μ,σ( ) with μ = 0.292 , σ = 0.446 Mean group size = 1.51
μ ∼ N 0.292,0.065( )σ ∼ N 0.446,0.046( )
Μnomad : nomad movement model Horizontal (x) and vertical (y) displacements per day are given by gamma distributions
Dispx : Gamma x kx ,θx( ) with 0.382xk = 2.85xθ = Disp y : Gamma y ky ,θ y( ) with 0.714yk = 1.743yθ =
kx ∼ N 0.382,0.029( )θx ∼ N 2.85,0.02( )
ky ∼ N 0.714,0.029( )θ y ∼ N 1.743,0.019( )
24
Contact parameters CP : average rate of pride-pride contacts per pride
4.55 contacts/two weeks Cp : N 4.55,0.573( )
Μcontact : contact weighting model
lnwc A,B( )
1− wc A,B( )
⎛
⎝⎜
⎞
⎠⎟ = α + βddt A, B( )+
−βs if recently splitβs otherwise
⎧⎨⎩
wc A , B( ) is the weighting factor for the contact rate between A and B and d
tA, B( ) is the territory distance
between the prides.
α : intercept 3.265 α : N 3.265,0.371( ) βd : network distance coefficient
1.698 βd : N 1.698,0.264( )
βs : recent split coefficients 0.696 βd : N 0.696,0.220( ) CN : average rate of pride-nomad coalition contacts per pride
7.136 contacts/two weeks N 7.136,1.018( )
G : pride group size during contact
′G = log G + 1( )
′G ∼ N μ ′G ,σ ′G( ) with μ ′G = 0.447 + 0.014 ⋅ X P , σ ′G = 0.232 Mean group size = 3.65
μ ′G intercept ∼ N 0.447,0.057( )μ ′G slope ∼ N 0.014,0.004( )
σ ∼ N 0.232,0.022( )
25
40 0 40 80 Kilometers
NMMNR
Woodlands
Plains
N. Crater
SNP
Figure 1. Map of Serengeti National Park (SNP) and the surrounding protected areas in
East Africa, including the Masai Mara National Reserve, Kenya (MMNR) and
Ngorongoro Crater (N. Crater). Lions have been studied continuously inside the
Ngorongoro Crater (black circle) and in the SNP (gray oval) since the 1960s. The
Serengeti study area is divided into two habitat types: woodland in the north, and plains
to the south.
26
Figure 2. Canine distemper virus age-seroprevalence patterns in the Serengeti lion
study population from cross-sectional samples in 1985, 1987, 1991, and 1994. (From
Cleaveland et al. 2007)
27
Year
Sero
prev
alen
ce
Figure 3. Annual seroprevalence rates in the Serengeti for feline herpesvirus for young
lions (dotted line and circles) and for adults (solid lines and squares), with respective
sample sizes (with numbers of immatures listed second, in italics) (From Packer et al.
1999).
28
Figure 4. Annual seroprevalence rates in the Serengeti for (a) coronavirus (b)
parvovirus and (c) calicivirus for young lions (dotted line and circles) and for adults
solid lines and squares) with sample sizes represented as numbers in the graph (From
Packer et al. 1999).
29
Figure 5. Representative seroprevalence curves with sample sizes indicated inside the
graph. (a) Seroprevalence data for parvovirus is plotted according to year of birth for
lions sampled between 1984 and 1991. Prevalence +/- 4 years of 1985 varied
significantly. (b) For lions sampled between 1984 and 1988, coronavirus prevalence
varies significantly for animals born +/- 4 years of 1984. (c) Seroprevalence for
calicivirus for lions sampled between 1991 and 1994. Prevalence varies significantly for
Animals born within +/- 4 years of 1990 (From Packer et al. 1999).
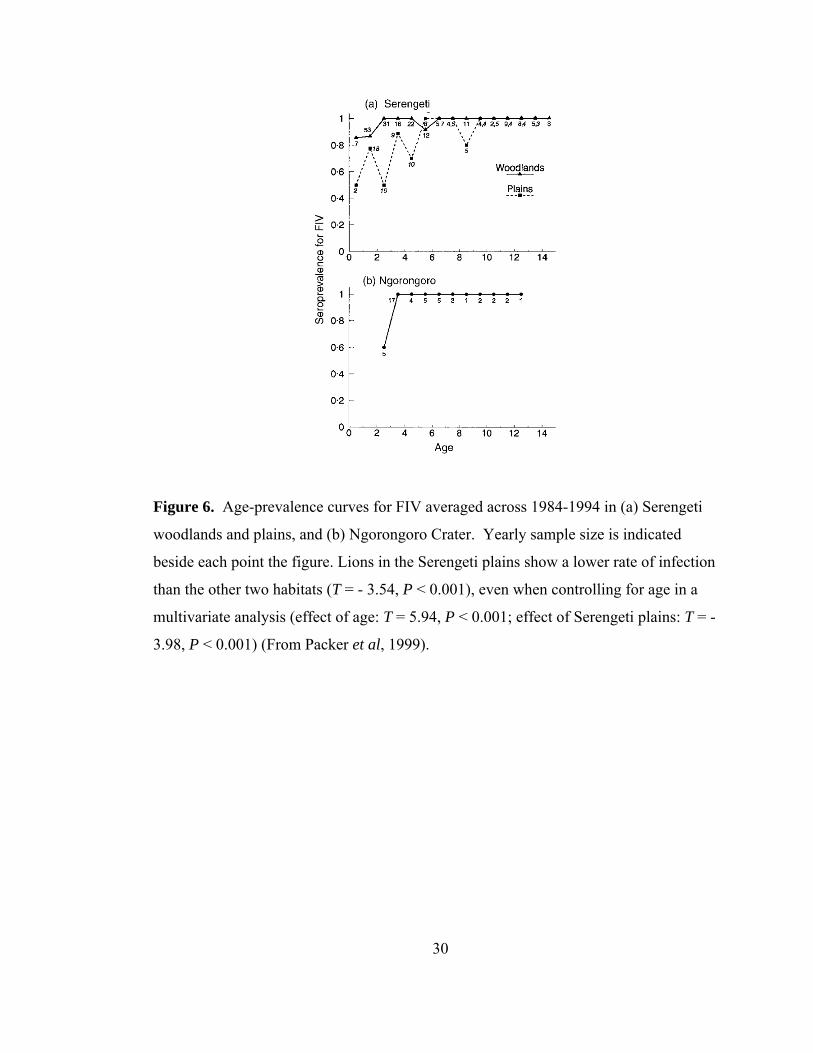
30
Figure 6. Age-prevalence curves for FIV averaged across 1984-1994 in (a) Serengeti
woodlands and plains, and (b) Ngorongoro Crater. Yearly sample size is indicated
beside each point the figure. Lions in the Serengeti plains show a lower rate of infection
than the other two habitats (T = - 3.54, P < 0.001), even when controlling for age in a
multivariate analysis (effect of age: T = 5.94, P < 0.001; effect of Serengeti plains: T = -
3.98, P < 0.001) (From Packer et al, 1999).
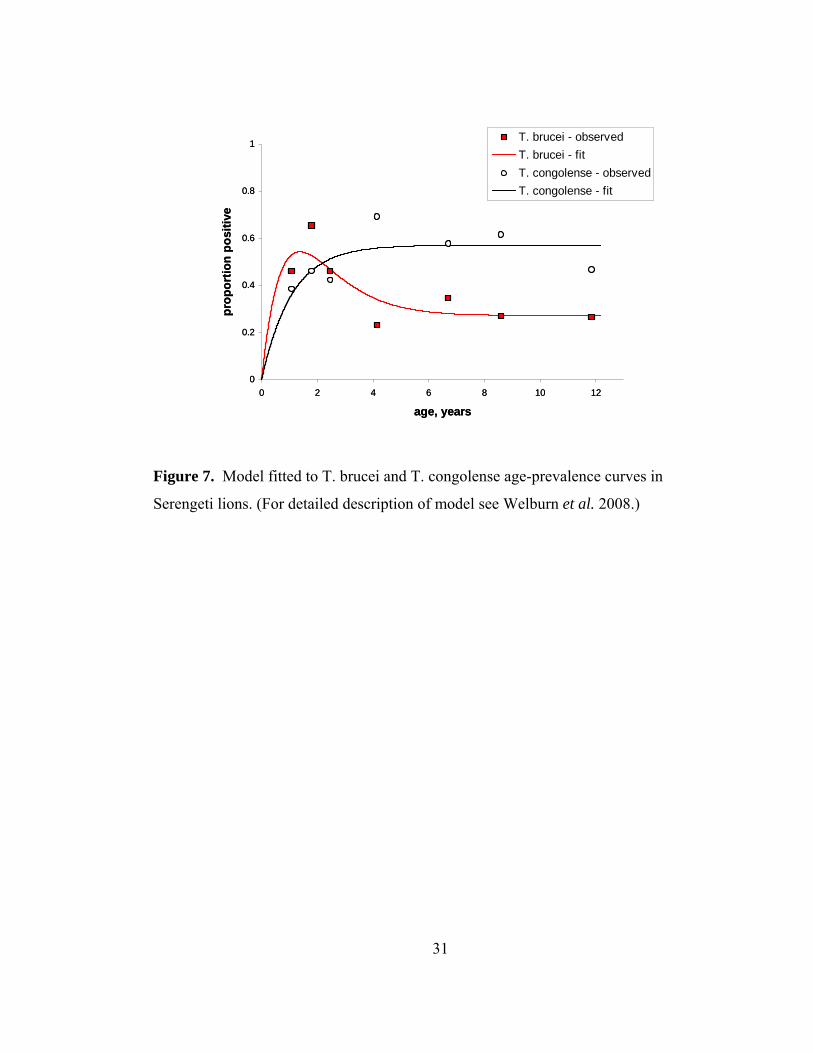
31
0
0.2
0.4
0.6
0.8
1
0 2 4 6 8 10 12
age, years
prop
ortio
n po
sitiv
e
T. brucei - observedT. brucei - fitT. congolense - observedT. congolense - fit
(A)
0
0.2
0.4
0.6
0.8
1
0 2 4 6 8 10 12
age, years
prop
ortio
n po
sitiv
e
T. brucei - observedT. brucei - fitT. congolense - observedT. congolense - fit
(A)
Figure 7. Model fitted to T. brucei and T. congolense age-prevalence curves in
Serengeti lions. (For detailed description of model see Welburn et al. 2008.)
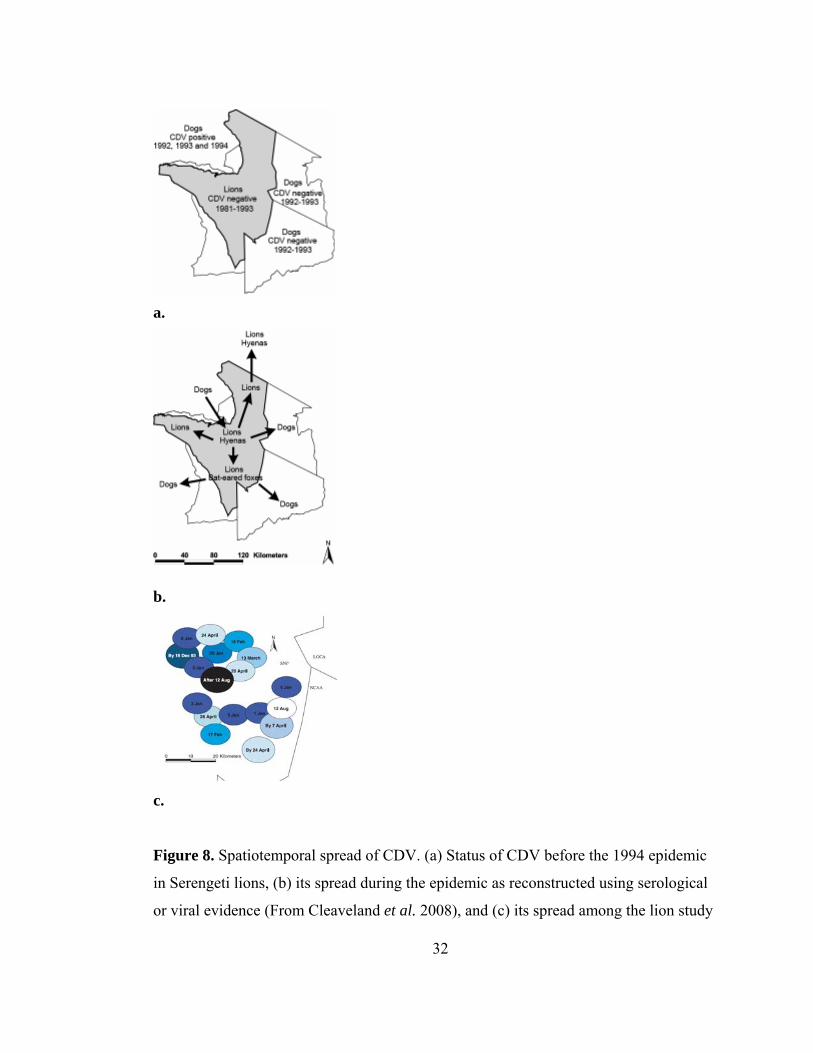
32
a.
b.
c.
Figure 8. Spatiotemporal spread of CDV. (a) Status of CDV before the 1994 epidemic
in Serengeti lions, (b) its spread during the epidemic as reconstructed using serological
or viral evidence (From Cleaveland et al. 2008), and (c) its spread among the lion study

33
population. Each oval represents a lion pride. The time course was determined by either
the date of first observed death in a pride or date of sampling for the first seropositive
individual in the pride. Prides infected early in the epidemic are colored dark, those
infected in the epidemic grade through to white. One pride remained uninfected (black)
(From Craft et al. 2008).
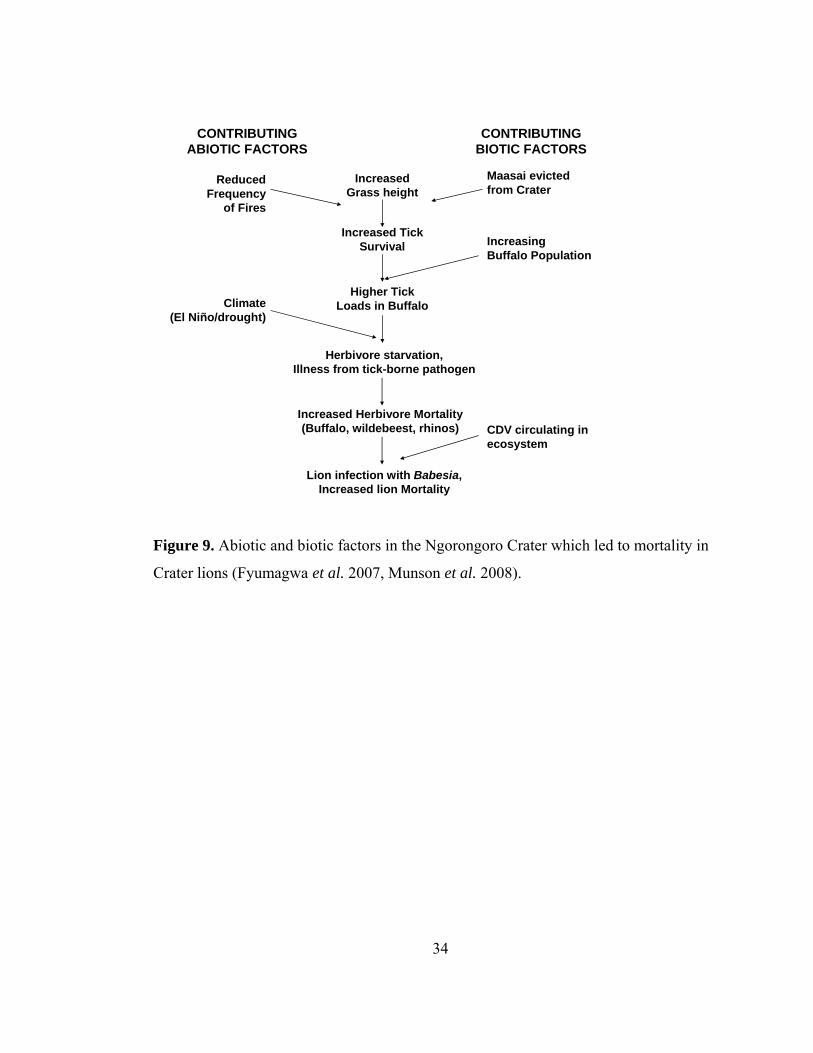
34
CONTRIBUTINGABIOTIC FACTORS
CONTRIBUTINGBIOTIC FACTORS
Reduced Frequency
of Fires
Maasai evicted from Crater
Climate (El Niño/drought)
Increased Grass height
IncreasingBuffalo Population
Increased Tick Survival
Higher Tick Loads in Buffalo
Increased Herbivore Mortality(Buffalo, wildebeest, rhinos)
Lion infection with Babesia, Increased lion Mortality
Herbivore starvation, Illness from tick-borne pathogen
CDV circulating in ecosystem
Figure 9. Abiotic and biotic factors in the Ngorongoro Crater which led to mortality in
Crater lions (Fyumagwa et al. 2007, Munson et al. 2008).
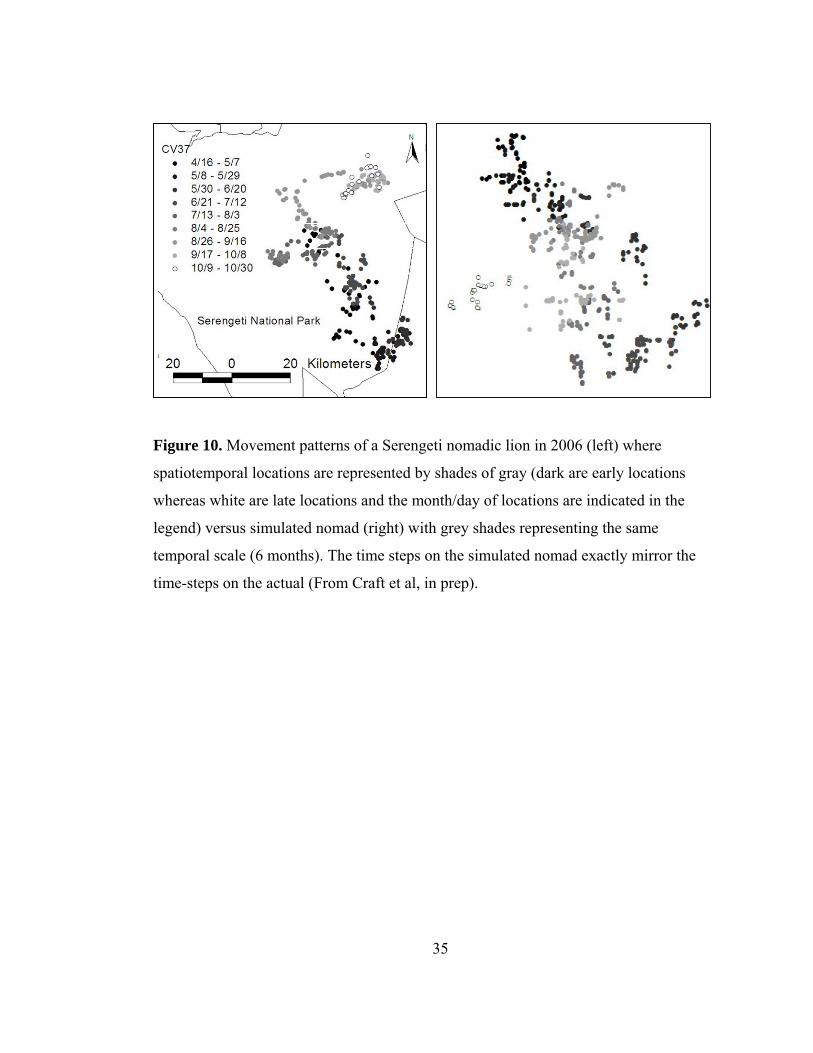
35
Figure 10. Movement patterns of a Serengeti nomadic lion in 2006 (left) where
spatiotemporal locations are represented by shades of gray (dark are early locations
whereas white are late locations and the month/day of locations are indicated in the
legend) versus simulated nomad (right) with grey shades representing the same
temporal scale (6 months). The time steps on the simulated nomad exactly mirror the
time-steps on the actual (From Craft et al, in prep).
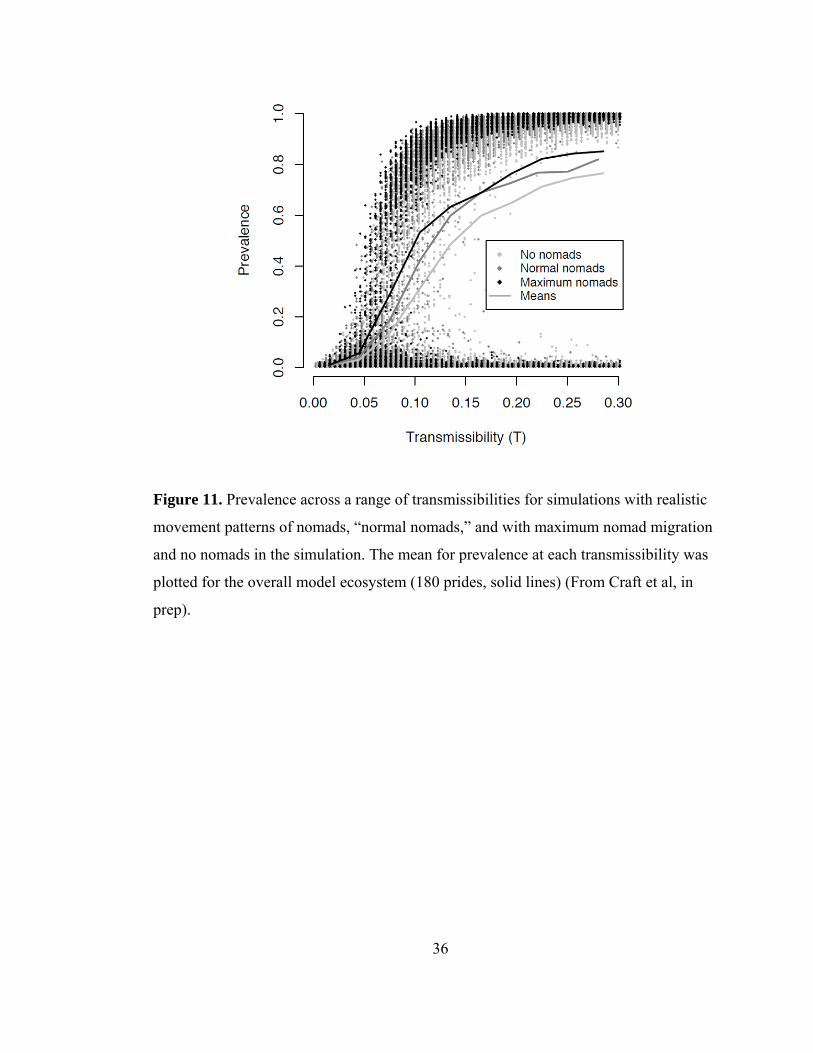
36
Figure 11. Prevalence across a range of transmissibilities for simulations with realistic
movement patterns of nomads, “normal nomads,” and with maximum nomad migration
and no nomads in the simulation. The mean for prevalence at each transmissibility was
plotted for the overall model ecosystem (180 prides, solid lines) (From Craft et al, in
prep).
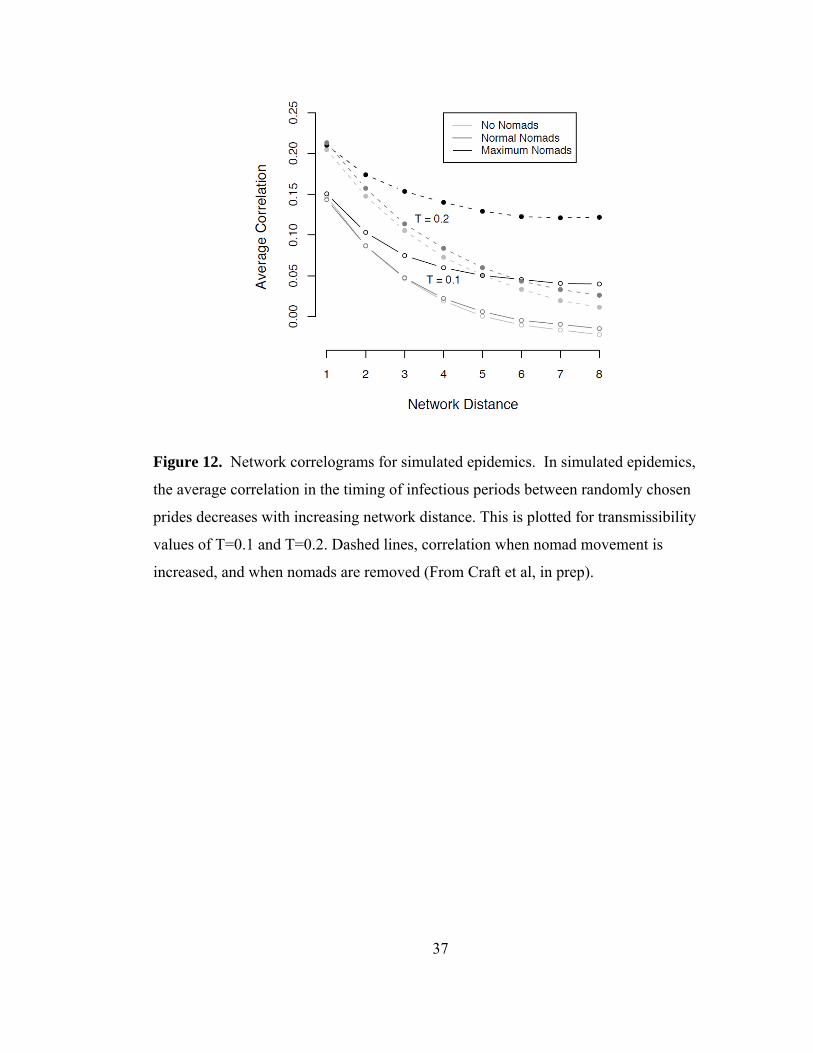
37
Figure 12. Network correlograms for simulated epidemics. In simulated epidemics,
the average correlation in the timing of infectious periods between randomly chosen
prides decreases with increasing network distance. This is plotted for transmissibility
values of T=0.1 and T=0.2. Dashed lines, correlation when nomad movement is
increased, and when nomads are removed (From Craft et al, in prep).
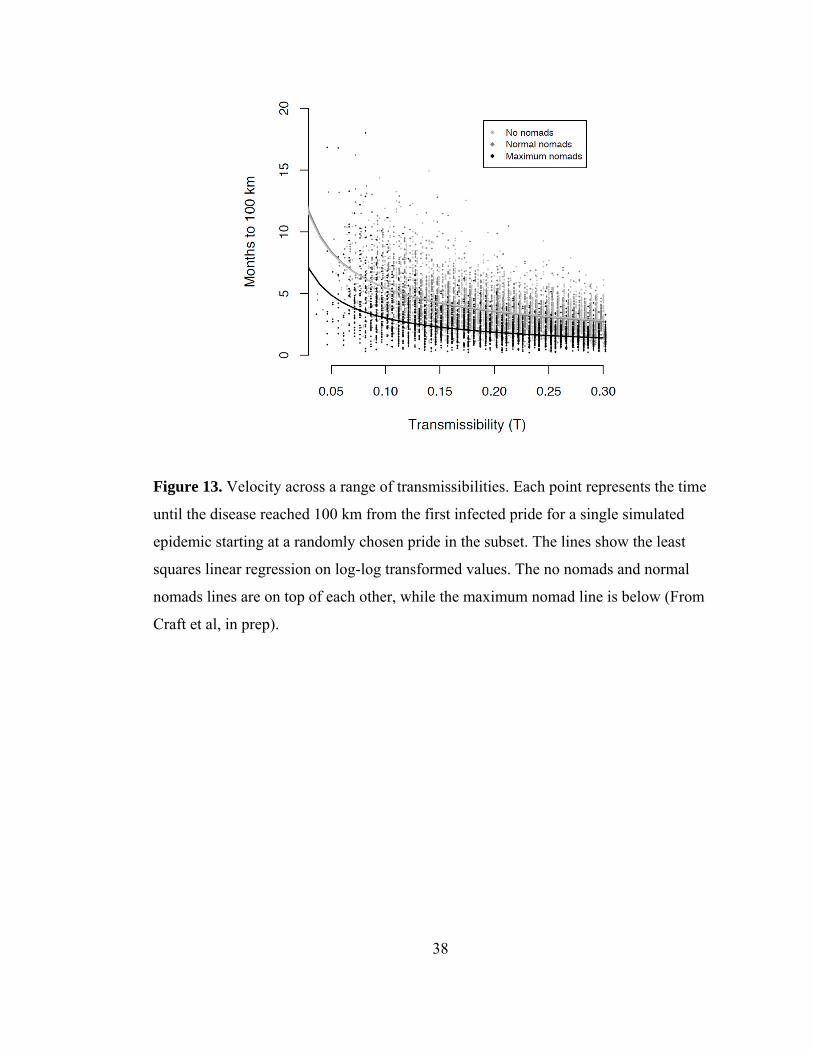
38
Figure 13. Velocity across a range of transmissibilities. Each point represents the time
until the disease reached 100 km from the first infected pride for a single simulated
epidemic starting at a randomly chosen pride in the subset. The lines show the least
squares linear regression on log-log transformed values. The no nomads and normal
nomads lines are on top of each other, while the maximum nomad line is below (From
Craft et al, in prep).
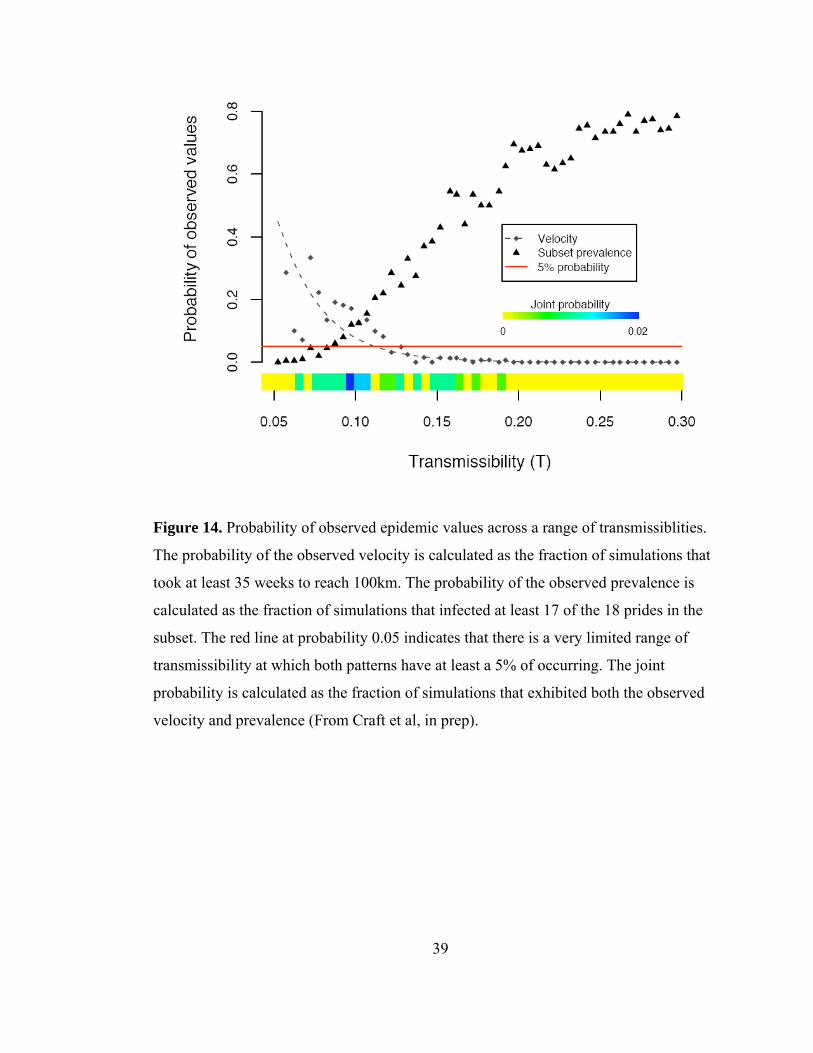
39
Figure 14. Probability of observed epidemic values across a range of transmissiblities.
The probability of the observed velocity is calculated as the fraction of simulations that
took at least 35 weeks to reach 100km. The probability of the observed prevalence is
calculated as the fraction of simulations that infected at least 17 of the 18 prides in the
subset. The red line at probability 0.05 indicates that there is a very limited range of
transmissibility at which both patterns have at least a 5% of occurring. The joint
probability is calculated as the fraction of simulations that exhibited both the observed
velocity and prevalence (From Craft et al, in prep).
40
CHAPTER 2
Networks and nomads: Epidemiological structure and disease dynamics of a lion
population†
Abstract
We estimated the epidemiological network structure of an African lion population using
long-term data from the Serengeti Lion Project. We found that the lion population is a
mix of local pride-to-pride contacts (driven by territory adjacencies) and transient
nomad-to-pride contacts (driven by gamma variance process). When we introduced
canine distemper virus (CDV) into the network, emulating a fatal 1994 outbreak, we
found that although nomads are numerous, travel long distances, and are likely
candidates to be considered “superconnectors” (connecting distant parts of a network),
their impacts on CDV disease dynamics were surprisingly low. In our model, the
inclusion of nomads slightly increased disease prevalence, but did not influence the
velocity (rate of spread) or the pattern of spatial spread (correlations across distance).
However, when the nomad movement rate increased, it changed disease dynamics by
(a) increasing prevalence, (b) changing the spatial spread of the disease, and (c)
increasing velocity. For diseases with relatively short infectious periods, like CDV,
transients only slightly increase the already dense local pride-pride contact patterns and
thus do not play pivotal epidemiological roles.
† With: Erik Volz (Department of Integrative Biology, UT Austin), Craig Packer, and Lauren Ancel Meyers (Department of Integrative Biology, University of Texas, Austin).
41
Introduction
Canine distemper virus (CDV) swept through the Serengeti ecosystem in 1993-4, killing
one-third of the well-studied lion population (Roelke-Parker et al. 1996). The virus was
first detected in the Serengeti Lion Project’s study population in December 1993
(Roelke-Parker et al. 1996), concurrent with the yearly arrival of migratory herds and
associated nomadic lions (Maddock 1979). These non-residential nomadic lions wander
great distances through the ecosystem following the seasonal migratory herds of
wildebeest, zebra, and gazelle, which is in contrast to the majority of lions that live in
territorial prides (Schaller 1972). Nomadic lions were suspected to be responsible for
the introduction of CDV into the study population in 1993 and for long-range jumps of
disease during the epidemic (Roelke-Parker et al. 1996).
Nomadic lions could be considered a variation of a “superspreader:” a
“superconnector.” Superspreaders are a small fraction of a population who are
responsible for most transmission events through excessive contacts (Lloyd-Smith et al.
2005); supershedders typically infect more individuals than others through excessive
shedding of a pathogen; and we propose that superconnectors connect distant parts of a
network through their long-range movements, increasing the extent of a disease
outbreak. Network models capture these types of heterogeneous contacts and reveal the
underlying population structure and contact patterns among individuals in the
population.
Despite the importance of host heterogeneity for human disease transmission,
relatively little is known about the epidemiological structure of wildlife populations
(Krause, Croft & James 2007, Wey et al. 2008), and hence the individuals, or groups of
individuals, that are responsible for most transmissions. Unfortunately, contact patterns
are exceptionally difficult to measure in wildlife populations, and only a few free-
ranging wildlife study systems are data-rich enough to provide empirical information to
parameterize a network model (Cross, Lloyd-Smith & Getz 2005).
In this paper we characterize the epidemiological network structure of an
African lion population using detailed data from the Serengeti Lion Project. Serengeti
lions (Panthera leo) have been studied continuously since the 1960’s; information
42
exists on individual ranging patterns, relatedness, and birthdates (normally accurate to 1
month). Contact patterns with conspecifics and other species can also be inferred. We
build a network model of the lion population from the time period immediately before
the 1994 CDV epidemic. To test the hypothesis that nomads have the potential to act as
superconnectors, seeding new parts of the pride-pride network via long-range
movements, we introduce CDV into the network model and investigate how the
presence of nomads affects disease spread among Serengeti lions by (1) removing
nomads from the network and (2) increasing the nomad movement rate.
Materials & methods
Lions live in gregarious groups (prides) composed of 1 to 21 related females, their
dependent offspring, and a residential coalition of 1-9 males. Prides are territorial and
infrequently contact their neighbors (Packer, Lewis & Pusey 1992); inter-pride
encounters can be deadly (Schaller 1972, McComb et al. 1993, Grinnell, Packer &
Pusey 1995). When prides grow too large, young females split off and form a
neighboring pride (Pusey & Packer 1987) and are more tolerant of their non-pride
relatives (VanderWaal, Mosser & Packer in press). Coalitions of males can be resident
in more than one pride (Bygott, Bertram & Hanby 1979) and distribute their time
between their various prides (Schaller 1972). In contrast, nomads are lions that do not
maintain a territory and move great distances though the ecosystem (Schaller 1972).
Lions from these three different social groups occasionally interact during mating,
territorial defense, and at kills. Intuitively, nomads can be seen as long-distance disease
dispersers while shared males can be viewed as increasing the level of disease
transmission between neighboring prides.
Estimating Lion Population Structure
To estimate pride demographic structure and contact patterns prior to the 1994 CDV
outbreak, we analyzed two datasets from the Serengeti Lion Project’s 42 years of
observations. The first recorded all lion sightings from October 1985 - December 1987,
totaling 12,121 individual lion sightings. These records included time, location and
43
names of all lions observed, and descriptions of any interactive behavior among the
lions. We analyzed data from 1985-1987 because of a contemporary dataset gathered
during 35 four-day continuous follows of pride females (Packer, Scheel & Pusey 1990,
Scheel & Packer 1991). Secondly, the demographic dataset described all lions in the
study area on December 31, 1992, the last date of two-year average territory locations
unaffected by the CDV die-off (Mosser 2008). We used the 1992 data for estimating the
demographics prior to the 1994 CDV epidemic, and the 1985-1987 data for estimating
all other parameters.
For most model parameters (Table 1), we characterized the entire distribution of
values rather than single summary statistics. Unless otherwise specified, we used
maximum likelihood estimation (MLE) to fit the parameters for seven candidate
distributions (Poisson, exponential, normal, log-normal, pure power law, truncated
power law, gamma), and then applied the Akaike Information Criterion (AIC) to select
the most appropriate distribution.
Demographics and spatial distribution of prides
Prior to the 1994 outbreak, 25 prides lived in the study area. Pride sizes were calculated
as the number of females and cubs over 3 months old; pride sizes averaged 10.5
individuals and the distribution was best fit by a gamma distribution (Table 1: XP , Fig.
1a). We extrapolated the densities of lions found in the study area to an area of the
ecosystem with similar habitat and expected densities (Table 1: A = 10,000 km2 ) and
estimated NP = 180 prides in the ecosystem. We defined the territory of a pride as its
estimated 70% kernel over a two-year period (Mosser 2008), estimated the distance
between prides using Euclidean distances between territory centroids (conceptual center
of mass, or the center of an irregular territory), and considered two prides to be adjacent
if their territories overlapped, touched, or were not separated by another pride territory
(Fig. 2a). To determine the probability of two prides being classified as adjacent,
logistic regression analysis yielded the following model (Fisher’s exact test; p = 0.1184)
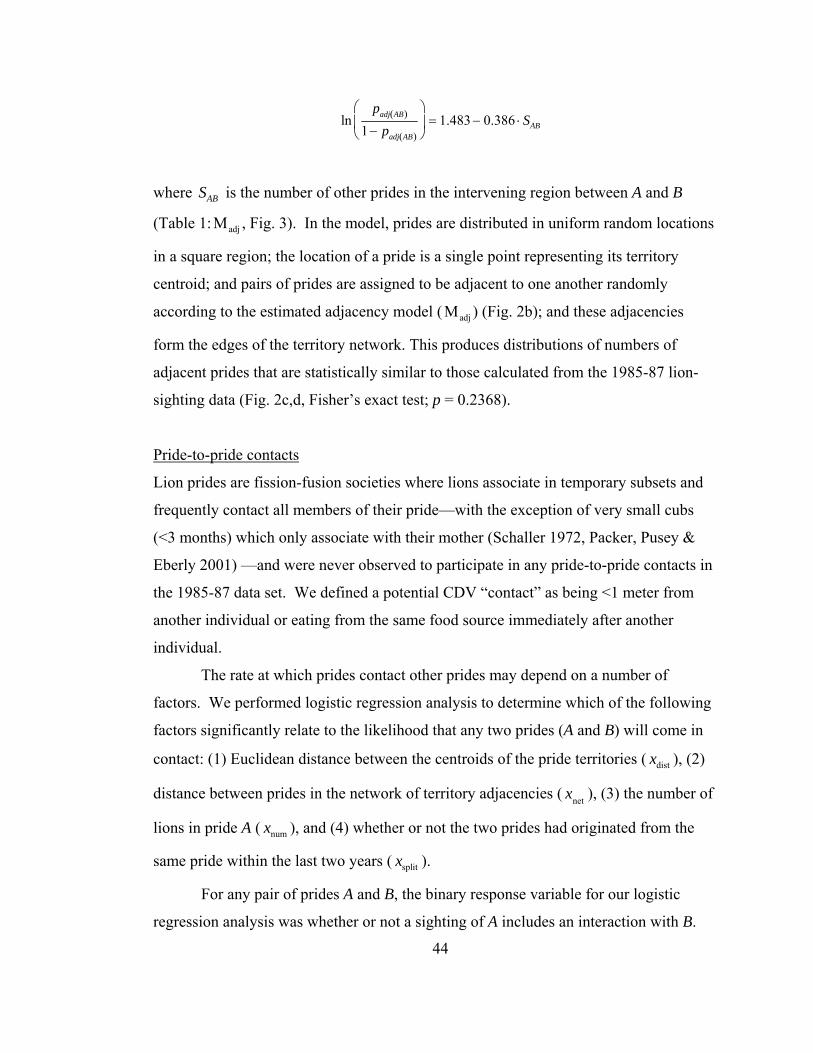
44
lnpadj AB( )
1− padj AB( )
⎛
⎝⎜
⎞
⎠⎟ = 1.483 − 0.386 ⋅ SAB
where SAB is the number of other prides in the intervening region between A and B
(Table 1: Μadj , Fig. 3). In the model, prides are distributed in uniform random locations
in a square region; the location of a pride is a single point representing its territory
centroid; and pairs of prides are assigned to be adjacent to one another randomly
according to the estimated adjacency model ( Μadj ) (Fig. 2b); and these adjacencies
form the edges of the territory network. This produces distributions of numbers of
adjacent prides that are statistically similar to those calculated from the 1985-87 lion-
sighting data (Fig. 2c,d, Fisher’s exact test; p = 0.2368).
Pride-to-pride contacts
Lion prides are fission-fusion societies where lions associate in temporary subsets and
frequently contact all members of their pride—with the exception of very small cubs
(<3 months) which only associate with their mother (Schaller 1972, Packer, Pusey &
Eberly 2001) —and were never observed to participate in any pride-to-pride contacts in
the 1985-87 data set. We defined a potential CDV “contact” as being <1 meter from
another individual or eating from the same food source immediately after another
individual.
The rate at which prides contact other prides may depend on a number of
factors. We performed logistic regression analysis to determine which of the following
factors significantly relate to the likelihood that any two prides (A and B) will come in
contact: (1) Euclidean distance between the centroids of the pride territories ( distx ), (2)
distance between prides in the network of territory adjacencies ( xnet ), (3) the number of
lions in pride A ( numx ), and (4) whether or not the two prides had originated from the
same pride within the last two years ( splitx ).
For any pair of prides A and B, the binary response variable for our logistic
regression analysis was whether or not a sighting of A includes an interaction with B.
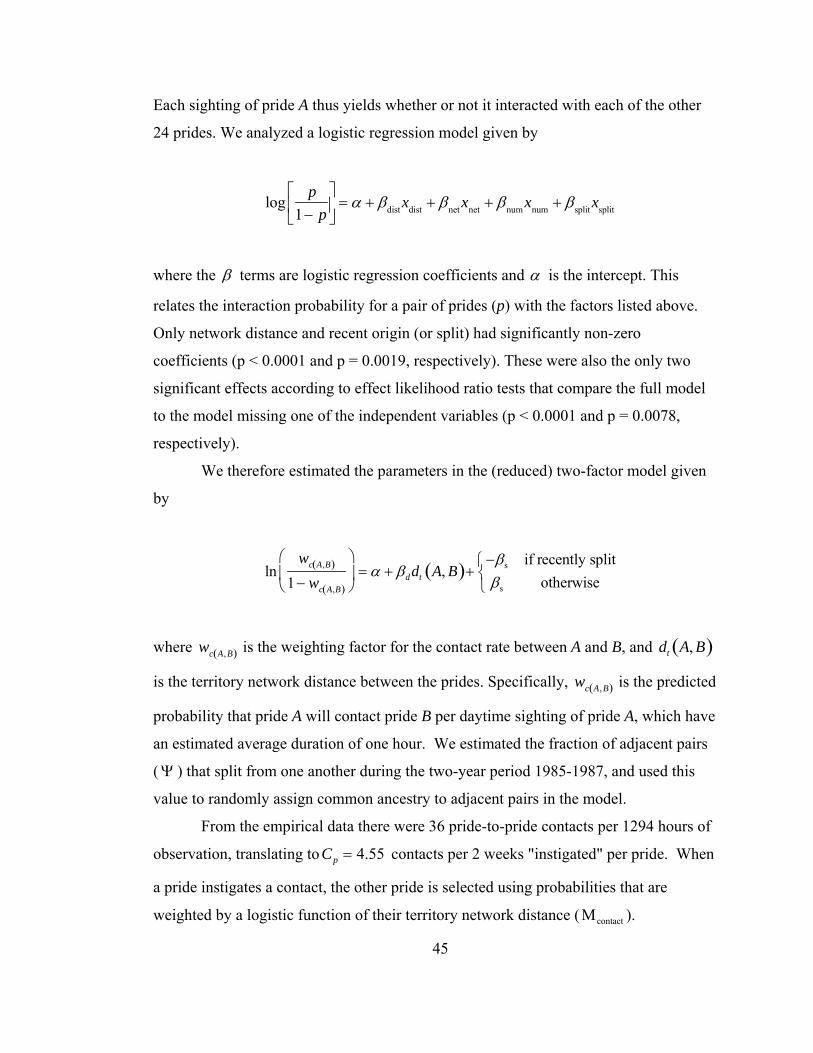
45
Each sighting of pride A thus yields whether or not it interacted with each of the other
24 prides. We analyzed a logistic regression model given by
log
p1− p
⎡
⎣⎢
⎤
⎦⎥ = α + βdist xdist + βnet xnet + βnum xnum + βsplit xsplit
where the β terms are logistic regression coefficients and α is the intercept. This
relates the interaction probability for a pair of prides (p) with the factors listed above.
Only network distance and recent origin (or split) had significantly non-zero
coefficients (p < 0.0001 and p = 0.0019, respectively). These were also the only two
significant effects according to effect likelihood ratio tests that compare the full model
to the model missing one of the independent variables (p < 0.0001 and p = 0.0078,
respectively).
We therefore estimated the parameters in the (reduced) two-factor model given
by
lnwc A,B( )
1 − wc A,B( )
⎛
⎝⎜
⎞
⎠⎟ = α + βddt A, B( )+
−βs if recently splitβs otherwise
⎧⎨⎩
where wc A,B( ) is the weighting factor for the contact rate between A and B, and dt A, B( )
is the territory network distance between the prides. Specifically, wc A,B( ) is the predicted
probability that pride A will contact pride B per daytime sighting of pride A, which have
an estimated average duration of one hour. We estimated the fraction of adjacent pairs
( Ψ ) that split from one another during the two-year period 1985-1987, and used this
value to randomly assign common ancestry to adjacent pairs in the model.
From the empirical data there were 36 pride-to-pride contacts per 1294 hours of
observation, translating to Cp = 4.55 contacts per 2 weeks "instigated" per pride. When
a pride instigates a contact, the other pride is selected using probabilities that are
weighted by a logistic function of their territory network distance ( Μcontact ).

46
We used data from a four-day continuous follow study of individual lionesses
(Packer, Scheel & Pusey 1990, Scheel & Packer 1991) to ask whether day- and night-
contact rates might differ. When we extracted interpride contact rates from the focal
follow data set, we were unable to reject the hypothesis that night and day contact rates
for individual lionesses were identical (directional Wilcoxon Sign-Rank, p = 0.109).
We also used the focal follow data to make an independent estimate of average pride-to-
pride contact rates. For each of the focal lionesses, we calculated the per hour rate of
contacts with lions from other prides (mean = 0.0044 ± 0.0035). To compute a
comparable quantity from the lion-sighting data used in our model, we assumed that all
pride lions had an equal probability of participating in any given contact with another
pride. For each pride we calculated the following estimate of the per lion contact rate:
average lions per contact number of inter-pride contactsnumber of lions in pride hour
⋅ .
Averaging over all prides, we calculated an average rate of 0.0059 ± 0.00329, consistent
with the focal-follow data.
Any given inter-pride contact will involve one or more lions from each pride. A
simple linear regression analysis suggested that contact group sizes depended
significantly on pride sizes ( 0.0048p = ). To correct for increasing variance in group
size with increasing pride size, we transformed group size by ( )log 1G G′ = + . To model
contact group sizes for any given pride of size N, we then sample from a normal
distribution with mean given by the resulting regression equation,
0.447 0.014G Nμ ′ = + ⋅ , and standard deviation given by the standard deviation of
the (normally-distributed) residuals,σ ′G = 0.232 (Fig. 4). The average number of
pride lions participating in inter-pride interactions (G ) is 3.65.
Territorial males
Territorial males live in coalitions that associate with one or more prides. In 1991-1992,
88.2% of territorial coalitions associated with a single pride and the remaining 11.8%
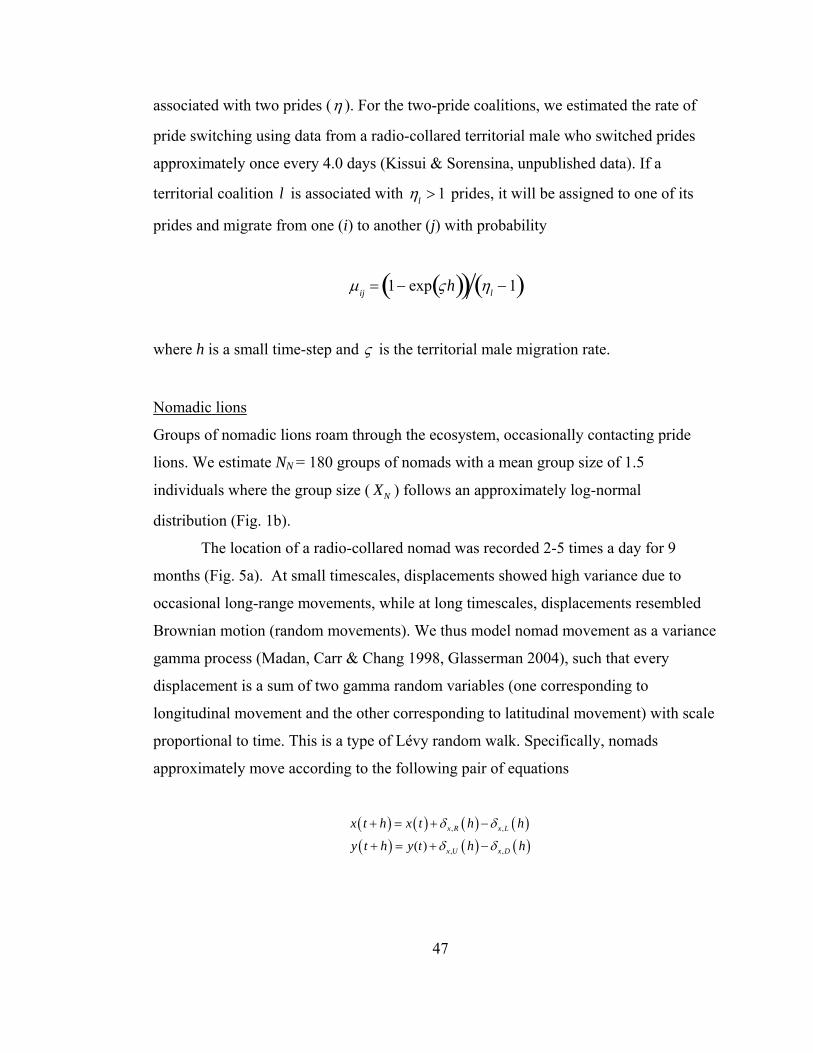
47
associated with two prides (η ). For the two-pride coalitions, we estimated the rate of
pride switching using data from a radio-collared territorial male who switched prides
approximately once every 4.0 days (Kissui & Sorensina, unpublished data). If a
territorial coalition l is associated with ηl > 1 prides, it will be assigned to one of its
prides and migrate from one (i) to another (j) with probability
μij = 1− exp ςh( )( ) ηl − 1( )
where h is a small time-step and ς is the territorial male migration rate.
Nomadic lions
Groups of nomadic lions roam through the ecosystem, occasionally contacting pride
lions. We estimate NN = 180 groups of nomads with a mean group size of 1.5
individuals where the group size ( XN ) follows an approximately log-normal
distribution (Fig. 1b).
The location of a radio-collared nomad was recorded 2-5 times a day for 9
months (Fig. 5a). At small timescales, displacements showed high variance due to
occasional long-range movements, while at long timescales, displacements resembled
Brownian motion (random movements). We thus model nomad movement as a variance
gamma process (Madan, Carr & Chang 1998, Glasserman 2004), such that every
displacement is a sum of two gamma random variables (one corresponding to
longitudinal movement and the other corresponding to latitudinal movement) with scale
proportional to time. This is a type of Lévy random walk. Specifically, nomads
approximately move according to the following pair of equations
( ) ( ) ( ) ( )( ) ( ) ( )
, ,
, ,( )x R x L
x U x D
x t h x t h h
y t h y t h h
δ δ
δ δ
+ = + −
+ = + −
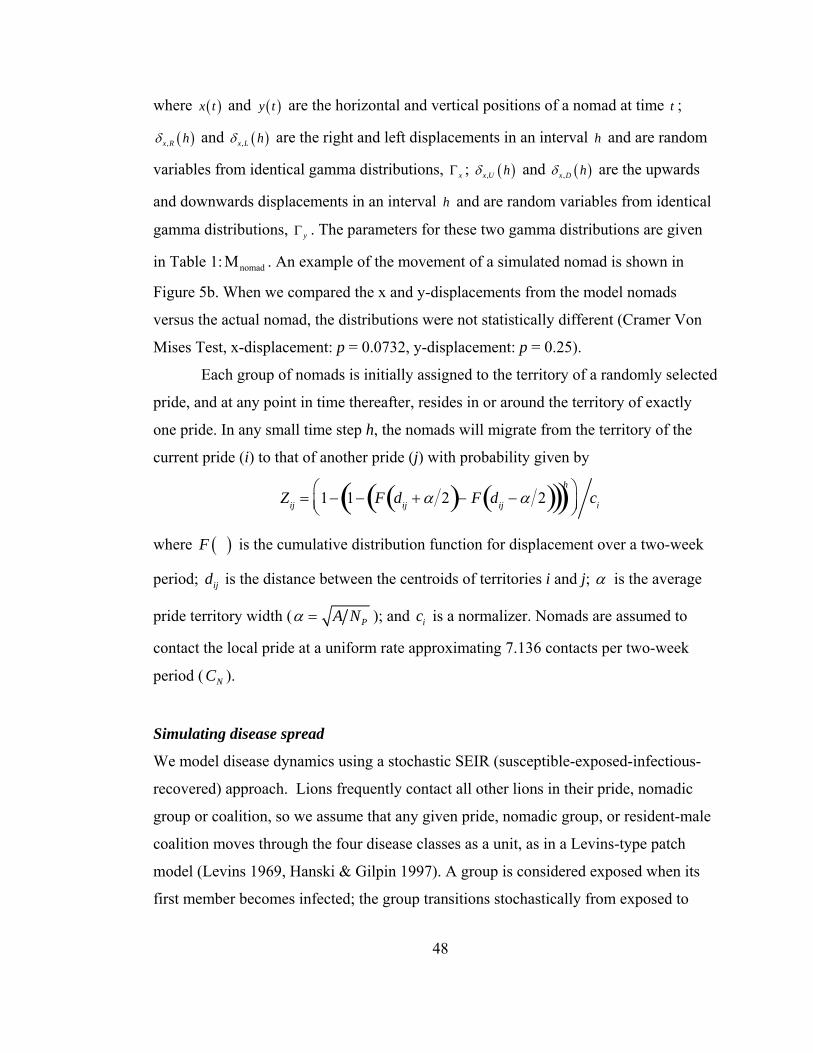
48
where ( )x t and ( )y t are the horizontal and vertical positions of a nomad at time t ;
( ),x R hδ and ( ),x L hδ are the right and left displacements in an interval h and are random
variables from identical gamma distributions, xΓ ; ( ),x U hδ and ( ),x D hδ are the upwards
and downwards displacements in an interval h and are random variables from identical
gamma distributions, yΓ . The parameters for these two gamma distributions are given
in Table 1: Μnomad . An example of the movement of a simulated nomad is shown in
Figure 5b. When we compared the x and y-displacements from the model nomads
versus the actual nomad, the distributions were not statistically different (Cramer Von
Mises Test, x-displacement: p = 0.0732, y-displacement: p = 0.25).
Each group of nomads is initially assigned to the territory of a randomly selected
pride, and at any point in time thereafter, resides in or around the territory of exactly
one pride. In any small time step h, the nomads will migrate from the territory of the
current pride (i) to that of another pride (j) with probability given by
Zij = 1− 1− F dij + α 2( )− F dij − α 2( )( )( )h⎛
⎝⎜⎞⎠⎟
ci
where ( )F is the cumulative distribution function for displacement over a two-week
period; ijd is the distance between the centroids of territories i and j; α is the average
pride territory width (α = A NP ); and ic is a normalizer. Nomads are assumed to
contact the local pride at a uniform rate approximating 7.136 contacts per two-week
period ( CN ).
Simulating disease spread
We model disease dynamics using a stochastic SEIR (susceptible-exposed-infectious-
recovered) approach. Lions frequently contact all other lions in their pride, nomadic
group or coalition, so we assume that any given pride, nomadic group, or resident-male
coalition moves through the four disease classes as a unit, as in a Levins-type patch
model (Levins 1969, Hanski & Gilpin 1997). A group is considered exposed when its
first member becomes infected; the group transitions stochastically from exposed to
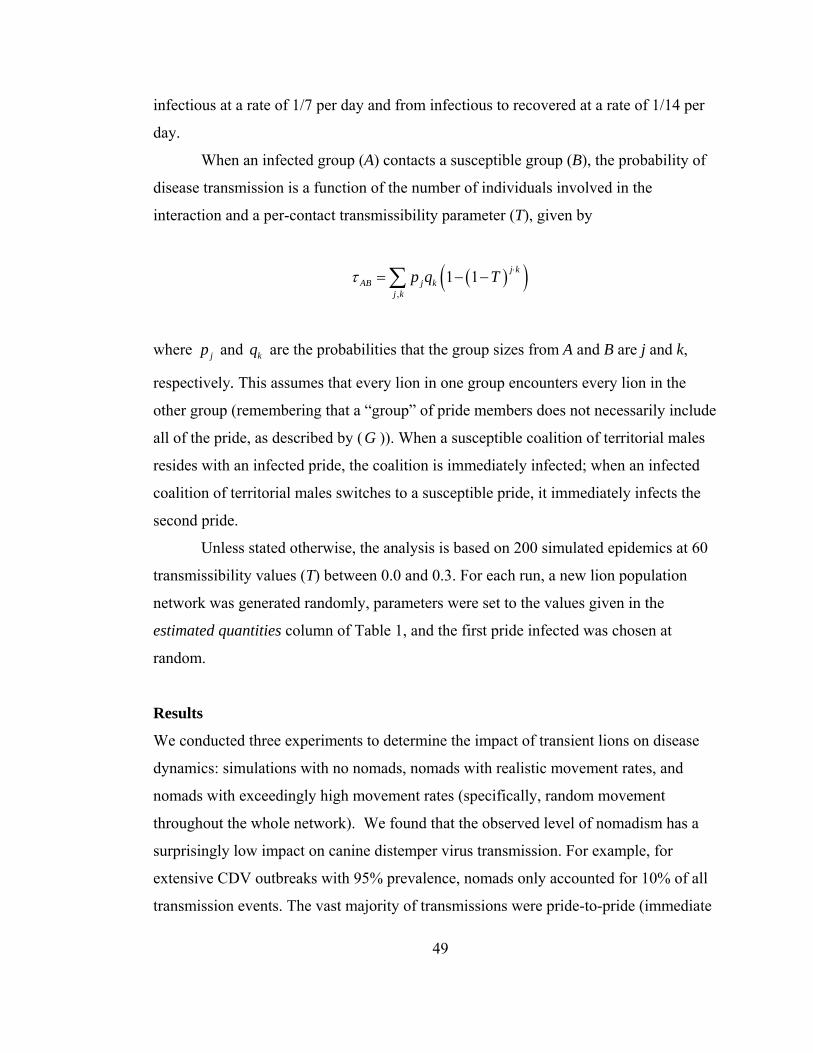
49
infectious at a rate of 1/7 per day and from infectious to recovered at a rate of 1/14 per
day.
When an infected group (A) contacts a susceptible group (B), the probability of
disease transmission is a function of the number of individuals involved in the
interaction and a per-contact transmissibility parameter (T), given by
( )( ),
1 1 j kAB j k
j kp q Tτ ⋅= − −∑
where jp and kq are the probabilities that the group sizes from A and B are j and k,
respectively. This assumes that every lion in one group encounters every lion in the
other group (remembering that a “group” of pride members does not necessarily include
all of the pride, as described by (G )). When a susceptible coalition of territorial males
resides with an infected pride, the coalition is immediately infected; when an infected
coalition of territorial males switches to a susceptible pride, it immediately infects the
second pride.
Unless stated otherwise, the analysis is based on 200 simulated epidemics at 60
transmissibility values (T) between 0.0 and 0.3. For each run, a new lion population
network was generated randomly, parameters were set to the values given in the
estimated quantities column of Table 1, and the first pride infected was chosen at
random.
Results
We conducted three experiments to determine the impact of transient lions on disease
dynamics: simulations with no nomads, nomads with realistic movement rates, and
nomads with exceedingly high movement rates (specifically, random movement
throughout the whole network). We found that the observed level of nomadism has a
surprisingly low impact on canine distemper virus transmission. For example, for
extensive CDV outbreaks with 95% prevalence, nomads only accounted for 10% of all
transmission events. The vast majority of transmissions were pride-to-pride (immediate
50
neighbors, 53.1%; second degree neighbors, 27.8%, and third degree neighbors 8.3%),
while less than 1% of transmissions were due to more distant pride-pride transmission
and shared males. The same trends were observed for outbreaks where only 50% of
prides were infected (Fig. 6). In contrast, when nomad movement rate was at a
maximum, nomads were responsible for 20.2% of transmission events in large-scale
outbreaks (Fig. 6).
We then examined the prevalence of CDV across a full range of
transmissibilities. In general, as CDV transmissibility increased, so did overall
prevalence; the pattern was bimodal with most simulations infecting few prides at low
transmissibilities (T < 0.10), while most prides were infected at larger transmissibilities
(T > 0.10). Accelerating the movement rate of nomads only slightly increased mean
CDV prevalence whereas removing nomads from the simulations slightly decreased
mean prevalence among prides (Fig. 7). These trends were consistent across all values
of T.
Because the spatial spread of CDV was driven by neighbor-to-neighbor pride
transmission, the pattern of spatial spread of CDV was highly correlated at close
network distances, and less correlated at farther distances, manifesting in a wave-like
spread (Fig. 8). Spatial spread was consistently higher correlated at larger
transmissibilities (T=0.20 vs. T = 0.10). Nomads did not drive the dynamics of spatial
spread, which remained essentially unchanged when we removed nomads from the
“normal” simulations. However, increasing the nomad movement rate increased the
correlation at longer network distances with more prides getting infected at roughly the
same time across further distances.
CDV traveled faster at higher transmissibilities than at lower transmissibilities.
Because there was no difference in the velocity of the epidemic when nomads were
removed from the simulations, nomads were again unlikely to have driven the spatial
spread (Fig. 9).
51
Discussion
The Serengeti lion population is a mix of a static pride-to-pride contacts and transient
nomad-to-pride contacts. We developed innovative techniques in our network model,
specifically constructing: (1) a statistical model for determining whether two prides are
"adjacent" as a function of the geometric organization of the entire population, (2) a
statistical model for contact rates between two prides as a function of distance within
the spatial adjacency networks, also accounting for recently split prides and shared
males, (3) a simulated population with variable pride and group sizes, and (4) a pattern
of nomad movement as a type of Lévy process (gamma variance model), which
produced large jumps over short time-scales, but a relatively homogeneous distribution
of jumps over longer time-scales.
Because nomads are numerous, travel long distances, and are likely
superconnectors, we were surprised to find that nomads moving at realistic rates have a
low impact on canine distemper virus dynamics. However, for diseases with relatively
short infectious periods, like the two weeks of CDV, nomads do not appear to be
superconnectors because although nomads constitute half of all epidemiological groups
(180 groups of nomads vs. 180 prides), they are only responsible for 10% of all
transmissions. Because disease transmission is a function of both group size and the
transmissibility parameter, and the average group size for nomads is 1.5 whereas the
average pride size is 3.7, the differences in group size could possibly explain for the low
rate of nomad disease transmission. Also, when the simulated nomad movement rate
was increased, prevalence, spatial spread, and velocity of the outbreak all increased,
suggesting that nomadic lions are insufficiently mobile to produce significant outcomes
on CDV dynamics.
Network models can be used to identify high-risk populations to target for
disease control. If nomads had been identified as superconnectors, theoretically they
would be the social class of lions on which to focus disease-control efforts. However,
the results of our network model indicate that because pride-pride transmission is
driving disease dynamics, control efforts for short-lived pathogens should focus on
pride members.
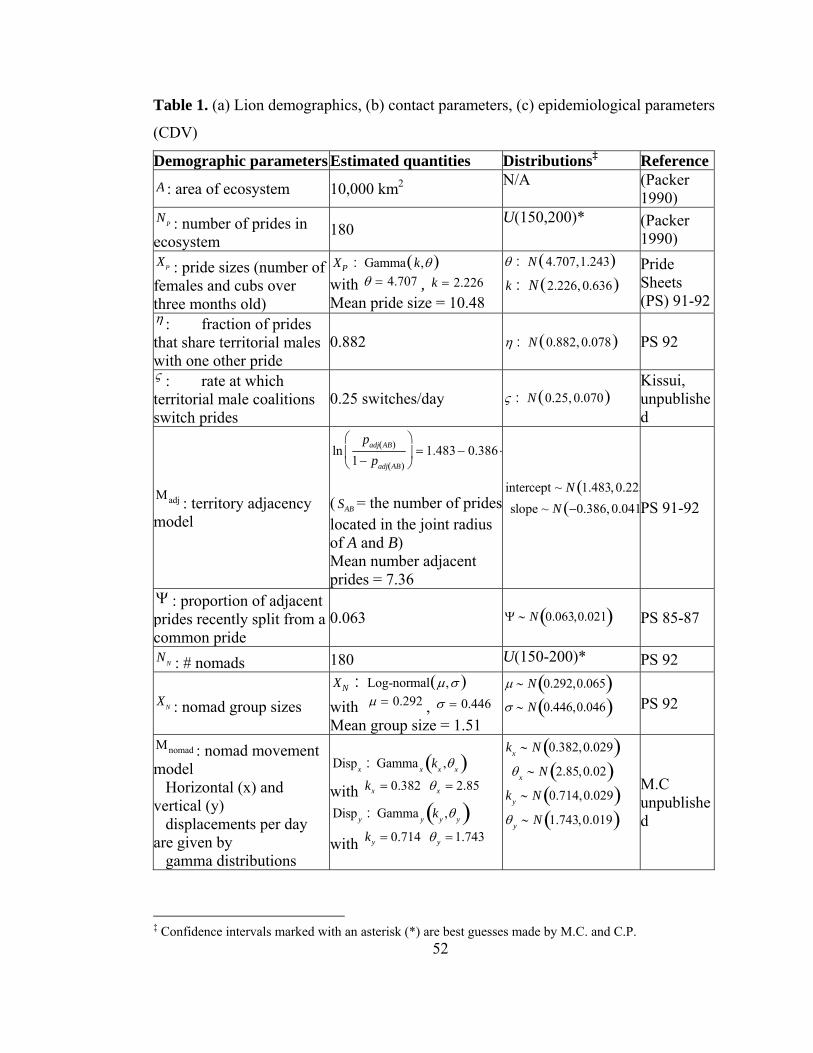
52
Table 1. (a) Lion demographics, (b) contact parameters, (c) epidemiological parameters
(CDV)
Demographic parameters Estimated quantities Distributions‡ ReferenceA : area of ecosystem 10,000 km2 N/A (Packer
1990) NP : number of prides in ecosystem
180 U(150,200)* (Packer
1990) XP : pride sizes (number of females and cubs over three months old)
XP : Gamma k,θ( ) with θ = 4.707 , k = 2.226 Mean pride size = 10.48
θ : N 4.707,1.243( )k : N 2.226, 0.636( )
Pride Sheets (PS) 91-92
η : fraction of prides that share territorial males with one other pride
0.882
η : N 0.882, 0.078( ) PS 92
ς : rate at which territorial male coalitions switch prides
0.25 switches/day ς : N 0.25, 0.070( ) Kissui, unpublished
Μadj : territory adjacency model
lnpadj AB( )
1 − padj AB( )
⎛
⎝⎜
⎞
⎠⎟ = 1.483 − 0.386 ⋅
( SAB = the number of prides located in the joint radius of A and B) Mean number adjacent prides = 7.36
intercept ~ N 1.483, 0.225(slope ~ N −0.386, 0.041(
PS 91-92
Ψ : proportion of adjacent prides recently split from a common pride
0.063 Ψ ∼ N 0.063,0.021( ) PS 85-87
NN : # nomads 180 U(150-200)* PS 92
XN : nomad group sizes XN : Log-normal μ,σ( ) with μ = 0.292 , σ = 0.446
Mean group size = 1.51
μ ∼ N 0.292,0.065( )σ ∼ N 0.446,0.046( )
PS 92
Μnomad : nomad movement model Horizontal (x) and vertical (y) displacements per day are given by gamma distributions
Dispx : Gamma x kx ,θx( ) with 0.382xk = 2.85xθ = Disp y : Gamma y ky ,θ y( ) with 0.714yk = 1.743yθ =
kx ∼ N 0.382,0.029( )θx ∼ N 2.85,0.02( )
ky ∼ N 0.714,0.029( )θ y ∼ N 1.743,0.019( )
M.C unpublished
‡ Confidence intervals marked with an asterisk (*) are best guesses made by M.C. and C.P.
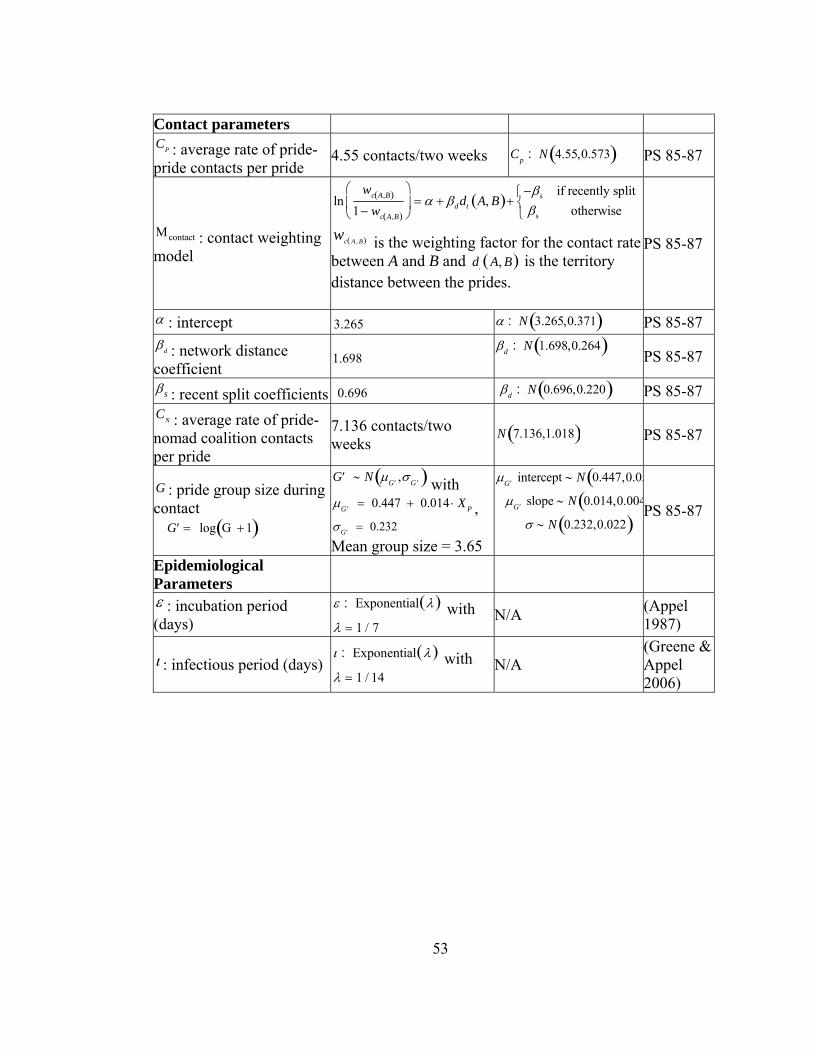
53
Contact parameters CP : average rate of pride-pride contacts per pride
4.55 contacts/two weeks Cp : N 4.55,0.573( ) PS 85-87
Μcontact : contact weighting model
lnwc A,B( )
1 − wc A,B( )
⎛
⎝⎜
⎞
⎠⎟ = α + βddt A, B( )+
−βs if recently splitβs otherwise
⎧⎨⎩
wc A , B( ) is the weighting factor for the contact rate between A and B and d
tA, B( ) is the territory
distance between the prides.
PS 85-87
α : intercept 3.265 α : N 3.265,0.371( ) PS 85-87 βd : network distance coefficient
1.698 βd : N 1.698,0.264( ) PS 85-87
βs : recent split coefficients 0.696 βd : N 0.696,0.220( ) PS 85-87 CN : average rate of pride-nomad coalition contacts per pride
7.136 contacts/two weeks
N 7.136,1.018( ) PS 85-87
G : pride group size during contact
′G = log G + 1( )
′G ∼ N μ ′G ,σ ′G( ) with μ ′G = 0.447 + 0.014 ⋅ X P , σ ′G = 0.232 Mean group size = 3.65
μ ′G intercept ∼ N 0.447,0.05(μ ′G slope ∼ N 0.014,0.004(
σ ∼ N 0.232,0.022( )
PS 85-87
Epidemiological Parameters
ε : incubation period (days)
ε : Exponential λ( ) with λ = 1 / 7
N/A (Appel 1987)
ι : infectious period (days) ι : Exponential λ( ) with λ = 1 / 14
N/A (Greene & Appel 2006)
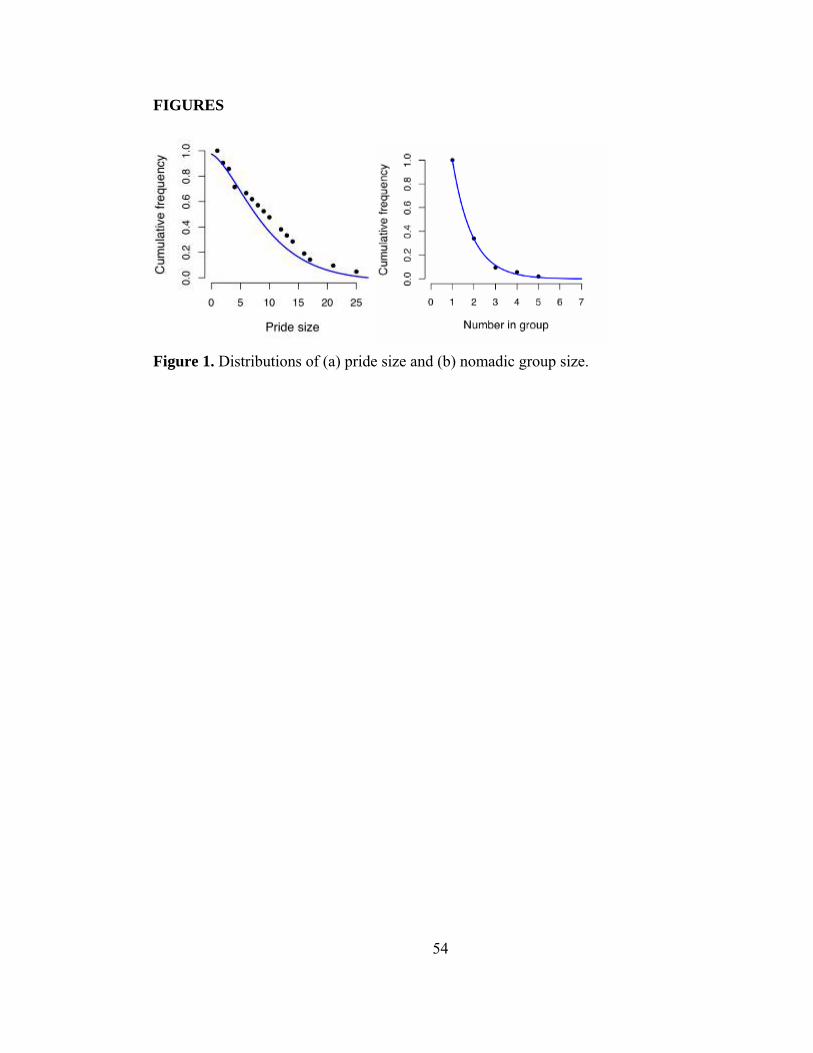
54
FIGURES
Figure 1. Distributions of (a) pride size and (b) nomadic group size.
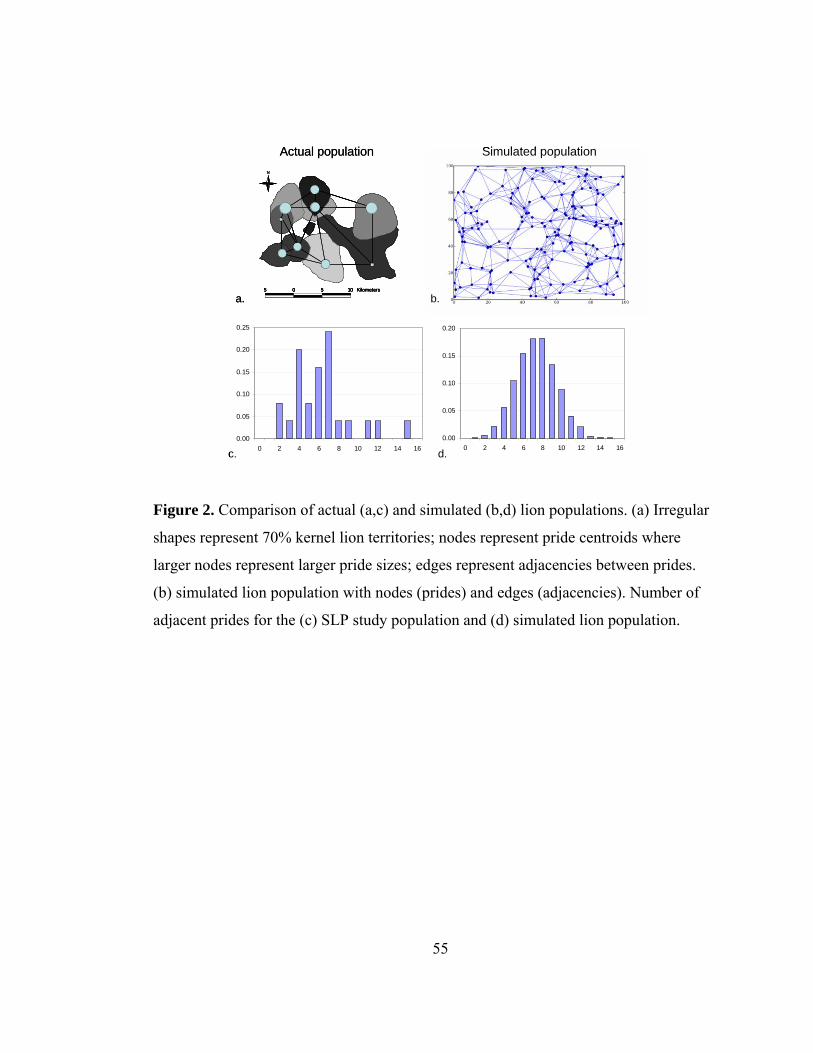
55
#
#
#
#
#
#
# ##
5 0 5 10 Kilometers
N
#
#
#
#
#
#
# ##
5 0 5 10 Kilometers
N
a. b.
Actual population Simulated population
0.00
0.05
0.10
0.15
0.20
0 2 4 6 8 10 12 14 160.00
0.05
0.10
0.15
0.20
0.25
0 2 4 6 8 10 12 14 16c. d.
#
#
#
#
#
#
# ##
5 0 5 10 Kilometers
N
#
#
#
#
#
#
# ##
5 0 5 10 Kilometers
N
a. b.
Actual population Simulated population
0.00
0.05
0.10
0.15
0.20
0 2 4 6 8 10 12 14 160.00
0.05
0.10
0.15
0.20
0.25
0 2 4 6 8 10 12 14 16c. d.
Figure 2. Comparison of actual (a,c) and simulated (b,d) lion populations. (a) Irregular
shapes represent 70% kernel lion territories; nodes represent pride centroids where
larger nodes represent larger pride sizes; edges represent adjacencies between prides.
(b) simulated lion population with nodes (prides) and edges (adjacencies). Number of
adjacent prides for the (c) SLP study population and (d) simulated lion population.
56
Figure 3. Adjacency Model. SAB is the number of other prides in the intervening region
between A and B, shown in gray.
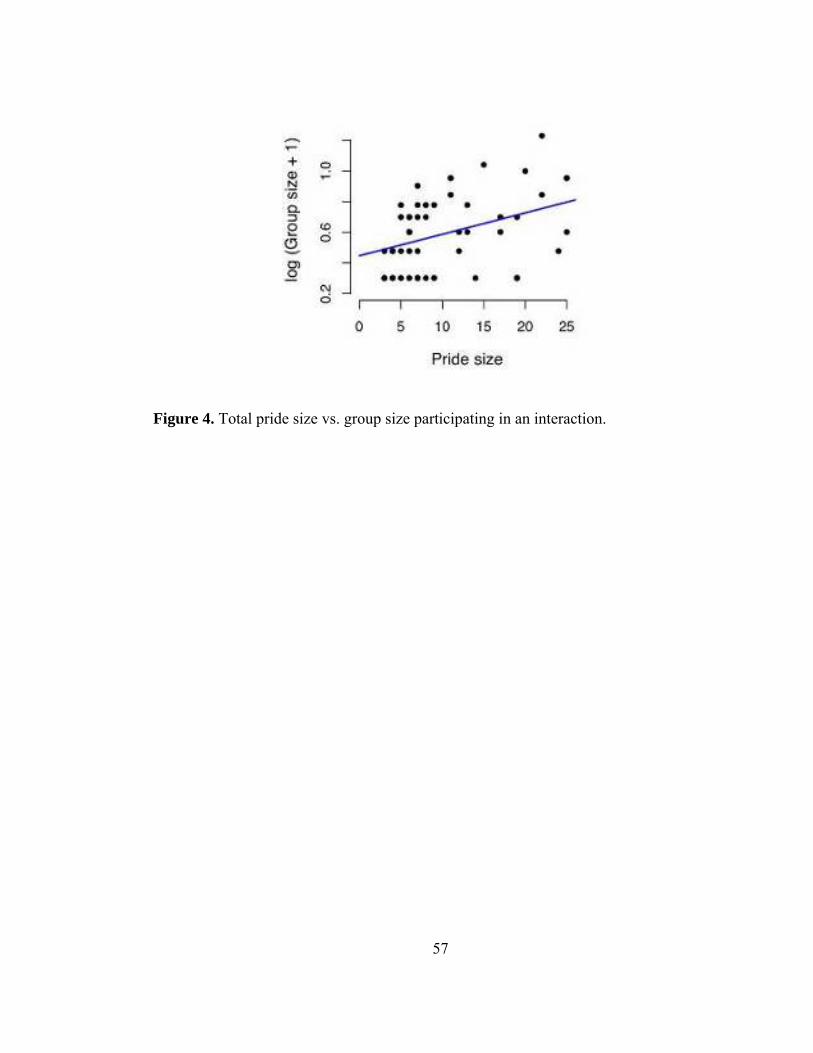
57
Figure 4. Total pride size vs. group size participating in an interaction.

58
##
#
# ########
### ######
##
###
#
##
###
##
#
#####
####
#
# # ###
###
###
####
### #
# ### ##
#
###########
##########################
############## ####
##
####### ############
########################
##########
##### ##########################
#####
###
#
###############
######
#############
###################
####
##########
#
######################
#########
#######
#####
##########
#########
########## ###
#####
####### #########
### ################ #####
####################################### ##
#
### #######
### ### ##############
###### #####################
###################
#########
#####
########## ##### #
### ###### ###
###### ############# ##
##### ######
########
########################
#########
######
#### ##############
#
#
########## #
##
#
####
#####
#
N
20 0 20 Kilometers
Serengeti National Park
CV37# 4/16 - 5/7# 5/8 - 5/29# 5/30 - 6/20# 6/21 - 7/12# 7/13 - 8/3# 8/4 - 8/25# 8/26 - 9/16# 9/17 - 10/8# 10/9 - 10/30
Figure 5. Movement patterns of a Serengeti nomadic lion (left) where spatiotemporal
locations are represented by colors of the rainbow (red are early locations whereas
purple are late locations versus simulated nomad (right) with colors representing the
same temporal scale (6 months). The time steps on the simulated nomad exactly mirror
the time-steps on the actual.
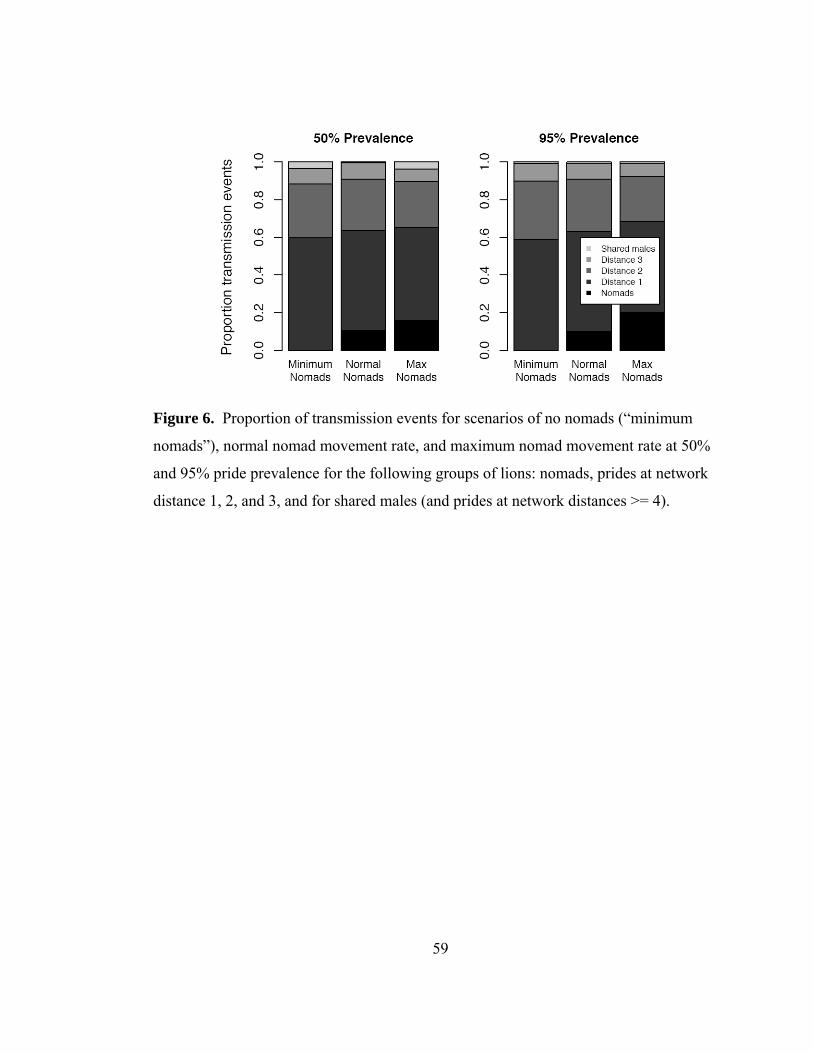
59
Figure 6. Proportion of transmission events for scenarios of no nomads (“minimum
nomads”), normal nomad movement rate, and maximum nomad movement rate at 50%
and 95% pride prevalence for the following groups of lions: nomads, prides at network
distance 1, 2, and 3, and for shared males (and prides at network distances >= 4).
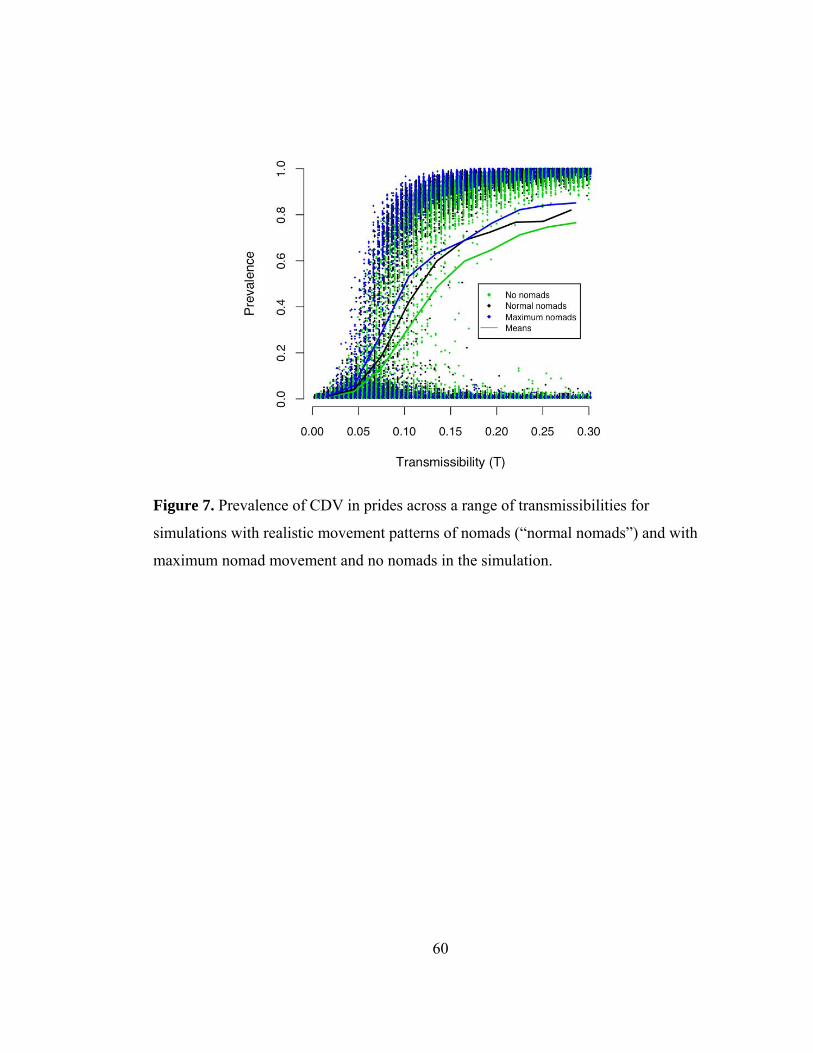
60
Figure 7. Prevalence of CDV in prides across a range of transmissibilities for
simulations with realistic movement patterns of nomads (“normal nomads”) and with
maximum nomad movement and no nomads in the simulation.
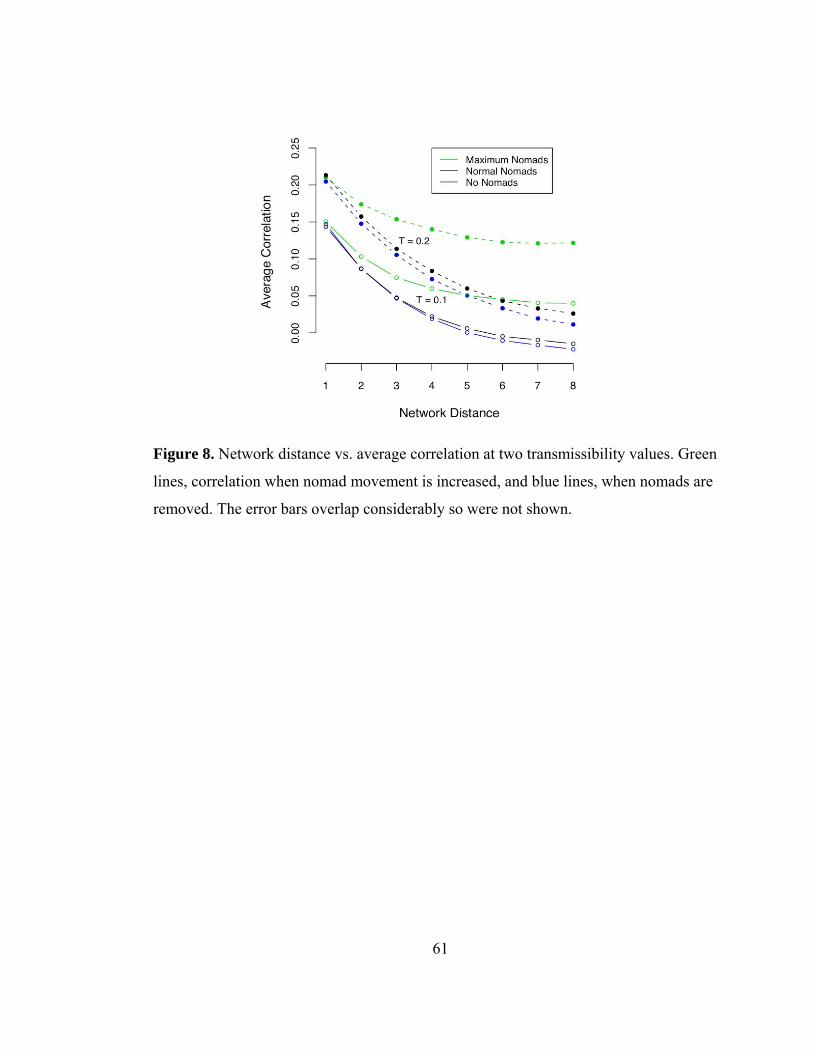
61
Figure 8. Network distance vs. average correlation at two transmissibility values. Green
lines, correlation when nomad movement is increased, and blue lines, when nomads are
removed. The error bars overlap considerably so were not shown.
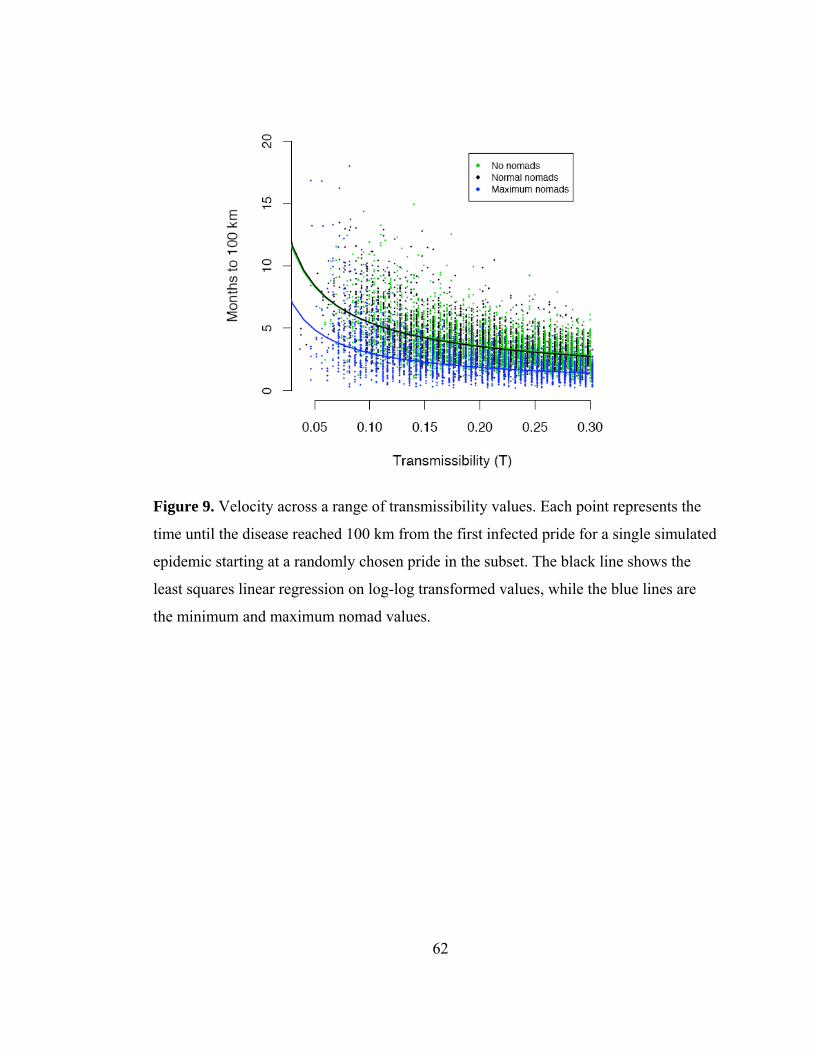
62
Figure 9. Velocity across a range of transmissibility values. Each point represents the
time until the disease reached 100 km from the first infected pride for a single simulated
epidemic starting at a randomly chosen pride in the subset. The black line shows the
least squares linear regression on log-log transformed values, while the blue lines are
the minimum and maximum nomad values.
63
CHAPTER 3
Distinguishing epidemic waves from disease spillover
in a wildlife population§
Summary
Serengeti lions frequently experience viral outbreaks. In 1994, one-third of Serengeti
lions died from canine distemper virus (CDV). Based on the limited epidemiological
data available from this period, it has been unclear whether the 1994 outbreak was
propagated by lion-to-lion transmission alone or involved multiple introductions from
other sympatric carnivore species. More broadly, we do not know whether contacts
between lions allow any pathogen with a relatively short infectious period to percolate
through the population (that is, reach epidemic proportions). We built one of the most
realistic contact network models for a wildlife population to date based on detailed
behavioral and movement data from a long-term lion study population. The model
allowed us to identify previously unrecognized biases in the sparse data from the 1994
outbreak and develop methods for judiciously inferring disease dynamics from typical
wildlife samples. Our analysis of the model in light of the 1994 outbreak data strongly
suggests that, although lions are sufficiently well-connected to sustain epidemics of
CDV-like diseases, the 1994 epidemic was fueled by multiple spillovers from other
carnivore species, such as jackals and hyenas.
§ With: Erik Volz (Department of Integrative Biology, UT Austin), Craig Packer, and Lauren Ancel Meyers (Department of Integrative Biology, University of Texas, Austin).
64
Introduction
Effective management of wildlife diseases depends on reliable information about
transmission patterns, and, at the very least, knowing which species participate in
transmission as maintenance, and non-maintenance hosts (Cleaveland et al. 2007).
Maintenance populations steadily maintain disease for long periods of time and can
serve as disease reservoirs (Haydon et al. 2002). They typically exceed a critical
community size (CCS) in which a pathogen can persist indefinitely (Bartlett 1960).
Non-maintenance populations can experience transient outbreaks, which are either large
epidemics that reach a significant fraction of hosts or small outbreaks that die out after
only a few infections. There are two distinct classes of non-maintenance host
populations: percolating populations can (but do not always) sustain large epidemics
while non-percolating populations cannot (Newman 2002, Meyers et al. 2005, Bansal,
Grenfell & Meyers 2007, Davis et al. 2008). Whether or not a non-maintenance
population can sustain an epidemic on its own depends, in part, on contact patterns
among hosts. Populations with ample opportunities for pathogen transmission will lie
above the epidemic threshold where large epidemics are possible, while more sparsely
connected populations will lie below the epidemic threshold where outbreaks rapidly
fizzle out.
Disease control strategies should prioritize maintenance hosts (Haydon et al.
2002). However, for direct intervention in non-maintenance populations, it is critical to
determine whether or not the population is percolating or non-percolating. If a non-
percolating population experiences repeated introductions of diseases from sympatric
populations, it may experience a series of small outbreaks that together take a large toll
on the population. Multiple spillover outbreaks like these may superficially resemble a
single epidemic wave; however, the optimal control strategies for these two scenarios
are quite different. In the spillover case, control measures should focus almost
exclusively on preventing new introductions of disease, whereas in the epidemic case,
strategies should also target transmission within the host population. Incorrectly
targeting interventions can waste precious resources and cause harm to wildlife [e.g.
65
extermination of Asian civets for SARS (Li et al. 2005) and UK badgers for bTB
(Donnelly et al. 2006)].
Mathematical models have historically provided important insights into disease
dynamics and management (Anderson & May 1991, Ferguson, Donnelly & Anderson
2001, Haydon, Laurenson & Sillero-Zubiri 2002, Keeling & Rohani 2008). Traditional
disease models can, however, be misleading: mass-action models assume that
populations are fully mixed, and lattice-based spatial models assume that all contacts
are spatially proximate. Endangered species often live in groups and defend territories
against conspecifics (e.g., lions in prides, wolves in packs), thus exhibiting population
structure that is neither fully mixed nor geographically localized. Their populations
show “community structure” (Cleaveland et al. 2008) in which the groups are highly
intraconnected and more loosely interconnected based on complex movement and
behavioral patterns. Epidemiological data corroborates that social groups are often the
critical units for disease transmission in wildlife (Altizer et al. 2003).
Contact network models allow us to explicitly consider the epidemiological
consequences of complex patterns of host connectivity and have demonstrated that
contact heterogeneity can fundamentally influence disease dynamics (Keeling 2005,
Meyers et al. 2005, Bansal, Pourbohloul & Meyers 2006, Ferrari et al. 2006). However,
network modeling often suffers from a paucity of good data on contact patterns,
particularly for non-human hosts. Very few studies of free-ranging wildlife provide
adequate empirical information to parameterize a network model (Cross, Lloyd-Smith
& Getz 2005); but the long-term data set of the Serengeti Lion Project (SLP), which
include decades of daily observations of behavior and movement, is a unique exception
(Packer et al. 2005).
We used the SLP data to infer the contact network structure of an African lion
(Panthera leo) population and built one of the most detailed, biologically realistic
epidemiological network models of a wildlife population to date [but see (Cross, Lloyd-
Smith & Getz 2005)]. The model incorporates pride composition, movement of nomads
(roaming lions), and contact rates between prides and nomads into a stochastic SEIR
(susceptible-exposed-infectious-recovered) network framework. Disease-causing
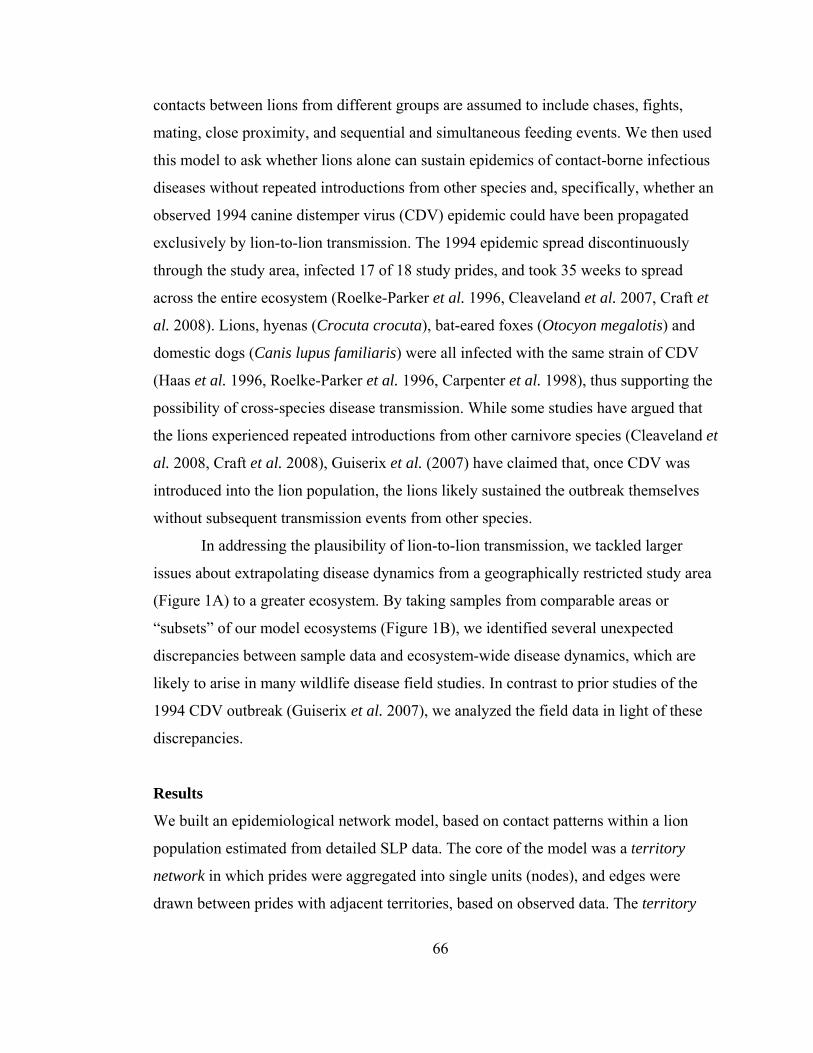
66
contacts between lions from different groups are assumed to include chases, fights,
mating, close proximity, and sequential and simultaneous feeding events. We then used
this model to ask whether lions alone can sustain epidemics of contact-borne infectious
diseases without repeated introductions from other species and, specifically, whether an
observed 1994 canine distemper virus (CDV) epidemic could have been propagated
exclusively by lion-to-lion transmission. The 1994 epidemic spread discontinuously
through the study area, infected 17 of 18 study prides, and took 35 weeks to spread
across the entire ecosystem (Roelke-Parker et al. 1996, Cleaveland et al. 2007, Craft et
al. 2008). Lions, hyenas (Crocuta crocuta), bat-eared foxes (Otocyon megalotis) and
domestic dogs (Canis lupus familiaris) were all infected with the same strain of CDV
(Haas et al. 1996, Roelke-Parker et al. 1996, Carpenter et al. 1998), thus supporting the
possibility of cross-species disease transmission. While some studies have argued that
the lions experienced repeated introductions from other carnivore species (Cleaveland et
al. 2008, Craft et al. 2008), Guiserix et al. (2007) have claimed that, once CDV was
introduced into the lion population, the lions likely sustained the outbreak themselves
without subsequent transmission events from other species.
In addressing the plausibility of lion-to-lion transmission, we tackled larger
issues about extrapolating disease dynamics from a geographically restricted study area
(Figure 1A) to a greater ecosystem. By taking samples from comparable areas or
“subsets” of our model ecosystems (Figure 1B), we identified several unexpected
discrepancies between sample data and ecosystem-wide disease dynamics, which are
likely to arise in many wildlife disease field studies. In contrast to prior studies of the
1994 CDV outbreak (Guiserix et al. 2007), we analyzed the field data in light of these
discrepancies.
Results
We built an epidemiological network model, based on contact patterns within a lion
population estimated from detailed SLP data. The core of the model was a territory
network in which prides were aggregated into single units (nodes), and edges were
drawn between prides with adjacent territories, based on observed data. The territory
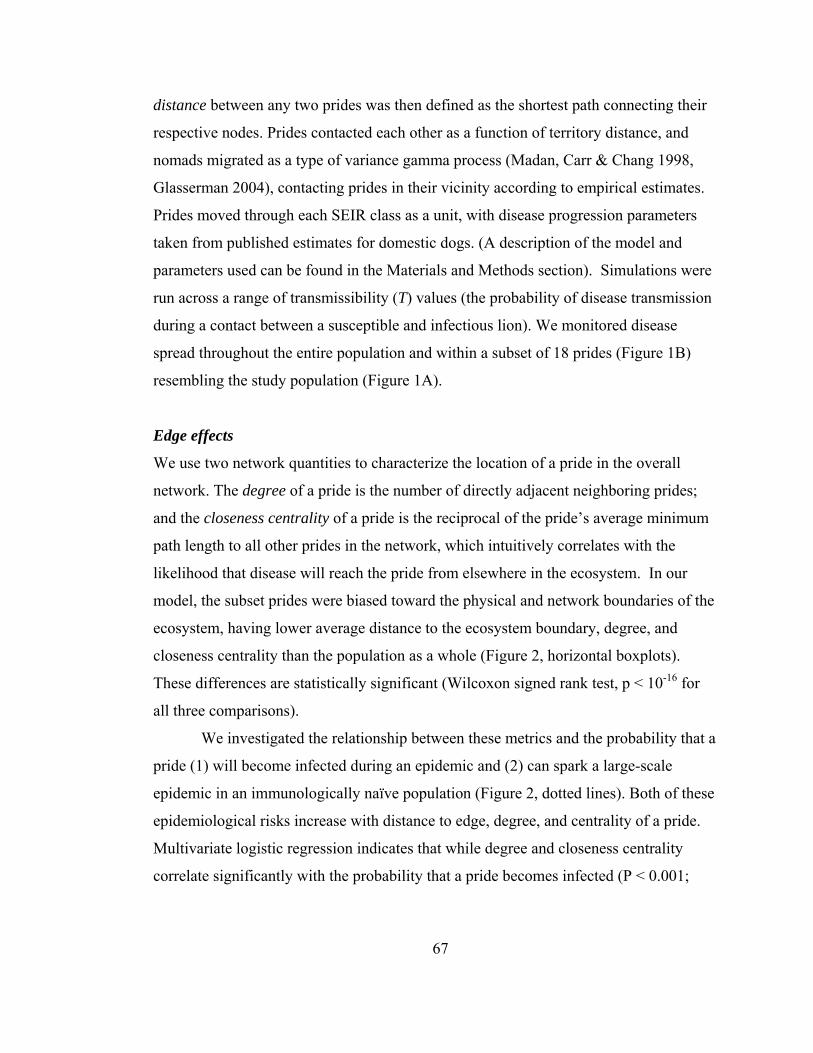
67
distance between any two prides was then defined as the shortest path connecting their
respective nodes. Prides contacted each other as a function of territory distance, and
nomads migrated as a type of variance gamma process (Madan, Carr & Chang 1998,
Glasserman 2004), contacting prides in their vicinity according to empirical estimates.
Prides moved through each SEIR class as a unit, with disease progression parameters
taken from published estimates for domestic dogs. (A description of the model and
parameters used can be found in the Materials and Methods section). Simulations were
run across a range of transmissibility (T) values (the probability of disease transmission
during a contact between a susceptible and infectious lion). We monitored disease
spread throughout the entire population and within a subset of 18 prides (Figure 1B)
resembling the study population (Figure 1A).
Edge effects
We use two network quantities to characterize the location of a pride in the overall
network. The degree of a pride is the number of directly adjacent neighboring prides;
and the closeness centrality of a pride is the reciprocal of the pride’s average minimum
path length to all other prides in the network, which intuitively correlates with the
likelihood that disease will reach the pride from elsewhere in the ecosystem. In our
model, the subset prides were biased toward the physical and network boundaries of the
ecosystem, having lower average distance to the ecosystem boundary, degree, and
closeness centrality than the population as a whole (Figure 2, horizontal boxplots).
These differences are statistically significant (Wilcoxon signed rank test, p < 10-16 for
all three comparisons).
We investigated the relationship between these metrics and the probability that a
pride (1) will become infected during an epidemic and (2) can spark a large-scale
epidemic in an immunologically naïve population (Figure 2, dotted lines). Both of these
epidemiological risks increase with distance to edge, degree, and centrality of a pride.
Multivariate logistic regression indicates that while degree and closeness centrality
correlate significantly with the probability that a pride becomes infected (P < 0.001;
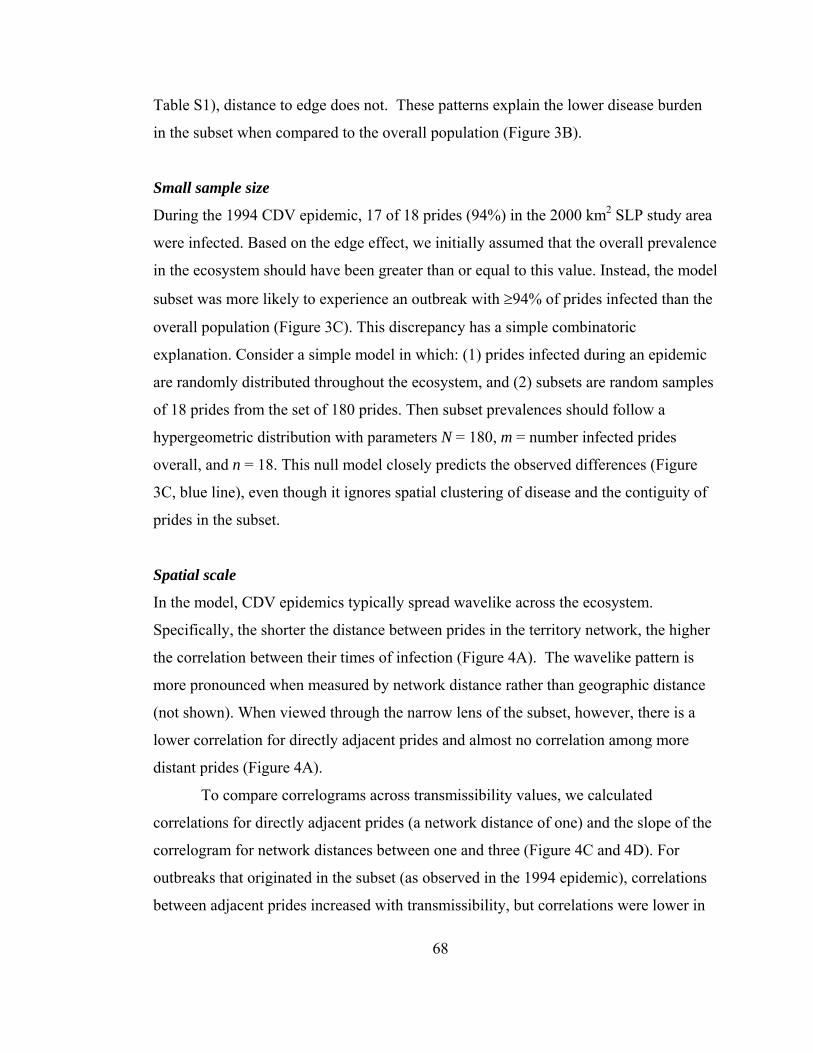
68
Table S1), distance to edge does not. These patterns explain the lower disease burden
in the subset when compared to the overall population (Figure 3B).
Small sample size
During the 1994 CDV epidemic, 17 of 18 prides (94%) in the 2000 km2 SLP study area
were infected. Based on the edge effect, we initially assumed that the overall prevalence
in the ecosystem should have been greater than or equal to this value. Instead, the model
subset was more likely to experience an outbreak with ≥94% of prides infected than the
overall population (Figure 3C). This discrepancy has a simple combinatoric
explanation. Consider a simple model in which: (1) prides infected during an epidemic
are randomly distributed throughout the ecosystem, and (2) subsets are random samples
of 18 prides from the set of 180 prides. Then subset prevalences should follow a
hypergeometric distribution with parameters N = 180, m = number infected prides
overall, and n = 18. This null model closely predicts the observed differences (Figure
3C, blue line), even though it ignores spatial clustering of disease and the contiguity of
prides in the subset.
Spatial scale
In the model, CDV epidemics typically spread wavelike across the ecosystem.
Specifically, the shorter the distance between prides in the territory network, the higher
the correlation between their times of infection (Figure 4A). The wavelike pattern is
more pronounced when measured by network distance rather than geographic distance
(not shown). When viewed through the narrow lens of the subset, however, there is a
lower correlation for directly adjacent prides and almost no correlation among more
distant prides (Figure 4A).
To compare correlograms across transmissibility values, we calculated
correlations for directly adjacent prides (a network distance of one) and the slope of the
correlogram for network distances between one and three (Figure 4C and 4D). For
outbreaks that originated in the subset (as observed in the 1994 epidemic), correlations
between adjacent prides increased with transmissibility, but correlations were lower in
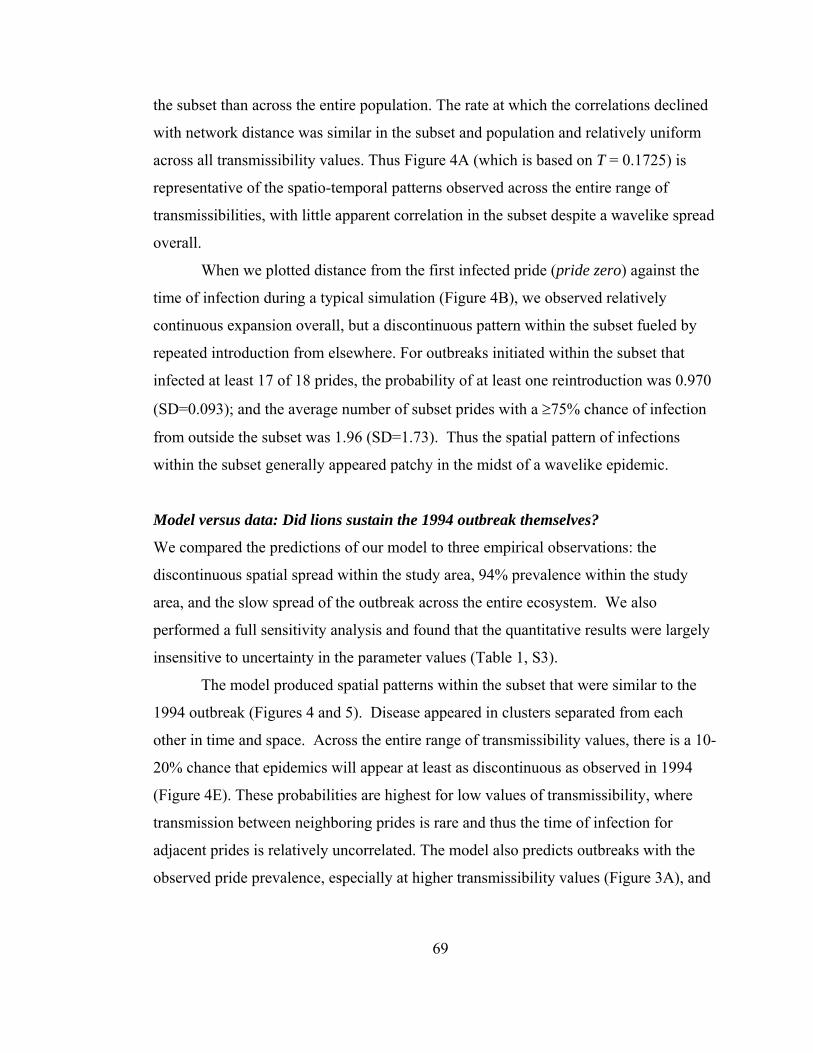
69
the subset than across the entire population. The rate at which the correlations declined
with network distance was similar in the subset and population and relatively uniform
across all transmissibility values. Thus Figure 4A (which is based on T = 0.1725) is
representative of the spatio-temporal patterns observed across the entire range of
transmissibilities, with little apparent correlation in the subset despite a wavelike spread
overall.
When we plotted distance from the first infected pride (pride zero) against the
time of infection during a typical simulation (Figure 4B), we observed relatively
continuous expansion overall, but a discontinuous pattern within the subset fueled by
repeated introduction from elsewhere. For outbreaks initiated within the subset that
infected at least 17 of 18 prides, the probability of at least one reintroduction was 0.970
(SD=0.093); and the average number of subset prides with a ≥75% chance of infection
from outside the subset was 1.96 (SD=1.73). Thus the spatial pattern of infections
within the subset generally appeared patchy in the midst of a wavelike epidemic.
Model versus data: Did lions sustain the 1994 outbreak themselves?
We compared the predictions of our model to three empirical observations: the
discontinuous spatial spread within the study area, 94% prevalence within the study
area, and the slow spread of the outbreak across the entire ecosystem. We also
performed a full sensitivity analysis and found that the quantitative results were largely
insensitive to uncertainty in the parameter values (Table 1, S3).
The model produced spatial patterns within the subset that were similar to the
1994 outbreak (Figures 4 and 5). Disease appeared in clusters separated from each
other in time and space. Across the entire range of transmissibility values, there is a 10-
20% chance that epidemics will appear at least as discontinuous as observed in 1994
(Figure 4E). These probabilities are highest for low values of transmissibility, where
transmission between neighboring prides is rare and thus the time of infection for
adjacent prides is relatively uncorrelated. The model also predicts outbreaks with the
observed pride prevalence, especially at higher transmissibility values (Figure 3A), and
70
predicts the observed rate of geographical spread at lower transmissibility values
(Figure 6).
Although each of these individual patterns has a reasonable probability of
occurring in a lion-to-lion epidemic, it is highly unlikely that all three could occur
simultaneously (Figure 7). The observed spatial spread and velocity are most likely to
occur at low transmissibilities while the observed prevalence is most likely at higher
transmissibilities. Only a minute fraction of simulations exhibited both the observed
prevalence and velocity. The highest probability of observing both patterns is 0.02,
occurring at approximately T = 0.095. We did not include the spatial analysis (Figure 4)
in this comparison because patchy outbreaks correlate with low velocity and adding a
spatial criterion would only reduce the joint probability further.
Since the model failed to identify a range of transmission values that could have
plausibly produced an epidemic that was both as large and as slow as the observed 1994
outbreak, we conclude that the assumption of strict lion-to-lion transmission must be
incorrect. Thus the actual transmission dynamics must have involved multiple
introductions of disease to the lions from sympatric carnivore species.
Discussion
Are Serengeti lions a percolating population for CDV?
Serengeti lions likely experience outbreaks of CDV and other directly transmitted viral
diseases with similar infectious periods, such as feline calicivirus and parvovirus, every
four to twelve years (Packer et al. 1999). Our model suggests that this population of
lions is sufficiently well-connected to sustain epidemics of CDV-like diseases on their
own, that is, it is a percolating population for viruses with short infectious periods. Even
moderately contagious diseases (with probability of transmission per contact T ≈ 0.13),
have at least a 5% chance of producing an epidemic that reaches 95% of all prides in the
ecosystem (Figure 3C); and this probability increases rapidly with transmissibility. If
CDV is at least moderately infectious in lions, as suggested for domestic and wild
carnivores (Appel 1987), then our model suggests that it has the potential to sweep
through the entire population.

71
The 1994 CDV outbreak, however, was unlikely to have been maintained by
lions alone. Across the entire range of transmissibility values, a strictly lion-to-lion
epidemic could not have been both as extensive and as slow-moving as observed in
1994. At low rates of transmissibility, disease can spread as slowly as in 1994 but not
reach the observed prevalence; the reverse is true at high rates of transmissibility
(Figure 7).
The most plausible explanation for this discrepancy is the absence of additional
carnivore species from our model. Lions commonly contact hyenas and jackals during
simultaneous or sequential feeding events (Cleaveland et al. 2008), and a single CDV
variant was found to be circulating in lions, hyenas, bat-eared foxes, and domestic dogs
during the 1994 outbreak (Haas et al. 1996, Roelke-Parker et al. 1996, Carpenter et al.
1998). Thus, there were repeated opportunities for CDV to be introduced into the lion
population. Although this conclusion contradicts a recent analysis by Guiserix et al, it is
consistent with the genetic analysis and supported by observations of sick jackals and
leopards at the time of the epidemic (Roelke-Parker et al. 1996) and the hypothesis that
morbilliviruses require large critical community sizes (Bartlett 1960, Grenfell,
Bjornstad & Kappey 2001). Our model suggests that lions were a “non-maintenance”
population for this CDV epidemic and experienced transient chains of infection that
“spilled over” from other species (Haydon et al. 2002, Fenton & Pedersen 2005).
Do disease dynamics scale?
Wildlife studies can be resource and time intensive, thus biologists regularly extrapolate
from subsets of larger populations. Ecologists recognize that natural processes can vary
considerably with the spatial scale of the observation (Tilman & Kareiva 1997, O'Neil
& King 1998) and thus use multi-scale approaches to analyze complex ecological
systems. Given the difficulty of observing wildlife disease outbreaks in real-time,
disease ecologists are typically forced to mine sparse data without regard to sampling or
scaling issues (examples include:(Williams et al. 1988, Woodroffe, Ginsberg &
Macdonald 1997, Packer et al. 1999, Leendertz et al. 2004, Haydon et al. 2006)).
72
In this study we identified three potential sources of error that are relevant to
wildlife disease ecology. The first is an edge effect, or more generally, non-random
sampling with respect to the epidemiological structure of the population. Directly
transmitted diseases spread primarily during contacts between neighbors or neighboring
groups; and the pattern of such interactions gives rise to a contact network. The position
of a group within the network, in conjunction with the overall network structure,
determines its epidemiological risk (Figure 2). The contact network for Serengeti lions
is highly spatial, such that contact rates are highly correlated with the number of nearby
prides. Thus, prides located closest to the border of the Serengeti National Park have the
fewest contacts, on average. For this reason, estimates based on samples taken from the
outskirts of the park (like the SLP study area) would tend to underestimate the overall
burden of disease in the Serengeti ecosystem. Note, however, that samples from a
geographic boundary will not suffer from an edge effect if the population is sufficiently
well mixed that contact rates are homogeneous throughout the ecosystem.
The frequency of an epidemic in the subset can also differ significantly from the
overall population, simply because of variability associated with taking a small random
sample from a large population. Just by chance, the sample proportion can deviate
considerably from the population proportion. In the 1994 CDV epidemic, 94% of prides
in the subset were infected. At relatively low transmissibilities (T~0.1), almost no
simulated epidemics reach an overall prevalence of 94%, yet a sizable fraction infect at
least 94% of subset prides. This is predicted by a simple hypergeometric model in
which we assume that the subset is a truly random sample from the population of 180
prides. For example, suppose an epidemic reaches 80% of all prides (144 of 180). A
random sample of 18 prides will have roughly a 9% chance of having prevalence above
the 94% threshold even though the population as a whole is well below the threshold.
Thus at moderate transmissibilities, where few, if any, epidemics cross the 94%
threshold, sampling variability alone can explain the higher vulnerability of the subset
to large epidemics than the overall population.
The final complication arises when sampling from a smaller geographic scale
than that of disease transmission. The SLP data from the 1994 CDV outbreak suggests
73
non-wavelike, erratic spread of disease through the study area which has been seen as
evidence for repeated introduction from other species (Craft et al. 2008). Although we
ultimately rejected the possibility that lions sustained the 1994 outbreak by themselves,
it would have been incorrect to assume that the observed spatial spread necessarily
implied a similar pattern across the entire ecosystem. While contacts primarily occur
between neighboring groups, lion prides occasionally contact distant prides and
migrating nomads, which reduces the correlation between distance and the timing of
infection. When the probability of transmission is low, disease may initially reach only
a few prides in a given area and later return to the same vicinity via longer-distance
contacts. In a population with exclusively local contacts, dynamics at a small scale will
become much more wavelike and more closely resemble the large-scale dynamics. On
the other hand, completely mixed populations will lack scale-dependencies, because
they lack spatial patterns altogether.
Materials & methods
Modeling Lion Population Structure
Lions live in gregarious groups (prides) composed of related females and their
dependent offspring. Prides are territorial and infrequently contact their neighbors
(Packer, Lewis & Pusey 1992); inter-pride encounters can be deadly (Schaller 1972,
McComb et al. 1993, Grinnell, Packer & Pusey 1995). When prides grow too large,
young females split off and form a neighboring pride (Pusey & Packer 1987) and are
more tolerant of their non-pride relatives than lions from unrelated prides (VanderWaal,
Mosser & Packer in press). Coalitions of males can reside in more than one pride
(Bygott, Bertram & Hanby 1979) and distribute their time between neighboring prides
(Schaller 1972). In contrast, nomads do not maintain a territory and move throughout
the ecosystem (Schaller 1972). Lions from different social groups interact during
territorial defense and at kills. Nomads can be seen as long distance disease dispersers,
while shared males increase disease transmission between neighboring prides. A
quantitative summary of lion population structure is summarized in Table 1 (Craft, et al.
in prep).
74
The network model places N P = 180 prides and NN = 180 nomads at uniform
random locations in a square region representing A = 10,000 km2 of the high lion
density area of the Serengeti (Figure 1). The location of each pride is represented by a
single point or centroid (geographical center of its territory). Prides are assigned to be
adjacent to one another according to the estimated adjacency model ( Μadj ), and these
adjacencies form the edges of the territory network (example in Figure 1B). A fraction
of adjacent pairs ( Ψ ) are randomly assigned to have recently split from one another.
Each pride is given a size ( X P ) drawn from a from a best-fit gamma distribution.
Contacts between prides occur at an average of Cp = 4.55 contacts per two-week period
per pride, as estimated from a study in which 16 lionesses were observed continuously
for a total of 2213 hours. Contacts between pairs of prides occur stochastically at rates
that are weighted by a logistic function of their territory distance and whether they
recently split ( Μcontact ).
Coalitions of resident males and nomads are treated separately from prides of
females and cubs. Male coalitions are represented as single units that increase
connectivity between prides. Each territorial coalition belongs to either one or two
prides; an estimated fraction η of all prides share their territorial coalition with one of
their adjacent prides, and each remaining pride has a territorial coalition to itself. If a
territorial coalition l is associated with ηl > 1 prides, it will be assigned to one of its
prides and migrate from one (i) to another (j) with probability
μij = 1− exp ςh( )( ) ηl − 1( ) where h is a small time-step and ς is the territorial male
migration rate.
Nomadic lions are given group sizes ( X N ) randomly generated from an
estimated distribution and are assumed to migrate via a variance gamma process
( Μnomad ). Each group is initially assigned to the territory of a randomly selected pride,
and at any point thereafter, resides in or around the territory of exactly one pride. In any
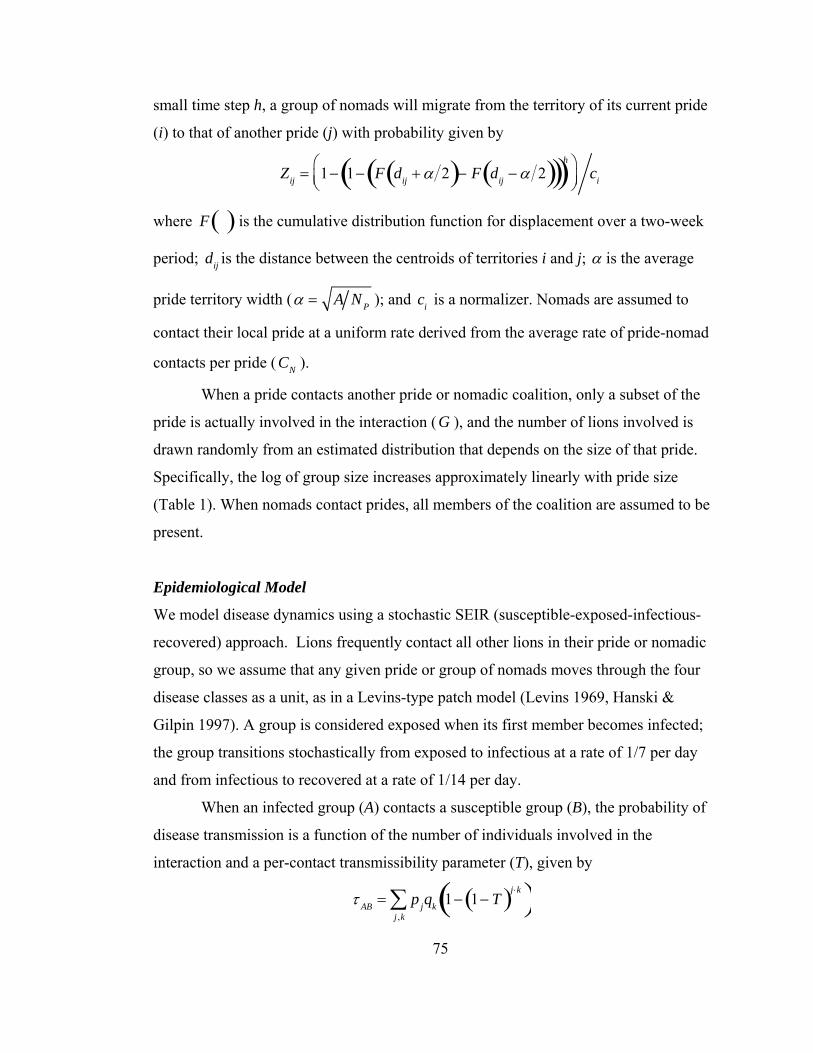
75
small time step h, a group of nomads will migrate from the territory of its current pride
(i) to that of another pride (j) with probability given by
Zij = 1− 1− F dij + α 2( )− F dij − α 2( )( )( )h⎛
⎝⎜⎞⎠⎟
ci
where F( ) is the cumulative distribution function for displacement over a two-week
period; dij is the distance between the centroids of territories i and j; α is the average
pride territory width ( α = A N P ); and ci is a normalizer. Nomads are assumed to
contact their local pride at a uniform rate derived from the average rate of pride-nomad
contacts per pride ( CN ).
When a pride contacts another pride or nomadic coalition, only a subset of the
pride is actually involved in the interaction (G ), and the number of lions involved is
drawn randomly from an estimated distribution that depends on the size of that pride.
Specifically, the log of group size increases approximately linearly with pride size
(Table 1). When nomads contact prides, all members of the coalition are assumed to be
present.
Epidemiological Model
We model disease dynamics using a stochastic SEIR (susceptible-exposed-infectious-
recovered) approach. Lions frequently contact all other lions in their pride or nomadic
group, so we assume that any given pride or group of nomads moves through the four
disease classes as a unit, as in a Levins-type patch model (Levins 1969, Hanski &
Gilpin 1997). A group is considered exposed when its first member becomes infected;
the group transitions stochastically from exposed to infectious at a rate of 1/7 per day
and from infectious to recovered at a rate of 1/14 per day.
When an infected group (A) contacts a susceptible group (B), the probability of
disease transmission is a function of the number of individuals involved in the
interaction and a per-contact transmissibility parameter (T), given by
τ AB = pjqk 1− 1− T( )j ⋅k( )j ,k∑
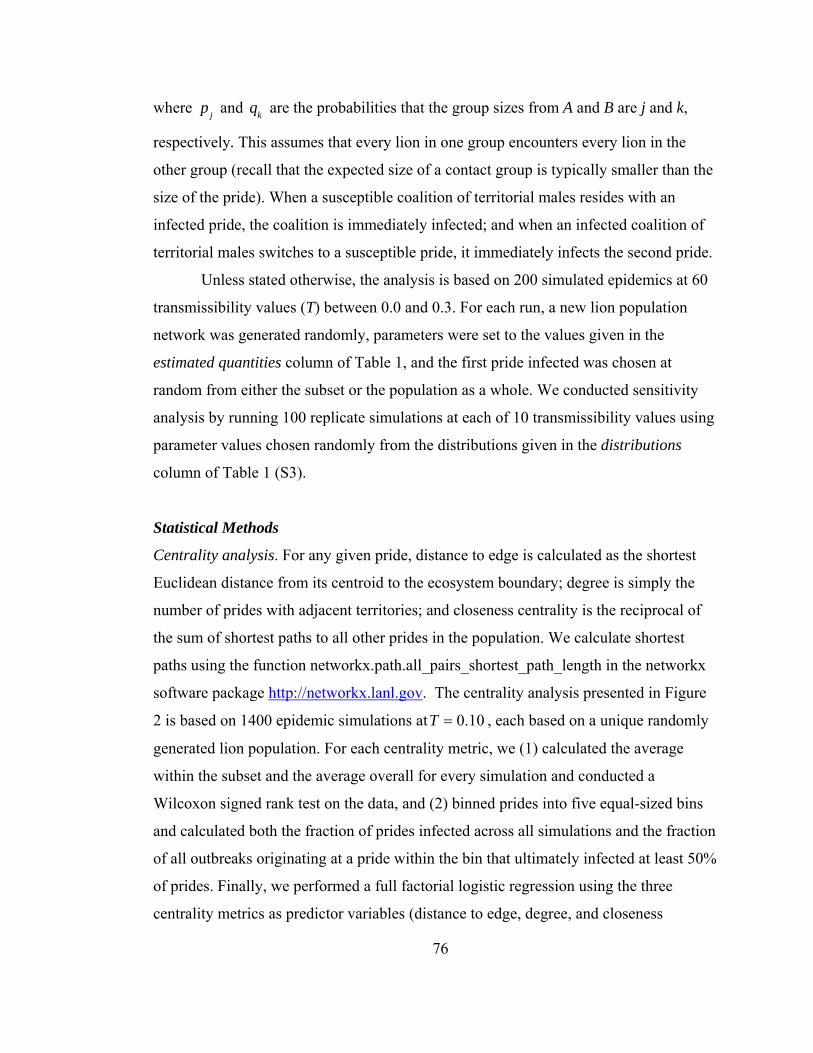
76
where p j and qk are the probabilities that the group sizes from A and B are j and k,
respectively. This assumes that every lion in one group encounters every lion in the
other group (recall that the expected size of a contact group is typically smaller than the
size of the pride). When a susceptible coalition of territorial males resides with an
infected pride, the coalition is immediately infected; and when an infected coalition of
territorial males switches to a susceptible pride, it immediately infects the second pride.
Unless stated otherwise, the analysis is based on 200 simulated epidemics at 60
transmissibility values (T) between 0.0 and 0.3. For each run, a new lion population
network was generated randomly, parameters were set to the values given in the
estimated quantities column of Table 1, and the first pride infected was chosen at
random from either the subset or the population as a whole. We conducted sensitivity
analysis by running 100 replicate simulations at each of 10 transmissibility values using
parameter values chosen randomly from the distributions given in the distributions
column of Table 1 (S3).
Statistical Methods
Centrality analysis. For any given pride, distance to edge is calculated as the shortest
Euclidean distance from its centroid to the ecosystem boundary; degree is simply the
number of prides with adjacent territories; and closeness centrality is the reciprocal of
the sum of shortest paths to all other prides in the population. We calculate shortest
paths using the function networkx.path.all_pairs_shortest_path_length in the networkx
software package http://networkx.lanl.gov. The centrality analysis presented in Figure
2 is based on 1400 epidemic simulations atT = 0.10 , each based on a unique randomly
generated lion population. For each centrality metric, we (1) calculated the average
within the subset and the average overall for every simulation and conducted a
Wilcoxon signed rank test on the data, and (2) binned prides into five equal-sized bins
and calculated both the fraction of prides infected across all simulations and the fraction
of all outbreaks originating at a pride within the bin that ultimately infected at least 50%
of prides. Finally, we performed a full factorial logistic regression using the three
centrality metrics as predictor variables (distance to edge, degree, and closeness
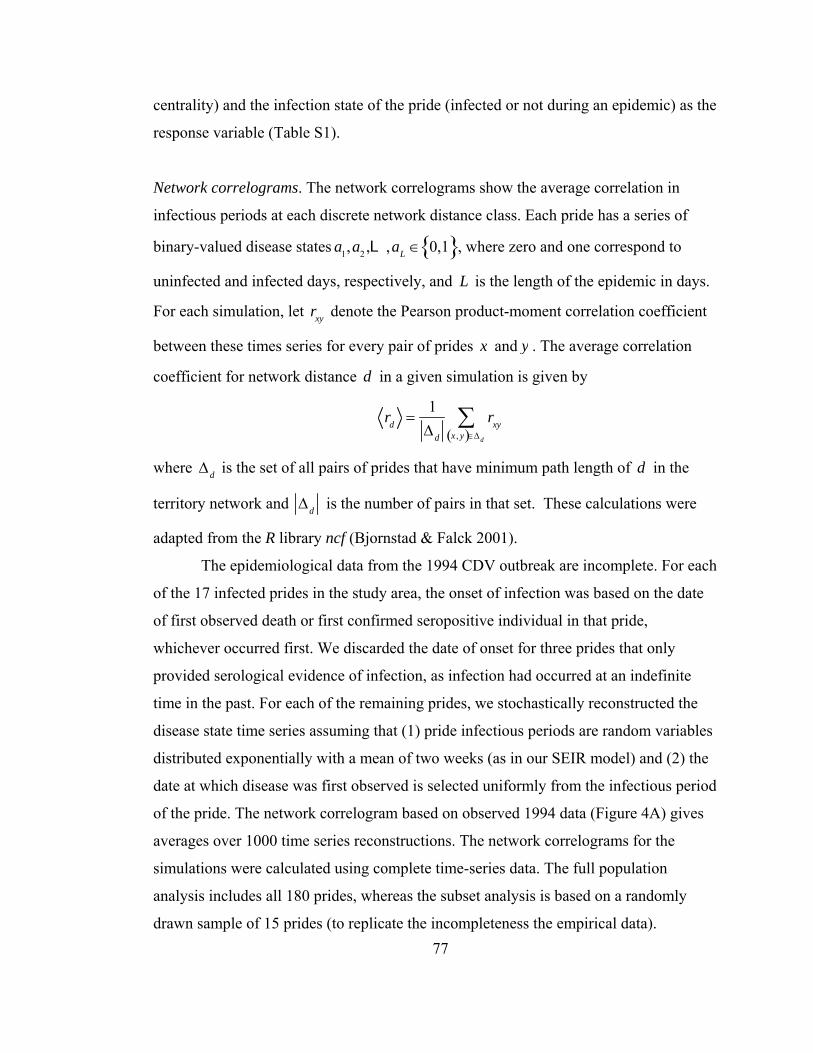
77
centrality) and the infection state of the pride (infected or not during an epidemic) as the
response variable (Table S1).
Network correlograms. The network correlograms show the average correlation in
infectious periods at each discrete network distance class. Each pride has a series of
binary-valued disease states a1,a2 ,L ,aL ∈ 0,1{ }, where zero and one correspond to
uninfected and infected days, respectively, and L is the length of the epidemic in days.
For each simulation, let rxy denote the Pearson product-moment correlation coefficient
between these times series for every pair of prides x and y . The average correlation
coefficient for network distance d in a given simulation is given by
rd =1
Δd
rxyx , y( )∈Δd
∑
where Δd is the set of all pairs of prides that have minimum path length of d in the
territory network and Δd is the number of pairs in that set. These calculations were
adapted from the R library ncf (Bjornstad & Falck 2001).
The epidemiological data from the 1994 CDV outbreak are incomplete. For each
of the 17 infected prides in the study area, the onset of infection was based on the date
of first observed death or first confirmed seropositive individual in that pride,
whichever occurred first. We discarded the date of onset for three prides that only
provided serological evidence of infection, as infection had occurred at an indefinite
time in the past. For each of the remaining prides, we stochastically reconstructed the
disease state time series assuming that (1) pride infectious periods are random variables
distributed exponentially with a mean of two weeks (as in our SEIR model) and (2) the
date at which disease was first observed is selected uniformly from the infectious period
of the pride. The network correlogram based on observed 1994 data (Figure 4A) gives
averages over 1000 time series reconstructions. The network correlograms for the
simulations were calculated using complete time-series data. The full population
analysis includes all 180 prides, whereas the subset analysis is based on a randomly
drawn sample of 15 prides (to replicate the incompleteness the empirical data).
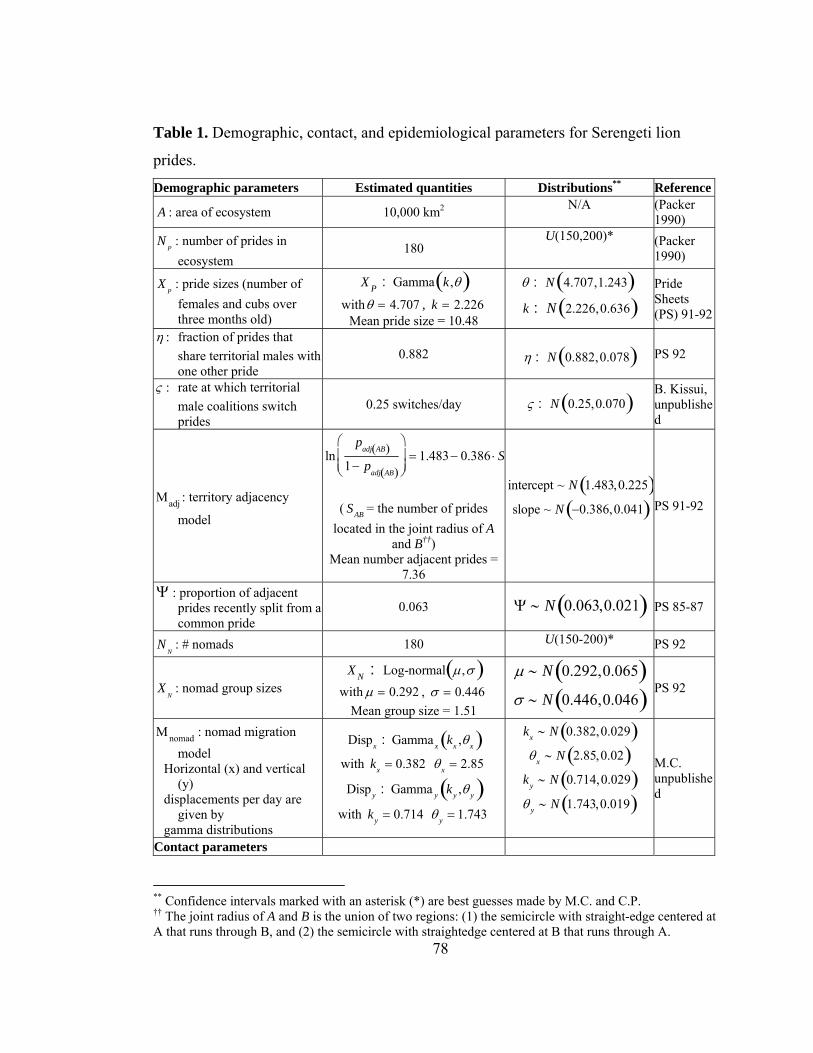
78
Table 1. Demographic, contact, and epidemiological parameters for Serengeti lion
prides.
Demographic parameters Estimated quantities Distributions** Reference
A : area of ecosystem 10,000 km2 N/A (Packer 1990)
N P: number of prides in ecosystem
180 U(150,200)* (Packer
1990)
X P: pride sizes (number of females and cubs over three months old)
X P : Gamma k ,θ( )
withθ = 4.707 , k = 2.226 Mean pride size = 10.48
θ : N 4.707,1.243( )k : N 2.226,0.636( )
Pride Sheets (PS) 91-92
η : fraction of prides that share territorial males with one other pride
0.882
η : N 0.882,0.078( ) PS 92
ς : rate at which territorial male coalitions switch prides
0.25 switches/day ς : N 0.25,0.070( ) B. Kissui, unpublished
Μadj : territory adjacency
model
lnp
adj AB( )1− p
adj AB( )
⎛
⎝⎜⎜
⎞
⎠⎟⎟
= 1.483− 0.386 ⋅ S
( SAB = the number of prides
located in the joint radius of A and B††)
Mean number adjacent prides = 7.36
intercept ~ N 1.483,0.225( )slope ~ N −0.386,0.041( )
PS 91-92
Ψ : proportion of adjacent prides recently split from a common pride
0.063 Ψ ∼ N 0.063,0.021( ) PS 85-87
N N: # nomads 180 U(150-200)* PS 92
X N: nomad group sizes
X N : Log-normal μ,σ( ) with μ = 0.292 , σ = 0.446
Mean group size = 1.51
μ ∼ N 0.292,0.065( )σ ∼ N 0.446,0.046( )
PS 92
Μnomad : nomad migration model
Horizontal (x) and vertical (y)
displacements per day are given by
gamma distributions
Dispx : Gamma x kx ,θx( )
with kx = 0.382 θx = 2.85
Disp y : Gamma y ky ,θ y( )
with ky = 0.714 θ y = 1.743
kx ∼ N 0.382,0.029( )θx ∼ N 2.85,0.02( )
ky ∼ N 0.714,0.029( )θ y ∼ N 1.743,0.019( )
M.C. unpublished
Contact parameters
** Confidence intervals marked with an asterisk (*) are best guesses made by M.C. and C.P. †† The joint radius of A and B is the union of two regions: (1) the semicircle with straight-edge centered at A that runs through B, and (2) the semicircle with straightedge centered at B that runs through A.
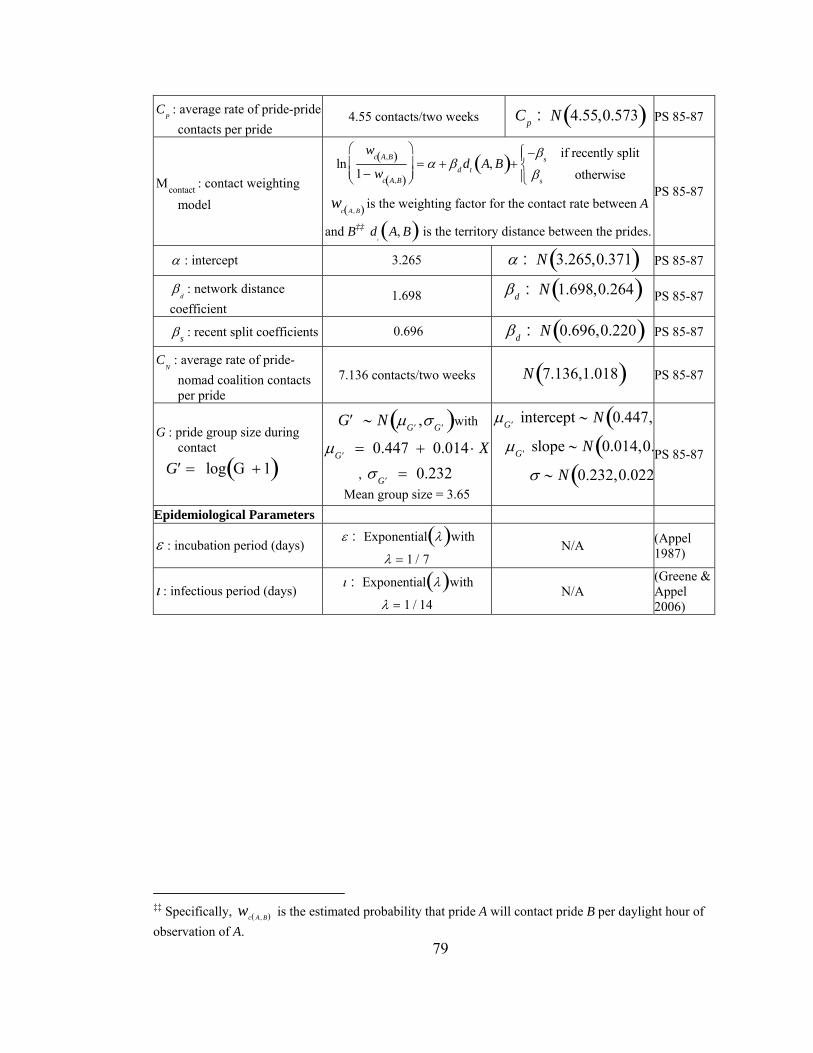
79
CP: average rate of pride-pride contacts per pride
4.55 contacts/two weeks Cp : N 4.55,0.573( ) PS 85-87
Μcontact : contact weighting model
lnw
c A,B( )1− wc A,B( )
⎛
⎝⎜⎜
⎞
⎠⎟⎟
= α + βd dt A, B( )+−βs if recently splitβs otherwise
⎧⎨⎪
⎩⎪
wc A , B( ) is the weighting factor for the contact rate between A
and B‡‡ dt
A, B( ) is the territory distance between the prides.
PS 85-87
α : intercept 3.265 α : N 3.265,0.371( ) PS 85-87
βd: network distance
coefficient 1.698 βd : N 1.698,0.264( ) PS 85-87
βs : recent split coefficients 0.696 βd : N 0.696,0.220( ) PS 85-87
CN: average rate of pride-nomad coalition contacts per pride
7.136 contacts/two weeks N 7.136,1.018( ) PS 85-87
G : pride group size during contact
′G = log G + 1( )
′G ∼ N μ ′G ,σ ′G( )with
μ ′G = 0.447 + 0.014 ⋅ X P
, σ ′G = 0.232 Mean group size = 3.65
μ ′G intercept ∼ N 0.447,(μ ′G slope ∼ N 0.014,0.(
σ ∼ N 0.232,0.022(
PS 85-87
Epidemiological Parameters
ε : incubation period (days) ε : Exponential λ( )with
λ = 1 / 7 N/A (Appel
1987)
ι : infectious period (days) ι : Exponential λ( )with
λ = 1 / 14 N/A
(Greene & Appel 2006)
‡‡ Specifically, wc A , B( ) is the estimated probability that pride A will contact pride B per daylight hour of observation of A.

80
FIGURES
Figure 1. The ecosystem and study area (subset) in both the Serengeti and the model.
(A) The Serengeti ecosystem (black rectangle: suitable lion habitat; red square: SLP
study area). (B) A simulated lion population based on estimates of territory locations
and adjacencies from SLP data (black rectangle: model ecosystem; red square: sampled
subset). Nodes represent prides and edges indicate prides with adjacent territories.
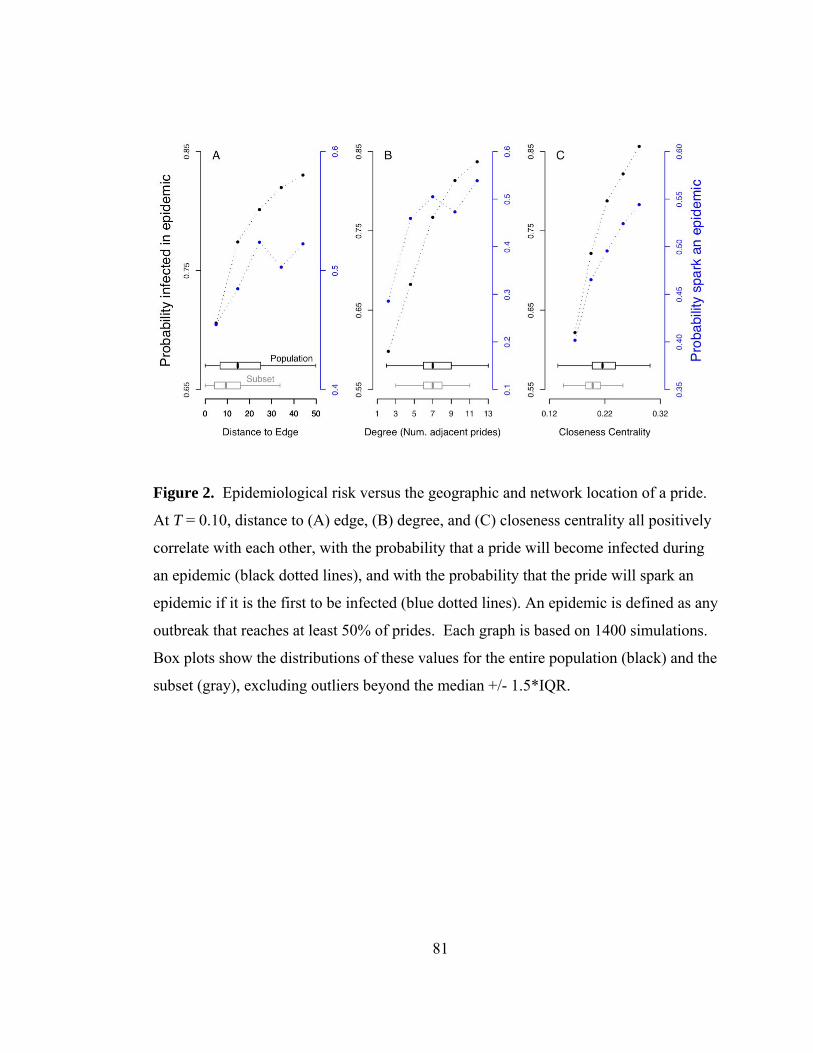
81
Figure 2. Epidemiological risk versus the geographic and network location of a pride.
At T = 0.10, distance to (A) edge, (B) degree, and (C) closeness centrality all positively
correlate with each other, with the probability that a pride will become infected during
an epidemic (black dotted lines), and with the probability that the pride will spark an
epidemic if it is the first to be infected (blue dotted lines). An epidemic is defined as any
outbreak that reaches at least 50% of prides. Each graph is based on 1400 simulations.
Box plots show the distributions of these values for the entire population (black) and the
subset (gray), excluding outliers beyond the median +/- 1.5*IQR.
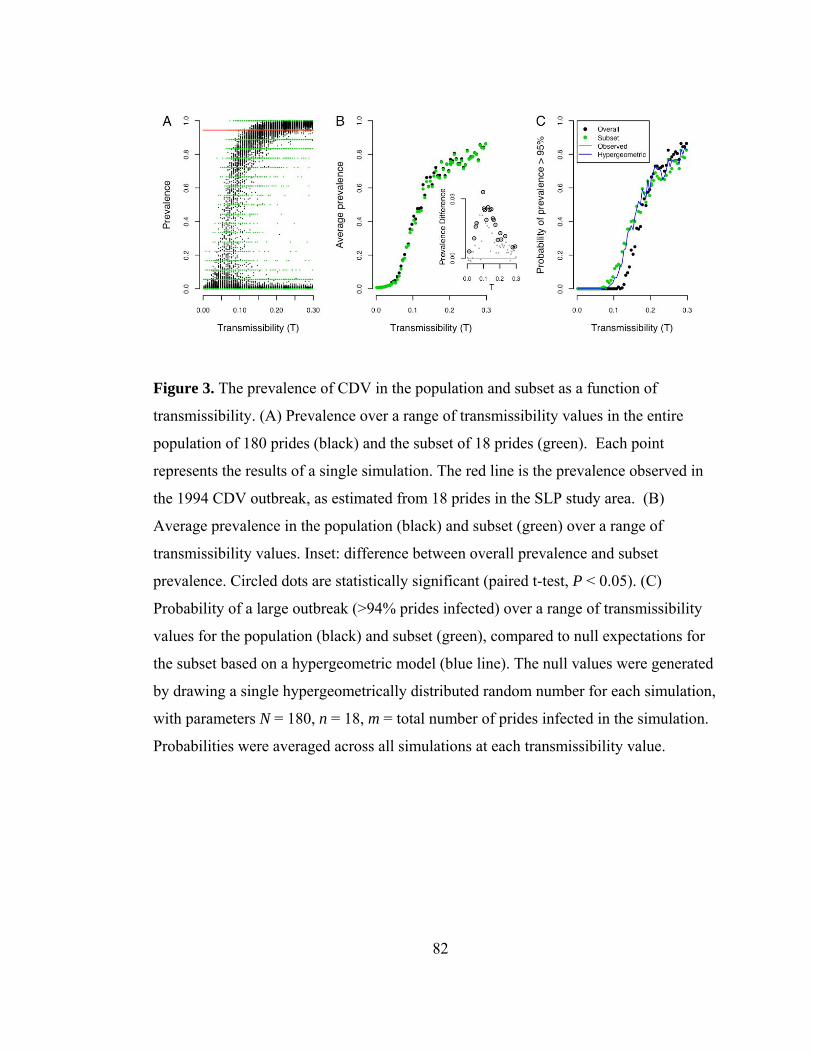
82
Figure 3. The prevalence of CDV in the population and subset as a function of
transmissibility. (A) Prevalence over a range of transmissibility values in the entire
population of 180 prides (black) and the subset of 18 prides (green). Each point
represents the results of a single simulation. The red line is the prevalence observed in
the 1994 CDV outbreak, as estimated from 18 prides in the SLP study area. (B)
Average prevalence in the population (black) and subset (green) over a range of
transmissibility values. Inset: difference between overall prevalence and subset
prevalence. Circled dots are statistically significant (paired t-test, P < 0.05). (C)
Probability of a large outbreak (>94% prides infected) over a range of transmissibility
values for the population (black) and subset (green), compared to null expectations for
the subset based on a hypergeometric model (blue line). The null values were generated
by drawing a single hypergeometrically distributed random number for each simulation,
with parameters N = 180, n = 18, m = total number of prides infected in the simulation.
Probabilities were averaged across all simulations at each transmissibility value.
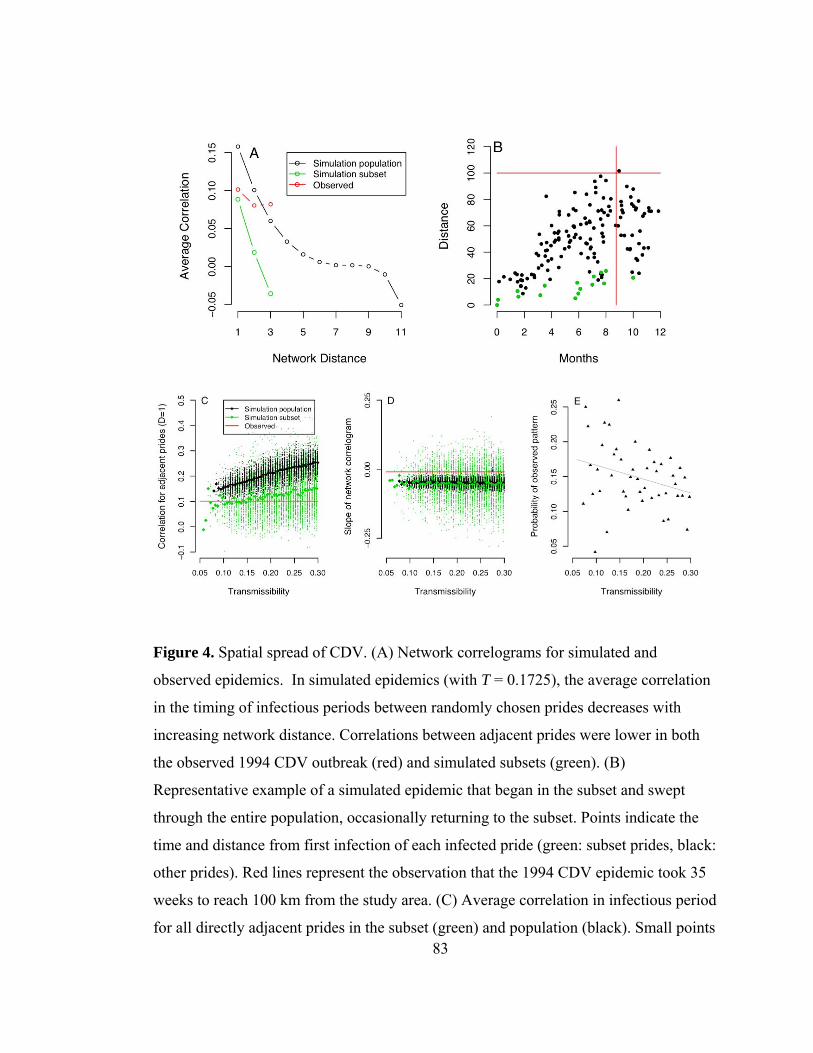
83
Figure 4. Spatial spread of CDV. (A) Network correlograms for simulated and
observed epidemics. In simulated epidemics (with T = 0.1725), the average correlation
in the timing of infectious periods between randomly chosen prides decreases with
increasing network distance. Correlations between adjacent prides were lower in both
the observed 1994 CDV outbreak (red) and simulated subsets (green). (B)
Representative example of a simulated epidemic that began in the subset and swept
through the entire population, occasionally returning to the subset. Points indicate the
time and distance from first infection of each infected pride (green: subset prides, black:
other prides). Red lines represent the observation that the 1994 CDV epidemic took 35
weeks to reach 100 km from the study area. (C) Average correlation in infectious period
for all directly adjacent prides in the subset (green) and population (black). Small points
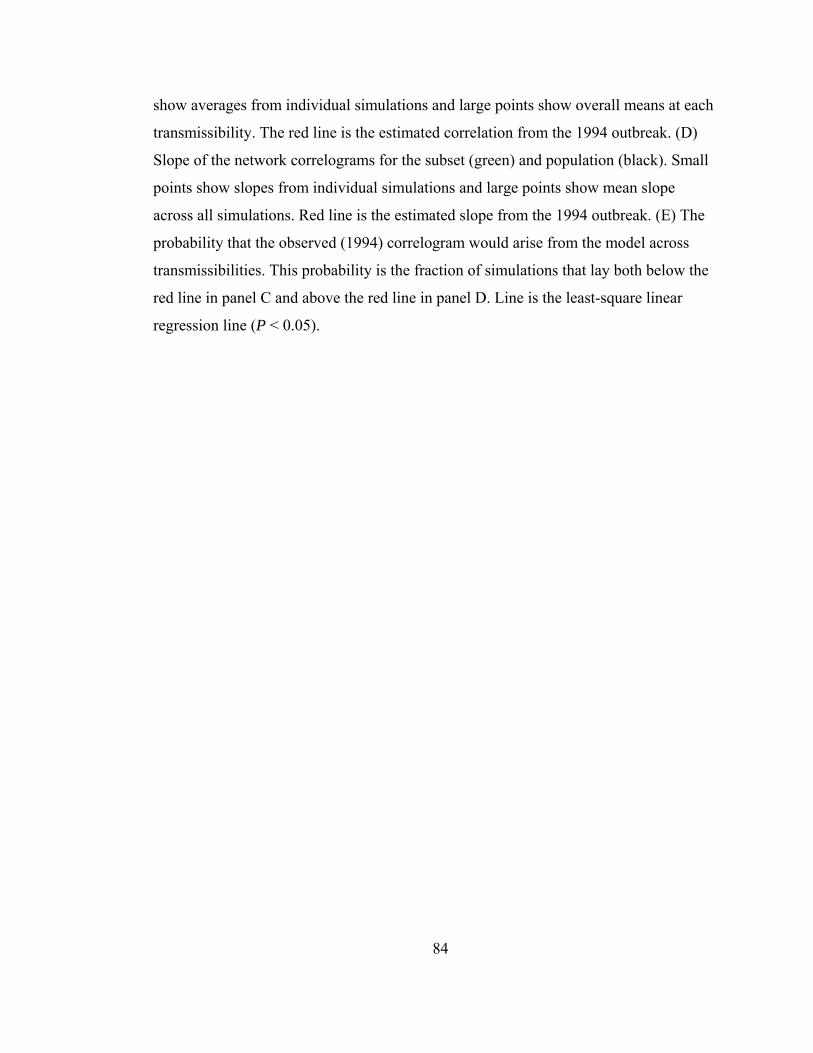
84
show averages from individual simulations and large points show overall means at each
transmissibility. The red line is the estimated correlation from the 1994 outbreak. (D)
Slope of the network correlograms for the subset (green) and population (black). Small
points show slopes from individual simulations and large points show mean slope
across all simulations. Red line is the estimated slope from the 1994 outbreak. (E) The
probability that the observed (1994) correlogram would arise from the model across
transmissibilities. This probability is the fraction of simulations that lay both below the
red line in panel C and above the red line in panel D. Line is the least-square linear
regression line (P < 0.05).
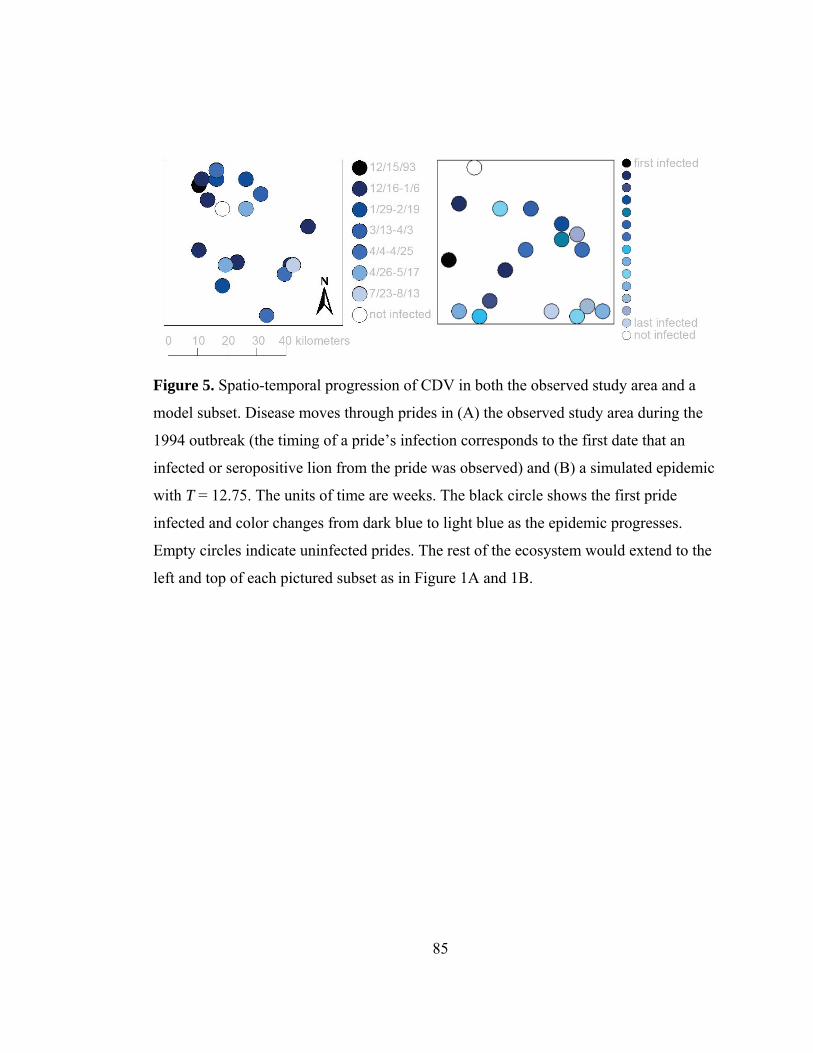
85
Figure 5. Spatio-temporal progression of CDV in both the observed study area and a
model subset. Disease moves through prides in (A) the observed study area during the
1994 outbreak (the timing of a pride’s infection corresponds to the first date that an
infected or seropositive lion from the pride was observed) and (B) a simulated epidemic
with T = 12.75. The units of time are weeks. The black circle shows the first pride
infected and color changes from dark blue to light blue as the epidemic progresses.
Empty circles indicate uninfected prides. The rest of the ecosystem would extend to the
left and top of each pictured subset as in Figure 1A and 1B.
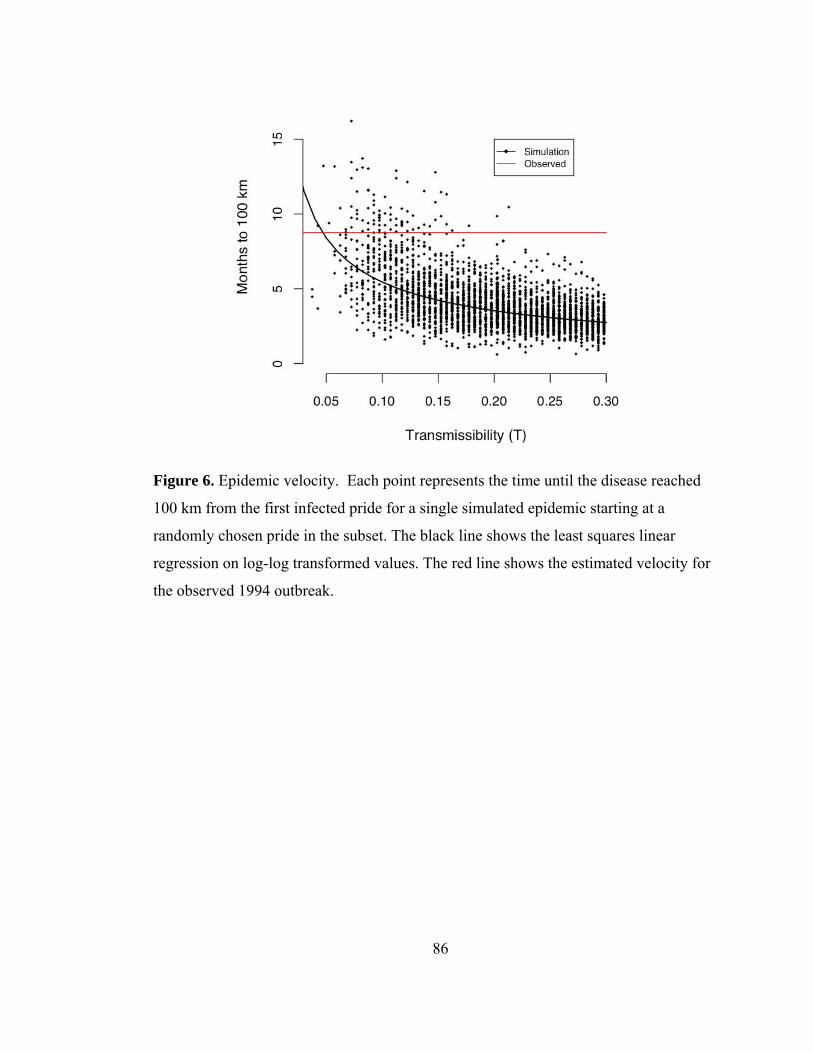
86
Figure 6. Epidemic velocity. Each point represents the time until the disease reached
100 km from the first infected pride for a single simulated epidemic starting at a
randomly chosen pride in the subset. The black line shows the least squares linear
regression on log-log transformed values. The red line shows the estimated velocity for
the observed 1994 outbreak.
87
Figure 7. Probability of observed epidemiological patterns in a simulated outbreak
maintained solely by lion-to-lion transmission. The probability of the observed velocity
is calculated as the fraction of simulations that took at least 35 weeks to reach 100 km.
The probability of the observed prevalence is calculated as the fraction of simulations
that infected at least 17 of the 18 prides in the subset. The red line at probability 0.05
indicates that there is a very limited range of transmissibility at which both patterns
have at least a 5% of occurring. The joint probability is calculated as the fraction of
simulations that exhibited both the observed velocity and prevalence.
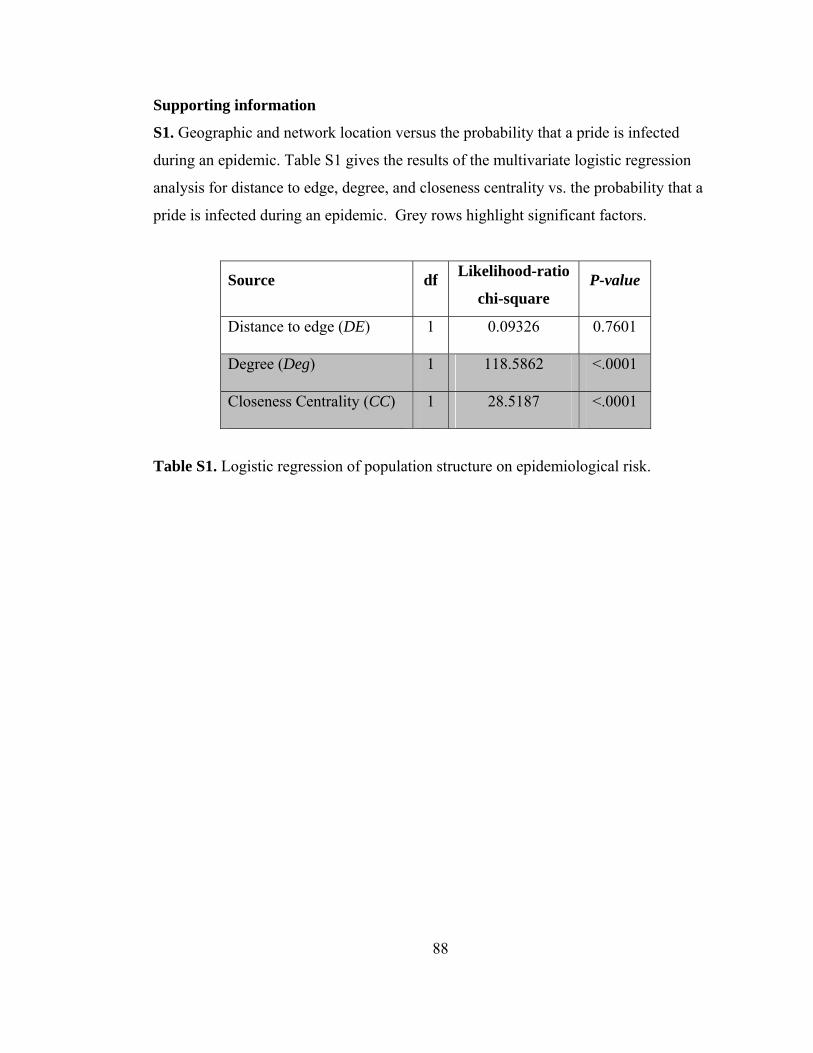
88
Supporting information
S1. Geographic and network location versus the probability that a pride is infected
during an epidemic. Table S1 gives the results of the multivariate logistic regression
analysis for distance to edge, degree, and closeness centrality vs. the probability that a
pride is infected during an epidemic. Grey rows highlight significant factors.
Source df Likelihood-ratio
chi-square P-value
Distance to edge (DE) 1 0.09326 0.7601
Degree (Deg) 1 118.5862 <.0001
Closeness Centrality (CC) 1 28.5187 <.0001
Table S1. Logistic regression of population structure on epidemiological risk.
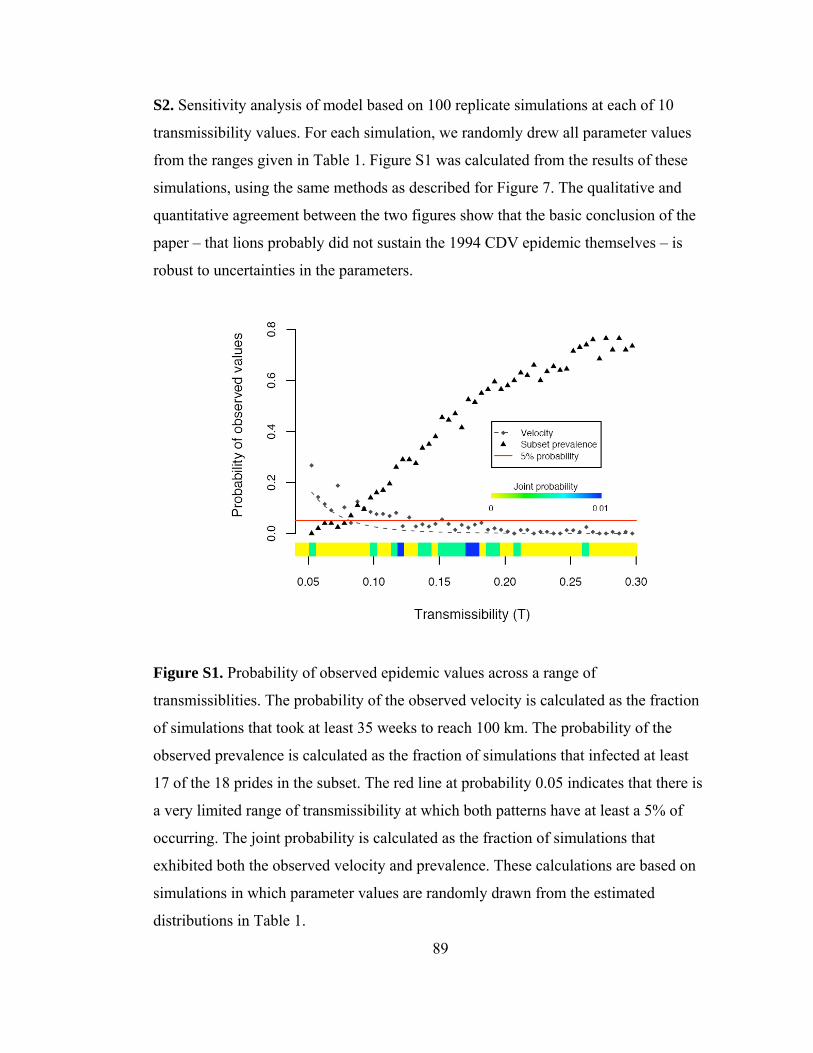
89
S2. Sensitivity analysis of model based on 100 replicate simulations at each of 10
transmissibility values. For each simulation, we randomly drew all parameter values
from the ranges given in Table 1. Figure S1 was calculated from the results of these
simulations, using the same methods as described for Figure 7. The qualitative and
quantitative agreement between the two figures show that the basic conclusion of the
paper – that lions probably did not sustain the 1994 CDV epidemic themselves – is
robust to uncertainties in the parameters.
Figure S1. Probability of observed epidemic values across a range of
transmissiblities. The probability of the observed velocity is calculated as the fraction
of simulations that took at least 35 weeks to reach 100 km. The probability of the
observed prevalence is calculated as the fraction of simulations that infected at least
17 of the 18 prides in the subset. The red line at probability 0.05 indicates that there is
a very limited range of transmissibility at which both patterns have at least a 5% of
occurring. The joint probability is calculated as the fraction of simulations that
exhibited both the observed velocity and prevalence. These calculations are based on
simulations in which parameter values are randomly drawn from the estimated
distributions in Table 1.
90
CHAPTER 4
Dynamics of a multihost pathogen in a carnivore community§§
Summary
1. We provide the first theoretical analysis of multihost disease dynamics to incorporate
social behavior and contrasting rates of within- and between-group disease
transmission.
2. A stochastic susceptible-infected-recovered (SIR) model of disease transmission
involving one to three sympatric species was built to mimic the 1994 Serengeti canine
distemper virus outbreak, which infected a variety of carnivores with widely ranging
social structures. The model successfully mimicked the erratic and discontinuous
spatial pattern of lion deaths observed in the Serengeti lions under a reasonable range of
parameter values, but only when one to two other species repeatedly transmitted the
virus to the lion population.
3. The outputs from our model suggest several principles that will apply to most directly
transmitted multihost pathogens: (i) differences in social structure can significantly
influence the size, velocity, and spatial pattern of a multihost epidemic; and (ii) social
structures that permit higher intraspecific neighbor-to-neighbor transmission are the
most likely to transmit disease to other species; whereas (iii) species with low neighbor-
to-neighbor intraspecific transmission suffer the greatest costs from interspecific
transmission.
§§ This chapter was accepted for publication as: Craft, M.E., P. L. Hawthorne, C. Packer & A. P. Dobson. (2008) Dynamics of a multi-host pathogen in a carnivore community. Journal of Animal Ecology, 77, 1257-1264.
91
Introduction
Multihost pathogens are likely to exhibit different spatiotemporal dynamics than
pathogens that only infect a single host species. From one perspective, multiple hosts
could be considered an additional form of heterogeneity that divides the total host
population into subpopulations, between which transmission occurs at a different rate
than within each subpopulation. Single-species “subpopulation” approaches (with
multiple scales of mixing) have been successfully developed to examine disease
transmission between sexes in the case of sexually transmitted diseases (May &
Anderson 1987, Anderson 1991); between children of different ages (measles, mumps,
rubella) (Anderson & May 1985); people living in regions, cities, and villages of
different sizes (measles, influenza) (May & Anderson 1984, Grenfell & Bolker 1998,
Grenfell, Bjornstad & Kappey 2001, Viboud et al. 2006); and hosts living as a
metapopulation in different patches of habitat (Swinton et al. 1998, McCallum &
Dobson 2002, McCallum & Dobson 2006).
However, using subpopulation approaches on multihost pathogens is not as
straightforward as it seems; different host species might vary in their response to
infection, have varying contact patterns based on social behavior, and have different
spatial distributions across the landscape (Dobson 2004). Due to these complexities,
previous work on multihost models has made simplifying assumptions and assumed that
each host population is well mixed, and specifically ignored heterogeneities due to
social organization (Dobson 2004, Fenton & Pedersen 2005, McCallum & Dobson
2006). We have, therefore, developed a general stochastic, spatial model of a disease
outbreak in two and three host-species communities with widely ranging social
structure. Our model structure is bases on a 1994 outbreak of canine distemper virus
(CDV) in the Serengeti ecosystem that killed one-third of the lion population (Panthera
leo) (Roelke-Parker et al. 1996, Kock et al. 1998, Packer et al. 1999). CDV is a
contagious multihost virus spread by aerosol inhalation, which affects all carnivore
families. Infected animals either die or obtain lifelong immunity (Appel 1987, Williams
2001).
92
Because lions are territorial, and most opportunities for disease transmission
between social groups involve immediate neighbors (M.E.C., unpublished data), the
erratic and discontinuous spatial pattern of CDV spread in the 1994 epidemic seems
unlikely to have resulted solely from lion-to-lion transmission (Fig. 1). During the 1994
outbreak, the same CDV variant was responsible for deaths in spotted hyenas (Crocuta
crocuta) (Haas et al. 1996, Roelke-Parker et al. 1996, Carpenter et al. 1998), while
jackals (Canis adustus, Canis aureus, Canis mesomelas) also showed CDV-like
symptoms and subsequently tested positive for CDV antibodies (Alexander et al. 1994,
Roelke-Parker et al. 1996).
Hyenas and jackals had the potential to transmit CDV to lions, as the two
species are more abundant than lions (Campbell & Borner 1986), and frequently
interact with lions at kills (Schaller 1972, Cleaveland et al. 2008). While lions, hyenas,
jackals, bat-eared foxes (Ototcyon megalotis) and potentially many other carnivore
species (e.g. leopards, Panthera pardus) were affected by the 1994 CDV outbreak
(Roelke-Parker et al. 1996), our most detailed data come from the long-term monitoring
of the Serengeti lions (Packer et al. 2005). We therefore treat lions as the sentinel
species when comparing the observed pattern of infection in the 1994 lion population
with the model’s CDV spatial spread.
Questions
We developed a stochastic simulation model to capture the general spatial and temporal
patterns observed in the 1994 CDV outbreak. Although the model is based on the lion
outbreak, it has been developed to provide more general insights into disease outbreaks
in other communities, where multiple host species are susceptible to infection by the
same pathogen. In particular, we ask whether differences in territorial social structure
affect the spatial and temporal pattern of disease outbreaks, and if the time course of the
epidemic is sensitive to different rates of within- vs. between-species interaction. Social
organization due to territorial behavior divides intraspecific transmission into two major
components: within and between groups. Within-group transmission can occur during
normal social interactions (feeding, grooming), whereas between-group transmission
93
can occur during fights over food and territory, or during immigration events.
Interspecific transmission occurs when multiple species feed together or during
intraguild predation events.
We performed a set of simulations that examine the epidemic dynamics of a
directly transmitted pathogen involving multiple host species with contrasting social
organizations (e.g. isolated vs. well connected territorial structures), characterized by
different within- and between-group transmission rates. After exploring the epidemic
dynamics for each species in isolation, we examine the consequences of coexistence
between pairs of species using high and low rates of interspecific transmission. Finally
we ask whether the coexistence of three hosts differs in any substantive way from any
two-species scenario.
We use the simulation to ask:
• How do within- and between-group contact patterns affect the incidence, rate of
spread, probability, and spatial pattern of infection in multiple hosts with
coexisting pathogens?
• How do the model results compare with the observed outbreak?
Modeling Approach
The model describes the spatial and temporal dynamics of a pathogen in a spatially
structured, multihost community. The habitat is divided into a two-dimensional grid of
625 patches, with each patch containing a local population of each species. Because of
the natural boundaries of the Serengeti ecosystem, we chose not to wrap the edges of
the simulated habitat. Infection is spread within local populations, between different
species occupying the same patch, and between any populations/species occupying the
eight neighboring patches. The pathogen is modeled in a stochastic, density-dependent,
susceptible-infected-recovered (SIR) framework. The model was programmed in C.
The importance of group size to pathogen persistence is well known (Swinton et
al. 2001, Park, Gubbins & Gilligan 2002, McCallum & Dobson 2006), so we held
group size constant across species and across social groups in order to isolate the effect
of social organization. Each patch begins with 10 individuals of each species. An
94
individual may be categorized in one of 3 states: S (susceptible), I (infected) or R
(recovered). All individuals, except an initially infected source, begin the simulation in
state S. Transitions occur from S → I (infection) and from I → R (recovery). During
each time-step, we determine the probability of a susceptible individual becoming
infected, pS →I , and of an infected individual recovering (either dying or obtaining
lifelong immunity), pI →R . The number of actual transitions is drawn from a binomial
distribution, B (n, p). For the infection transition, n is the number of susceptible
individuals in the group, while for the recovery transition, n is the number of infected
individuals.
The probability that a susceptible individual, i, will be infected depends on the
number of infections in its own social group, interspecific transmission within the same
patch, and intra- and interspecific transmission from neighboring patches. Two ‘who
acquires infection from whom’ matrices (WAIFW; Anderson & May 1991) characterize
the force of infection between individuals of each group; let βW ,ij represent within-patch
transmissions andβB ,ij represent between-patch transmissions). The total probability of
infection is given by:
1− exp − βW ,ij I jj ∈SL
∑ + βB ,ij I jj ∈SN
∑⎛
⎝ ⎜ ⎜
⎞
⎠ ⎟ ⎟
⎡
⎣ ⎢ ⎢
⎤
⎦ ⎥ ⎥ ,
where SL is the set of groups sharing the local patch and SN represents the groups in
neighboring patches and Ij is the number of infected individuals in group j. Each
infected individual has a fixed probability, μ , of recovering.
Interspecific β values are taken as a weighted average of the intraspecific values
so that
βij = β ji =12
c(β ii + β jj ),
where c describes the level of interspecific interactions (or coupling). We used two
different values of c, designated “high” and “low” (0.2, 0.01, respectively) for the multi-
species simulations.
The value of the average reproductive rate of the pathogen is defined as R0. In
general a pathogen can only persist when R0 is >1 (when each infected individual

95
infects at least one other individual). Species’ within- and between-patch transmission
rates were chosen so that the R0 values in a single-species habitat equaled 2.2. CDV is
closely related to phocine distemper virus, for which the empirically estimated R0 is 2.8
(Swinton et al. 1998). Different social systems were modeled by choosing different
relative rates of within- and between-group transmission (Table 1).
In the Serengeti, the African lion lives in territorial social groups (prides)
consisting of related females and their dependent offspring. Before the 1994 epidemic,
average pride sizes (excluding cubs <3 months) were 10 individuals (M.E.C.
unpublished data) defending territories ranging from 15 to 150 km2 (Mosser 2008).
Lions form fission-fusion groups where pridemates are in frequent physical contact, but
only occasionally contact their neighbors during territorial defense or fights over food
(Schaller 1972, M.E.C, unpublished data). Thus the within-patch (or within-pride)
transmission rate for lions will be far higher (R0 > 1) than between-patch transmission
(R0 < 1).
The spotted hyena lives in social groups (clans) averaging about 45 individuals
per clan (Hofer & East 1995). These hierarchical clans consist of related females and
immigrant males who defend exclusive group territories (16-55 km2) and encounter
their neighbors during territorial clashes, or when feeding at the same carcass (Hofer &
East 1993a). Additionally, Serengeti hyenas have a unique feeding adaptation where
they commute to migratory prey and associate with non-clan members at waterholes
and resting sites (Hofer & East 1993b). Thus hyenas are expected to have high within-
patch transmission (but contact each other less than lions), as well as high between-
patch transmission.
Jackals live in small family groups of two to four who are in close contact with
each other (Moehlman 1983). Serengeti golden and black-backed jackals actively
defend discrete territories (≈2-4 km2) from neighbors; they also make extraterritorial
forays to water sources and large mammalian kills (Moehlman 1983). We therefore
consider each “patch” of 10 individuals to consist of two to five loosely connected
groups of jackals. Although they interact with each other less frequently than
96
pridemates, jackals contact individuals from neighboring patches more frequently than
do lions.
Infections were introduced in a single individual at the edge of the grid to mimic
a pathogen introduced from domestic dogs at the edge of the park (Cleaveland et al.
2000). We ran 150 simulations for each combination of species. To check whether
changes in disease dynamics were due to social structure, rather than to a simple
increase in overall population size, we ran controls where the same species was coupled
with itself within separate partitions of the same patch. Each simulation ran until all
infections disappeared. For each species, we also varied the within- and between-group
transmission rates to confirm that the results presented here were representative of the
overall range of possible outcomes.
We used the package NCF (Bjornstad & Falck 2001) for R (R Development
Core Team, 2006) to evaluate the spatial pattern in both the simulated and observed
outbreaks. For each time-step (day) in the simulated outbreaks, we entered the number
of active infections per grid square (pride) into the nonparametric correlation function
(ncf). Because of the coarse-grained resolution of within-pride mortality in 1994, we
constructed within-pride epidemic curves from the simulated outbreaks by aligning the
simulated start dates, averaging the number of infections at each time-step, and
rounding the values into discrete integers. We combined these simulated within-pride
epidemic curves with the observed first death date per pride and spatial location, to
create a complete time-series for the observed outbreak.
Results
Single-species models.
Depending on contact structure, single-species epidemics produced epidemic curves
that varied in impact (average cumulative number of infected hosts by the end of an
outbreak), velocity (cumulative number infected per unit time), and probability and
persistence of an outbreak (Figs 2 and 3). The outbreaks in hyenas produced the most
infected individuals, spread with the highest velocity, and had the highest percent of
runs with epidemics (defined as lasting longer than 200 time steps). In contrast, lions
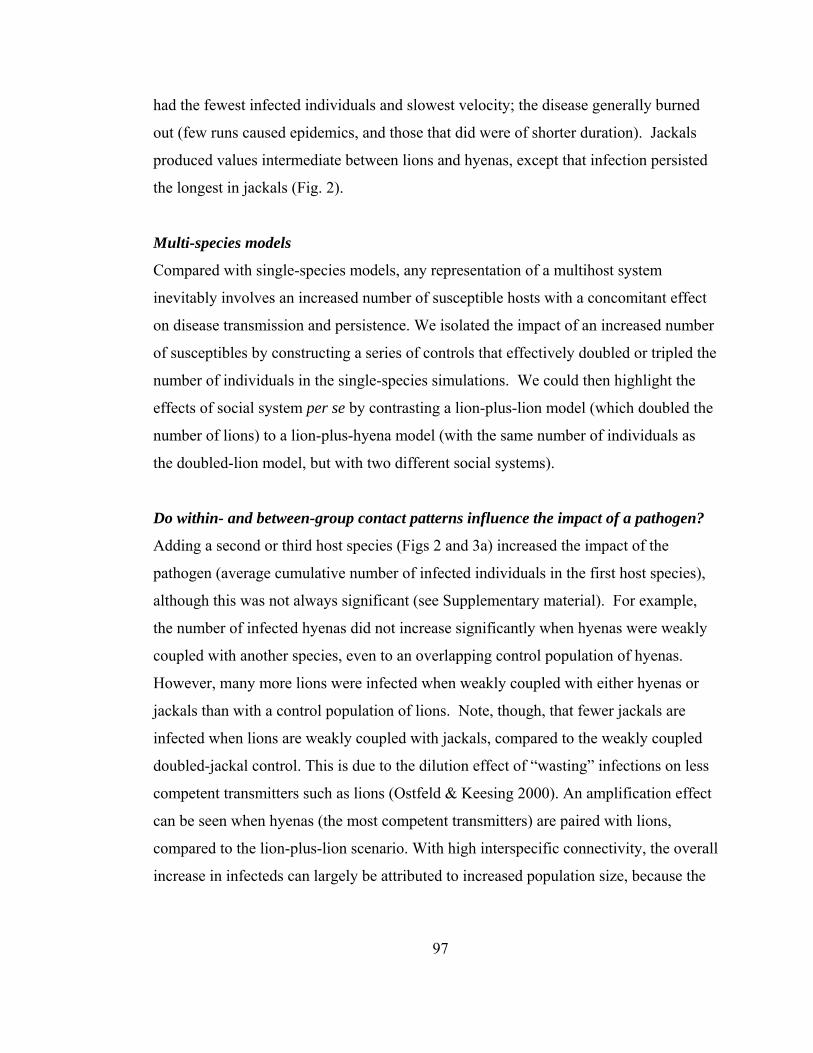
97
had the fewest infected individuals and slowest velocity; the disease generally burned
out (few runs caused epidemics, and those that did were of shorter duration). Jackals
produced values intermediate between lions and hyenas, except that infection persisted
the longest in jackals (Fig. 2).
Multi-species models
Compared with single-species models, any representation of a multihost system
inevitably involves an increased number of susceptible hosts with a concomitant effect
on disease transmission and persistence. We isolated the impact of an increased number
of susceptibles by constructing a series of controls that effectively doubled or tripled the
number of individuals in the single-species simulations. We could then highlight the
effects of social system per se by contrasting a lion-plus-lion model (which doubled the
number of lions) to a lion-plus-hyena model (with the same number of individuals as
the doubled-lion model, but with two different social systems).
Do within- and between-group contact patterns influence the impact of a pathogen?
Adding a second or third host species (Figs 2 and 3a) increased the impact of the
pathogen (average cumulative number of infected individuals in the first host species),
although this was not always significant (see Supplementary material). For example,
the number of infected hyenas did not increase significantly when hyenas were weakly
coupled with another species, even to an overlapping control population of hyenas.
However, many more lions were infected when weakly coupled with either hyenas or
jackals than with a control population of lions. Note, though, that fewer jackals are
infected when lions are weakly coupled with jackals, compared to the weakly coupled
doubled-jackal control. This is due to the dilution effect of “wasting” infections on less
competent transmitters such as lions (Ostfeld & Keesing 2000). An amplification effect
can be seen when hyenas (the most competent transmitters) are paired with lions,
compared to the lion-plus-lion scenario. With high interspecific connectivity, the overall
increase in infecteds can largely be attributed to increased population size, because the
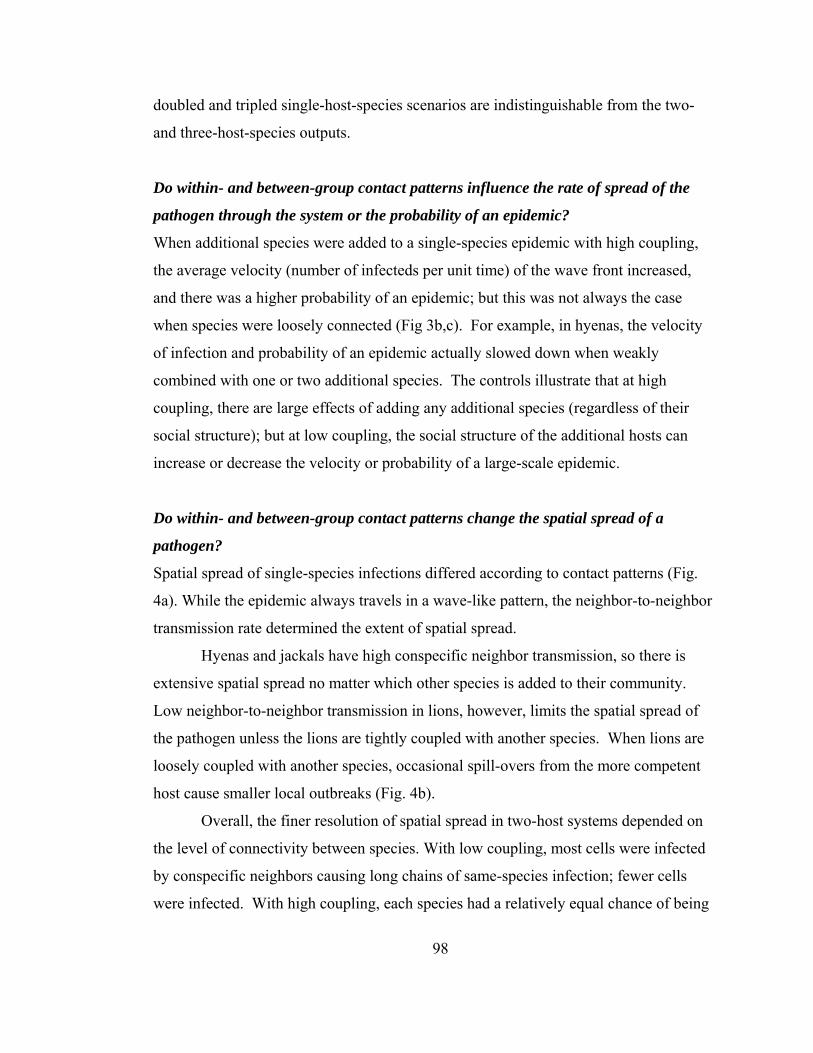
98
doubled and tripled single-host-species scenarios are indistinguishable from the two-
and three-host-species outputs.
Do within- and between-group contact patterns influence the rate of spread of the
pathogen through the system or the probability of an epidemic?
When additional species were added to a single-species epidemic with high coupling,
the average velocity (number of infecteds per unit time) of the wave front increased,
and there was a higher probability of an epidemic; but this was not always the case
when species were loosely connected (Fig 3b,c). For example, in hyenas, the velocity
of infection and probability of an epidemic actually slowed down when weakly
combined with one or two additional species. The controls illustrate that at high
coupling, there are large effects of adding any additional species (regardless of their
social structure); but at low coupling, the social structure of the additional hosts can
increase or decrease the velocity or probability of a large-scale epidemic.
Do within- and between-group contact patterns change the spatial spread of a
pathogen?
Spatial spread of single-species infections differed according to contact patterns (Fig.
4a). While the epidemic always travels in a wave-like pattern, the neighbor-to-neighbor
transmission rate determined the extent of spatial spread.
Hyenas and jackals have high conspecific neighbor transmission, so there is
extensive spatial spread no matter which other species is added to their community.
Low neighbor-to-neighbor transmission in lions, however, limits the spatial spread of
the pathogen unless the lions are tightly coupled with another species. When lions are
loosely coupled with another species, occasional spill-overs from the more competent
host cause smaller local outbreaks (Fig. 4b).
Overall, the finer resolution of spatial spread in two-host systems depended on
the level of connectivity between species. With low coupling, most cells were infected
by conspecific neighbors causing long chains of same-species infection; fewer cells
were infected. With high coupling, each species had a relatively equal chance of being
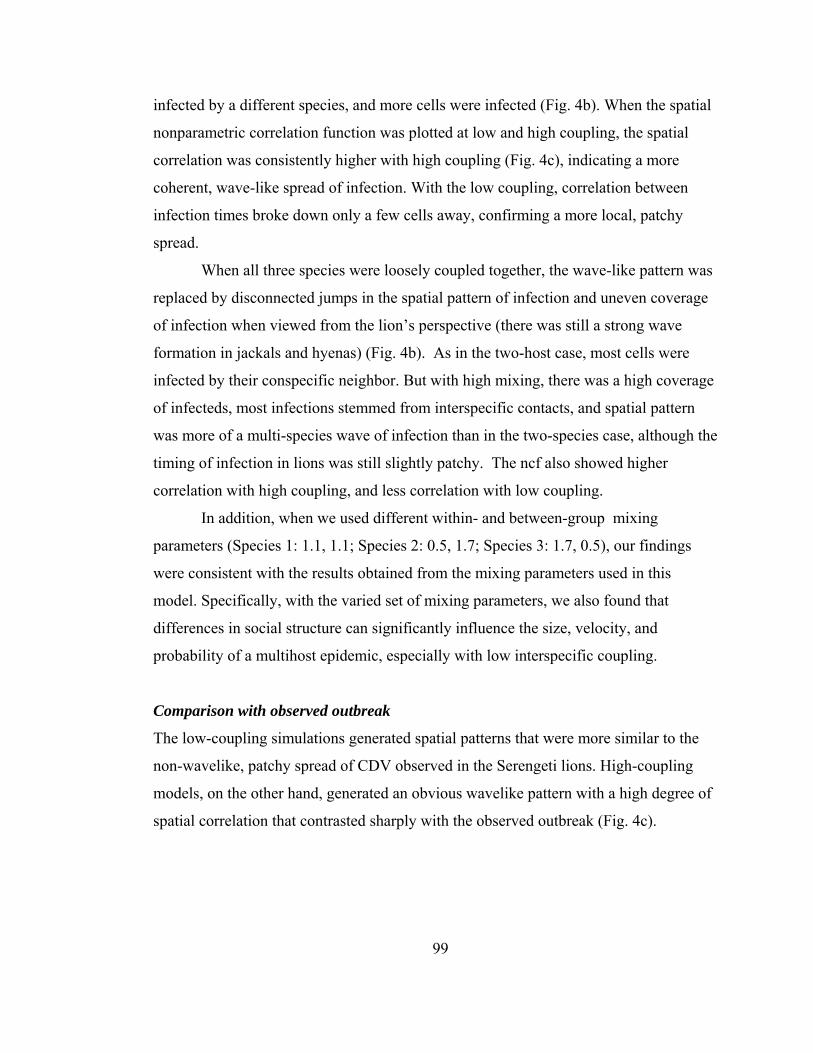
99
infected by a different species, and more cells were infected (Fig. 4b). When the spatial
nonparametric correlation function was plotted at low and high coupling, the spatial
correlation was consistently higher with high coupling (Fig. 4c), indicating a more
coherent, wave-like spread of infection. With the low coupling, correlation between
infection times broke down only a few cells away, confirming a more local, patchy
spread.
When all three species were loosely coupled together, the wave-like pattern was
replaced by disconnected jumps in the spatial pattern of infection and uneven coverage
of infection when viewed from the lion’s perspective (there was still a strong wave
formation in jackals and hyenas) (Fig. 4b). As in the two-host case, most cells were
infected by their conspecific neighbor. But with high mixing, there was a high coverage
of infecteds, most infections stemmed from interspecific contacts, and spatial pattern
was more of a multi-species wave of infection than in the two-species case, although the
timing of infection in lions was still slightly patchy. The ncf also showed higher
correlation with high coupling, and less correlation with low coupling.
In addition, when we used different within- and between-group mixing
parameters (Species 1: 1.1, 1.1; Species 2: 0.5, 1.7; Species 3: 1.7, 0.5), our findings
were consistent with the results obtained from the mixing parameters used in this
model. Specifically, with the varied set of mixing parameters, we also found that
differences in social structure can significantly influence the size, velocity, and
probability of a multihost epidemic, especially with low interspecific coupling.
Comparison with observed outbreak
The low-coupling simulations generated spatial patterns that were more similar to the
non-wavelike, patchy spread of CDV observed in the Serengeti lions. High-coupling
models, on the other hand, generated an obvious wavelike pattern with a high degree of
spatial correlation that contrasted sharply with the observed outbreak (Fig. 4c).
100
Discussion
These results have implications that extend beyond pathogens of Serengeti carnivores.
Our model suggests a number of general principles that will apply to most directly
transmitted pathogens, which can infect multiple host species: (1) differences in social
structure can significantly influence the size, velocity, and probability of a multihost
epidemic; (2) social structures that permit higher intraspecific neighbor-to-neighbor
transmission are the most likely to transmit disease to other species; and (3) species
with low neighbor-to-neighbor intraspecific transmission are most vulnerable to
interspecific transmission.
Deterministic models by Holt & Pickering (1985); Begon and Bowers (1994);
Dobson (Dobson 2004); Woolhouse, Taylor & Haydon (2001); and Dobson (2004) have
consistently emphasized the importance of multiple scales of mixing, specifically the
relative rate of within- vs. between-species transmission in determining the transient
dynamics of infection. When interspecific transmission is high, our stochastic spatial
model shows that the presence of multiple-host species is essentially equivalent to a
larger susceptible host population. More hosts are infected, and the pathogen may have
a significantly higher impact in species that could not sustain an outbreak in isolation.
The combined population of species essentially acts as a single super species,
incorporating the strongest parameters of each species. Thus the rate of disease spread
can increase with the number of co-existing host species; the rate of interspecific
transmission increases the cumulative number of hosts infected in all susceptible host
populations; the probability of an extensive outbreak increases; and the number of
individuals infected (and potentially dying) may be higher in host populations that
would otherwise be too small or too dispersed to sustain the pathogen by themselves.
Furthermore, adding a second species that is more effective at transmission produces an
amplification effect; while a less-effective second species can cause a dilution effect
(Keesing, Holt & Ostfeld 2006).
In the observed 1994 outbreak, hyenas and/or jackals could have feasibly acted
as amplifying species by spreading the CDV through the more isolated lion prides and
causing long-distance leaps in infection among prides. When we compared the observed
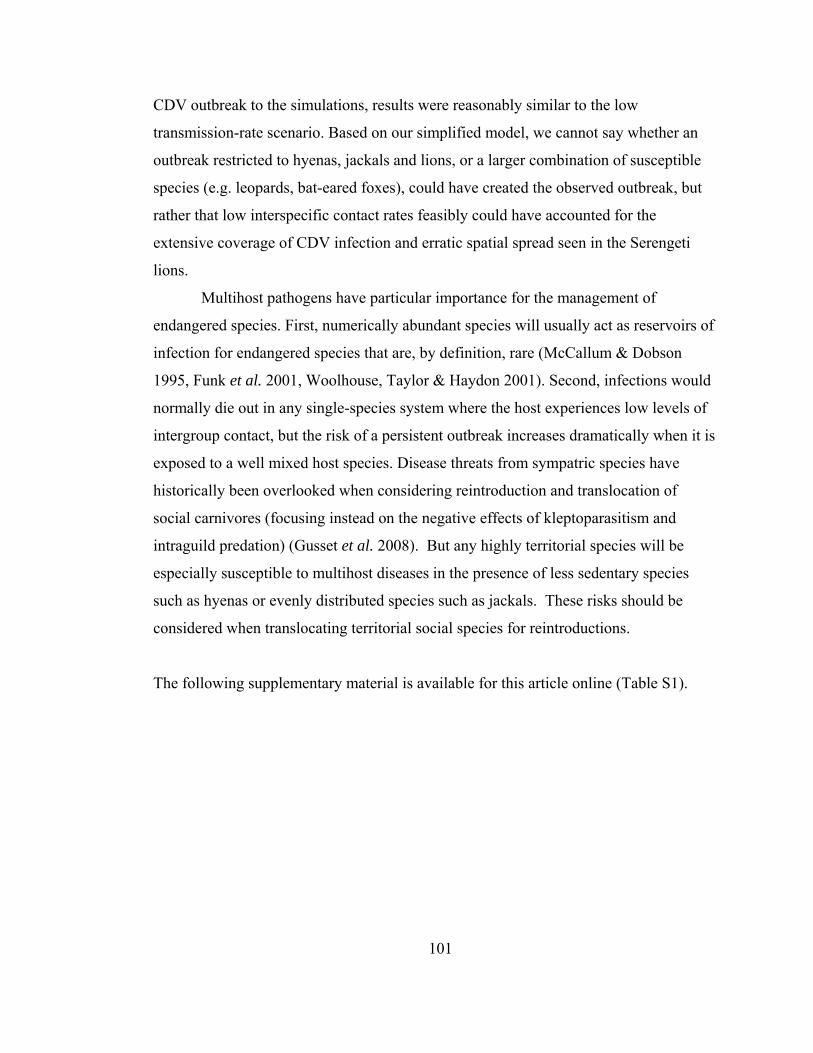
101
CDV outbreak to the simulations, results were reasonably similar to the low
transmission-rate scenario. Based on our simplified model, we cannot say whether an
outbreak restricted to hyenas, jackals and lions, or a larger combination of susceptible
species (e.g. leopards, bat-eared foxes), could have created the observed outbreak, but
rather that low interspecific contact rates feasibly could have accounted for the
extensive coverage of CDV infection and erratic spatial spread seen in the Serengeti
lions.
Multihost pathogens have particular importance for the management of
endangered species. First, numerically abundant species will usually act as reservoirs of
infection for endangered species that are, by definition, rare (McCallum & Dobson
1995, Funk et al. 2001, Woolhouse, Taylor & Haydon 2001). Second, infections would
normally die out in any single-species system where the host experiences low levels of
intergroup contact, but the risk of a persistent outbreak increases dramatically when it is
exposed to a well mixed host species. Disease threats from sympatric species have
historically been overlooked when considering reintroduction and translocation of
social carnivores (focusing instead on the negative effects of kleptoparasitism and
intraguild predation) (Gusset et al. 2008). But any highly territorial species will be
especially susceptible to multihost diseases in the presence of less sedentary species
such as hyenas or evenly distributed species such as jackals. These risks should be
considered when translocating territorial social species for reintroductions.
The following supplementary material is available for this article online (Table S1).
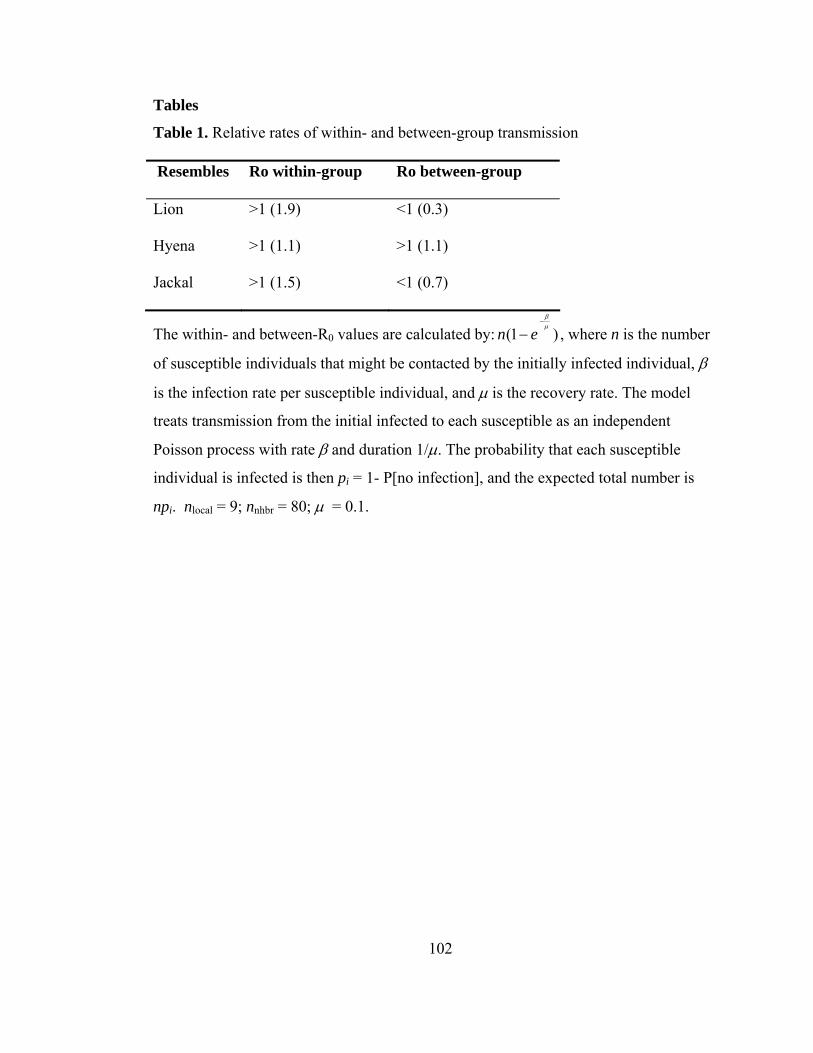
102
Tables
Table 1. Relative rates of within- and between-group transmission
Resembles Ro within-group Ro between-group
Lion >1 (1.9) <1 (0.3)
Hyena >1 (1.1) >1 (1.1)
Jackal >1 (1.5) <1 (0.7)
The within- and between-R0 values are calculated by: n(1− e−
βμ
) , where n is the number
of susceptible individuals that might be contacted by the initially infected individual, β
is the infection rate per susceptible individual, and μ is the recovery rate. The model
treats transmission from the initial infected to each susceptible as an independent
Poisson process with rate β and duration 1/μ. The probability that each susceptible
individual is infected is then pi = 1- P[no infection], and the expected total number is
npi. nlocal = 9; nnhbr = 80; μ = 0.1.
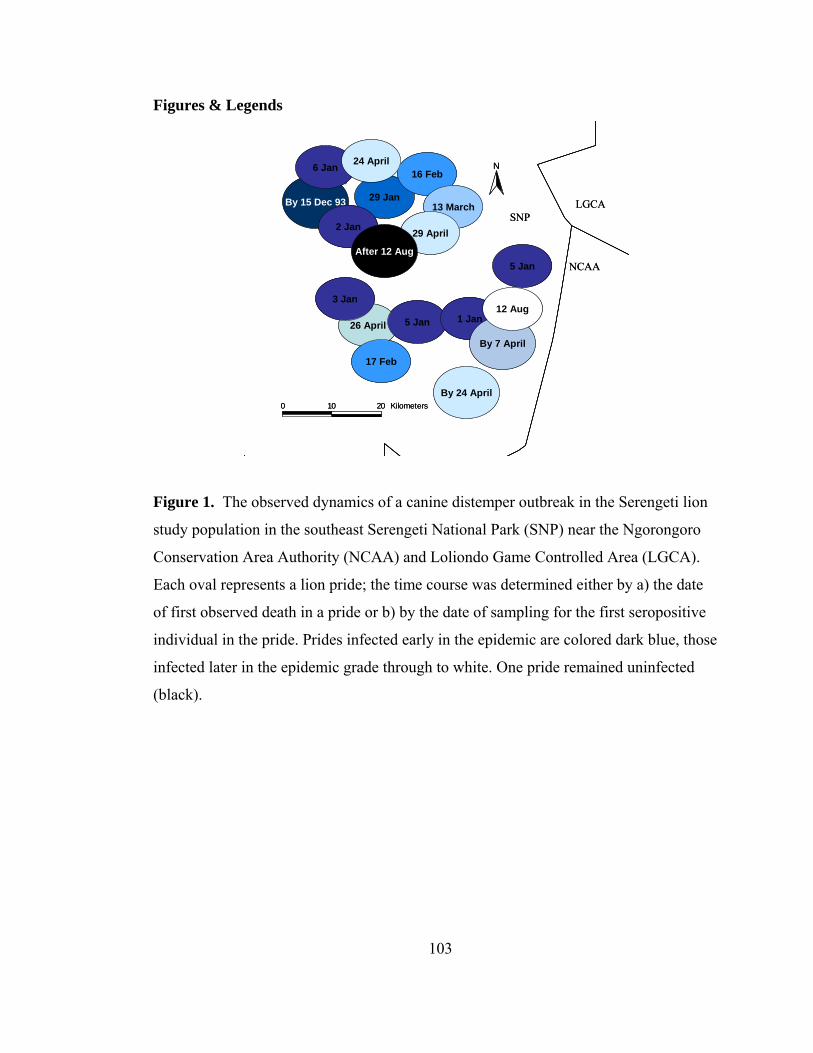
103
Figures & Legends
#
#
#
#
#
#
#
#
#
#
#
#
###
#
#
#
0 10 20 Kilometers
N
26 April
LGCA
NCAA
SNP
By 24 April
By 15 Dec 93
5 Jan
3 Jan
5 Jan
29 Jan
16 Feb
13 March
6 Jan
2 Jan
24 April
1 Jan
17 Feb
29 April
After 12 Aug
By 7 April
12 Aug
#
#
#
#
#
#
#
#
#
#
#
#
###
#
#
#
0 10 20 Kilometers
N
26 April
LGCA
NCAA
SNP
By 24 April
By 15 Dec 93
5 Jan
3 Jan
5 Jan
29 Jan
16 Feb
13 March
6 Jan
2 Jan
24 April
1 Jan
17 Feb
29 April
After 12 Aug
By 7 April
12 Aug
Figure 1. The observed dynamics of a canine distemper outbreak in the Serengeti lion
study population in the southeast Serengeti National Park (SNP) near the Ngorongoro
Conservation Area Authority (NCAA) and Loliondo Game Controlled Area (LGCA).
Each oval represents a lion pride; the time course was determined either by a) the date
of first observed death in a pride or b) by the date of sampling for the first seropositive
individual in the pride. Prides infected early in the epidemic are colored dark blue, those
infected later in the epidemic grade through to white. One pride remained uninfected
(black).
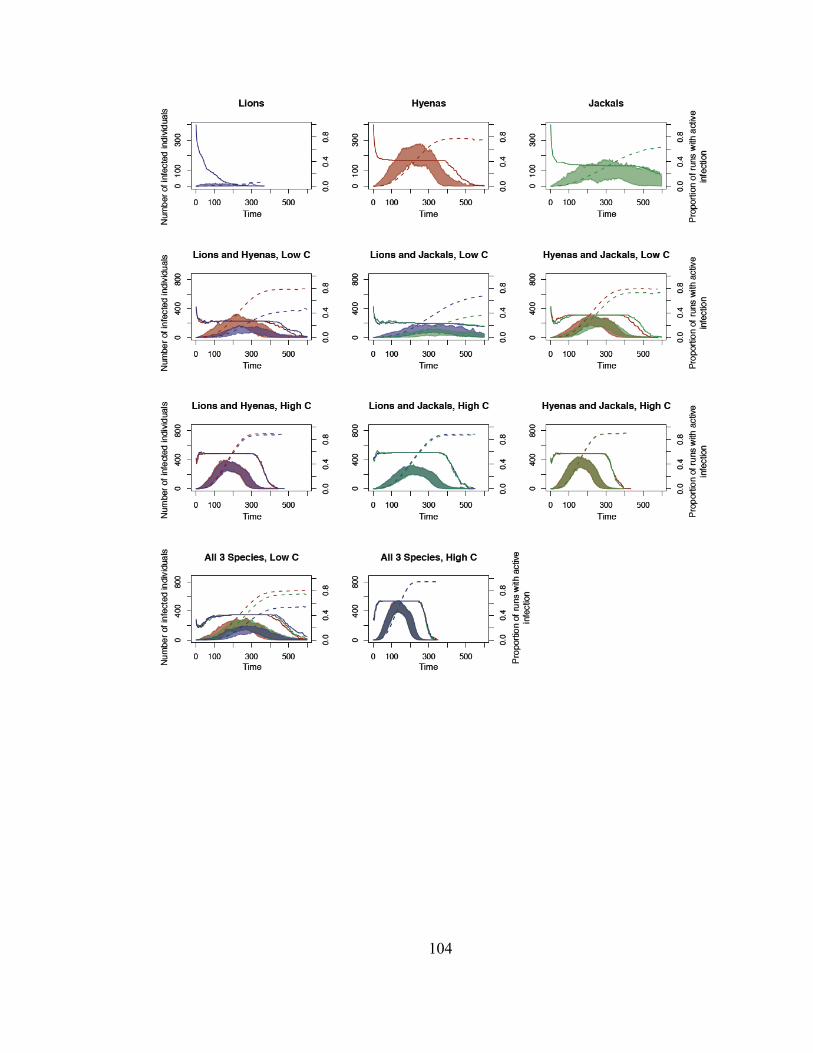
104
105
Figure 2. Temporal dynamics of simulated epidemics. Single species epidemics in
lions, jackals, and hyenas and multiple species epidemics when co-existing species are
weakly vs. highly coupled (low C vs. high C). Colored zones indicate the 10-90%
quantiles of the number of infecteds in each species in runs where infections were still
present (left y-axis). Solid lines, proportions of runs with an infection still present (right
y-axis). Dashed lines, cumulative proportion of individuals that became infected during
the course of the epidemic. Population size for each species, 6250 individuals.
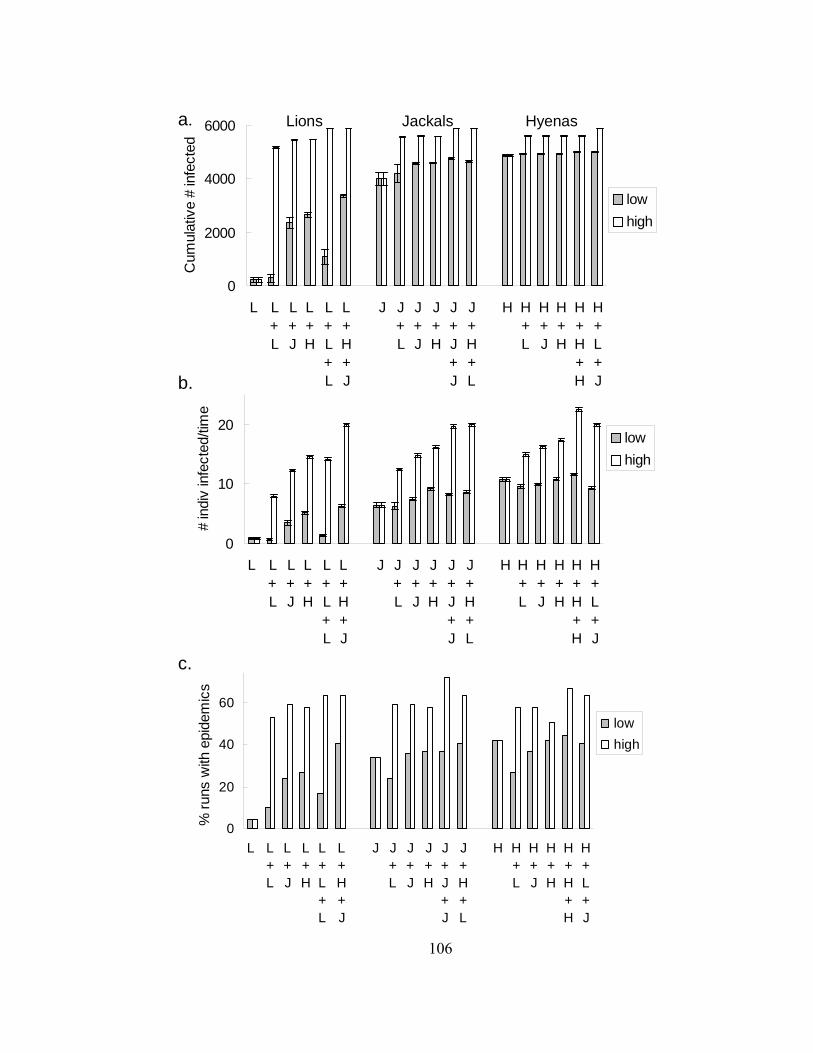
106
0
20
40
60
L L+L
L+J
L+H
L+L+L
L+H+J
J J+L
J+J
J+H
J+J+J
J+H+L
H H+L
H+J
H+H
H+H+H
H+L+J
% ru
ns w
ith e
pide
mic
s
lowhigh
0
10
20
L L+L
L+J
L+H
L+L+L
L+H+J
J J+L
J+J
J+H
J+J+J
J+H+L
H H+L
H+J
H+H
H+H+H
H+L+J
# in
div
infe
cted
/tim
e
lowhigh
0
2000
4000
6000
L L+L
L+J
L+H
L+L+L
L+H+J
J J+L
J+J
J+H
J+J+J
J+H+L
H H+L
H+J
H+H
H+H+H
H+L+J
Cum
ulat
ive
# in
fect
edlowhigh
a.
b.
c.
Lions HyenasJackals
107
Figure 3. Cumulative number of infecteds, velocity, and percentage of simulations
causing an epidemic for each combination of species. (a) The average cumulative
number of infected individuals for each of the species listed at the top of the panel, in
isolation, and combined with 1 and 2 other species where L=lion, H=hyena, J=jackal.
Gray bars, low coupling; white bars, high coupling; error bars, 95% CI. (b) The velocity
of infection (number of infections per time-step) per combination of species. (c)
Percentage of simulations (n = 150) that cause an epidemic (defined as infection
persisting longer than 200 time-steps).
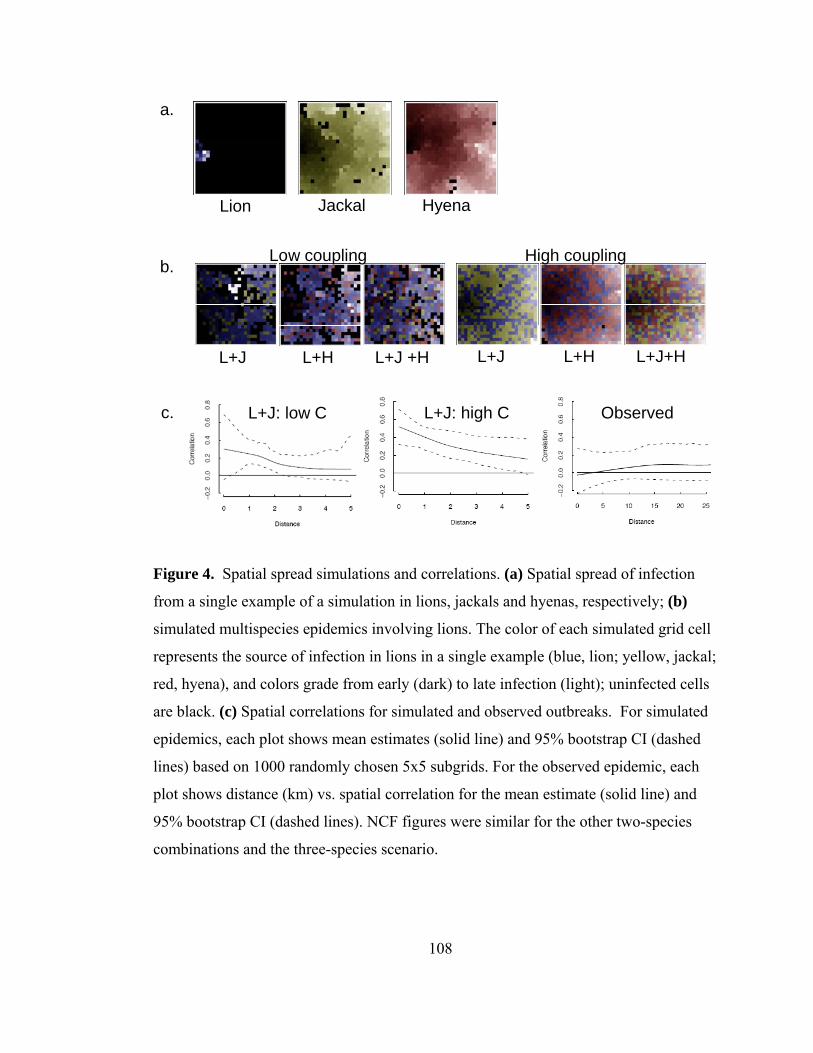
108
b.
c.
a.
Lion HyenaJackal
L+J L+H L+J+HL+HL+J L+J +H
L+J: low C L+J: high C Observed
Low coupling High coupling
Figure 4. Spatial spread simulations and correlations. (a) Spatial spread of infection
from a single example of a simulation in lions, jackals and hyenas, respectively; (b)
simulated multispecies epidemics involving lions. The color of each simulated grid cell
represents the source of infection in lions in a single example (blue, lion; yellow, jackal;
red, hyena), and colors grade from early (dark) to late infection (light); uninfected cells
are black. (c) Spatial correlations for simulated and observed outbreaks. For simulated
epidemics, each plot shows mean estimates (solid line) and 95% bootstrap CI (dashed
lines) based on 1000 randomly chosen 5x5 subgrids. For the observed epidemic, each
plot shows distance (km) vs. spatial correlation for the mean estimate (solid line) and
95% bootstrap CI (dashed lines). NCF figures were similar for the other two-species
combinations and the three-species scenario.
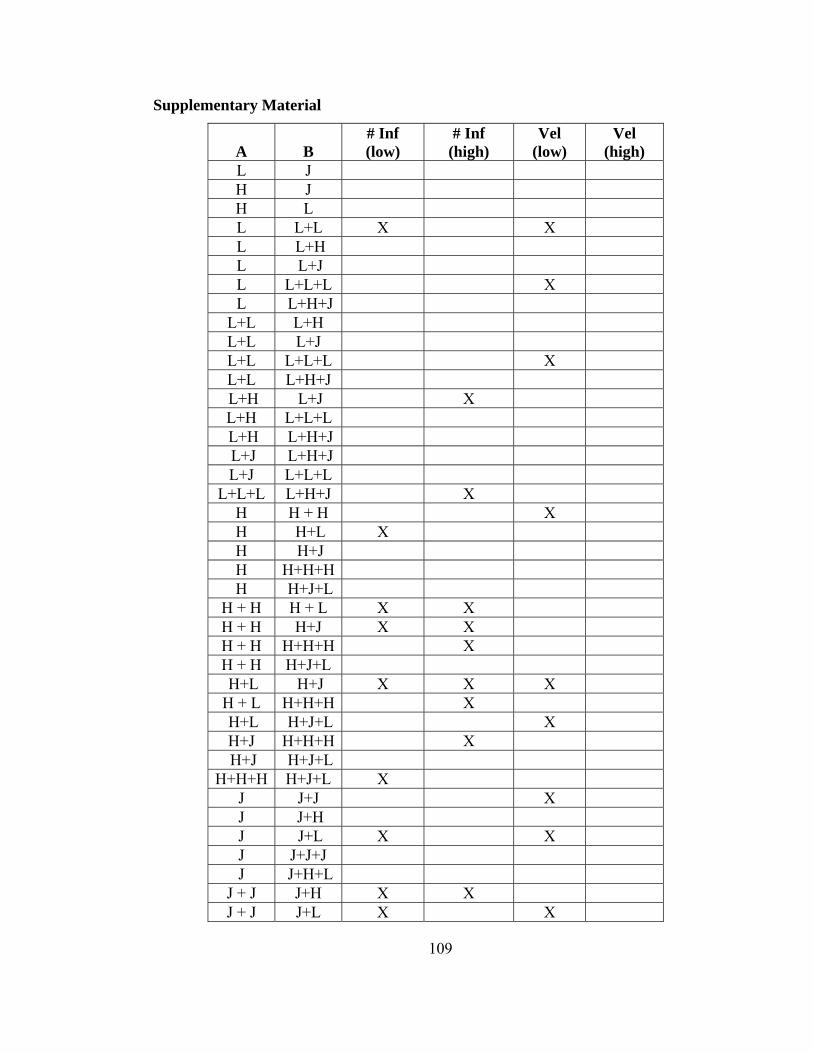
109
Supplementary Material
A B # Inf (low)
# Inf (high)
Vel (low)
Vel (high)
L J H J H L L L+L X X L L+H L L+J L L+L+L X L L+H+J
L+L L+H L+L L+J L+L L+L+L X L+L L+H+J L+H L+J X L+H L+L+L L+H L+H+J L+J L+H+J L+J L+L+L
L+L+L L+H+J X H H + H X H H+L X H H+J H H+H+H H H+J+L
H + H H + L X X H + H H+J X X H + H H+H+H X H + H H+J+L H+L H+J X X X H + L H+H+H X H+L H+J+L X H+J H+H+H X H+J H+J+L
H+H+H H+J+L X J J+J X J J+H J J+L X X J J+J+J J J+H+L
J + J J+H X X J + J J+L X X
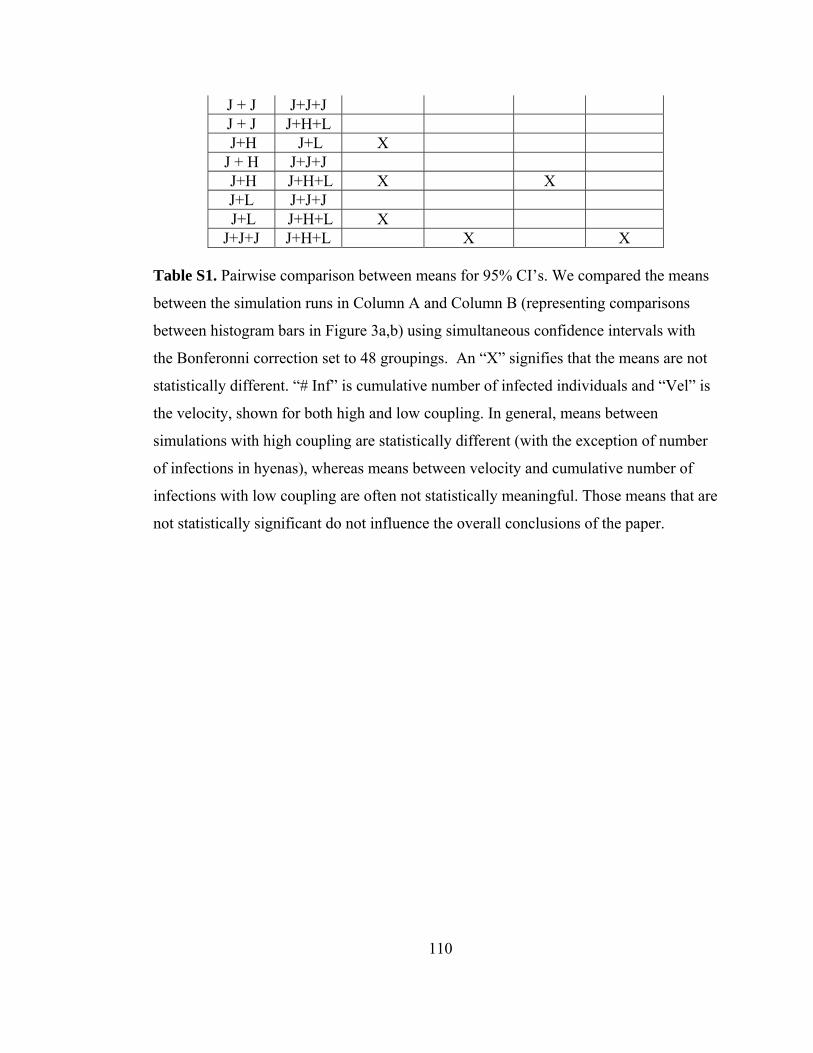
110
J + J J+J+J J + J J+H+L J+H J+L X J + H J+J+J J+H J+H+L X X J+L J+J+J J+L J+H+L X J+J+J J+H+L X X
Table S1. Pairwise comparison between means for 95% CI’s. We compared the means
between the simulation runs in Column A and Column B (representing comparisons
between histogram bars in Figure 3a,b) using simultaneous confidence intervals with
the Bonferonni correction set to 48 groupings. An “X” signifies that the means are not
statistically different. “# Inf” is cumulative number of infected individuals and “Vel” is
the velocity, shown for both high and low coupling. In general, means between
simulations with high coupling are statistically different (with the exception of number
of infections in hyenas), whereas means between velocity and cumulative number of
infections with low coupling are often not statistically meaningful. Those means that are
not statistically significant do not influence the overall conclusions of the paper.
111
REFERENCES
Ackley, C. D., Yamamoto, J. K., Levy, N., Pedersen, N. C. & Cooper, M. D. (1990) Immunologic abnormalities in pathogen-free cats experimentally infected with feline immunodeficiency virus. The Journal of Virology, 64, 5652-5655.
Addie, D. D., Jarrett, O. (2006) Feline Coronavirus Infections. In: Infectious diseases of the dog and cat (ed. Greene, C.E.) W.B. Saunders, Philadelphia, pp. 88-102.
Alexander, K., Kat, P., Wayne, R. & Fuller, T. (1994) Serologic survey of selected canine pathogens among free-ranging jackals in Kenya. Journal of Wildlife Dieases, 30, 486-491.
Altizer, S., Nunn, C. L., Thrall, P. H., Gittleman, J. L., Antonovics, J., Cunningham, A.A.: Dobson, A.P., Ezenwa, V., Jones, K. E., Pederson, A. B., Poss, M. & Pulliam, J. R. C. (2003) Social Organization and Parasite Risk in Mammals: Integrating Theory and Empirical Studies. Annual Review of Ecology, Evolution, and Systematics, 34, 517-547.
Anderson, R. M. & May, R. M. (1985) Age-related changes in the rate of disease transmission: implications for the design of vaccination programmes. Journal of Hygiene, 94, 365-436.
Anderson, R. M. & May, R. M. (1979) Population biology of infectious diseases: Part 1. Nature, 280, 361-367.
Anderson, R. M. (1991) Populations and Infectious Diseases: Ecology or Epidemiology? Journal of Animal Ecology, 60, 1-50.
Anderson R. M., May, R. M. (1991) Infectious diseases of humans: dynamics and control. Oxford University Press, Oxford.
Antunes, A., Troyer, J. L., Roelke, M. E., Pecon-Slattery, J., Packer, C., Winterbach, C., Winterbach, H., Hemson, G., Frank, L., Stander, P., Siefert, L., Driciru, M., Funston, P. J., Alexander, K. A., Prager, K. C., Mills, G., Wildt, D., Bush, M., O'Brien, S. J. & Johnson, W. E. (2008) The Evolutionary Dynamics of the Lion Panthera leo Revealed by Host and Viral Population Genomics. PLoS Genetics, 4,
112
e1000251.
Appel, M. (1987) Canine Distemper Virus. In: Virus infections of carnivores (ed. Appel, M.J.G.) Elsevier Science, New York, pp. 132-159.
Appel, M. J. G. & Summers, B. A. (1995) Pathogenicity of morbilliviruses for terrestrial carnivores. Veterinary Microbiology, 44, 187-191.
Averbeck, G., Bjork, K., Packer, C. & Herbst, L. (1990) Prevalence of hematozoans in lions (Panthera leo) and cheetah (Acinonyx jubatus) in Serengeti National Park and Ngorongoro Crater, Tanzania. Journal of Wildlife Diseases, 26, 392-394.
Baker, J. R. (1968) Trypanosomes of wild mammals in the neighbourhood of the Serengeti National Park. Symposium of the Zoological Society of London, 24, 147-158.
Bansal, S., Grenfell, B. T. & Meyers, L. A. (2007) When individual behaviour matters: homogeneous and network models in epidemiology. Journal of the Royal Society Interface, 4, 879-891.
Bansal, S., Pourbohloul, B. & Meyers, L. A. (2006) A comparative analysis of influenza vaccination programs. PLoS Medicine, 3, e387 OP.
Bartlett, M. S. (1960) The critical community size for measles in the United States. Journal of the Royal Statistical Society. Series A (General), 123, 37-44.
Begon, M. & Bowers, R. G. (1994) Host-Host-Pathogen Models and Microbial Pest Control: The Effect of Host Self Regulation. Journal of Theoretical Biology, 169, 275-287.
Bertram, B. C. R. (1976) Kin selection in lions and in evolution. In: Growing points in ethology (eds. Bateson, P.P.G. & Hinde, R.A.) Cambridge University Press, Cambridge, pp. 281-301.
Bertram, B. C. R. (1975) Social factors influencing reproduction in wild lions. Journal of Zoology, 177, 463-482.
113
Bjork, K. E., Averbeck, G. A. & Stromberg, B. E. (2000) Parasites and parasite stages of free-ranging wild lions (Panthera leo) of northern Tanzania. Journal of Zoo and Wildlife Medicine, 31, 56-61.
Bjornstad, O. N. & Falck, W. (2001) Nonparametric spatial covariance functions: Estimation and testing. Environmental and Ecological Statistics, 8, 53-70.
Brown, E. W., Yuhki, N., Packer, C. & O'Brien, S. J. (1994) A lion lentivirus related to feline immunodeficiency virus: epidemiologic and phylogenetic aspects. The Journal of Virology, 68, 5953-5968.
Bygott, J. D., Bertram, B. C. R. & Hanby, J. P. (1979) Male lions in large coalitions gain reproductive advantages. Nature, 282, 839-841.
Campbell K.L.I. & Borner M. (1986) Census of predators on the Serengeti plains May 1986. Serengeti Ecological Monitoring Programme.
Carpenter, M. A. & O'Brien, S. J. (1995) Coadaptation and immunodeficiency virus: lessons from the Felidae. Current Opinion in Genetics & Development, 5, 739-745.
Carpenter, M. A., Appel, M. J. G., Roelke-Parker, M. E., Munson, L., Hofer, H., East, M. & O'Brien, S. J. (1998) Genetic characterization of canine distemper virus in Serengeti carnivores. Veterinary immunology and immunopathology, 65, 259-266.
Cleaveland, S., Packer, C., Hampson, K., Kaare, M., Kock, R., Craft, M., Lembo, T., Mlengeya, T., & Dobson, A. (2008) The multiple roles of infectious diseases in the Serengeti ecosystem. In: Serengeti III: Human Impacts on Ecosystem Dynamics (eds. Sinclair, A.R.E., Packer, C., Mduma, S. & Fryxell, J.) Chicago University Press, Chicago, pp. 209-239.
Cleaveland, S. C., Hess, G., Laurenson, M. K., Swinton, J., & Woodroffe, R. M. (2002) The role of pathogens in biological conservation. In: The Ecology of Wildlife Diseases (eds. Hudson, P.J., Rizzoli, A., Grenfell, B.T., Heesterbeck, H. & Dobson, A.P.) Oxford University Press, New York, pp. 139-150.
Cleaveland, S., Appel, M. G. J., Chalmers, W. S. K., Chillingworth, C., Kaare, M. & Dye, C. (2000) Serological and demographic evidence for domestic dogs as a source of canine distemper virus infection for Serengeti wildlife. Veterinary
114
microbiology, 72, 217-227.
Cleaveland, S., Mlengeya, T., Kazwala, R. R., Michel, A., Kaare, M. T., Jones, S. L., Eblate, E., Shirima, G. M. & Packer, C. (2005) Tuberculosis in Tanzanian Wildlife. Journal of Wildlife Diseases, 41, 446-453.
Cleaveland, S., Mlengeya, T., Kaare, M., Haydon, D. T., Lembo, T., Laurenson, M. K. & Packer, C. (2007) The conservation relevance of epidemiological research into carnivore viral diseases in the Serengeti. Conservation Biology, 21, 612-622.
Craft, M. E., Hawthorne, P. L., Packer, C. & Dobson, A. P. (2008) Dynamics of a multihost pathogen in a carnivore community. Journal of Animal Ecology, 77, 1257-1264.
Cross, P. C., Lloyd-Smith, J. O. & Getz, W. M. (2005) Disentangling association patterns in fission–fusion societies using African buffalo as an example. Animal Behaviour, 69, 499-506.
Davis, S., Trapman, P., Leirs, H., Begon, M. & Heesterbeek, J. A. P. (2008) The abundance threshold for plague as a critical percolation phenomenon. Nature, 454, 634-637.
Dobson, A. (2004) Population Dynamics of Pathogens with Multiple Host Species. The American Naturalist, 164, S64-S68.
Donnelly, C. A., Woodroffe, R., Cox, D. R., Bourne, F. J., Cheeseman, C. L., Clifton-Hadley, R. S., Wei, G., Gettinby, G., Gilks, P., Jenkins, H., Johnston, W. T., Le Fevre, Andrea M., McInerney, J. P. & Morrison, W. I. (2006) Positive and negative effects of widespread badger culling on tuberculosis in cattle. Nature, 439, 843-846.
Driciru, M., Siefert, L., Prager, K. C., Dubovi, E., Sande, R., Princee, F., Friday, T. & Munson, L. (2006) A Serosurvey of Viral Infections in Lions (Panthera leo), from Queen Elizabeth National Park, Uganda. Journal of Wildlife Diseases, 42, 667-671.
Fenton, A. & Pedersen, A. B. (2005) Community Epidemiology Framework for Classifying Disease Threats. Emerging Infectious Diseases, 11, 1815-1821.
115
Ferguson, N. M., Donnelly, C. A. & Anderson, R. M. (2001) Transmission intensity and impact of control policies on the foot and mouth epidemic in Great Britain. Nature, 413, 542-548.
Ferrari, M. J., Bansal, S., Meyers, L. A. & Bjornstad, O. N. (2006) Network frailty and the geometry of herd immunity. Proceedings of the Royal Society B: Biological Sciences, 273, 2743-2748.
Ferreira, S. M. & Funston, P. J. (in press) Estimating lion population variables: Prey and disease effects in Kruger National Park, South Africa. Biological Conservation.
Franklin, S. P., Troyer, J. L., Terwee, J. A., Lyren, L. M., Boyce, W. M., Riley, S. P. D., Roelke, M. E., Crooks, K. R. & VandeWoude, S. (2007) Frequent Transmission of Immunodeficiency Viruses among Bobcats and Pumas. The Journal of Virology, 81, 10961-10969.
Funk, S. M., Fiorella, C. V., Cleaveland, S., & Gompper, M. E. (2001) The role of disease in carnivore ecology and conservation. In: Carnivore Conservation (eds. Gittleman, J.L., Funk, S.M., Macdonald, D.W. & Wayne, R.K.) Cambridge University Press, Cambridge, pp. 443-466.
Fyumagwa, R. D., Runyoro, V., Horak, I. G. & Hoare, R. (2007) Ecology and control of ticks as disease vectors in wildlife of the Ngorongoro Crater, Tanzania. South African Journal of Wildlife Research, 37, 79-90.
Gaskell, R. M., Dawson, S., & Radford, A. D. (2006) Feline Respiratory Disease. In: Infectious diseases of the dog and cat (ed. Greene, C.E.) W.B. Saunders, Philadelphia, pp. 145-154.
Gilbert, D. A., Packer, C., Pusey, A. E., Stephens, J. C. & O'Brien, S. J. (1991) Analytical DNA fingerprinting in lions: parentage, genetic diversity, and kinship. Journal of Heredity, 82, 378-386.
Glasserman P. (2004) Monte Carlo methods in financial engineering. Springer, New York.
Graham, A. L., Cattadori, I. M., Lloyd-Smith, J. O., Ferrari, M. J. & Bjørnstad, O. N. (2007) Transmission consequences of coinfection: cytokines writ large? Trends in
116
Parasitology, 23, 284-291.
Greene, C. E., Addie, D. D. (2006) Feline Parvovirus Infections. In: Infectious diseases of the dog and cat (ed. Greene, C.E.) W.B. Saunders, Philadelphia, pp. 78-88.
Greene, C. E., Appel, M. J. (2006) Canine Distemper. In: Infectious diseases of the dog and cat (ed. Greene, C.E.) W.B. Saunders, Philadelphia, pp. 25-27.
Grenfell, B. T. & Bolker, B. M. (1998) Cities and villages: infection hierarchies in a measles metapopulation. Ecology Letters, 1, 63-70.
Grenfell, B. T., Bjornstad, O. N. & Kappey, J. (2001) Travelling waves and spatial hierarchies in measles epidemics. Nature, 414, 716-723.
Grinnell, J., Packer, C. & Pusey, A. E. (1995) Cooperation in male lions: kinship, reciprocity or mutualism? Animal Behaviour, 49, 95-105.
Guiserix, M., Bahi-Jaber, N., Fouchet, D., Sauvage, F. & Pontier, D. (2007) The canine distemper epidemic in Serengeti: are lions victims of a new highly virulent canine distemper virus strain, or is pathogen circulation stochasticity to blame? Journal of the Royal Society Interface, 4, 1127-1134.
Gusset, M., Ryan, S. J., Hofmeyr, M., Van Dyk, G., Davies-Mostert, H. T., Graf, J. A., Owen, C., Szykman, M., Macdonald, D. W., Monfort, S. L., Wildt, D. E., Maddock, A. H., Mills, M. G. L., Slotow, R. & Somers, M. J. (2008) Efforts going to the dogs? Evaluating attempts to re-introduce endangered wild dogs in South Africa. Journal of Applied Ecology, 45, 100-108.
Haas, L., Hofer, H., East, M., Wohlsein, P., Leiss, B. & Barrett, T. (1996) Canine distemper virus infection in Serengeti spotted hyaenas. Veterinary Microbiology, 49, 147-152.
Hampson K. (2007) Transmission dynamics and control of canine rabies. PhD thesis. Princeton University.
Hanby, J. P., Bygott, J. D., & Packer, C. (1995) Ecology, demography and behavior of lions in two contrasting habitats: Ngorongoro Crater and the Serengeti Plains. In:
117
Serengeti II: Research, Management and Conservation of an Ecosystem (ed. Arcese, P.& Sinclair, A.R.E.) University of Chicago Press, Chicago, pp. 315-331.
Hanski I., Gilpin, M. E. (1997) Metapopulation biology: ecology, genetics, and evolution. Academic Press, San Diego, CA.
Harrison, T. M., Mazet, J. K., Holekamp, K. E., Dubovi, E., Engh, A. L., Nelson, K., Van Horn, R. C. & Munson, L. (2004) Antibodies to canine and feline viruses in spotted hyenas (Crocuta crocuta) in the Masai Mara National Reserve. Journal of Wildlife Diseases, 40, 1-10.
Haydon, D. T., Cleaveland, S., Taylor, L. H. & Laurenson, M. K. (2002) Identifying reservoirs of infection: a conceptual and practical challenge. Emerging Infectious Diseases, 8, 1468-1473.
Haydon, D. T., Laurenson, M. K. & Sillero-Zubiri, C. (2002) Integrating epidemiology into population viability analysis: Managing the risk posed by rabies and canine distemper to the Ethiopian wolf. Conservation Biology, 16, 1372-1385.
Haydon, D. T., Randall, D. A., Matthews, L., Knobel, D. L., Tallents, L. A., Gravenor, M. B., Williams, S. D., Pollinger, J. P., Cleaveland, S., Woolhouse, M. E. J., Sillero-Zubiri, C., Marino, J., Macdonald, D. W. & Laurenson, M. K. (2006) Low-coverage vaccination strategies for the conservation of endangered species. Nature, 443, 692-695.
Hofer, H., East, M. (1995) Population Dynamics, Population Size, and the Commuting System of Serengeti Spotted Hyenas. In: Serengeti II: Dynamics, management, and conservation of an Ecosystem (eds. Sinclair, A.R.E. & Arcese, P.) University of Chicago Press, Chicago, pp. 332-363.
Hofer, H. & East, M. L. (1993a) The commuting system of Serengeti spotted hyaenas: how a predator copes with migratory prey. I. Social organization. Animal Behaviour, 46, 547-557.
Hofer, H. & East, M. L. (1993b) The commuting system of Serengeti spotted hyaenas: how a predator copes with migratory prey. II. Intrusion pressure and commuters' space use. Animal Behaviour, 46, 559-574.
118
Hofmann-Lehmann, R., Fehr, D., Grob, M., Elgizoli, M., Packer, C., Martenson, J., O'Brien, S. & Lutz, H. (1996) Prevalence of antibodies to feline parvovirus, calicivirus, herpesvirus, coronavirus, and immunodeficiency virus and of feline leukemia virus antigen and the interrelationship of these viral infections in free-ranging lions in east Africa. Clinical and Vaccine Immunology, 3, 554-562.
Holt, R. D. & Pickering, J. (1985) Infectious Disease and Species Coexistence: A Model of Lotka-Volterra Form. American Naturalist, 126, 196-211.
Hudson P. J. (2002) The ecology of wildlife diseases. Oxford University Press, New York.
Jelinek, T., Bisoffi, Z., Bonazzi, L., van Thiel, P., Bronner, U., de Frey, A., Gundersen, S. G., McWhinney, P. & Ripamonti, D. (2002) Cluster of African Trypanosomiasis in Travelers to Tanzanian National Parks. Emerging Infectious Diseases, 8, 634.
Kaare, M. T., Picozzi, K., Mlengeya, T., Fèvre, E. M., Mellau, L. S., Mtambo, M. M., Cleaveland, S. & Welburn, S. C. (2007) Sleeping sickness—A re-emerging disease in the Serengeti? Travel Medicine and Infectious Disease, 5, 117-124.
Keeling M. J., Rohani, P. (2008) Modeling infectious diseases in humans and animals. Princeton University Press, Princeton.
Keeling, M. (2005) The implications of network structure for epidemic dynamics. Theoretical Population Biology, 67, 1-8.
Keesing, F., Holt, R. D. & Ostfeld, R. S. (2006) Effects of species diversity on disease risk. Ecology Letters, 9, 485-498.
Kissui, B. M. & Packer, C. (2004) Top-down Population Regulation of a Top Predator: Lions in the Ngorongoro Crater. Proceedings: Biological Sciences, 271, 1867-1874.
Kock, R., Chalmers, W. S., Mwanzia, J., Chillingworth, C., Wambua, J., Coleman, P. G. & Baxendale, W. (1998) Canine distemper antibodies in lions of the Masai Mara. The Veterinary Record, 142, 662-5.
119
Krause, J., Croft, D. & James, R. (2007) Social network theory in the behavioural sciences: potential applications. Behavioral Ecology and Sociobiology, 62, 15-27.
Leendertz, F. H., Junglen, S., Boesch, C., Formenty, P., Couacy-Hymann, E., Courgnaud, V., Pauli, G. & Ellerbrok, H. (2004) High Variety of Different Simian T-Cell Leukemia Virus Type 1 Strains in Chimpanzees (Pan troglodytes verus) of the Tai National Park, Cote d'Ivoire. The Journal of Virology, 78, 4352-4356.
Lembo, T., Hampson, K., Haydon, D. T., Craft, M., Dobson, A., Dushoff, J., Ernest, E., Hoare, R., Kaare, M., Mlengeya, T., Mentzel, C. & Cleaveland, S. (2008) Exploring reservoir dynamics: a case study of rabies in the Serengeti ecosystem. Journal of Applied Ecology, 45, 1246-1257.
Levins, R. (1969) Some demographic and genetic consequences of environmental heterogeneity for biological control. Bulletin of the Entomological Society of America, 15, 237-240.
Li, W., Shi, Z., Yu, M., Ren, W., Smith, C., Epstein, J. H., Wang, H., Crameri, G., Hu, Z., Zhang, H., Zhang, J., McEachern, J., Field, H., Daszak, P., Eaton, B. T., Zhang, S. & Wang, L. (2005) Bats are natural reservoirs of SARS-like coronaviruses. Science, 310, 676-679.
Lloyd-Smith, J. O., Schreiber, S. J., Kopp, P. E. & Getz, W. M. (2005) Superspreading and the effect of individual variation on disease emergence. Nature, 438, 355-359.
Madan, D. B., Carr, P. P. & Chang, E. C. (1998) The variance gamma process and option pricing. European Finance Review, 2, 79-105.
Maddock, L. (1979) The "Migration" and grazing succession. In: Serengeti: Dynamics of an ecosystem (eds. Sinclair, A.R.E. & Norton-Griffiths, M.) University of Chicago Press, Chicago, pp. 104-129.
Matzke, G. (1979) Settlement and sleeping sickness control--a dual threshold model of colonial and traditional methods in East Africa. Social Science and Medicine, 209-214.
120
May, R. M. & Anderson, R. M. (1987) Transmission dynamics of HIV infection. Nature, 326, 137-142.
May, R. M. & Anderson, R. M. (1984) Spatial heterogeneity and the design of immunization programs. Mathematical Biosciences, 72, 83-111.
May, R. M. & Anderson, R. M. (1979) Population biology of infectious diseases: Part II. Nature, 280, 455-461.
McCallum, H., Dobson, A. (2006) Disease and Connectivity. In: Connectivity Conservation (eds. Crooks, K. & Sanjayan, M.) Cambridge University Press, Cambridge, pp. 479-501.
McCallum, H. & Dobson, A. (2002) Disease, Habitat Fragmentation and Conservation. Proceedings of the Royal Society of London Series B - Biological Sciences, 269, 2041-2049.
McCallum, H. & Dobson, A. (1995) Detecting disease and parasite threats to endangered species and ecosystems. Trends in Ecology & Evolution, 10, 190-194.
McComb, K., Pusey, A., Packer, C. & Grinnell, J. (1993) Female lions can identify potentially infanticidal males from their roars. Proceedings: Biological Sciences, 252, 59-64.
Mech, L. & Goyal, S. (1993) Canine parvovirus effect on wolf population change and pup survival. Journal of Wildlife Diseases, 29, 330-333.
Meyers, L. A., Pourbohloul, B., Newman, M. E. J., Skowronski, D. M. & Brunham, R. C. (2005) Network theory and SARS: predicting outbreak diversity. Journal of theoretical biology, 232, 71-81.
Michel, A. L., Bengis, R. G., Keet, D. F., Hofmeyr, M., Klerk, L. M. d., Cross, P. C., Jolles, A. E., Cooper, D., Whyte, I. J., Buss, P. & Godfroid, J. (2006) Wildlife tuberculosis in South African conservation areas: Implications and challenges. Veterinary Microbiology, 112, 91-100.
121
Mlengeya TDK, Muangirwa C, Mlengeya MM, Kimaro E, Msangi S and Sikay M, (2002). Control of sleeping sickness in northern parks of Tanzania, December 3-5, 2002, 274-281.
Moehlman, P. (1983) Socioecology of silver-backed and golden jackals. In: Advances in the study of mammalian behavior (eds. Eisenberg, J. & Kleinman, D.) American Society of Mammologists, 423-453.
Morrison, L. J., Majiwa, P., Read, A. F. & Barry, J. D. (2005) Probabilistic order in antigenic variation of Trypanosoma brucei. International Journal for Parasitology, 35, 961-972.
Mosser A. Group territoriality of the African lion: behavioral adaptation in a heterogeneous landscape. University of Minnesota: University of Minnesota; 2008.
Muller-Graf, C. D. M. (1995) A Coprological Survey of Intestinal Parasites of Wild Lions (Panthera leo) in the Serengeti and the Ngorongoro Crater, Tanzania, East Africa. The Journal of parasitology, 81, 812-814.
Muller-Graf, C. D. M., Woolhouse, M. E. J. & Packer, C. (2000) Epidemiology of an intestinal parasite (Spirometra spp.) in two populations of African lions (Panthera leo). Parasitology, 118, 407.
Munson, L., Terio, K. A., Kock, R., Mlengeya, T., Roelke, M. E., Dubovi, E., Summers, B., Sinclair, A. R. E. & Packer, C. (2008) Climate Extremes Promote Fatal Co-Infections during Canine Distemper Epidemics in African Lions. PLoS ONE, 3, e2545.
Newman, M. E. J. (2002) Spread of epidemic disease on networks. Physical Review E, 66, 016128.
O'Brien, S. J., Martenson, J. S., Packer, C., Herbst, L., de Vos, V., Jocelyn, P., Ott-Jocelyn, J., Wildt, D. E. & Bush, M. (1987) Biochemical genetic variation in geographically isolated populations of African and Asiatic lions. National Geographic Research, 3, 114-124.
Olmsted, R. A., Langley, R., Roelke, M. E., Goeken, R. M., Adger-Johnson, D., Goff, J. P., Albert, J. P., Packer, C., Laurenson, M. K. & Caro, T. M. (1992) Worldwide
122
prevalence of lentivirus infection in wild feline species: epidemiologic and phylogenetic aspects. The Journal of Virology, 66, 6008-6018.
O'Neil, R. V., King, A. W. (1998) Homage to St. Michael: or, why are there so many books on scale? In: Ecological Scale (eds. Peterson, D.L. & Parker, V.T.) Columbia University Press, New York, pp. 3-15.
Ostfeld, R. S. & Keesing, F. (2000) Biodiversity and Disease Risk: The Case of Lyme Disease. Conservation Biology, 14, 722-728.
Packer C. (1990) Serengeti Lion Survey: Report to TANAPA, SWRI, MWEKA and the Wildlife Division.
Packer, C., Lewis, S. & Pusey, A. E. (1992) A comparative analysis of non-offspring nursing. Animal Behaviour, 43, 265-281.
Packer, C., Herbst, L., Pusey, A., Bygott, J. D., Hanby, J., Cairns, S., & Borgerhoff Mulder, M. (1988) Reproductive Success of Lions. In: Reproductive Success: Studies of Individual Variation in Contrasting Breeding Systems (ed. Clutton-Brock, T.H.) University of Chicago Press, Chicago, pp. 363-383.
Packer, C., Pusey, A. E. & Eberly, L. E. (2001) Egalitarianism in female African lions. Science, 293, 690-693.
Packer, C., Scheel, D. & Pusey, A. E. (1990) Why Lions Form Groups: Food is Not Enough. The American Naturalist, 136, 1-19.
Packer, C., Pusey, A. E., Rowley, H., Gilbert, D. A., Martenson, J. & O'Brien, S. J. (1991) Case Study of a Population Bottleneck: Lions of the Ngorongoro Crater. Conservation Biology, 5, 219-230.
Packer, C., Altizer, S., Appel, M., Brown, E., Martenson, J., O'Brien, S. J., Roelke-Parker, M., Hofmann-Lehmann, R. & Lutz, H. (1999) Viruses of the Serengeti: Patterns of infection and mortality in African lions. Journal of Animal Ecology, 68, 1161-1178.
123
Packer, C., Tatar, M. & Collins, A. (1998) Reproductive cessation in female mammals. Nature, 392, 807.
Packer, C., Hilborn, R., Mosser, A., Kissui, B., Borner, M., Hopcraft, G., Wilmshurst, J., Mduma, S. & Sinclair, A. R. E. (2005) Ecological change, group territoriality, and population dynamics in Serengeti lions. Science, 307, 390-393.
Park, A. W., Gubbins, S. & Gilligan, C. A. (2002) Extinction times for closed epidemics: the effects of host spatial structure. Ecology Letters, 5, 747-755.
Pecon-Slattery, J., Troyer, J. L., Johnson, W. E. & O’Brien, S. J. (2008) Evolution of feline immunodeficiency virus in Felidae: Implications for human health and wildlife ecology. Veterinary Immunology and Immunopathology, 123, 32-44.
Pennycuick, C. J. & Rudnai, J. (1970) A method of identifying individual lions Panthera Leo with an analysis of the reliability of identification. Journal of Zoology, 160, 497-508.
Pusey, A. E. & Packer, C. (1987) The evolution of sex-based dispersal in lions. Behaviour, 101, 275-310.
Pusey, A. E. & Packer, C. (1994) Non-offspring nursing in social carnivores: minimizing the costs. Behavioral Ecology, 5, 362-374.
Ramsauer, S., Bay, G., Meli, M., Hofmann-Lehmann, R. & Lutz, H. (2007) Seroprevalence of Selected Infectious Agents in a Free-Ranging, Low-Density Lion Population in the Central Kalahari Game Reserves in Botswana. Clinical and Vaccine Immunology, 14, 808-810.
Roelke-Parker, M. E., Munson, L., Packer, C., Kock, R., Cleaveland, S., Carpenter, M., O'Brien, S. J., Pospischil, A., Hofmann-Lehmann, R., Lutz, H., Mwamengele, G. L. M., Mgasa, M. N., Machange, G. A., Summers, B. A. & Appel, M. J. G. (1996) A canine distemper virus epidemic in Serengeti lions (Panthera leo). Nature, 379, 441-445.
Schaller G. B. (1972) The Serengeti Lion; a study of predator-prey relations. University of Chicago Press, Chicago.
124
Scheel, D., Packer, C. (1995) Variation in predation by lions: tracking a moveable feast. In: Serengeti II. Dynamics, Management, and Conservation of an Ecosystem (eds. Sinclair, A.R.E. & Arcese, P.) University of Chicago Press, Chicago, pp. 299-314.
Scheel, D. & Packer, C. (1991) Group hunting behaviour of lions: a search for cooperation. Animal Behaviour, 41, 697-709.
Schmunis, G. A. (2004) Medical Significance of African Trypanosomiasis. In: The Trypanosomiases (ed. Maudlin, I., Holmes, P.H. & Mills, M.A.) CABI International, Wallingford, pp. 283-302.
Shaw, A. P. M. (2004) Economics of African Trypanosomiasis. In: The Trypanosomiases (eds. Maudlin, I., Holmes, P.H. & Mills, M.A.) CABI International, Wallingford, pp. 369-402.
Shaw, D. J., Grenfell, B. T. & Dobson, A. P. (1998) Patterns of macroparasite aggregation in wildlife host populations. Parasitology, 117, 597.
Sinclair, A. R. E. (1995) Serengeti Past and Present. In: Serengeti II: Dynamics, management, and conservation of an Ecosystem (eds. Sinclair, A.R.E. & Arcese, P.) University of Chicago Press, Chicago, pp. 3-30.
Sinclair, A. R. E., Packer, C., Mduma, S., & Fryxell, J. (2008) Serengeti III: Human Impacts on Ecosystem Dynamics. in press.
Spencer, J. A. (1991) Survey of antibodies to feline viruses in free-ranging lions. South African Journal of Wildlife Research, 21, 59-61.
Spencer, J. A. & Morkel, P. (1993) Serological survey of sera from lions in Etosha National Park. S.-Afr. Tydskr. Natuurnav., 23, 60-61.
Swinton, J., Woolhouse, M. E. J., Begon, M. E., Dobson, A. P., Ferroglio, E., Grenfell, B. T., Guberti, V., Hails, R. S., Heesterbeek, J. A. P., Lavazza, A., Roberts, M. G., White, P. J., & Wilson, K. (2001) Microparasite transmission and persistence. In: The Ecology of Wildlife Diseases (eds. Hudson, P.J., Rizzoli, A., Grenfell, B.T., Heesterbeck, H. & Dobson, A.P.) Oxford University Press, Oxford, pp. 83-101.

125
Swinton, J., Harwood, J., Grenfell, B. T. & Gilligan, C. A. (1998) Persistence thresholds for phocine distemper virus infection in harbour seal Phoca vitulina metapopulations. Journal of Animal Ecology, 67, 54-68.
Tilman D., Kareiva, P. (1997) Spatial ecology: the role of space in population dynamics and interspecific interactions. 30th edn. Princeton University Press, Princeton, NJ.
Tompkins, D. M., Dobson, A. P., Arneberg, P., Begon, M. E., Cattadori, I. M., Greenman, J. V., Heesterbeek, J. A. P., Hudson, P. J., Newborn, D., Pugliese, A., Rizzoli, A. P., Rosa, R., Rosso, F., & Wilson, K. (2002) Parasites and host population dynamics. In: The ecology of wildlife diseases (ed. Hudson, P.J.) Oxford University Press, New York, pp. 197.
Troyer, J. L., Pecon-Slattery, J., Roelke, M. E., Black, L., Packer, C. & O'Brien, S. J. (2004) Patterns of Feline Immunodeficiency Virus Multiple Infection and Genome Divergence in a Free-Ranging Population of African Lions. The Journal of Virology, 78, 3777-3791.
Troyer, J. L., Pecon-Slattery, J., Roelke, M. E., Johnson, W., VandeWoude, S., Vazquez-Salat, N., Brown, M., Frank, L., Woodroffe, R., Winterbach, C., Winterbach, H., Hemson, G., Bush, M., Alexander, K. A., Revilla, E. & O'Brien, S. J. (2005) Seroprevalence and Genomic Divergence of Circulating Strains of Feline Immunodeficiency Virus among Felidae and Hyaenidae Species. The Journal of Virology, 79, 8282-8294.
VanderWaal, K., Mosser, A. & Packer, C. (in press) Optimal group size, dispersal decisions and post-dispersal relationships in female African lions. Animal Behaviour, .
Vial, F., Cleaveland, S., Rasmussen, G. & Haydon, D. T. (2006) Development of vaccination strategies for the management of rabies in African wild dogs. Biological Conservation, 131, 180-192.
Viboud, C., Bjornstad, O. N., Smith, D. L., Simonsen, L., Miller, M. A. & Grenfell, B. T. (2006) Synchrony, Waves, and Spatial Hierarchies in the Spread of Influenza. Science, 312, 447-451.
126
Wack, R. (2003) Felidae. In: Zoo and wild animal medicine (eds. Fowler, M.E. & Miller, R.E.) Saunders, St. Louis, Missouri, pp. 491-501.
Welburn, S., Picozzi, K., Coleman, P. G. & Packer, C. (2008) Patterns in Age-Seroprevalence Consistent with Acquired Immunity against Trypanosoma brucei in Serengeti Lions. PLoS Neglected Tropical Diseases, 2, e347.
Welburn, S. C., Fèvre, E. M., Coleman, P. G., Odiit, M. & Maudlin, I. (2001) Sleeping sickness: a tale of two diseases. Trends in Parasitology, 17, 19-24.
Wey, T., Blumstein, D. T., Shen, W. & Jordán, F. (2008) Social network analysis of animal behaviour: a promising tool for the study of sociality. Animal Behaviour, 75, 333-344.
Wildt, D. E., Bush, M., Goodrowe, K. L., Packer, C., Pusey, A. E., Brown, J. L., Joslin, P. & O'Brien, S. J. (1987) Reproductive and genetic consequences of founding isolated lion populations. Nature, 329, 328-331.
Williams, E. S. (2001) Canine Distemper. In: Infectious Diseases of Wild Mammals (eds. Williams, E.S. & Barker, I.K.) Iowa State University Press, Ames, IA, pp. 50-63.
Williams, E., Thorne, E., Appel, M. & Belitsky, D. (1988) Canine distemper in black-footed ferrets (Mustela nigripes) from Wyoming. Journal of Wildlife Diseases, 24, 385-398.
Woodroffe, R., Ginsberg, J., & Macdonald, D. W. (1997) African Wild Dog: Status Survey and Conservation Action Plan.
Woolhouse, M. E. J., Taylor, L. H. & Haydon, D. T. (2001) Population Biology of Multihost Pathogens. Science, 292, 1109.
Yamamoto, J. K., Sparger, E., Ho, E. W., Anderson, P. R., O'connor, T. P., Mandell, C. P., Lavenstine, L., Munn, R. & Pedersen, N. C. (1988) Pathogenesis of experimentally induced feline immunodeficiency virus infection in cats. American Journal of Veterinary Research, 49, 1246-1258.