THE AFRICAN LION (Panthera leo leo): A CONTINENT … AFRICAN LION (Panthera leo leo): A...
101
THE AFRICAN LION (Panthera leo leo): A CONTINENT-WIDE SPECIES DISTRIBUTION STUDY AND POPULATION ANALYSIS by Jason S. Riggio Dr. Stuart L. Pimm, Advisor May 2011 Masters project submitted in partial fulfillment of the requirements for the Master of Environmental Management degree in the Nicholas School of the Environment of Duke University 2011
Transcript of THE AFRICAN LION (Panthera leo leo): A CONTINENT … AFRICAN LION (Panthera leo leo): A...

THE AFRICAN LION (Panthera leo leo):
A CONTINENT-WIDE SPECIES DISTRIBUTION STUDY
AND POPULATION ANALYSIS
by
Jason S. Riggio
Dr. Stuart L. Pimm, Advisor
May 2011
Masters project submitted in partial fulfillment of the requirements for the
Master of Environmental Management degree in the
Nicholas School of the Environment of Duke University
2011

i
Abstract
Human population growth and land conversion across Africa makes the future of wide-ranging
carnivores uncertain. For example, the African lion (Panthera leo leo) once ranged across the entire con-
tinent – with the exception of the Sahara Desert and rainforests. It now lives in less than a quarter of its
historic range. Recent research estimates a loss of nearly half of the lions in the past two decades.
Some sources put their numbers as low as 20,000 individuals. Given these declines, conservation organ-
izations propose to list the African lion as “endangered” under the U.S. Endangered Species Act and to
upgrade the species’ CITES protections from Appendix II to Appendix I.
To establish the lion’s current conservation status, I analyzed the size, distribution, and potential
connections of populations across its range in Africa. It is particularly important to identify connected
sub-populations and areas that can serve as corridors between existing protected areas. I compile the
most current scientific literature, comparing sources to identify a current population estimate. I also use
these sources to map known lion populations, potential habitat patches, and the connections between
them. Finally, I assess the long-term viability of each lion population and determine which qualify as
“lion strongholds.”
The lion population assessment in this study has shown that over 30,000 lions remain in approx-
imately 3,000,000 km2 of Africa. Lions are distributed across a total of 78 habitat patches in 27 coun-
tries. Since 2002, five countries have lost their lion populations. However, more than half of the re-
maining lions in Africa reside in 11 viable populations contained within protected areas that have stable
or increasing lion population trends (lion strongholds). Therefore lions are not currently threatened
with extinction and it is unlikely that the total population of free-ranging lions in Africa will drop below
20,000 individuals. Given these findings, it is clear that new data based on field surveys are necessary to
appropriately evaluate the legal status of the African lion.

ii
Acknowledgements
First and foremost I would like to thank Dr. Stuart L. Pimm, my Masters Project (MP) advisor and
mentor throughout my career at Duke University’s Nicholas School of the Environment. Without him,
this study would not have been possible. I must thank the National Geographic Society for their support
of Duke University’s BCI intern team, and Dr. Luke Dollar (Program Director, BCI) for his leadership of the
program. I owe a huge debt to the BCI intern team for all of their hard work spent digitizing land con-
version across the African continent, as well as the long-evenings researching lion and cheetah conser-
vation. Andrew Jacobson (Project Manager, Duke BCI intern team), answered countless questions con-
cerning this project and his influence can be found throughout this document. I would also like to thank
Dr. Jennifer Swenson who helped address my many mapping needs and for constantly reminding me
about the nearing MP deadline.
Finally, I cannot forget my support group in Durham, NC, whom without I would probably still be
writing this MP. Corey Anco and Rachael Carnes for their love of late night, computer lab, insomnia ses-
sions; thank you both for keeping me sane. My girlfriend, Lauren Berlamino, who put up with my early
morning returns to our home, and for her constant support through the MP process.

iii
Table of Contents
Abstract.…………………………………………………………………………………………………………………………………i
Acknowledgements……………………………………………………………………………………………………………….ii
List of Tables…………………………………………………………………………………………………………………………iv
List of Figures…………………………………………………………………………………………………………………….iv-v
List of Abbreviations……………………………………………………………………..………………………………………vi
Introduction…………………………………………………………………………………..…………………………………..1-2
Methods…………………………………………………………………………………………………………………………….3-5
Results……………………………………………………………………………………………………………………………..6-39
Discussion……………………………………………………………………………………………………………………….40-58
Conclusion…………………………………………………………………………………………………………………………..59
Literature Cited………………………………………………………………………………………………………………60-65
Appendix A: Examples of Variables Used in the Creation of Lion Habitat Patches...............................66-74
Appendix B: Lion Distribution and Habitat Patch Maps................................................................75-86
Appendix C: Lion Stronghold and Potential Stronghold Maps………………………………………………………87-94

iv
List of Tables
Table 1: West Africa Lion Habitat Patches…………………………………………………………………….……………….………13
Table 2: Central Africa Lion Habitat Patches……………………………………………………………………….…….……………16
Table 3: East Africa Lion Habitat Patches…………………………………………………………………………………………….…27
Table 4: Southern Africa Lion Habitat Patches…………………………………………………………………………………….…37
Table 5: Lion Strongholds………………………………………………………………………………………………………………………39
Table 6: Estimated Number of Lions per Country…………………………………………………………………………………..41
Table 7: LCUs with Recently Extirpated Lion Populations……………………………………………………………………….42
Table 8: New Lion Habitat Patches…………………………………………………………………………………………………………43
Table 9: Potential Lion Strongholds……………………………………………………………………………………………………….49
List of Figures
Figure 1: Land Conversion in West Africa as per Google Earth Imagery (Pimm et al. in prep)…………………67
Figure 2: Refined Land Conversion in West Africa as per Google Earth Imagery…………………………………….68
Figure 3: Land Conversion in Southern Africa as per Google Earth Imagery………………………………………..…69
Figure 4: Refined Land Conversion in Southern Africa as per Google Earth Imagery………………………………70
Figure 5: Human Population Density in Africa for 2000 (CIESIN 2005)……………………………………………………71
Figure 6: Refined Human Population Density in Africa for 2000…………………………………………………………….72
Figure 7: Lion Distribution in Kenya (KWS 2009)…………………………………………………………………………………….73
Figure 8: Lion Distribution in Tanzania (Mesochina et al. 2010b)……………………………………………………………74
Figure 9: Distribution of the Lion across Africa in Protected Areas and Lion Conservation Units……………76 (IUCN 2006a; IUCN 2006b) Figure 10: Distribution of the Lion across Africa in Protected Areas and Lion Habitat Patches……………….77 (this study) Figure 11: Geographic Regions of Lion Populations in Africa as Defined in this Study…………………………….78
Figure 12: Distribution of the Lion in West Africa…………………………………………………………………………………..79
v
Figure 13: Distribution of the Lion in Central Africa……………………………………………………………………………….80
Figure 14: Distribution of the Lion in East Africa…………………………………………………………………………………….81
Figure 15: Distribution of the Lion in Southern Africa…………………………………………………………………………….82
Figure 16: Comparison of Lion Habitat Patches (this study) and Lion Conservation Units………………………83 (IUCN 2006a; IUCN 2006b) in West Africa Figure 17: Comparison of Lion Habitat Patches (this study) and Lion Conservation Units………………………84 (IUCN 2006a; IUCN 2006b) in Central Africa Figure 18: Comparison of Lion Habitat Patches (this study) and Lion Conservation Units………………………85 (IUCN 2006a; IUCN 2006b) in East Africa Figure 19: Comparison of Lion Habitat Patches (this study) and Lion Conservation Units………………………86 (IUCN 2006a; IUCN 2006b) in Southern Africa Figure 20: Lion Strongholds and Potential Strongholds across sub-Saharan Africa………………………………...88
Figure 21: The Niokolo-Guinea Potential Lion Stronghold in West Africa with including Estimated……….89
Number of Lions and Potential Connections between Lion Habitat Patches
Figure 22: The W-Arly-Pendjari Complex Lion Stronghold in West Africa with including Estimated……….90
Number of Lions and Potential Connections between Lion Habitat Patches
Figure 23: Potential Lion Strongholds in Central Africa including Estimated Number of Lions and…………91 Potential Connections between Lion Habitat Patches
Figure 24: Potential Lion Strongholds in the Northern Half of East Africa including Estimated Number…92 Of Lions and Potential Connections between Lion Habitat Patches Figure 25: Lion Strongholds and Potential Lion Strongholds in the Southern Half of East Africa…………….93 including Estimated Number of Lions and Potential Connections between Lion Habitat Patches Figure 26: Lion Strongholds and Potential Lion Strongholds in Southern Africa including Estimated……94
Number of Lions and Potential Connections between Lion Habitat Patches

vi
List of Abbreviations
BCI National Geographic’s Big Cats Initiative
CA Conservation Area
CAR Central African Republic
CHA Controlled Hunting Area
DRC Democratic Republic of Congo
FR Forest Reserve
GCA Game Conservation Area
GMA Game Management Area
GR Game Reserve
HA Hunting Area
IUCN International Union for Conservation of Nature
KWS Kenya Wildlife Service
LCU Lion Conservation Unit
NGA Non-Gazetted Area
NP National Park
NR National Reserve
PA Protected Area
PR Partial Reserve
SA Safari Area
TFCA Transfrontier Conservation Area
UWA Uganda Wildlife Authority
WMA Wildlife Management Area
WR Wildlife Reserve
ZAWA Zambia Wildlife Authority

1
Introduction
Historically lions ranged from Africa, east across southern Asia into India, and north into south-
east Europe. Thousands of years of human persecution and habitat loss have drastically reduced the
distribution of lions. Lions in Europe went extinct nearly 2,000 years ago (Nowell and Jackson 1996), and
a small population of 411 animals is all that remains of the once widespread Asiatic lion (Panthera leo
persica) in and around Gir Forest NP in western India (Singh and Gibson 2011). The African lion (Panthe-
ra leo leo) once ranged across the entire African continent – with the exception of the Sahara Desert and
rainforests. The current lion range in Africa is estimated at approximately 3,000,000 km2 (Chardonnet
2002; IUCN 2006a; IUCN 2006b). This represents less than a quarter of its historic range. Recent re-
search estimates a loss of nearly half of the lions in the past two decades. Estimates of the historic
number of lions in Africa range from approximately 400,000 in 1950 (Myers 1975) to 75,800 individuals
in 1980 (Ferreras and Cousins 1996). In the mid-1990s Nowell and Jackson (1996) proposed a popula-
tion of between 30,000 and 100,000 lions. The most recent estimates put lion populations much lower.
Bauer and Van Der Merwe (2004) estimated a total of 23,000 lions, while Chardonnet (2002) proposed a
figure just above 39,000. The recent lion conservation strategy reports produced by the IUCN (2006a;
2006b) note an estimated continent-wide lion population of approximately 33,000 individuals. Some
news reports and nature documentaries put their numbers as low as 20,000 lions remaining in the
whole of Africa (Jackman 2008; Joubert 2011; Kirby 2003).
Due to population reductions from habitat loss and persecution, the African Lion has been listed
as “vulnerable” by the IUCN Red List of Threatened Species since 1996 (Bauer et al. 2008). However giv-
en recent declines, several conservation organizations propose to list the African lion as “endangered”
under the U.S. Endangered Species Act and to upgrade the species’ CITES protections from Appendix II
to Appendix I (Place et al. 2011). Since their numbers are estimated at well below the 2,500 individuals
to qualify as endangered, the regional population of lions in West Africa has an endangered classifica-
tion in the Red List (Bauer and Nowell 2004). Estimates of lion numbers in this portion of Africa range
are low, ranging from 850 (Bauer and Van Der Merwe 2004) to 1,163 individuals (Chardonnet 2002).
These lions have been given special consideration since they are considered genetically distinct from
lions in the remainder of the continent (Bertola et al. 2011).
The stated goal of National Geographic’s Big Cat Initiative is to halt the loss of lions across their
remaining range and restore populations to sustainable levels. Therefore, determining the size and dis-

2
tribution of lion populations both inside and outside PAs is critical. The IUCN (2006a; 2006b) addressed
this need by creating LCUs modeled after the Jaguar Conservation Units (JCUs) delineated by Sanderson
et al. (2002). They state that, “A LCU is defined as an area of known, occasional and/or possible lion
range that can be considered an ecological unit of importance for lion conservation (IUCN 2006b).”
Another crucial component to assessing the status of lions across their range is to determine which
populations can be considered “lion strongholds.” That is, which populations meet the necessary re-
quirements for long-term viability. The concept of a lion stronghold is not new and recent calls for lion
conservation action have included the need to, “…identify regional strongholds for the species that have
the highest probability of persistence in the long-term (Treves et al. 2009).” The final component
needed to fully assess the conservation status of lion populations is to identify connected sub-
populations and areas that can serve as corridors between existing PAs to maintain genetic transfer and
long term viability of lions as a species (Harrison 1992).
Objectives
There are three main objectives of this study:
1. Create a database of all known lion populations based on recent survey data;
2. Map present lion distribution and potential remaining habitat across sub-Saharan Africa; and
3. Determine connectivity between habitat patches and assess the long-term viability of lion popu-
lations to delineate lion strongholds.

3
Methods
Lion Population Assessment
To map current lion distribution I first needed to create a database of all known lion popula-
tions. Four main papers concerning lion population inventories and assessments across the whole of
Africa provide the backbone of the database (Bauer and Van Der Merwe 2004; Chardonnet 2002; IUCN
2006a; IUCN 2006b). Supplementing those continent-wide reports, I found examples of national lion
conservation strategies and action plans which highlight the status of lions in specific countries and their
pressing conservation and research needs. Beyond the large-scale lion status reports, I searched for the
primary articles cited in these reports and newly published scientific lion population surveys to obtain
the most up-to-date data on lion numbers and distribution, and to determine where scientific surveys
have been conducted on lion populations throughout their range. With the help of Andrew Jacobson, I
compiled all of the data concerning lion populations into a database in Microsoft Excel.
Lion Habitat Patch Mapping
From the database I created a map of African countries with and without lions and mapped all
of the PAs containing (or possibly containing) lions in these countries using ArcGIS and data from the
2010 World Database on Protected Areas (IUCN and UNEP 2009). I then added in information concern-
ing the location of LCUs as delineated by the IUCN (2006a; 2006b). In order to determine the current
extent and distribution of lion habitat patches across sub-Saharan Africa, I further refined the LCUs using
four categories of data; land conversion, human population density, lion distribution from recent coun-
try-specific reports, and additional data from recent lion population surveys. The land conversion prod-
uct is the result of ongoing work by the BCI intern team using Google Earth satellite imagery to digitize
out (hand-draw polygons around) land conversion (croplands, villages, mines, etc.) in Africa (Pimm et al.
in prep). As of the completion of this report, the BCI intern team had produced a land conversion layer
spanning West and Central Africa from Senegal to Chad. A land conversion layer was also created for
the region in and around Tete Province, Mozambique (Van Aarde et al. in prep). For the purposes of this
report, I also digitized land conversion in northern Zimbabwe. To utilize these layers in the creation of
habitat patches, I converted the Google Earth products (.KML files) to a raster dataset in ArcGIS and ran
the Boundary Clean tool to remove cells of data too small to have an impact on lion distribution. I then
converted this raster to a polygon to smooth the habitat patch borders. To see examples of the land
conversion products in relation to IUCN’s LCUs, please refer to Appendix A (Figures 1 through 4). Pimm

4
et al. (in prep) found that land conversion in West and Central Africa correlated well with a human
population density threshold of greater than 10 people per km2.
Wanting to be more conservative with my extrapolation of this conclusion to East and Southern
Africa, I excluded all regions with a density of humans greater than 25 people per km2 from the refined
lion habitat patches using the 2000 Gridded Population of the World version 3 dataset from Columbia
University’s Center for International Earth Science Information Network (CIESIN 2005). To do so, I
created a raster layer in ArcGIS of just those density values less than 25 people per km2 and processed
the information using the same method as described for the land conversion data. The human popula-
tion density layers can be found in Appendix A (Figures 5 and 6). Since the creation of IUCN’s LCUs in
2006, a number of detailed countrywide reports have produced updated lion range maps, and I used
this information to incorporate the new data on lion distribution for the habitat patches (examples can
be found in Appendix A, Figures 7 and 8). I only incorporated into the refined habitat patches those
areas that are noted as having permanent lion populations. This was also done for regions where recent
lion population surveys had provided new information concerning lion distribution. Finally, I retained
the original LCU boundaries for habitat patches where new data did not exist, and where human popula-
tion density did not restrict potential lion range. I utilized these four data layers to refine lion habitat
patches in a rule-based hierarchical system (Rule #1 takes precedence over the information in Rule #2,
etc.):
1. Exclude digitized land conversion as per Google Earth imagery.
2. Exclude human population density greater than 25 people per km2.
3. Incorporate permanent lion distribution as noted in recent countrywide reports and lion popula-
tion surveys and remove those regions listed as having possible, temporary, or occasional lion
populations.
4. Retain the original LCU boundaries where additional data is lacking.
Lion Stronghold Delineation
The final portion of analysis in this study was to assess which lion habitat patches could be con-
sidered lion strongholds. As stated earlier, a lion stronghold can be defined as a lion habitat patch
where the species has “…the highest probability of persistence in the long-term (Treves et al. 2009).” To
meet the requirement that a habitat patch could sustain a lion population in the long-term, I assessed
each patch to determine if it achieves each of the following three qualifications:

5
1. Contains enough individuals to maintain a large outbred population (minimum viable population
size);
2. Those lions are found in PAs such as NPs, GRs, HAs, and WRs; and
3. The population of lions has a stable or increasing trend.
Bjorklund (2003) assessed the risk of inbreeding in lion populations due to habitat loss. He determined
that, “…to sustain a large outbred population of lions, a continuous population of at least 50 prides, but
preferably 100 prides, with no limits to dispersal is required.” With an average lion pride containing ap-
proximately five adults, the minimum viable population for lions is between 250 and 500 lions (Bauer et
al. 2008). I used the higher population estimate of 500 lions as a requirement for a lion habitat patch to
be considered a lion stronghold. From the data derived in the lion population assessment, as well as the
World Database on Protected Areas (IUCN and UNEP 2009), I considered only those lions found within
existing PAs to count towards the minimum viable population. Finally, only lion habitat patches that are
contained within LCUs having stable or increasing lion population trends as per the ICUN (2006a; 2006b)
are noted as being lion strongholds. Here I have attempted to place the greatest restrictions on a habi-
tat patch (within justifiable reason) for it to be considered as a lion stronghold in order for the label to
have the greatest conservation value.

6
Results
Lion Population Assessment
The first result from this research is an Excel database of lion population locations and numbers. This
document compiles all of the studies concerning lion populations into a single concise database that will
be useful for researchers and managers interested in lion conservation. The spreadsheet acts as a work-
ing document, available to be edited and updated as new information arises and studies are conducted.
Below I describe the most recent data pertaining to each habitat patch delineated using the methods
outlined above, and provide a lion population estimate for each region. This section is divided between
each geographical region in sub-Saharan Africa (West, Central, East, and Southern; Appendix B, Figure
11), and largely follows the order presented by the IUCN (2006a; 2006b) in their description of LCUs. I
define West Africa as those countries spanning from Senegal and Guinea-Bissau to Nigeria. Central Afri-
ca ranges from Cameroon to Sudan west of the Nile River, and includes northern DRC, Congo and Ga-
bon. The geographic region that I note as East Africa runs from Sudan east of the Nile River to Somalia,
and south to Tanzania. East Africa also includes the habitat patches of eastern DRC. Southern Africa is
defined as ranging from Angola to Mozambique (including southern DRC) and south to South Africa.
The population assessment for each region is followed by a table summarizing the information
concerning the habitat patches found in each section individually (Tables 1 through 4). I have also
mapped the LCUs and PAs known to contain resident lion populations as well as those PAs having possi-
ble, temporary or recently extirpated lion populations (Appendix B, Figure 9). Finally, I have mapped
each habitat patch along with its associated PAs and have created several maps comparing the original
LCUs with the newly delineated habitat patches (Appendix B, Figure 10 and Figures 12 through 19).
West Africa
1. Niokolo-Guinea
This LCU spans the borders between Guinea-Bissau, Guinea, Senegal, and Mali extending south into
eastern Guinea and has a total area of 173,769 km2. Chardonnet (2002) notes a total estimated popula-
tion of 205 lions in this region. Bauer and Van Der Merwe (2004) suggest a higher population of 340
individuals; however Bauer et al. (2005) note that they overestimated lion numbers by three times in
Guinea. This would result in a population of approximately 206 lions across the LCU. The IUCN (2006a)
report gives a significantly higher population estimate of 500 to 1000 lions in this region. The findings

7
of this report show that the LCU has lost a considerable amount of area to land conversion and likely
should be split into three habitat patches; Guinea-Bissau/Guinea (15,489 km2), Niokolo Koba/Guinea-
Mali Border (73,793 km2), and Haut Niger (613 km2).
a) Guinea-Bissau/Guinea
Chardonnet (2002) notes a potential population of approximately 10 lions in the Boe and Beli regions of
southeastern Guinea-Bissau. In the same area, Bauer and Van Der Merwe (2004) estimate 30 resident
individuals. Brugiere and Kormos (2009) note the existence of lions in Ndama FR in northwest Guinea; a
region likely connected to the population along the Guinea-Bissau border. A lion survey conducted by
Brugiere et al. (2005) in southern Guinea-Bissau and western Guinea found that lions are potentially
widely distributed in the southern and eastern parts of Guinea-Bissau, and that the bordering region of
Guinea holds a “limited” lion population. However, lions were not found in or around coastal villages
and hunters in these areas could not recognize the species. While their study did not attempt to quanti-
fy lion numbers in the region, they did suspect low density due to low prey abundance. A low density of
approximately 0.2 to 0.6 lions per 100 km2 (as per Chardonnet 2002) across the predicted habitat patch
results in an estimate of 30 to 93 lions. However, the data from previous studies would suggest that the
habitat patch over predicts lion range (especially in Guinea). Therefore, I suspect that fewer than 50
lions remain in this region.
b) Niokolo Koba/Guinea-Mail Border
Chardonnet (2002) estimates lion numbers for several of the regions in this habitat patch. In Senegal he
estimates 125 lions in Niokolo Koba NP and 31 lions in the Faleme HA east of the park. He notes that
lions erratically enter northern Guinea-Bissau from Niokolo Koba. For the border region of northern
Guinea and southern Mali, he estimates a total of 39 lions (21 and 18 respectively). Bauer and Van Der
Merwe (2004) break down the habitat patch in a similar manner. They estimate 60 lions in the entire
Niokolo Koba ecosystem, 50 lions in northern Guinea, and 50 lions in southern Mali. An aerial and terre-
strial survey of wildlife across all of Niokolo Koba by Renaud (2006) found little evidence of lions in the
park. Density estimates for the species could not be determined since only two individuals were en-
countered on a single occasion. They note, “…it is likely that large areas of the park have not seen
lions…for a long time.” A separate survey of large carnivore observations across West and Central Africa
from 2005 to 2008 noted only three sightings of individuals and lion signs in Senegal; all of which oc-
curred along the border with Mali, east of Niokolo Koba NP (Boulet et al. 2008). Brugiere and Kormos

8
(2009) note the presence of lions in several regions of northern Guinea including Bakoun FR and in the
Bakoy and Tinkisso areas along the border with Mali. They also suggest the presence of lions in Balayan
Souroumba and Bani-Dar-es-Salam FRs in northern Guinea based on reports from 1998 and 1997 re-
spectively. However, these regions have experienced severe land conversion and are likely functionally
extirpated and/or disconnected from the larger population. These lion population estimates suggest
low lion densities across a fairly large area. The habitat patch delineated in this study likely overesti-
mates the potential lion range in the region. I propose that no more than 200 lions remain in this habi-
tat patch (approximately 100 lions in both the Niokolo Koba ecosystem and the Guinea-Mali border
area).
c) Haut Niger
In their survey of mammals in Haut Niger NP from 1995 to 1997, Ziegler et al. (2002) state that the lion
had disappeared from the region. Brugiere and Magassouba (2003) later updated that finding noting
that, “Lions returned in 1997-1998, probably from an area to the north of the Park along the Tinkisso
River, where this species has always been present.” They estimate a population of five to eight individu-
als in the northern part of the park in the Mafou Forest. Lions are not found in Kouya Forest, the south-
ern core area of the park (Chardonnet 2002). Bauer and Van Der Merwe (2004) estimate a population
of 15 lions in the whole of central Guinea. Brugiere and Kormos (2009) cite a 1998 report noting lions in
the Kankan Faunal Reserve, but extensive land conversion in this region has likely extirpated the species
in the park. Given this recent data I have restricted the habitat patch to the park alone, and would ex-
pect a lion population of less than 10 individuals.
Given the known data on lions in the region, a maximum estimate of 250 lions across the LCU (divided
into three habitat patches) is reasonable.
2. Boucle Baoule
This LCU primarily falls across Boucle du Baoule NP and surrounding reserves in Mali, having a total area
of 5,029 km2. Chardonnet (2002) states that a small relict population of lions (three or four individuals)
may still occur in the region but their presence is uncertain. The IUCN (2006a) estimated a population of
30 to 50 individuals for the LCU. Given the small population of lions that potentially remain in the park, I
propose that the associated lion habitat patch (4,672 km2) covers the boundary of the park alone, even
though potential lion habitat remains surrounding the park. With a density range from 0.2 to 0.5 lions
per 100 km2 (as per Chardonnet 2002), a lion population of 10 to 25 individuals is possible.
9
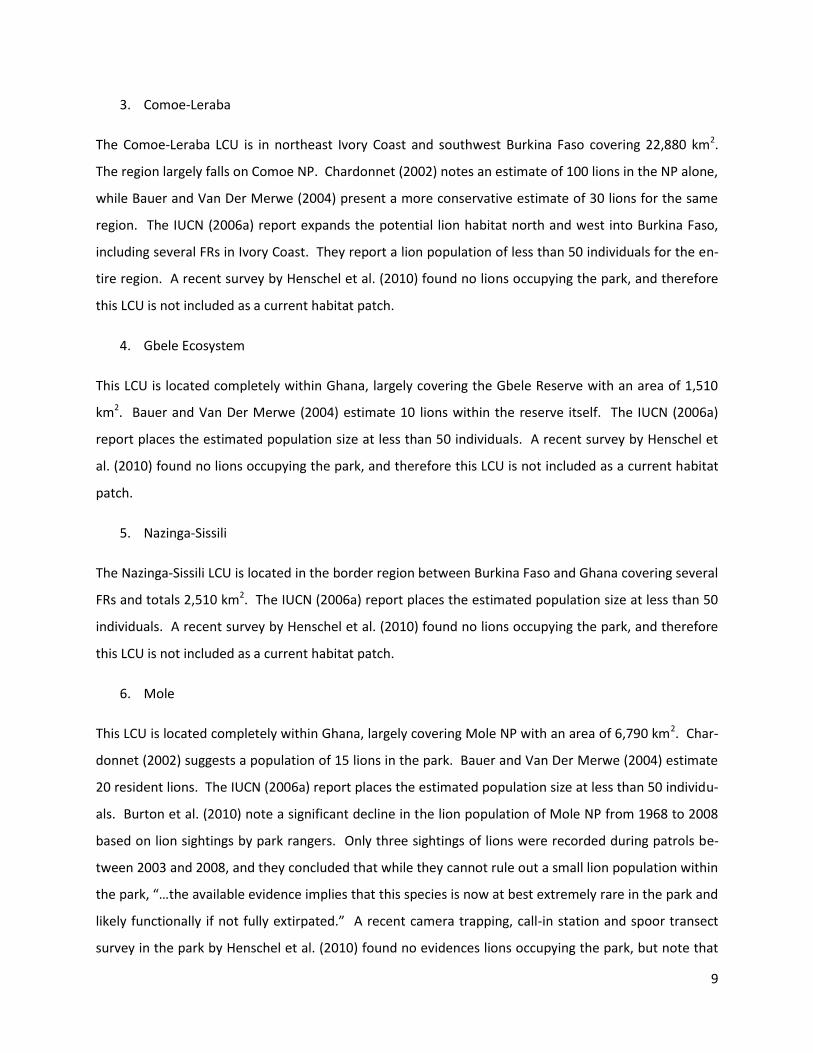
3. Comoe-Leraba
The Comoe-Leraba LCU is in northeast Ivory Coast and southwest Burkina Faso covering 22,880 km2.
The region largely falls on Comoe NP. Chardonnet (2002) notes an estimate of 100 lions in the NP alone,
while Bauer and Van Der Merwe (2004) present a more conservative estimate of 30 lions for the same
region. The IUCN (2006a) report expands the potential lion habitat north and west into Burkina Faso,
including several FRs in Ivory Coast. They report a lion population of less than 50 individuals for the en-
tire region. A recent survey by Henschel et al. (2010) found no lions occupying the park, and therefore
this LCU is not included as a current habitat patch.
4. Gbele Ecosystem
This LCU is located completely within Ghana, largely covering the Gbele Reserve with an area of 1,510
km2. Bauer and Van Der Merwe (2004) estimate 10 lions within the reserve itself. The IUCN (2006a)
report places the estimated population size at less than 50 individuals. A recent survey by Henschel et
al. (2010) found no lions occupying the park, and therefore this LCU is not included as a current habitat
patch.
5. Nazinga-Sissili
The Nazinga-Sissili LCU is located in the border region between Burkina Faso and Ghana covering several
FRs and totals 2,510 km2. The IUCN (2006a) report places the estimated population size at less than 50
individuals. A recent survey by Henschel et al. (2010) found no lions occupying the park, and therefore
this LCU is not included as a current habitat patch.
6. Mole
This LCU is located completely within Ghana, largely covering Mole NP with an area of 6,790 km2. Char-
donnet (2002) suggests a population of 15 lions in the park. Bauer and Van Der Merwe (2004) estimate
20 resident lions. The IUCN (2006a) report places the estimated population size at less than 50 individu-
als. Burton et al. (2010) note a significant decline in the lion population of Mole NP from 1968 to 2008
based on lion sightings by park rangers. Only three sightings of lions were recorded during patrols be-
tween 2003 and 2008, and they concluded that while they cannot rule out a small lion population within
the park, “…the available evidence implies that this species is now at best extremely rare in the park and
likely functionally if not fully extirpated.” A recent camera trapping, call-in station and spoor transect
survey in the park by Henschel et al. (2010) found no evidences lions occupying the park, but note that

10
the northern portion of Mole should be surveyed. Given these recent reports, it is clear that lions are
either extirpated or near extinct in the park and therefore this LCU is not included as a current habitat
patch.
7. Bui-White Volta Ecosystem
The Bui-White Volta Ecosystem LCU is located completely within Ghana, largely covering Bui NP and two
adjacent FRs with a total area of 5,230 km2. The IUCN (2006a) report places the estimated population
size between 10 and 20 individuals. A recent survey by Henschel et al. (2010) found no evidence of lions
occupying the park, and therefore this LCU is not included as a current habitat patch.
8. Digya
This LCU is located completely within Ghana, covering Digya NP alone with a total area of 3,180 km2.
The IUCN (2006a) report places the estimated population size at less than 50 individuals. A recent sur-
vey by Henschel et al. (2010) found no lions occupying the park, and therefore this LCU is not included as
a current habitat patch.
9. Oti-Mandouri
The Oti-Mandouri LCU is located on the northern border of Togo and Benin and covers 990 km2. Char-
donnet (2002) notes that lions may occasionally occur in this region as transients while Bauer and Van
Der Merwe (2004) state that no resident lions remain in the region. The most recent evidence of lion in
Togo occurred in 2005 in the extreme northeastern corner of the country (Boulet et al. 2008). The IUCN
(2006a) report gives a population estimate of less than 50 individuals. However, given that resident
lions are unlikely to occur in this region, and severe land conversion across the LCU, this area is not in-
cluded as a current habitat patch.
10. W-Arly-Pendjari
The W-Arly-Pendjari (“WAP”) LCU covers a complex of PAs (NPs, HAs, and Faunal Reserves) spanning the
border region between Burkina Faso, Niger and Benin (31,047 km2). Chardonnet (2002) reports an esti-
mate of 768 lions occupying this area (248 in the Pendjari ecosystem, 116 in the “W” ecosystem, and
404 in the Arly-Singou complex). Bauer and Van Der Merwe (2004) suggest a more conservative esti-
mate of 215 individuals (45 in Pendjari, 70 in “W,” and 100 in Arly-Singou). The IUCN (2006a) report re-
flects this discrepancy noting a population size of either 250 to 500 or 100 to 250 lions. However, the

11
background paper to the IUCN report notes that recent surveys in Burkina Faso’s Arly-Singou complex
had confirmed Chardonnet’s lion density estimates in the region, stating that they were approximately
the same as the density found in the Pendjari complex (Bauer et al. 2005). A survey of the lion popula-
tions of Pendjari BR (including the NP and the surrounding HAs) estimated 178 lions in that region (Sog-
bohossou and Tehou 2007). Pellerin et al. (2009) estimated a total of 297 resident lions in Benin alone
including some NGAs (265 lions in PAs). Given little land conversion in the area and considering new
data on resident lion populations in Benin, I propose that the current habitat patch covers 29,403 km2
and contains at least 500 lions (265 in the PAs of Benin, a similar figure for the PAs of Burkina Faso, and
a few lions in Niger).
11. Alibori Superieur/Trois Rivieres
These FRs in Benin are not included in a LCU by the IUCN (2006a), but contain resident populations of
lions. Chardonnet (2002) estimate 35 lions in these two reserves. Pellerin et al. (2009) suggest a popu-
lation of 18 lions in Alibori Superieur FR and 19 individuals in Trois Rivieres FR. Land use conversion out-
side of these FRs and encroachment in the reserves themselves has likely fragmented these two popula-
tions and this is noted with the creation of two new lion habitat patches. The habitat patch surrounding
Alibori Superieur FR covers 1,742 km2 while the patch in and around Trois Rivieres FR covers 1,939 km2.
Although these habitat patches are smaller than the areas used in the Pellerin et al. (2009) study, I have
retained their estimates of lion populations in this report.
12. Mt Kouffe/Wari Maro
This LCU is located completely within Benin and covers two FRs totaling 3,510 km2. Bauer and Van Der
Merwe (2004) note 20 lions inhabiting these reserves. The IUCN (2006a) report places the total number
of individuals at less than 50. New data from Pellerin et al. (2009) suggests a limited population of only
three lions in the reserves; two in Mt Kouffe and one in Wari-Maro. However, these estimates are de-
rived from low density estimates extrapolated over the area of the reserves, and therefore must be con-
sidered speculative at best. The current habitat supporting lions in this region is composed of the two
reserves alone totaling 3,152 km2 and the estimate of three lions is used here.
13. Kainji Lake
The Kainji Lake LCU is located completely within Nigeria and is entirely protected as a NP (4,887 km2).
Chardonnet (2002) estimates 25 lions in the park. The IUCN (2006a) suggest a higher number of 50 indi-

12
viduals. A recent survey by Henschel et al. (2010) estimates a total of 24 lions remaining within the NP.
Some encroachment has occurred along the periphery of the park and the current habitat patch con-
taining lions in the region covers 4,171 km2.
14. Old Oyo
This LCU covers Old Oyo (Kainji Lake East) NP in Nigeria with an area of 1,700 km2. The only estimate of
a lion population within the park is by the IUCN (2006a) who put the total population at less than five
individuals. Henschel et al. (2010) believe that the lion is extirpated in the park and therefore this LCU is
not included as a habitat patch.
15. Kamuku/Kwiambana
This LCU totals 3,220 km2 and covers Kamuku NP and Kwiambana GR in Nigeria. Chardonnet (2002) es-
timates a total of 10 lions in these PAs, while the IUCN (2006a) report suggests a slightly higher number
of 25 to 35 individuals. A recent survey by Henschel et al. (2010) found no lions occupying the park, and
therefore this LCU is not included as a current habitat patch.
16. Lame-Burra/Falgore
The Lame-Burra/Falgore LCU covers two GRs in Nigeria (4,390 km2). The only estimate of a lion popula-
tion within the parks is by the IUCN (2006a) who put the total population between 25 and 35 individuals.
Henschel et al. (2010) believe that the lion is extirpated in the park and therefore this LCU is not in-
cluded as a habitat patch.
17. Yankari
The Yankari LCU is located completely within Nigeria and is entirely protected as a NP (3,084 km2).
Chardonnet (2002) estimates 50 lions in the park. The IUCN (2006a) reflect the number of 50 individu-
als. Using fecal DNA sampling, Tende et al. (2009) concluded that a population of at least 35 lions exists
in the park. A recent survey by Henschel et al. (2010) estimates a total of 15 lions remaining within the
NP. The current habitat patch containing lions in the region covers 2,660 km2.

13
Table 1: West Africa Lion Habitat Patches
Central Africa
1. Waza
This LCU wholly covers Waza NP in Cameroon and totals 5,380 km2. Chardonnet (2002) proposes a pop-
ulation of 70 lions in the park alone. Bauer and Van Der Merwe (2004) give a slightly more conservative
estimate of 60 lions for the region. The IUCN (2006a) report notes 50 individuals remaining in the park.
The Cameroon Lion Conservation Action Plan (2007) estimated 55 lions within Waza NP. Tumenta et al.
(2009) conducted the most recent survey of lion populations in the park and found a dramatic decline in
numbers to between 14 and 21 adult individuals. Given this recent data I use the estimate of less than
20 lions remaining within the LCU. The current habitat patch estimated here reflects the known lion
distribution presented in the national conservation plan (1,599 km2).
2. Benoue Complex
The Benoue Complex-Gashaka-Gumti LCU is located across northern Cameroon along a series of PAs
including Faro, Bouba Ndjida, and Benoue NPs and associated HAs, as well as neighboring Gashaka-
Gumti NP in Nigeria (30,211 km2). Chardonnet (2002) stated that the northern sector of Gashaka-Gumti
NP may contain a small population of lions, but does not estimate its number. He does, however, esti-
mate 345 lions residing in the Benoue complex. This was partly based on lion surveys carried out in Be-
noue NP by Planton (1997) and the WWF-FAC (1998) estimating 30 and 22 individuals respectively (den-
sities of 1.7 and 1.2 lions per 100 km2). Bauer and Van Der Merwe (2004) also do not estimate a lion
population for Gashaka-Gumti NP, but note 200 individuals in the Benoue complex. The IUCN (2006a)
estimate a total population size between 200 and 300 individuals. The Cameroon Lion Conservation Ac-
tion Plan (2007) estimated 330 lions across the Benoue complex split amongst the NPs and their asso-
Habitat Patch Estimated # of Lions Area (km2) Country Associated IUCN LCUGuinea-Bissau/Guniea <50 15,489 Guinea, Guinea-Bissau Niokolo-Guinea
Niokolo Koba/Guinea-Mali Border 200 73,793 Guinea, Mali, Senegal Niokolo-Guinea
Haut Niger 10 613 Guinea Niokolo-Guinea
Boucle Baoule 10-25 4,672 Mali Boucle Baoule
W-Arly-Pendjari 500 29,403 Benin, Burkina Faso, Niger W-Arly-Pendjari
Alibori Superieur 18 1,742 Benin N/A
Trois Rivieres 19 1,939 Benin N/A
Mt Kouffe/Wari Maro 3 3,152 Benin Mt Kouffe/Wari Maro
Kainji Lake 24 4,171 Nigeria Kainji Lake
Yankari 15 2,660 Nigeria Yankari
Totals: 857 137,634

14
ciated HAs; Benoue NP and HAs (115), Faro NP and HAs (125), and Bouba Ndjida NP and HAs (90). Bauer
(2007) surveyed Bouba Ndjida NP and determined a “conservative” density estimate of 2.8 lions per 100
km2, giving a total population of 60 individuals in the park alone. Iongh et al. in ROCAL (2009) report an
estimated 200 to 300 lions in all of Cameroon (within both Waza NP and the Benoue complex), and ob-
served a population density of 2.25 lions per 100 km2 in Benoue NP resulting in an estimate of 38 lions
(although they note that the density is “probably lower”). A recent survey by Henschel et al. (2010)
found no lions occupying Gashaka-Gumti NP. Therefore it is believed that lions no longer exist on the
Nigerian side of this LCU. I estimate a total habitat patch size of 14,682 km2 (7,163 km2 in NPs) in Came-
roon alone based on the known lion distribution presented in the national conservation plan. Based on
recent data and average lion densities (2.5 lions per 100 km2 in NPs and 1.0 lion per 100 km2 in HAs), I
estimate a population of approximately 250 lions in the Benoue complex.
3. Chad-RCA
This LCU covers a vast region (440,260 km2) of southeastern Chad and the eastern half of the Central
African Republic (CAR). Chardonnet (2002) notes a total estimated population of 1506 lions in this re-
gion. Bauer and Van Der Merwe (2004) propose a much more conservative estimate of 450 lions. How-
ever, Bauer et al. (2005) note that Chardonnet (2002) had more information when making his estimates
of lion populations across this region, and likely gave a better estimate of numbers across the LCU. The
IUCN (2006a) report suggests a total lion population of 1500 individuals across the LCU, echoing the es-
timates proposed by Chardonnet (2002). The findings of this report show that the LCU is largely intact
and suffers little land conversion, but for the purposes of estimating numbers I split the LCU into two
fully connected habitat patches totaling 483,830 km2; SE Chad (133,907 km2) and E CAR (328,224 km2).
a) Southeastern Chad
Chardonnet (2002) estimates a total of 520 lions in Chad alone divided into three areas; Zakouma NP
(100), Aouk HA (94) and the Guerra and Salamat regions (326). Bauer and Van Der Merwe (2004) pro-
pose a more restricted lion distribution and population in Chad covering Zakouma NP (50) and the
southern portion of the country including Aouk HA (100); they estimate 150 lions in the country. Van-
herle (2007) surveyed lion populations in Zakouma NP from 2003 to 2006 and estimated a total of 140
lions in the PA alone. A recent survey of large carnivore observations across West and Central Africa
from 2005 to 2008 noted two lion sightings near Lake Fitri to the northeast of the delineated LCU (Bou-

15
let et al. 2008). Given the size of the habitat patch, coupled with the number of lions in Zakouma NP, I
propose a population estimate of 500 lions for Chad.
b) Eastern CAR
Chardonnet (2002) proposes a resident population of 986 lions in CAR spilt amongst two areas: the Ma-
novo-Gounda-St Floris NP complex and the Bamingui-Bangoran NP complex (555) and the HAs in the
eastern portion of the country (431). Bauer and Van Der Merwe (2004) provide only a country total of
300 resident lions. Mesochina et al. (2010a) estimate a total population of 1,252 permanent lions in
CAR. Eight of these lions fall outside of the Eastern CAR habitat patch giving an estimate of 1,244 lions. I
have modeled the Eastern CAR habitat patch based on the distribution of permanent lion populations
found in Mesochina et al. (2010a), adjusted for human population density.
Given the known data on lions in the region, an estimate of approximately 1,744 lions across the LCU
(divided into two fully connected habitat patches) is reasonable.
4. Nana Barya GR and Bozoum NGA
These habitat patches are not included in a LCU by the IUCN (2006a), but both contain resident popula-
tions of lions. Mesochina et al. (2010a) estimate a small population of four lions in each area. The habi-
tat patch surrounding Nana Barya GR covers 2,314 km2 while the patch in the Bozoum NGA covers 8,383
km2.
5. Southwestern Sudan
The Southwestern Sudan LCU covers a large portion of the southern half of the country west of the Nile
River (358,150 km2). Chardonnet (2002) provides a “highly speculative” estimate of lion populations in
Sudan based on bibliographical references from the 1980s, deductive cartography, and personal com-
munications. He notes that the Bahr el Gazal region of the country (including the vast Southern NP)
could contain 364 resident lions given a low lion density estimate of 0.2 lions per 100 km2 across a range
of 182,000 km2. Bauer and Van Der Merwe (2004) simply mention that an “absence of information” oc-
curs for the region. The IUCN (2006b) provide an estimate of 250 to 500 lions across the LCU. I have
restricted the original LCU slightly to represent unsuitable human population densities in the core of the
region. This provides a habitat patch totaling 331,834 km2. Applying the low density figure from Char-
donnet (2002), an estimated 664 lions could occupy this territory. Given the lack of recent data, I pro-

16
pose a speculative lion population of 500 based on the IUCN (2006b) data and the density estimates
from Chardonnet (2002).
6. Garamba-Bili Uere Complex
This LCU falls completely within the DRC and covers 131,640 km2 including the Garamba NP complex
and the Bomu and Bili Uere HAs. Chardonnet (2002) estimate a total of 400 lions resident within the
LCU split between the Garamba complex and the Bomu/Bili Uere HAs (180 and 220 respectively). Bauer
and Van Der Merwe (2004) do not estimate lion numbers in the HAs, but propose a population of 150
individuals in the Garamba complex. The IUCN (2006b) report provides an estimate of 100 to 250 lions
across the LCU. Human population density data removes little from the original LCU and the habitat
patch I propose for the region covers 115,671 km2. Due to a lack of updated data for northern DRC, I
retain the population estimate from the IUCN (2006b).
7. Odzala
This LCU is located completely within Congo, covering the southern tip of Odzala NP with an area of
1,890 km2. Chardonnet (2002) notes a lion population of 40 individuals in the region. Bauer and Van
Der Merwe (2004) estimate a maximum of 25 individuals in the park but suggest that lions are likely ex-
tirpated. The IUCN (2006a) report places the estimated population size at less than 50 individuals.
Chardonnet also proposes a population of 40 lions in the Bateke Plateau spanning the border of Congo
and Gabon. A recent survey by Henschel et al. (2010) found no evidence of lions in Odzala NP or the
Bateke Plateau and notes that, “…it is reasonable to assume that resident populations are extirpated in
both countries.” Therefore, this LCU is not included as a current habitat patch.
Table 2: Central Africa Lion Habitat Patches

17
East Africa
1. Boma-Gambella
The Boma-Gambella LCU covers a large region of Southern Sudan stretching from the Nile River, east to
the western tip of Ethiopia (107,100 km2). Chardonnet (2002) provides a “highly speculative” estimate
of lion populations in Sudan based on bibliographical references from the 1980s, deductive cartography,
and personal communications. He notes that Bandingilo NP and Boma NP could contain a total of 393
resident lions given a lion density estimate of 1.0 lions/100 km2 in the parks alone. Chardonnet also es-
timates 162 lions for Gambella NP giving a total of 555 lions for the LCU. Bauer and Van Der Merwe
(2004) simply mention that an “absence of information” occurs for Sudan, but estimate a population of
150 lions in Gambella NP. The IUCN (2006b) provide an estimate of 250 to 500 lions across the LCU. In
the National Lion Conservation Workshop report (Gebresenbet et al. 2009), Hans Bauer states that,
“…the Gambella-Boma area hosts 500 lions.” I have restricted the original LCU slightly to represent un-
suitable human population densities in the core of the region. This provides a habitat patch totaling
106,941 km2. Given the speculative estimates concerning this LCU, I retain the most recent figure that a
lion population of 500 individuals resides in the habitat patch.
2. Kidepo Valley
This region contains two connected LCUs in the border region between Southern Sudan and northern
Uganda totaling 7,520 km2. The Kidepo Valley-Sudan LCU covers 7,160 km2 largely across the Kidepo
GR, while the Kidepo Valley-Uganda LCU covers 360 km2 across Kidepo NP. Both Chardonnet (2002) and
Bauer and Van Der Merwe (2004) propose a population of 25 lions in the Uganda portion of the region.
Chardonnet estimates a total of six lions in Kidepo GR, Sudan. The IUCN (2006b) report provides esti-
mates of less than 50 lions in Kidepo Valley-Sudan and less than 35 lions in Kidepo Valley-Uganda. Based
on lion surveys in Kidepo Valley NP, Uganda, the UWA estimated 58 lions in the region (Dricuru and Sie-
fert 2005). Combining both LCUs and accounting for human population density, the current habitat
patch covers 9,283 km2 and likely contains less than 100 lions.
3. South Omo and Borana
The South Omo LCU covers 19,310 km2 across a complex of NPs, CHAs, and WRs in Ethiopia. Chardonnet
(2002) notes a population of 141 lions contained within this LCU in Omo and Mago NPs, Tama WR, and
Omo West CHA. He also places 281 lions in a population across Yabello Sanctuary, Chelbi WR, and Bora-

18
na and Murle CHAs, and 120 lions in the NGAs surrounding those parks. Chelbi WR and Murle CHA are
included in the LCU, but the remainders are beyond its limits. Bauer and Van Der Merwe (2004) state
that while lions are present in Omo and Mago NPs, their numbers are not estimated. They do, however,
estimate 100 individuals residing in the Borana CHA. The IUCN (2006b) propose an estimated lion popu-
lation size of 100 to 250 individuals. In the National Lion Conservation Workshop report (Gebresenbet
et al. 2009), Hans Bauer states that, “…the second largest *lion population in Ethiopia+ is the Greater
Omo region.” Their numbers show approximately 250 lions in the area, which includes the Borana CHA
and the surrounding parks stated above. A lion distribution map presented in the report shows known
lion populations within the LCU and in the eastern portion of Borana CHA. Given this information, I pro-
pose two habitat patches covering the region; South Omo (17,012 km2) and Borana (9,297 km2). With a
conservative lion density estimate of 1.0 lions per 100 km2 for South Omo, based on the findings pre-
sented by Chardonnet (2002), the estimated population for the patch is 170. Maintaining the popula-
tion estimate for the region found in the most recent work by Gebresenbet et al. (2009), approximately
80 lions reside in the Borana habitat patch.
4. Bale
The Bale LCU is located across the Bale Mountains NP and surrounding WR and CHA in Ethiopia (1,090
km2). Chardonnet (2002) provide a population estimate of 97 lions in this region. Bauer and Van Der
Merwe (2004) propose a more conservative estimate of 50 lions. The IUCN (2006b) report notes a
population of less than 50 individuals across the LCU. Gebresenbet et al. (2009) show a slightly different
known range of lions in the region and estimate 50 lions in the area. The habitat patch I propose reflects
this data and covers 1,960 km2.
5. Welmel-Genale
This LCU covers 6,800 km2 in a NGA of southern Ethiopia. Neither Chardonnet (2002) nor Bauer and Van
Der Merwe (2004) provide a lion population estimate for the region. The IUCN (2006b) report gives a
population of between 50 and 100 individuals. Gebresenbet et al. (2009) estimate 100 lions in an area
slightly larger than the original LCU. Given this data I reflect a population of 100 lions in a habitat patch
covering 9,783 km2.

19
6. Awash
The Awash LCU spans the Awash NP and its associated WRs and CHAs in Ethiopia (15,160 km2). Char-
donnet (2002) proposes a large population of 423 lions in the region. Bauer and Van Der Merwe (2004)
do not estimate lions in this LCU. The IUCN (2006b) give a population estimate of less than 50 individu-
als. Gebresenbet et al. (2009) estimate 50 lions in an area larger than the original LCU; the known lion
range is expanded to the north. Given this data I reflect a population of 50 lions in a habitat patch cov-
ering 25,302 km2.
7. Eastern Hararghe
This habitat patch is not included in a LCU by the IUCN (2006a), but contains a resident population of
lions in Eastern Hararghe CHA in Ethiopia. Chardonnet (2002) estimates 350 lions in this region. Bauer
and Van Der Merwe (2004) propose a similar population of 300 individuals. Gebresenbet et al. (2009)
do not provide an estimate of lion numbers, but do note a known lion distribution in the region that is
significantly smaller than those proposed by Chardonnet (2002) and Bauer and Van Der Merwe (2004).
Based on that data, the habitat patch in the northern portion of the CHA covers 6,629 km2. Given a low
lion population density estimate of 1.0 lions per 100 km2 as reflected in similar habitat patches in Ethi-
opia, I estimate 66 lions residing in the habitat patch.
8. Ogaden
This LCU covers a region of eastern Ethiopia including the southern tip of Eastern Hararghe CHA (35,370
km2). Chardonnet (2002) notes a population of 50 lions residing in the area. Bauer and Van Der Merwe
(2004) estimate a much larger population of 250 individuals. The IUCN (2006b) report gives a lion popu-
lation range of 50 to 100 individuals. Gebresenbet et al. (2009) estimate 100 lions in an area significant-
ly larger than the original LCU; the known lion range is expanded into the vast semi-arid region to the
east. Given this data I reflect a population of 100 lions in a habitat patch covering 88,124 km2.
9. Albertine South
The Albertine South LCU is located in the border region of the DRC and Uganda across a complex of NPs
and GRs including Virunga and Queen Elizabeth NPs (3,200 km2). Based on a study conducted in Queen
Elizabeth NP in 1998, a lion population of 160 to 210 individuals was estimated for the park alone (Dricu-
ru 1999). Chardonnet (2002) estimates a total of 380 lions in the LCU with 156 individuals in Virunga NP,
and 224 lions in Queen Elizabeth NP. Bauer and Van Der Merwe (2004) note a total population of 290
20
lions (90 in Virunga NP and 200 in Queen Elizabeth NP). The IUCN (2006b) propose a population of 100
to 250 resident lions in the region. Dricuru and Siefert (2005) give an estimated number of 206 lions
within Queen Elizabeth NP. Treves et al. (2009) used prey density to predict lion abundance in Virunga
NP and estimated a population of 36 to 82 individuals; they noted a total population of 221 lions in
2004. Given this data, I propose that approximately 250 lions inhabit a habitat patch covering 4,159
km2.
10. Albertine North
This LCU covers 2,000 km2 and is located completely within the DRC in a NGA north of Virunga NP. Only
the IUCN (2006b) report estimates a lion population in this region, noting less than 50 individuals. How-
ever, the LCU proposed by the IUCN (2006b) is affected completely by high human population density
and the only remaining habitat for lions in the region occurs across the border in Uganda. Lions are
known to reside here in Toro-Semiliki GR. Chardonnet (2002) estimates a small population of five lions
in this PA. Dricuru and Siefert (2005) propose a slightly higher lion population of 10 individuals. Given
this data, I have created a new habitat patch surrounding Toro-Semiliki GR in Uganda (2,137 km2) and
keep the estimate of 10 lions.
11. Murchison Falls
This NP in Uganda contains two connected LCUs totaling 1,460 km2. The Murchison Falls North LCU
covers 570 km2, while the Murchison Falls South LCU covers 890 km2. Chardonnet (2002) estimates a
total of 364 lions across the park. Bauer and Van Der Merwe (2004) propose a similar estimate of 350
individuals. The IUCN (2006b) report provides estimates of 100 lions in the North and less than 30 lions
in the South. Based on lion surveys in the park, the UWA estimated 324 lions in the region (Dricuru and
Siefert 2005). Given this recent data, I retain the estimate of 324 lions in the habitat patch (3,889 km2).
12. Lake Mburu
This habitat patch is not included in a LCU, but contains a resident population of lions in Lake Mburu NP
in Uganda. The UWA noted that three lions dispersed into the park from neighboring populations in
Tanzania (Dricuru and Siefert 2005). The park and habitat patch cover 373 km2.

21
13. Laikipia-Samburu
The Laikipia-Samburu LCU covers 21,890 km2 in central Kenya. Chardonnet (2002) proposes a popula-
tion of 362 lions in the region with 264 individuals in the Laikipia ranchlands and 98 lions in the Sambu-
ru, Shaba, and Buffalo Springs NRs. Bauer and Van Der Merwe (2004) estimate 120 lions for the same
area. The IUCN (2006b) note a total of 350 lions resident in the LCU. Recent data collected by the Living
with Lions Project and the KWS put the total lion population in the region at 330 individuals; 230 in Lai-
kipia and 100 in the Samburu/Isiolo area (KWS 2009). However, they state that the estimate for the
Samburu/Isiolo area is simply an educated guess, as no true information exists for the region. Given this
recent data, I retain the estimate of 330 lions in the habitat patch (35,511 km2).
14. Meru
This LCU contains Meru and Kora NPs and several NRs in central Kenya (2,460 km2). Chardonnet (2002)
estimates 65 lions in the region. Bauer and Van Der Merwe (2004) give a slightly higher estimate of 80
individuals. The IUCN (2006b) report proposes a population of between 100 and 250 lions for the LCU.
Recent data collected by the KWS put the total lion population in the region at 40 individuals (KWS
2009). Given this recent data, I retain the estimate of 40 lions in the habitat patch (7,365 km2).
15. Arboweerow-Alafuuto
The Arboweerow-Alafuuto LCU covers 24,750 km2 of non-gazetted lands in southern Somalia. Chardon-
net (2002) does not estimate a lion population in this region, but does propose two populations to the
north in Somalia’s El Bur region and Swamp NP; 128 and 21 lions respectively. Bauer and Van Der
Merwe (2004) simply state that information is not available for the country. The IUCN (2006b) estimate
a total of 100 to 250 lions for the LCU. Since no recent data is available for Somalia, I tentatively keep
the LCU and lion population estimate as proposed by the IUCN.
16. Arawale-Bush Bush
This LCU originally covered Bush Bush NP and the region surrounding it in Somalia (12,400 km2). How-
ever, recent data places a permanent population of lions in the neighboring area of Kenya including pro-
tected areas such as Arawale, Boni, and Dodori NRs (KWS 2009). Since these regions are functionally
connected, I propose a larger habitat patch covering 22,540 km2 containing those regions delineated by
the IUCN in Somalia, and by the KWS in Kenya. Chardonnet estimates a total of 374 lions in this region
with 199 individuals on the Somalia side of the border, 74 in Boni and Dodori NRs, and 102 in and

22
around Arawale NR. Bauer and Van Der Merwe (2004) do not give an estimate of lions in the LCU. The
IUCN (2006b) report notes a total of 500 to 1,000 lions inhabiting the LCU in Somalia alone. Njoroge et
al. (2009) surveyed the large and medium-sized mammals of Arawale NR, Kenya, and found a mean den-
sity of 2.0 lions per 100 km2; approximately nine lions in the entire reserve. The most recent data for
Kenya estimates the distribution of lions in the region, but does not give a population estimate (KWS
2009). Therefore, I tentatively retain the estimate of 500 to 1,000 lions in the region but expand the
habitat patch to 22,540 km2.
17. Itombwe Massif Savanna
The Itombwe Massif Savanna LCU is found completely within the DRC covering a region that is proposed
as a GR (IUCN and UNEP 2009) with an area of 2,170 km2. The IUCN (2006b) estimate of less than 50
lions in the LCU remains the only proposed number in the literature, and therefore I retain it for this
analysis. However, my estimate of the size of the habitat patch containing lions is 3,244 km2.
18. Luama Hunting Reserve
The Luama Hunting Reserve LCU is found completely within the DRC covering a region that is largely
protected as a HR with an area of 3,340 km2. The IUCN (2006b) estimate of less than 50 lions in the LCU
remains the only proposed number in the literature, and therefore I retain it for this analysis. However,
my estimate of the size of the habitat patch containing lions is 5,197 km2.
19. Serengeti-Mara
This LCU covers the transfrontier Serengeti-Mara ecosystem along the border between Kenya and Tan-
zania (57,800 km2). The Maasai Mara NR in southern Kenya contains one of the highest densities of
lions recorded in Africa; approximately 30 lions per 100 km2 (Ogutu and Dublin 2002). With an area of
nearly 1,800 km2, this density of lions results in 540 individuals in the reserve alone. Chardonnet (2002)
estimated a total of 5,378 lions across this region. In Kenya, he proposed a population of 941 lions in
and around the Maasai Mara NR (547 in the NR alone). His estimate of lions on the Tanzania side of the
border put 3,896 lions across the PAs of Serengeti, Manyara, and Tarangire NPs, and Ngorongoro CA,
and an additional 541 lions in the surrounding GRs and NGAs. The inclusion of Tarangire NP in his esti-
mate means that the total number of lions in this LCU alone must be less than 5,378 individuals as Ta-
rangire is associated with the Maasai Steppe LCU. Bauer and Van Der Merwe (2004) give an estimate of
558 lions in Maasai Mara NR, 20 in Manyara NP, 53 in the Ngorongoro Crater, and 2,500 in the Serengeti

23
ecosystem. This provides a total of 3,131 individuals across the region. The IUCN (2006b) report notes a
population of 3,500 lions in the LCU. The most recent data from the KWS (2009) places a total of 825
lions in the portion of the LCU that falls in Kenya alone, noting that this may be an overestimate. New
information from Mesochina et al. (2010b) for Tanzania shows a population of 2,640 lions in the Tanza-
nian portion of the LCU. For this study, I have redrawn the boundaries of the LCU based on current hu-
man population data and the distribution of permanent lion populations in the region giving a greatly
restricted habitat patch area of 35,852 km2. I also propose a population of 3,673 lions for the habitat
patch, retaining the estimate of 825 lions in Kenya, and expanding the Mesochina et al. (2010b) estimate
to 2,848 lions based on the newly drawn habitat patch boundaries.
20. Maasai Steppe
This LCU covers the transfrontier Maasai Steppe ecosystem along the border between Kenya and Tanza-
nia (144,690 km2). Chardonnet (2002) gives an estimate of 902 lions in the Kenyan portion of the LCU
but includes his estimate of lions in Tanzania with the Serengeti ecosystem. Bauer and Van Der Merwe
(2004) propose a total number of 867 individuals in Kenya, but only note the Tanzanian portion of lions
in the Tarangire ecosystem to be “present, not estimated.” The IUCN (2006b) estimate a population of
more than 1,000 lions in the LCU. Combining the more recent estimates of lion populations across the
LCU (with borders as drawn by the IUCN), we arrive at a figure of 1,652 lions; 675 in the Tsavo ecosys-
tem in Kenya (KWS 2009) and 977 in the Tanzanian portion of the LCU (Mesochina et al. 2010b). The
findings of this report show that the LCU as drawn covers areas that are occasionally, possibly, and/or
temporarily used by lions (KWS 2009; Mesochina et al. 2010b). Given this information I propose that the
LCU should be split into three habitat patches based on permanent lion populations alone; Nairobi (830
km2), Tsavo-Mkomazi (39,122 km2), and Tarangire (31,738 km2).
a) Nairobi
As per the lion distribution maps proposed by the KWS (2009), a permanent population of lions exists in
Nairobi NP and in the savannah to the south that is potentially separated from the permanent popula-
tion of lions in the Tsavo ecosystem. Both Chardonnet (2002) and Bauer and Van Der Merwe (2004)
provide an estimate of 22 lions in the region and I retain this estimate here.

24
b) Tsavo-Mkomazi
Chardonnet (2002) estimates a total population of 880 lions in this habitat patch with 130 individuals in
Amboseli and Chyulu Hills NPs, and 750 in the Tsavo NPs. He does not directly estimate a population of
lions in Tanzanian side of the habitat patch, but does include the area in his distribution map. Bauer and
Van Der Merwe (2004) note a population of 20 lions in Amboseli NP and 675 individuals for the Tsavo
NPs, but do not estimate lions on the Tanzanian side of the border; 695 lions for the habitat patch as a
whole. The KWS (2009) estimate of 675 lions in the Tsavo ecosystem includes those lions found in Am-
boseli NP and its surrounds. Lion killing in the Maasai group ranches between the Tsavo NPs and Ambo-
seli is remarkably high, and lions were extirpated from Amboseli NP and the surrounding lands in the
early 1990s (Frank et al. 2006). However, recent conservation programs such as the Lion Guardians
have significantly reduced lion killing in the region and a recent estimate of the lion population in and
around Amboseli NP put the total at approximately 60 individuals (Frank et al. 2010). Mesochina et al.
(2010b) give a total lion population of 205 individuals for the Tanzanian portion of the habitat patch; 27
in Kilimanjaro NP and 178 in Mkomazi NP. Given the recent data from the KWS (2009) and Mesochina
et al. (2010b), I propose a total population of 880 lions in the habitat patch.
c) Tarangire
Chardonnet (2002) includes his estimate of lions in Tarangire with the remainder of the Serengeti eco-
system, and Bauer and Van Der Merwe (2004) do not propose a number of individuals in the region.
Therefore, the only direct estimate of lions for the Tarangire ecosystem comes from Mesochina et al.
(2010b) who note a total of 731 individuals in the habitat patch with 180 lions in Tarangire NP alone. I
retain this estimate of 731 lions for the region.
21. Dar-Biharamulo
This LCU covers the central portion of Tanzania and western Rwanda, and can best be described as a
catch-all for lion populations outside of the surrounding LCUs (164,980 km2). The IUCN (2006b) give an
estimate of 900 lions in the LCU. Due to the complex nature of the size and shape of the LCU, I will only
give the estimates of lions in the region from other sources step-by-step below. The findings of this re-
port show that the LCU as drawn covers areas that are temporarily used by lions (Mesochina et al.
2010b) and those regions where human population density is too high to support lion populations. Giv-
en this information, I propose that the LCU should be split into four habitat patches based on permanent

25
lion populations alone; Akagera (931 km2), NW Tanzania (4,731 km2), Swaga Swaga (7,242 km2), and
Wami Mbiki-Saadani (8,787 km2).
a) Akagera
Chardonnet (2002) gives an estimate of 45 lions in this NP in western Rwanda. Bauer and Van Der
Merwe (2004) note a total of 25 lions for the park alone. I retain the estimate of 25 lions for this habitat
patch since Chardonnet noted that the population within the park was declining due to livestock en-
croachment, poaching, and civil unrest.
b) NW Tanzania
Chardonnet (2002) proposes a total population of 177 lions in NW Tanzania, however much of this land-
scape is now thought to only contain temporary populations of lions (Mesochina et al. 2010b). The only
portion of the area that has a permanent lion population is a complex of PAs; Kimisi, Burigi, and Bihara-
mulo GRs. Chardonnet (2002) gives an estimate of 57 lions for these areas alone. Bauer and Van Der
Merwe (2004) do not propose a population of lions in the region. The most recent data from Mesochina
et al. (2010b) note a total of 105 individuals in those GRs alone and I retain this estimate here.
c) Swaga Swaga
This habitat patch covers Swaga Swaga GR and the surrounding NGAs. The only estimate of lions in the
region comes from Mesochina et al. (2010b), who proposed a population of 102 lions in the region; 33
lions in the protected area alone. I retain this estimate for this report.
d) Wami Mbiki-Saadani
This habitat patch includes Wami Mbiki WMA and Saadani NP and the NGAs that connect them. The
only estimate of lions in the region comes from Mesochina et al. (2010b), who proposed a population of
136 lions in the region; 51 lions in the protected areas alone. I retain this estimate for this report.
22. Ruaha-Rungwa
The Ruaha-Rungwa LCU covers a vast region of protected and non-gazetted lands in central Tanzania
(185,540 km2). Chardonnet (2002) estimates a total population of 4,878 lions across the LCU. This esti-
mate is split amongst a number of PAs and NGAs; Moyowosi and Kigosi GRs (460), Ruaha/Rungwa com-
plex (3,360), Katavi NP and adjacent PAs (600), Ugalla River GR and surrounding PAs (280), Mahale

26
Mountains NP (18) and the associated NGAs (160). Bauer and Van Der Merwe (2004) simply note that
lions are “present, *but+ not estimated.” The IUCN (2006b) suggest a population of 4,500 individuals in
the LCU. Mesochina et al. (2010b) propose a total population of 3,779 lions in the region. One of the
few direct surveys of lion populations in the LCU found a density of 4.0 lions per 100 km2 in Katavi NP
(approximately 168 individuals), but noted that this density was lower than expected based on prey
populations (Kiffner et al. 2009). I have refined the LCU’s borders based on new distribution information
from Mesochina et al. (2010b), and human population density resulting in a habitat patch covering
195,993 km2. I retain their estimate of 3,779 lions for the habitat patch.
23. Mpanga Kipengere
The Mpanga Kipengere GR in southern Tanzania is not included in an LCU by the IUCN (2006b), but is
noted as containing a permanent population of 14 lions as per data from Mesochina et al. (2010b). I
retain their population estimate in a habitat patch covering 958 km2.
24. Selous
This LCU covers a vast region of protected and non-gazetted lands in southern Tanzania (190,380 km2).
Creel and Creel (1997) estimated the adult lion density in the Selous to be between 8 and 13 lions per
100 km2. An average of 10 lions per 100 km2 across the nearly 48,000 km2 Selous GR would result in an
estimate of 4,800 individuals in the reserve alone. Chardonnet (2002) estimates a total population of
4,940 lions across the LCU with 4,400 individuals in Mikumi NP, Selous GR, and Kilombero GCA. Bauer
and Van Der Merwe (2004) give an estimate of 4,500 lions in the LCU with 3,750 lions in Selous GR
alone. The IUCN (2006b) suggest a population of 5,500 individuals in the LCU. Mesochina et al. (2010b)
propose a total population of 7,268 lions in the region. I have refined the LCU’s borders based on new
distribution information from Mesochina et al. (2010b) and human population density, resulting in a
habitat patch covering 127,165 km2. I retain their estimate of 7,268 lions for the habitat patch.

27
Table 3: East Africa Lion Habitat Patches
Southern Africa
1. Niassa
This region contains two LCUs in northern Mozambique totaling 128,060 km2; Niassa Reserve (41,590
km2) and Greater Niassa (86,470 km2). Chardonnet (2002) estimates a total of 650 lions for this region
with 500 individuals in Niassa NR alone. Bauer and Van Der Merwe (2004) provide a much lower esti-
mate of 175 individuals for the area. The IUCN (2006b) report notes a total of 800 to 900 lions occupy-
ing Niassa NR, with an additional 100 to 250 individuals in the Greater Niassa LCU; 900 to 1,150 lions in
total. Recent estimates from Chardonnet et al. (2009) give a total of 1553 lions in permanent popula-
tions in the region; 900 in Niassa NR (800 to 1,000 individuals: Begg and Begg 2010) and 106 in Quirim-
Habitat Patch Estimated # of Lions Area (km2) Country Associated IUCN LCUBoma-Gambella 500 106,941 Ethiopia, Sudan Boma-Gambella
Kidepo Valley <100 11,064 Sudan, Uganda
Kidepo Valley - Sudan,
Kidpeo Valley - Uganda
South Omo 170 17,012 Ethiopia South Omo
Borana 80 9,297 Ethiopia N/A
Bale 50 1,960 Ethiopia Bale
Welmel-Genale 100 9,783 Ethiopia Welmel-Genale
Awash 50 25,302 Ethiopia Awash
Eastern Hararghe 66 6,629 Ethiopia N/A
Ogaden 100 88,124 Ethiopia Ogaden
Albertine South 250 5,583 DRC, Uganda Albertine South
Toro-Semiliki 10 538 Uganda Albertine North
Murchison Falls 324 3,889 Uganda Murchison Falls
Lake Mburo 3 373 Uganda N/A
Laikipia-Samburu 330 35,511 Kenya Laikipia-Samburu
Meru 40 7,365 Kenya Meru
Arboweerow-Alafuuto 100-250 24,527 Somalia Arboweerow-Alafuuto
Arawale-Bush Bush 500 - 1,000 22,540 Kenya, Somalia Bush Bush
Itombwe Massif Savanna <50 3,244 DRC Itombwe Massif Savanna
Luama Hunting Reserve <50 5,197 DRC Luama Hunting Reserve
Serengeti-Mara 3,673 35,852 Kenya, Tanzania Serengeti-Mara
Nairobi 22 830 Kenya Maasai Steppe
Tsavo-Mkomazi 880 39,122 Kenya, Tanzania Maasai Steppe
Tarangire 731 31,738 Tanzania Maasai Steppe
Akagera 25 931 Rwanda Dar-Biharamulo
NW Tanzania 105 4,731 Tanzania Dar-Biharamulo
Swaga Swaga 102 7,242 Tanzania Dar-Biharamulo
Wami Mbiki-Saadani 136 8,787 Tanzania Dar-Biharamulo
Ruaha-Rungwa 3,779 195,993 Tanzania Ruaha-Rungwa
Mpanga Kipengere 14 958 Tanzania N/A
Selous 7,268 127,165 Tanzania Selous
Totals: 20,083 838,226
w/o Somalia: 19,008 791,159

28
bas NP. I have expanded these LCUs to include the distribution of known lion populations in northern
Mozambique (Chardonnet et al. 2010) and those connected areas in southern Tanzania not included in
the Selous LCU (Mesochina et al. 2010b), which results in a habitat patch covering 194,409 km2. Retain-
ing the estimate of 1,553 lions from Chardonnet et al. (2009) and adding the 396 lions noted by Meso-
china et al. (2010b) in those areas of the habitat patch falling in southern Tanzania, I propose a total
population of 1,949 lions in the region.
2. Upemba and Kundelungu
These LCUs are both located in southern DRC. The Upemba LCU totals 1,430 km2 and covers a portion of
Upemba NP, while the Kundelungu LCU covers 410 km2 across a portion of Kundelungu NP. Chardonnet
(2002) estimates a total of 50 lions in these PAs combined. The IUCN (2006b) note a population of less
than 50 individuals in each NP. A recent survey by Henschel et al. (2010) found no lions occupying either
park, and therefore these LCU are not included as current habitat patches.
3. Nsumbu
The Nsumbu LCU is located in northeastern Zambia and covers 4,370 km2. Chardonnet (2002) gives a
population estimate of 39 lions in Nsumbu NP and the surrounding GMAs. The IUCN (2006b) propose
that less than 50 individuals remain in the region. I retain the estimate of less than 50 lions for the asso-
ciated habitat patch, but have increased the patch to 14,272 km2, which includes the surrounding GMAs,
and Mweru wa Nitpa and Lusenga Plains NPs as per the distribution of lions noted by the ZAWA (2009).
4. Bangweulu
The NPs and GMAs in the Bangweulu ecosystem of eastern Zambia are not included in a LCU, but are
noted as containing lions by the ZAWA (2009). No estimates for the number of lions inhabiting this re-
gion exist in the literature. I propose a habitat patch covering 15,112 km2 of PAs alone and give an ex-
tremely tentative population estimate of less than 50 lions based solely on its proximity to the Nsumbu
complex and their similar sizes.
5. Luangwa
The Luangwa region covers a vast collection of NPs and GMAs in eastern Zambia. Several LCUs fall inside
an area that I propose to be a single habitat patch stretching across the Luangwa River Valley in Zambia
and neighboring northern Malawi; Vwaza (840 km2), Nyika – MW (2,770 km2), Nyika - ZM (1,340 km2),

29
North Luangwa (15,020 km2), South Luangwa (19,200 km2), and the Petauke Corridor (14,560 km2).
Chardonnet (2002) estimates a total of 1,802 lions in this region with 1,633 individuals in the Luangwa
NP complex, 165 in the Chisomo, Luano, and West Petauke GMAs, and five in Nyika NP and Vwaza
Marsh WR. Bauer and Van Der Merwe (2004) give only a national estimate for lions in Zambia; 1,500
individuals. The IUCN (2006b) note a total of 440 to 850 lions across this landscape. New data from Me-
sochina et al. (2010c) note the lion being absent from Nyika NP in Malawi, and estimate a total popula-
tion of five resident lions in Vwaza Marsh WR. I retain the IUCN’s estimate of lion populations in Zam-
bia, but include the updated information from Malawi. This results in an estimated population of 425 to
835 lions in a habitat patch covering 77,041 km2.
6. Mid-Zambezi
This region covers a large area of southern Zambia and northern Zimbabwe along the Zambezi River and
Lake Kariba. Several LCUs fall inside an area that I propose to be a single habitat patch; Mid-Zambezi
(20,030 km2), Omay (2,040 km2), and Matusadona (1,430 km2). Chardonnet (2002) estimates a total of
988 lions in this region with 183 individuals Lower Zambezi NP, 495 in Mana Pools NP, and 310 in Matu-
sadona and Chizarira NPs. Bauer and Van Der Merwe (2004) give only a national estimate for lions in
Zambia, but note a total of 702 lions across the NPs and SAs of northern Zimbabwe. Purchase et al.
(2005) estimated a total of 28 resident lions in the valley floor of Matusadona NP (approximately one
quarter of the park’s area) in 2005, down from nearly 90 individuals in 1998. The IUCN (2006b) give a
total estimate of 350 to 650 lions across this landscape, but is likely an underestimate as it misses sever-
al NPs and SAs. However given a lack of recent data, I retain the IUCN’s estimate of 350 to 650 lions in a
habitat patch covering 42,142 km2.
7. Kafue
The Kafue LCU covers a number of NPs and GMAs in central Zambia spanning 31,800 km2. Chardonnet
(2002) proposes a population of 1,026 lions in the region but includes Lochinvar and Blue Lagoon NPs
where lions have likely been extirpated (ZAWA 2009). The IUCN (2006b) report notes a population of
250 to 500 lions across the LCU. I retain this estimate but expand the habitat patch to include those
GMAs within the surrounding region noted to contain lions by the ZAWA (2009). The proposed habitat
patch covers 58,898 km2.

30
8. West Lunga
The NPs and GMAs in the West Lunga ecosystem of northwestern Zambia are not included in a LCU, but
are noted as containing lions by the ZAWA (2009). Chardonnet (2002) provides the only estimate of
lions in the region with a population of 153 individuals. I propose a habitat patch covering 13,125 km2 of
PAs alone and retain the estimate of 153 lions.
9. Liuwa Plains
This LCU covers Liuwa Plains NP in western Zambia and is noted as having an area of 17,040 km2. Char-
donnet (2002) estimates a single population of 376 lions spanning the whole of eastern Zambia including
Sioma Ngwezi NP and the surrounding GMAs. The IUCN (2006b) note a population of less than 50 indi-
viduals in Liuwa Plains NP alone. I retain the original LCU as a habitat patch, but calculate a significantly
smaller area of 3,215 km2. Recent data from the Liuwa Carnivore Project (2010) show that only three
lions remain in the NP itself, but they note that a few individuals could exist in the surrounding GMA. I
use the known population of three individuals for the habitat patch.
10. Sioma Ngwezi
This LCU covers Sioma Ngwezi NP in western Zambia and is noted as having an area of 2,220 km2. Char-
donnet (2002) estimates a single population of 376 lions spanning the whole of eastern Zambia including
Liuwa Plains NP and the surrounding GMAs. The IUCN (2006b) note a population of less than 50 individ-
uals in Sioma Ngwezi NP alone. I retain the estimate of less than 50 lions and the original LCU as a habi-
tat patch, but calculate a larger area of 4,280 km2.
11. Kasungu
This LCU contains Kasungu NP in central Malawi (1,980 km2). Chardonnet (2002) estimated a population
of five lions in the park. The IUCN (2006b) provide a similar estimate of less than 10 individuals. Recent
data from Mesochina et al. (2010c) note six resident lions for the park alone. I retain this estimate in a
slightly larger habitat patch covering 2,341 km2.
12. Nkhota Kota
The Nkhota Kota LCU covers the Nkhota Kota WR in central Malawi (1,660 km2). Chardonnet (2002) es-
timated a population of 10 lions in the reserve itself. The IUCN (2006b) report provides a similar esti-
mate of less than 10 individuals. Recent data from Mesochina et al. (2010c) give a slightly higher esti-

31
mate of 18 resident lions for the reserve alone. I retain this estimate in a slightly larger habitat patch
covering 1,846 km2.
13. Liwonde Ecosystem
The Liwonde ecosystem contains three LCUs in southern Malawi; Namizimu (280 km2), Mangochi (430
km2), and Liwonde (400 km2). Chardonnet (2002) estimates a total of five lions across this network of
PAs. The IUCN (2006b) note a population of less than 10 individuals in each of the three LCUs. Meso-
china et al. (2010b) propose a seasonal population of six lions in the ecosystem. I have not included
these LCUs in a habitat patch since these lions do not represent a resident population.
14. Tete N. of Cahora Bassa
The NGA of Tete Province, Mozambique, north of Lake Cahora Bassa is not included in a LCU, but does
contain a resident population of lions. Chardonnet (2002) provides an estimate of lions in the Tete Prov-
ince as a whole, noting a population of 125 individuals. The more recent survey of the status of lions in
Mozambique gives a much higher estimate of lions in Tete Province, north of Lake Cahora Bassa; 344
resident lions (Chardonnet et al. 2009). A survey by the Duke BCI intern team and I estimated a much
smaller range of lions in the region, noting a restricted population of approximately 200 lions (Van Aarde
et al. in prep). We also propose a habitat patch covering 25,861 km2.
15. Tete S. of Cahora Bassa
This habitat patch contains a portion of an LCU covering 12,400 km2 of northern Mozambique and Zim-
babwe; MZ South of Labannakass. As stated above, Chardonnet (2002) provides an estimate of lions in
the Tete Province as a whole, noting a population of 125 individuals. The more recent survey of the sta-
tus of lions in Mozambique gives an estimate of lions in Tete Province, south of Lake Cahora Bassa; 59
resident lions (Chardonnet et al. 2009). I retain this estimate of 59 lions in a habitat patch covering
13,612 km2.
16. Gile
The Gile LCU falls in central Mozambique, covering Gile NP and the surrounding NGA (2,850 km2). The
IUCN (2006b) report notes a total population of less than 50 individuals for the region. Chardonnet et al.
(2009) estimate 45 individuals over a larger landscape with eight lions in Gile NR alone. I retain this es-
timate, as well as the larger modified habitat patch with an area of 22,322 km2.

32
17. Gorongosa/Marromeu
This LCU covers Gorongosa NP, Marromeu NR, their associated HAs, and the surrounding NGAs in Zam-
bezi Province in central Mozambique (42,090 km2). Chardonnet (2002) notes a population of 100 lions
across the landscape. Bauer and Van Der Merwe (2004) estimate a total of 175 lions in the Zambezi Val-
ley. The IUCN (2006b) propose a population of 100 to 250 lions in the LCU. The most recent survey
conducted by Chardonnet et al. (2009) estimates 106 individuals in the region. I have retained the esti-
mate of 106 lions in a modified habitat patch based on the recent data (46,781 km2).
18. Greater Limpopo
The Greater Limpopo ecosystem stretches across a vast landscape of PAs and NGAs in the border region
between South Africa, Mozambique, and Zimbabwe, covered by a LCU with an area of 60,990 km2.
Chardonnet (2002) estimates a total of 2,793 lions in the region; 80 individuals in Mozambique including
Zinhave and Banhire NPs, 183 in Zimbabwe including Gonarezhou NP, and 2,530 in South Africa’s Kruger
NP. Bauer and Van Der Merwe (2004) propose a similarly sized population of 2,355 individuals: 25 in
Mozambique, 2,200 in Kruger NP, and 130 in Zimbabwe. However, their estimate of lions in Zimbabwe
covers the entire southern portion of the country, much of which falls outside of the LCU. The IUCN
(2006b) report notes that the landscape contains more than 2,000 lions, but this estimate does not in-
clude Zinhave NP and the surrounding HAs and NGAs in Mozambique. Ferreira and Funston (2010) re-
cently surveyed lions in Kruger NP, estimating a population of 1,684 individuals in the park alone. Char-
donnet et al. (2009) note 376 lions in the Mozambique portion of the Greater Limpopo ecosystem.
Groom (2010) estimated a total of 23 lions in Gonarezhou NP, Zimbabwe. Given the recent data, I retain
the IUCN’s estimate of a population of lions more than 2,000 individuals in the Greater Limpopo ecosys-
tem as new data shows 2,060 lions in South Africa and Mozambique alone and Zimbabwe likely contains
less than 200 individuals based on prior surveys (the additional 23 lions from Gonarezhou NP puts the
total number of estimated lions at 2,083 individuals). This larger habitat patch has an area of 151,917
km2.
19. Shashe-Limpopo
This LCU falls across the place where South Africa, Zimbabwe, and Botswana intersect (6,460 km2).
Chardonnet (2002) gives an estimate of 15 lions in the Botswana and Zimbabwe portions of the LCU, but
does not estimate lions in South Africa. Bauer and Van Der Merwe (2004) note a total of 130 lions resid-
ing in the whole of southern Zimbabwe, and give an estimate of 10 lions for the portion of the LCU in

33
Botswana. The IUCN (2006b) propose a larger population of 50 to 100 lions in the LCU. A 2010 survey
of the region’s carnivores estimated a total of 25 lions in the Greater Mapungubwe TFCA, down from 48
lions in 2004 (Shashe Limpopo Predator Research Group 2010). I retain this estimate of lions in the re-
gion, with the original LCU as the habitat patch boundary, but calculate an area of 7,421 km2.
20. Etosha-Kunene
The Etosha-Kunene LCU is located completely within northern Namibia, covering 55,700 km2. Chardon-
net (2002) estimates a total of 417 lions in the LCU with 315 individuals in Etosha NP alone. Bauer and
Van Der Merwe (2004) note a population of 230 lions in Etosha NP, but simply state that there are an
additional 680 lions in the remainder of the country. The IUCN (2006b) report proposes a population
range between 315 and 595 individuals. Stander (2010) estimated 112 to 139 lions in the Kunene region
(excluding Etosha NP). Given this data I retain the IUCN estimate of 315 to 595 individuals, but have up-
dated the habitat patch to include portions of the lion distribution noted in the Namibia Large Carnivore
Atlas (Hanssen and Stander 2004). This results in a significantly larger area of 123,800 km2.
21. Khaudom-Caprivi
This LCU falls completely within northern Namibia and has an area of 24,700 km2. Chardonnet (2002)
estimates a total of 274 lions in this region. The IUCN (2006b) note a population of 100 to 200 lions
across the LCU. Given this data I retain the IUCN estimate, but have updated the habitat patch to in-
clude portions of the lion distribution noted in the Namibia Large Carnivore Atlas (Hanssen and Stander
2004). This results in a significantly larger area of 92,418 km2.
22. Okavango-Hwange
The Okavango-Hwange LCU covers a vast landscape spanning much of northern Botswana and Zim-
babwe (95,170 km2). Sechele and Winterbach (2001) surveyed lion populations across northern Bots-
wana from 1998 to 2000, estimating 2,095 individuals across the Okavango-Kwando-Chobe ecosystem
(not including Nxai Pan and Makgadikgadi NPs). They state that, “It is safe to conclude that the North-
ern Botswana lion population is larger than 2,000 animals.” Hemson (2001) estimated a much lower
density of 1 lion per 125 km2 in Makgadikgadi NP, resulting in approximately 39 individuals. Chardonnet
(2002) estimated a total of 2,870 lions inhabiting the LCU (2,177 in Botswana and 693 in Zimbabwe), not
including those lions in the southern portion of the region (Nxai Pan and Makgadikgadi NPs), which he
associates with Central Kalahari GR. Bauer and Van Der Merwe (2004) note a population of 1,913 indi-

34
viduals in Botswana, and 205 in Zimbabwe; a total of 2,118 lions across the LCU. The IUCN (2006b) give
a similar estimate of 2,300 lions in the region. Loveridge et al. (2007) estimated a density of 2.7 lions per
100 km2 in Hwange NP alone. With an area of 14,900 km2, Hwange NP contains an estimated 402 lions
as per their study. Given this data, I retain the IUCN’s estimate of 2,300 lions, but have modified the
LCU borders to fully include all of the associated PAs in Botswana and those areas of low human popula-
tion density outside of Hwange NP in Zimbabwe to create a habitat patch covering 107,337 km2. I must
note that the evidence from the surveys stated above suggests an even higher number of resident lions
in this landscape, but new data is necessary to support this claim.
23. Xaixai
This LCU covers two WMAs in northwestern Botswana (13,070 km2). The only estimate of a lion popula-
tion in this region comes from the IUCN (2006b) who note a range of 50 to 100 individuals inhabiting the
LCU. Given this data, I retain their estimate, but modify the LCU slightly to include all of the area in the
WMAs to give a habitat patch with an area of 12,484 km2.
24. Kgalagadi
The Kgalagadi LCU falls across a vast the vast transfrontier region spanning from central Botswana into a
portion of northern South Africa (146,960 km2). Castley et al. (2002) estimated the total number of lions
in the southwestern portion of Kgalagadi Transfrontier Park (the area in South Africa alone) to be be-
tween 92 and 125 individuals. Chardonnet (2002) estimates a total of 1,150 lions in the region with 450
individuals in Central Kalahari GR (including Nxai Pan and Makgadikgadi NPs that fall outside of the LCU),
and 700 in the Kgalagadi Transfrontier Park. Bauer and Van Der Merwe (2004) give a slightly lower es-
timate of 995 lions in the region; 312 individuals in Central Kalahari GR and 683 in the Kgalagadi Trans-
frontier Park. The IUCN (2006b) report notes a range in lion numbers between 500 and 1,000 individu-
als. I retain this estimate and the LCU for the habitat patch in this report, but calculate an area of
151,142 km2.
25. Kissama-Mumbondo
This LCU covers a small portion of Kisama NP in northwestern Angola (2,780 km2). Chardonnet (2002)
notes a population of 160 lions ranging over a much larger area that includes Kangandala NP, Luando
Integral Nature Reserve, and the surrounding NGAs which fall outside of this LCU. The IUCN (2006b)

35
propose a small population of less than 10 individuals in the region. I retain this estimate and the bor-
ders of the LCU but calculate an area of 4,593 km2 for the habitat patch.
26. Bocoio-Camucuio
The Bocoio-Camucuio LCU falls across a 24,800 km2 NGA of western Angola. The IUCN (2006b) provide
the only estimate of lions in the region with 40 to 70 individuals. I retain this estimate but modify the
borders of the LCU based on human population density and calculate an area of 22,005 km2 for the habi-
tat patch.
27. Bicuar
This LCU covers Bikuar NP in southern Angola (9,910 km2). Chardonnet (2002) notes a population of 256
lions ranging over a much larger area that includes Iona and Mupa NPs, Mocamedes PR, and the sur-
rounding NGAs which fall outside of this LCU. The IUCN (2006b) propose a population of 20 to 40 indi-
viduals in the region. I retain this estimate and the borders of the LCU but calculate an area of 13,792
km2 for the habitat patch.
28. Mupa Cubati
The Mupa Cubati LCU falls across a landscape that includes Mupa NP and the surrounding NGAs in
southern Angola (22,610 km2). The IUCN (2006b) report notes a total of 50 to 100 lions in the LCU. I
retain this estimate and the borders of the LCU but calculate an area of 25,516 km2 for the habitat
patch.
29. Cuando Cubango
This LCU covers a vast portion of southeastern Angola containing Luengu HR, and Mavinga and Luiana
PRs (144,440 km2). Chardonnet (2002) estimates a population of 235 lions across the region. The IUCN
(2006b) propose a significantly larger population of 750 to 1,400 lions in the LCU. I retain this estimate
and the borders of the LCU but calculate an area of 152,261 km2 for the habitat patch.
30. Luchazes
The Luchazes LCU covers 125,620 km2 of nearly all non-gazetted land in eastern Angola. The IUCN
(2006b) report notes a population of 400 to 700 lions in the LCU. I retain this estimate but modify the

36
borders of the LCU based on human population density and calculate an area of 139,060 km2 for the
habitat patch.
31. Cameia Lucusse
This LCU falls across Kameia NP and the NGAs to its south in eastern Angola (30,550 km2). Chardonnet
(2002) notes a population of 98 lions in this region. The IUCN (2006b) estimate a total of between 70
and 130 individuals residing in the LCU. I retain this estimate and the borders of the LCU but calculate
an area of 35,740 km2 for the habitat patch.
32. Alto Zambeze
The Alto Zambeze LCU borders Zambia and the DRC in eastern Angola (18,210 km2). The IUCN (2006b)
report notes a total of 50 to 100 lions in the LCU. I retain this estimate and the borders of the LCU but
calculate an area of 20,771 km2 for the habitat patch.

37
Table 4: Southern Africa Lion Habitat Patches
Lion Strongholds
Eleven habitat patches across sub-Saharan Africa qualify as lion strongholds (Table 5). I briefly note be-
low how each habitat patch meets the requirements to be considered a stronghold. I have also mapped
each lion stronghold and the PAs contained within them (Appendix C, Figures 20 through 26).
West Africa
The W-Arly-Pendjari complex in the border region between Burkina Faso, Benin, and Niger is the only
habitat patch that meets the lion stronghold qualifications in West Africa. As noted in the lion popula-
tion assessment, the “WAP” complex contains at least 500 lions in its PAs alone. The IUCN (2006a) rates
the lion population in the region as stable.
Habitat Patch Estimated # of Lions Area (km2) Country Associated IUCN LCUNiassa 1,949 194,409 Mozambique, Tanzania Niassa Reserve, Greater Niassa
Nsumbu <50 14,272 Zambia Sumbu Complex
Bangweulu <50 15,112 Zambia N/A
Luangwa 425 - 835 72,987 Malawi, Zambia
Vwaza, Nyika - MW, Nyika - ZM,
North Luangwa, South Luangwa,
Petauke Corridor
Mid-Zambezi 350 - 650 42,142 Mozambique, Zambia, Zimbabwe
Mid-Zambezi, MZ South of
Labannakass, Omay, Matusadona
Kafue 250 - 500 58,898 Zambia Kafue
West Lunga 153 13,125 Zambia N/A
Liuwa Plains 3 3,215 Zambia Liuwa Plains
Sioma Ngwezi <50 4,280 Zambia Sioma Ngwezi
Kasungu 6 2,341 Malawi Kasungu
Nkhota Kota 18 1,846 Malawi Nkotakota
Tete N of Cahora Bassa 200 25,861 Mozambique N/A
Tete S of Cahora Bassa 59 13,612 Mozambique MZ South of Labannakass
Gile 45 22,322 Mozambique Gile
Gorongosa/Marromeu 106 46,781 Mozambique Gorongosa/Marromeu
Greater Limpopo >2,000 151,917 Mozambique, South Africa, Zimbabwe Greater Limpopo
Shashe-Limpopo 25 7,421 Botswana, Zimbabwe, South Africa Shashe-Limpopo
Etosha-Kunene 315 - 595 123,800 Angola, Namibia Etosha-Kunene
Khaudom-Caprivi 100 - 200 92,418 Namibia Khaudom-Caprivi
Okavango-Hwange 2,300 107,337 Botswana, Zimbabwe Okavango-Hwange
Xaixai 50 - 100 12,484 Botswana Xaixai
Kgalagadi 500 - 1,000 151,142 Botswana, South Africa Kgalagadi
Kissama-Mumbondo <10 4,593 Angola Kissama-Mumbondo
Bocoio-Camucuio 40 - 70 22,005 Angola Bocoio-Camucuio
Bicuar 20 - 40 13,792 Angola Bicuar
Mupa Cubati 50 - 100 25,516 Angola Mupa Cubati
Cuando Cubango 750 - 1,400 152,261 Angola Cuando Cubango
Luchazes 400 - 700 139,060 Angola Luchazes
Cameia Lucusse 70 - 130 35,740 Angola Cameia Lucusse
Alto Zambezi 50 - 100 20,771 Angola Alto Zambezi
Totals: 11,919 1,591,460
w/o Angola: 9,949 1,177,723

38
Central Africa
There currently are no habitat patches in Central Africa that qualify as a lion stronghold.
East Africa
Four habitat patches in East Africa meet the requirements for being a lion stronghold. The Serengeti-
Mara ecosystem contains an estimated 3,673 lions, with approximately 3,516 individuals in the PAs of
the region. The IUCN (2006b) rates the lion population in this habitat patch as increasing. Another habi-
tat patch along the border of Kenya and Tanzania qualifies as a lion stronghold; the Tsavo-Mkomazi eco-
system. This region contains 880 lions, the vast majority of which exist in the well protected NPs in each
country. Although the IUCN (2006b) rates the lion population in this habitat patch as decreasing, most
of the loss of lions is occurring in the Amboseli ecosystem to the west of the vast Tsavo NPs complex
(Frank et al. 2010). This ecosystem is thought to contain approximately 60 lions, and therefore I propose
that the remaining resident lions (approximately 820 individuals) in the Tsavo and Mkomazi NPs have
stable populations. The Ruaha-Rungwa habitat patch in western Tanzania contains an estimated 3,779
lions and also fits the description as a lion stronghold. 2,235 of these individuals occur in the well pro-
tected NPs and GRs of the ecosystem, and the IUCN (2006b) gives the population a rating of stable. The
Selous ecosystem is another lion stronghold in Tanzania, containing 7,268 lions with 4,953 individuals in
its PAs. The IUCN (2006b) lists the Selous LCU as having a stable lion population
Southern Africa
Six of the habitat patches as delineated above qualify as lion strongholds. The first lion stronghold in
Southern Africa mostly falls within northern Mozambique; the Niassa ecosystem. This region contains
an estimated 1,949 lions, of which 1,080 are contained in well protected parks. The IUCN (2006b) report
considers this LCU as having an increasing lion population. The Luangwa ecosystem spans across a
number of PAs in eastern Zambia, and contains an estimated 425 to 835 lions (630 mean). The IUCN
(2006b) rates the Luangwa LCU as having a stable lion population. Another lion stronghold occurs across
the border region between southeastern Zambia and northern Zimbabwe; Mid-Zambezi. This habitat
patch has between 350 and 650 lions across a series of NPs, SAs, and WMAs (500 mean). Even though
the region could contain less than 500 lions (as per IUCN 2006b data), other estimates note a much
higher population of lions across the ecosystem and I believe it is safe to assume that the habitat patch
qualifies as a stronghold. The IUCN (2006b) rates the Mid-Zambezi LCU as having a stable lion popula-
tion. The Okavango-Hwange habitat patch qualifies as a lion stronghold with 2,300 individuals largely

39
contained in a complex of NPs, SAs, and WMAs. The IUCN (2006b) gives the lion population in the re-
gion a stable rating. A fifth lion stronghold exists in southern Botswana and northern South Africa; the
Kgalagadi ecosystem. This region contains between 500 and 1,000 lions (750 mean) across two vast GRs
and NPs. The IUCN (2006b) note the region as having a stable lion population. The Greater Limpopo
ecosystem is the final lion stronghold in Southern Africa. It contains more than 2,000 lions, of which at
least 1,951 individuals are found in well protected parks. The IUCN (2006b) states that the lion popula-
tion in this ecosystem in increasing.
Table 5: Lion Strongholds

40
Discussion
Lion Population Assessment
This synthesis of the most recent data concerning lion populations across sub-Saharan Africa es-
timates a total of 35,556 lions across their known range; this assumes the mean lion population in esti-
mates where a range in numbers exists or a greater/less than value is given. Removing the poorest qual-
ity data from southwest Sudan, Somalia, and Angola provides a slightly lower estimate of 32,011 indi-
viduals. Therefore I am confident in the assessment that at least 32,000 African lions exist in their re-
maining habitat. These numbers fall between the most recent estimates from Bauer and Van Der
Merwe (2004), who estimated 23,000 lions, and Chardonnet (2002) who proposed a figure just above
39,000 individuals. I must note that the estimate given by Bauer and Van Der Merwe (2004) does not
include vast NGAs considered by Chardonnet (2002) and myself, along with Somalia, Sudan, Malawi, and
much of Tanzania, which contains the largest population of lions in the world. Simply adding a very con-
servative estimate of 5,000 lions for the total of the regions not estimated by their study in Tanzania,
their estimate would reach approximately 28,000 individuals; a number much closer to the present
study. The recent reports produced by the IUCN (2006a; 2006b) note an estimated lion population of
approximately 33,000 individuals.
If we break down the number of lions remaining in sub-Saharan Africa by region we find a rather
unequal distribution of individuals across the continent. West and Central Africa both hold relatively
few lions with 857 and 2,697 individuals respectively. This compares to East and Southern Africa, each
having 20,083 and 11,919 lions respectively. Beyond a regional look, this study shows that currently 27
countries across West, Central, East, and Southern Africa contain resident populations of lions (Table 6).
This means that five countries have lost their lions since Chardonnet’s study in 2002 (he placed resident
lion populations in 32 countries). Beyond that, only nine countries are found to have at least 1,000 lions
apiece; CAR, Ethiopia, Kenya, Tanzania, Mozambique, Zambia, South Africa, Botswana, and Angola. If
countries with particularly small lion populations such as Senegal, Guinea-Bissau, Guinea, Mali, Niger,
Nigeria, Rwanda, and Malawi (all having 100 lions or less) want to preserve their wildlife heritage for
future generations, serious conservation measures must be put in place. If the past decade is to be used
as a reference, all of these countries risk losing their lions in an alarmingly short period of time.

41
Table 6: Estimated Number of Lions per Country
It is also of importance to address the fact that the lion population estimate proposed in the re-
port cannot be directly compared to the numbers found in the most recent surveys of lion populations
in terms of an increase or decrease in lions across their range. The estimates for lion populations here
show only the impact of new data and lion-specific surveys. This also remains true for historical esti-
mates of the number of lions in Africa, which relied heavily on lion density extrapolations for what was
assumed to be the remaining distribution of lions at different periods in the past century. Myers (1975)
noted that, “Since 1950, *lion+ numbers may well have been cut in half, perhaps to as low as 200,000 in
all or even less.” Ferreras and Cousins (1996) estimated a total of 75,800 lions in Africa in 1980 based on
a GIS model predicting lion range from human population density, agriculture, and pastoralism, but con-
cede that much of the known lion range at that time was missing from their prediction. Finally, Nowell
and Jackson (1996) proposed their educated “guesstimates” of 30,000 to 100,000 individuals in the mid-
90s. The truth is that we simply do not know how many lions existed historically across sub-Saharan
Africa, and while all three of these estimates are interesting as an exercise in trying to predict lion popu-
lations where survey data does not exist, we cannot prove a reduction of over 50 percent of lion num-
bers in the past several decades.

42
Beyond lion numbers alone, it is also difficult to assess the potential reduction in the occupied
range of lions. Without doubt, land conversion for agriculture and the expansion of human populations
into previously “wild” territory has significantly reduced the amount of savannah Africa in quite a short
time period (Pimm et al. in prep). This reduction of habitat is most stark in West Africa where Pimm et
al. (in prep) have found a significant loss in known lion range. When the IUCN (2006a) assessed lion
range in West and Central Africa, they noted 20 LCUs in the region. Recent data from Henschel et al.
(2010) found that more than half (11) of these LCUs most likely no longer contain lions. Across Africa a
total of 17 LCUs have lost their lions since 2006 according to recent data, with the greatest losses occur-
ring in West Africa (Table 7). However, it is important to note that all of these extirpations came from
populations of less than 50 lions, and all but one (Nazinga-Sissili) had been noted as having a declining
trend in lions (IUCN 2006a; 2006b). If these declines continue, a good number of the current habitat
patches risk losing their lions in the near future.
Table 7: LCUs with Recently Extirpated Lion Populations
However, even though losses are occurring, this study proposes 11 new habitat patches not contained in
LCUs across the whole of sub-Saharan Africa (Table 8). And through my analysis of lion habitat patches, I
calculate the total known range of permanent lion populations to be 3,503,934 km2 (2,711,296 km2
when removing those range states where data is lacking). This compares closely with the IUCN’s total
LCU Estimated # of Lions Area (km2) Region CountryComoe-Leraba <50 22,880 West Burkina Faso, Ivory Coast
Gbele Ecosystem <50 1,510 West Ghana
Nazinga-Sissili <50 2,510 West Burkina Faso, Ghana
Mole <50 6,790 West Ghana
Bui-White Volta Ecosystem 10-20 5,230 West Ghana
Digya <50 3,180 West Ghana
Oti-Mandouri <50 990 West Togo
Old Oyo <5 1,700 West Nigeria
Kamuku/Kwiambana 25-35 3,220 West Nigeria
Lame-Burra/Falgore 25-35 4,390 West Nigeria
Odzala <50 1,890 Central Congo
Upemba <50 1,430 Southern DRC
Kundelungu <50 410 Southern DRC
Namizimu <10 280 Southern Malawi
Mangochi <10 430 Southern Malawi
Nyika - MW <10 2,770 Southern Malawi
Liwonde <10 400 Southern Malawi
Totals: <570 60,010

43
area of LCUs, 3,163,260 km2, and the estimate of 2,950,367 km2 from Chardonnet (2002). Given this
data, I believe it is reasonable to assume that approximately 3,000,000 km2 of occupied lion habitat still
exists over sub-Saharan Africa. Just as a thought experiment, if we apply a very low average lion density
(1.0 lion per 100 km2) to the predicted occupied range, we derive a result of 30,000 lions remaining in
Africa.
Table 8: New Lion Habitat Patches
Another major finding of this study is how few population estimates are based on field survey
data. Much of the information concerning lion populations is based on density estimates extrapolated
over large areas and new research is necessary to better understand lion populations and distribution in
many range countries. In West Africa, recent surveys have been conducted in the Congo, Gabon, Ivory
Coast, Ghana, Benin, Burkina Faso, and Nigeria (Burton et al. 2010; Henschel et al. 2010; Pellerin et al.
2009; Sogbohossou and Tehou 2007; Tende et al. 2009). However, new data is still lacking in the West
African range countries of Senegal, Mali, Guinea-Bissau, Guinea, Niger, and in the “WAP” complex of
Burkina Faso. And while lion populations have been estimated across Benin, direct surveys have only
been conducted in the Pendjari and W complexes in the northern portion of the country (Pellerin et al.
2009). In the near future new information should become available as Dr. Philipp Henschel (Panthera) is
currently conducting research in the Niokolo-Guinea LCU (Philipp Henschel pers. comm.). The situation
concerning direct lion research is similar in Central Africa. Cameroonian lions are relatively well studied,
and recent surveys in Waza NP and the Benoue complex have provided updated estimates on lion popu-
lations in the country (Bauer 2007; Tumenta et al. 2009). A new report detailing the status of lions in
CAR also provides a newly updated estimate of lion populations in the country, but little of the informa-
Habitat Patch Estimated # of Lions Area (km2) Region CountryAlibori Superieur 18 1,742 West Benin
Trois Rivieres 19 1,939 West Benin
Nana-Barya 4 2,314 Central CAR
Bozoum NGA 4 8,383 Central CAR
Borana 80 9,297 East Ethiopia
Eastern Hararghe 66 6,629 East Ethiopia
Lake Mburo 3 373 East Uganda
Mpanga Kipengere 14 958 East Tanzania
Bangweulu <50 15,112 Southern Zambia
West Lunga 153 13,125 Southern Zambia
Tete N of Cahora Bassa 200 25,861 Southern Mozambique
Totals: 611 85,733

44
tion in the report is derived through direct estimation of lion densities (Mesochina et al. 2010a). In
Chad, northern DRC, and southwestern Sudan, almost no recent scientific literature has been produced
on lion populations within the past 20 years. Beyond Zakouma NP in southeastern Chad (Vanherle
2007), lion distributions and population estimates across these countries are little more than educated
guesses, but the completion of the National Conservation Action Planning workshop for cheetah, wild
dog, and lion in Southern Sudan in 2009 might provide new insights on lion distributions and popula-
tions in the near future (Wursten et al. 2009).
Historically lion populations have been better studied across East Arica. In Uganda, Kenya, and
Tanzania, recent countrywide lion status reports have been produced detailing lion populations in this
region (Dricuru and Siefert 2005; KWS 2009; Mesochina et al. 2010b). In fact, new data from a country-
wide lion survey conducted by the Wildlife Conservation Society and the UWA should be available soon
for Uganda (Mudumba in press). However, as in West and Central Africa, many of the lion population
estimates are little more than educated guesses or density extrapolations. In Kenya, lions are well stu-
died in the Maasailands, Tsavo/Amboseli ecosystem, and Laikipia region, but almost no information is
available for those lions residing in the northern portion of the country, the Samburu-Isiolo complex,
and eastern border of Kenya with Somalia (Frank et al. 2010; KWS 2009; Ogutu and Dublin 2002; Njo-
roge et al. 2009). The situation in Tanzania is much the same. Recent surveys of lion densities in Katavi,
Manyara, Serengeti, and Tarangire NPs, Moyowosi, Muhezi, Kizigi, and Selous GRs, Ngorongoro CA, and
Wami Mbiki WMA have provided accurate estimates of lion populations in those regions, but the new
countrywide status report of lions in Tanzania extrapolated density estimates from these regions across
vast areas of the country (Creel and Creel 1997; Kiffner et al. 2009; Mesochina et al. 2010b). The situa-
tion in Ethiopia, Somalia, and eastern DRC is not nearly as positive, where no recent surveys on lion
populations have been conducted. Although, Ethiopia had held its National Lion Conservation Work-
shop in 2009, which provided new distribution maps and rough estimates of lion populations across the
country from experts in the field (Gebresenbet et al. 2009), and new data should be available soon for
Ethiopia from Oxford University’s Wildlife Conservation Research Unit (WildCru) who are currently con-
ducting countrywide lion surveys (WildCru 2011).
In Southern Africa, lion populations have also been subject to much scientific inquiry. A recent
countrywide status report on lions in Mozambique estimated both lion distribution and numbers across
the country, but admits that only Gorongosa NP and Niassa NR have accurate estimates of lion densities
(Begg & Begg 2010; Chardonnet et al. 2009). Our recent survey of the distribution of lions in Tete Prov-

45
ince north of Lake Cahora Bassa worked to refine their data in that region alone, but further lion-specific
research needs to be conducted in the remainder of the country to truly assess lion populations there
(Van Aarde et al. in prep). Although the ZAWA recently released its Conservation Strategy and Action
Plan for the African Lion (2009), they only proposed a slightly updated version of lion distribution with
no estimation of lion numbers beyond those found in Chardonnet (2002). Therefore, information on
lion populations in Zambia is nearly completely lacking, with direct estimates only currently available for
Liuwa Plains NP (Becker et al. 2010). However, Dr. Paula White and the Zambia Lion Project are current-
ly assessing lion populations countrywide and their data should be available soon (Zambia Lion Project
2010; Paula White pers. comm.). The distribution and status of the lion in Malawi was recently assessed
by Mesochina et al. (2010c), but this information was based solely on information from the Malawi De-
partment of National Parks and Wildlife and experts in the field, including lion sightings by game offi-
cials. No formal lion surveys have been conducted in the country (Mesochina et al. 2010c). In 2006, the
Zimbabwe Parks and Wildlife Management Authority released its Conservation Strategy and Action Plan
for the Lion in Zimbabwe (ZPWMA 2006). This report did not update the known data on lion popula-
tions or distribution in the country and stated that, “Information on population status, current distribu-
tion and trends…still remains lacking for most major wildlife areas…(ZPWMA 2006).” However, they did
note that lion specific surveys had been conducted in several PAs including Hwange, Mana Pools, and
Matusadona NPs, Matetsi SA and the Save Valley Conservancy. Recent surveys have been conducted in
Matusadona, Hwange, and Gonarezhou NPs and the Greater Mapungubwe TFCA, but little or no data
exists on populations in the majority of Zimbabwe’s NPs and SAs (Groom 2010; Loveridge et al. 2007;
Purchase and Vhurumuku 2005; Shashe Limpopo Predator Research Group 2010). WildCru is currently
conducting surveys on lion populations across much of Zimbabwe including the Hwange ecosystem, the
Mana Pools ecosystem, and the Save Valley Conservancy, and new data should be available soon
(WildCru 2010).
South Africa’s lions are likely the best studied in all of Africa, and nearly all free-ranging popula-
tions have had recent lion-specific surveys (Castley et al. 2002; Ferreira and Funston 2010; Shashe Lim-
popo Predator Research Group 2010). In the Technical Predator Management and Conservation Work-
shop in Botswana, it was stated that lion populations across country have been well studied in the past
with four major surveys in the north and two in the south as of 2000 (Sechele and Winterbach 2001).
However with the exception of the survey of large carnivores across the Greater Mapungubwe TFCA
(Shashe Limpopo Predator Research Group 2010), there have been no additional publications to update
those lion population estimates presented nearly a decade ago. That is not to say that recent data does

46
not exist for lions in Botswana, but only that the information has yet to be published for the benefit of
the scientific community. A similar scenario exists for information concerning the lions of Namibia,
where on-going monitoring of populations is occurring, but new data is often lacking public access. The
most recent comprehensive report of lion populations in the country was published in 2004, but simply
estimated lion numbers using low, medium, and high density extrapolations across the known lion dis-
tribution (Hanssen and Stander 2004). New information for the desert lions of the Kunene region of
Namibia is being updated on a near-yearly basis by the Desert Lion Project (Stander 2010). However,
while carnivore populations are currently being studied in the Khaudom-Caprivi region by the Caprivi
Carnivore Project, the data is as of yet, unavailable (Predator Conservation Trust 2010). The most major
gap in knowledge concerning lion populations and distribution in Southern Africa is in Angola where
years of civil war prevented scientific research. W. van Hoven is quoted by Chardonnet (2002) stating,
“Crude estimates for some regions of *Angola+ exist, but these, however, are not based on scientific sur-
veys.” Much of the information concerning the country is based on reports from the 1960s and 70s
prior to the civil war, and it is believed that all wildlife experienced serious declines in the decades since
(Bauer et al. 2005). The widespread persistence of landmines has contributed to the lack of research in
Angola, despite the cessation of the civil war.
Lion Strongholds
The most significant result from this study has been the delineation of lion strongholds across
sub-Saharan Africa. The concept of a lion stronghold is not new and recent calls for lion conservation
action have included the need to, “…identify regional strongholds for the species that have the highest
probability of persistence in the long-term (Treves et al. 2009).” As stated in the methods section, I have
considered those habitat patches containing a viable population of lions (as per Bjorklund 2003) in cur-
rent PAs with a stable or increasing population trend (as per IUCN 2006a; 2006b) to be lion strongholds.
The results of this analysis show that there are at least 11 habitat patches across sub-Saharan Africa that
qualify as lion strongholds; one in West Africa, four in East Africa, and six in Southern Africa. These
strongholds span 11 countries and contain at least 18,155 lions in PAs alone (more than 50 percent of
the remaining lions in Africa). It is the protection of these strongholds and the connections between
them that will ultimately determine the fate of lions. Importantly, with adequate protection, and the
subsequent reversal of lion declines, 10 additional habitat patches could qualify as lion strongholds in
the near future (Table 9). I considered those habitat patches containing 250 or more lions (regardless of

47
protection or stability) to represent potential strongholds. These areas may represent the locations
where conservation actions are most pressing and may have the greatest effect.
In West Africa, the Niokolo-Guinea LCU is the only other potential lion stronghold in the region.
However, drastic declines in lion populations and available habitat have seriously impacted the conser-
vation potential in this landscape. Approximately 250 lions remain across three potentially connected
habitat patches that make up the LCU in Senegal, Mali, Guinea-Bissau, and Guinea. While the IUCN
(2006a) has stated that lion population trends in the LCU are increasing, this is doubtful given the rapid
increase in land conversion in the region (Pimm et al. in prep). This area requires the immediate protec-
tion of those lions already existing in PAs (such as Niokolo Koba NP), the creation of new PAs along the
border of Guinea-Bissau and Guinea, and Mali and Guinea, and the maintenance of corridors linking
these populations if this region is to serve as a lion stronghold in the future.
Central Africa contains no habitat patches that currently qualify as a lion stronghold, but two
regions could satisfy the requirements if conservation action focuses on protecting lions in PAs while
maintaining corridors to prevent the further fragmentation of these habitat patches. The Benoue com-
plex in northern Cameroon currently contains an estimated 250 lions in NPs and HAs alone. If lion popu-
lations rebound in the ecosystem through an increase in prey populations, reduction in lion killing, and if
the trophy hunting sector is sustainably managed, this habitat patch could be a lion stronghold. The
other potential lion stronghold in Central Africa exists across a large swath of habitat between southeas-
tern Chad and eastern CAR. This region contains an estimated 1,744 lions in a mosaic of NPs, HAs, and
NGAs and is noted by the IUCN (2006a) as having a stable lion population. This area is also connected to
potentially substantial lion populations in southwest Sudan and northern DRC. Three major issues pre-
vent the consideration of this region as a lion stronghold. First, political instability in the region threat-
ens the current PAs and those lion populations existing in the surrounding NGAs. Second, data for sou-
theastern Chad is particularly poor outside of Zakouma NP and the potential exists that these popula-
tions could already be fragmented from those lions in eastern CAR by land conversion and lion killing. In
fact, the habitat patch I have proposed for Chad represents only an educated guess given the little data
available and could be drastically overestimating both lion distribution and numbers for the country.
Finally, while a large lion population potentially exists in the region, few individuals remain in truly pro-
tected areas such as NPs, and the status of many of the PAs is unclear (Mesochina et al. 2010a).
In East Africa, the potential for five additional lion strongholds exists. The Boma-Gambella habi-
tat patch spanning the border between southeastern Sudan and western Ethiopia could already be clas-
48
sified as a current lion stronghold if more information based on lion surveys existed for the major NPs in
the region. An estimated 500 lions exist across a landscape that is largely covered with PAs including the
vast Boma-Gambella NP complex. Unfortunately, the same issues that plague the potential stronghold
in Chad and CAR impact this habitat patch. Without updated information concerning lion numbers in
the region’s NPs, a refined look at lion distribution in Southern Sudan, and the assessment that lion
populations are stable (the IUCN 2006b does not assess lion population trends for this LCU), this area
will remain only potentially a lion stronghold. It should be noted that research in this landscape should
be a particularly high conservation priority given that significant land conversion may be taking place in
Gambella NP (Hans Bauer pers. comm.). In central Kenya, the potential for another lion stronghold ex-
ists in the Laikipia-Samburu habitat patch. This region contains an estimated 330 lions and has a stable
population trend according to the IUCN (2006b). The major issue with this habitat patch is the lack of
PAs in the region, as less than 25 percent of the area is protected in any form (IUCN 2006b). If a greater
percentage of the landscape was protected, and lion populations were allowed to rebound to at least
500 individuals, then the Laikipia-Samburu ecosystem could be classified as a lion stronghold.
Murchison Falls NP in northern Uganda might currently be classified as a lion stronghold if I used
the viability threshold of 250 lions, as the entire habitat patch is protected and contains an estimated
324 lions. However, the population trend for the region is unclear and any further reduction in lion
numbers in the park would eliminate the viability of this population. Therefore, assuring the protection
of lions in and around the park is necessary to upgrade this population to a lion stronghold. A similar
situation exists for lions in the Albertine South habitat patch. This region is completely protected by two
NPs; Queen Elizabeth NP in Uganda, and Virunga NP in the DRC. Given its current protected status and
that the patch contains the minimum number of lions for viability (250 individuals), this region could be
considered a lion stronghold if the decreasing trend in lion numbers was halted and lion populations
were allowed to rebound. In fact, Treves et al. (2009) listed this region as a potential stronghold if wild-
life in Virunga NP had greater protections and lions and their prey recovered across this landscape. They
estimated that the two NPs together could hold 905 lions if given full protection. The final potential lion
stronghold in East Africa exists in the Tarangire ecosystem. This habitat patch contains approximately
731 lions and therefore already meets the requirements for viability. However, only 208 individuals oc-
cur in PAs (180 in Tarangire NP and 28 in Mkungunero GR) and according to the IUCN (2006b) lion popu-
lations are decreasing in this region. If Tanzania expanded the current PAs or designated new PAs in the
habitat patch, the region would certainly qualify as a lion stronghold.

49
Two additional habitat patches in Southern Africa have the potential to be lion strongholds; Ka-
fue and Etosha-Kunene. The Kafue ecosystem in central Zambia contains a stable population of be-
tween 250 and 500 lions (375 mean); nearly all of which reside in PAs. Given the lower viability thre-
shold of 250 individuals, this region would already be considered a lion stronghold, and the maximum
estimate of lions in the habitat patch already meets the stronghold requirements. However, until new
data is released concerning the number of lions in the Kafue ecosystem, the region must remain a po-
tential lion stronghold based on the constraints of my analysis. The same situation occurs for the Eto-
sha-Kunene habitat patch in northwestern Namibia and southwestern Angola. Even without including
the population of lions across the border in Angola, this habitat patch contains an estimated 315 to 595
lions (455 mean) in an LCU that is consider as having an increasing lion population (IUCN 2006b). Unfor-
tunately not all of these lions are contained within PAs, and recent data that could prove this patch’s
status as a lion stronghold does not yet exist. That being said, these two habitat patches are the most
likely to be upgraded to lion strongholds with new data, and reasonably could be currently included in
that group. Of course classification as a stronghold or not is unimportant as opposed to the actual abili-
ty of the region to have long-term persistence of lions. This may be achieved at a minimum of 250 lions
and without connections, but the population must be immune to negative, external pressures. This is
highly unlikely outside of PAs as actual coexistence between humans, livestock, and lions is debatable.
Table 9: Potential Lion Strongholds
The only remaining regions with potentially large numbers of lions that could act as lion strong-
holds in the future that I have not assessed here are southwestern Sudan, Somalia, and Angola. I have
left these countries out of this analysis as the data on lion populations there are questionable at best,
and regional instability makes the protection of wildlife in these areas unlikely in the near future. This
assessment notes an additional 5,209 lions that could exist in potential strongholds if the needs for

50
greater protection and new research were met. Added to the 18,215 lions already found in well-
protected, viable populations, a total number of approximately 23,424 lions could currently live in
strongholds. In fact, it is not unreasonable to suggest that a total of 25,000 lions could exist in well-
protected, viable populations alone if current lion declines were halted and populations below their car-
rying capacity were increased. Admittedly, it is not likely that all of these habitat patches can or will
achieve full lion stronghold status, but if conservation efforts are focused in these 10 regions (as well as
continuing the protection of those areas that are already lion strongholds) lions could be considered
safe from the threat of extinction.
Habitat Patch Connectivity and Potential Corridors
The potential connectivity of lion habitat patches is currently one of the most pressing conserva-
tion concerns pertaining to the species. Maintaining corridors between patches is necessary to promote
the long-term viability of lions, as isolated populations in fragmented landscapes are at a greater risk of
local extinction (Harrison 1992). Conservation organizations such as Panthera are currently assessing
connections between habitat patches in a number of range states with the goal of the “…creation of a
Pan-African corridor for lions (Henschel 2009).” Below I look at some of the remaining linkages between
the delineated habitat patches as noted in the literature, as well as considering the impact of land con-
version and human population density on the existence of potential corridors. I have also mapped the
most probable location of some of the noted corridors between lion strongholds, potential strongholds,
and other habitat patches (Appendix C, Figures 20 through 26)
As shown in this study, lions in West Africa occur in relatively small habitat patches with little or
no connectivity. The three habitat patches that make up the Niokolo-Guinea LCU could potentially re-
tain corridors to-date, but land conversion seriously threatens these connections. A small corridor be-
tween the Guinea-Bissau/Guinea habitat patch and the larger Niokolo Koba/Guinea-Mali Border patch
could still remain, but land conversion along a major road in the region, coupled with high human popu-
lation density threaten to fragment these populations. A similar scenario exists between the Niokolo
Koba/Guinea-Mali Border habitat patch and Haut Niger NP. However, it was noted that as recently as
1998, lions dispersed to the park from a population around the Tinkisso River in the north of Guinea
(Brugiere and Magassouba 2003). Interestingly there is no information concerning the movement of
lions between the Niokolo Koba/Guinea-Mali Border habitat patch and the Boucle Baoule complex to
the north in Mali, but low levels of land conversion and human population density could allow for these
regions to be connected (albeit over a very long distance of nearly 200 km). Surveying the landscape
51
between the patches should be a high priority for the region, and the discovery of a resident lion popu-
lation in this gap would suggest the immediate need for a protected corridor. It is safe to assume that
the lions in Senegal, Guinea-Bissau, Guinea, and Mali are fully isolated from populations further to the
east, as the nearest habitat patch (W-Arly-Pendjari) is over 1,000 km away.
Lions across the W-Arly-Pendjari complex are fully connected across the border region between
Burkina Faso, Benin, and Niger since no fragmentation has occurred in the PAs. Pellerin et al. (2009)
suggest that this habitat patch is connected to Alibori Superieur and Trois Rivieres FRs in northern Benin,
but extensive land conversion between these PAs makes corridors unlikely. They also note a possible
transboundary movement of lions from Pendjari BR into northern Togo, but these lions are likely rare
transients (Chardonnet 2002), and further land conversion might sever this connection completely. Pel-
lerin et al. (2009) discuss the possibility of the movement of individuals between the habitat patches in
the north of Benin with the Mt Kouffe and Wari Maro FRs further south, but once again, land conversion
and high human population density makes the potential for a linkage in this region an improbability.
Furthermore, these researchers cite anecdotal reports of potential transboundary movement of lions
from these central FRs into neighboring Togo and Nigeria. However, even in the unlikely event where
such dispersal occurred across this heavily fragmented landscape, these areas do not contain resident
lions and are not vital to the persistence of the species in the region. Finally, a potential linkage exists
between Trois Rivieres FR and Kainji Lake NP in Nigeria (Pellerin et al. 2009), but once again land conver-
sion and high human population density makes successful movement unlikely and sporadic at best.
With the recent extirpation of lions across most of central Nigeria, it should be assumed that lions in the
W-Arly-Pendjari complex, the remainder of Benin, and Kainji Lake NP are fully disconnected from those
populations in Central Africa. Philipp Henschel (2009) states that, “…northern Nigeria represents the
only potential linkage between the West African complex and the western edge of the Greater East Afri-
can complex, but lions are relict throughout Nigeria and it is unknown if they can still disperse through
the northern parts of the country.” Furthermore, land conversion around Yankari NP has rendered this
population isolated from all other habitat patches. Indeed, I find it highly unlikely that any remaining
connectivity exists.
In Central Africa, the lion habitat patches (Waza and the Benoue complex) in Cameroon are fully
isolated from any other populations and each other, and fragmentation within the Benoue complex is a
possibility if corridors between the NPs of the ecosystem are not maintained. The Nana-Barya and Bo-
zoum NGA patches of western CAR could be connected to the larger habitat patches to the east, but

52
Mesochina et al. (2010a) state that the presence of lions is temporary in this region. Land conversion
and human population density is rather low over the whole of southeastern Chad, eastern CAR, north-
ern DRC, and southwest Sudan, and all three of these habitat patches remain fully connected. Mesochi-
na et al. (2010a) note that the transboundary movement of lions across the vast landscape is frequent
and largely uninterrupted, but as human populations increase in the region, conservation attention
must be focused on identifying those corridors utilized by lions in order to maintain this connectivity.
Beyond those habitat patches, Central Africa likely retains some amount of connectivity to the East Afri-
ca lion populations through Southern Sudan and the Boma-Gambella ecosystem, although the Nile River
likely presents a serious barrier to movement.
There is much uncertainty concerning the connectivity of many of the lion habitat patches in
East Africa especially in the northern portion of this region. Corridors potentially remain between the
Boma-Gambella ecosystem and Kidepo Valley to its south, but human population density is already high
in this region and the actual distribution of lions is unknown. According to the distribution map pro-
duced during Ethiopia’s National Lion Conservation Workshop (Gebresenbet 2009), lions are potentially
found all along the country’s western, southern, and eastern borders. Currently linkages could exist be-
tween all of the lion habitat patches in Ethiopia, but no information is available on if and where lions
might move across this landscape. One of the most important corridors in all of Africa exists across
northern Kenya between the South Omo habitat patch in southern Ethiopia, and the Laikipia-Samburu
ecosystem in central Kenya. This single connection remains the only potential link between Central Afri-
can lions and those in the remainder of East Africa and Southern Africa, but current data only estimates
the presence of lions in this region as possible (KWS 2009). However, while the KWS notes that corri-
dors remain linking lion populations in central Kenya (between the Laikipia-Samburu ecosystem and the
Meru complex, and further along the Tana River to Arawale NR and those lions in southern Somalia),
they do not believe that a connection exists between the central and southern habitat patches in the
country. If this is true, then it means that lion populations are no longer connected across East Africa.
Another area of particular concern exists in the border region of Kenya and Tanzania. Two lion strong-
holds in this area (Serengeti-Mara and Tsavo-Mkomazi) could retain some connectivity between them in
southern Kenya, but the KWS (2009) has no confirmation of lions in this landscape. Lions move freely
across the border between Tanzania and Kenya in both the Serengeti-Mara and Tsavo-Mkomazi habitat
patches (Frank et al. 2006; Mesochina et al. 2010b).

53
Wildlife corridors across Tanzania are some of the best studied in all of Africa and here I attempt
to summarize the findings of the Tanzania Wildlife Research Institute (Jones et al. 2009) pertaining to
the connections between wildlife habitat patches within Tanzania. They largely assessed corridors by
documenting the movement of wildlife (especially elephants) between PAs. The Kitendeni corridor link-
ing Amboseli NP in southern Kenya and Kilimanjaro NP in Tanzania contains documented movements of
wildlife, but land conversion for agriculture has reduced the width of the corridor to five kilometers as of
2000. The Kilimanjaro-Natron corridor to the west potentially links the Tsavo-Mkomazi lion stronghold
with the Serengeti-Mara ecosystem, but research needs to be conducted to assess the movement of
wildlife across this landscape. Currently, lions are only known as temporary residents in this landscape
(Mesochina et al. 2010b).
Two other corridors in this area are of particular importance in this increasingly fragmented
landscape; the Manyara Ranch-Lake Natron and Manyara-Ngorongoro (Upper Kitete/Selela) corridors.
The Manyara Ranch-Lake Natron corridor links Tarangire NP with the NGAs surrounding Lake Natron in
the north and documented wildlife movement occurs through a four kilometer stretch between the
Manyara Ranch and Tarangire NP. This is a massively important connection that could link the Taran-
gire, Serengeti-Mara, and Tsavo-Mkomazi habitat patches, but is currently threatened by cultivation and
major roads. The two kilometer wide, 10-kilometer long corridor between Lake Manyara NP and the
Ngorongoro CA is the only strip of land preventing the fragmentation of the southern portion of the Se-
rengeti-Mara habitat patch, and in 2009 was expected to disappear within two years unless immediate
action was taken. Manyara NP (in the Serengeti-Mara lion stronghold) is connected to Tarangire NP by
three narrow corridors collectively known as the Kwakuchinja wildlife corridor. However, Jones et al.
(2009) note that lions are already locally extinct and it is believed that with the loss of this connection,
the Serengeti-Mara and Tarangire habitat patches no longer have a viable linkage for lions. Additionally,
many former migration routes within the Tarangire habitat patch have already been lost, but three cor-
ridors remain linking Tarangire NP and Mkungunero GR to land in the east that is seasonally utilized by
wildlife (Makuyuni, Mkungunero/Kimotorok, and the Tarangire-Simanjiro corridors). Further human
settlement and livestock production in the region could fragment this landscape, leading to a massive
reduction in the prey populations that support lions in the region. No connections exist between the
resident lion populations in the eastern portion of the Tarangire habitat patch and Mkomazi NP in the
Tsavo-Mkomazi lion stronghold.

54
One of the major concerns pertaining to the connectivity of lion habitat patches in East Africa is
whether or not the lion strongholds of southern Kenya and northern Tanzania are linked to those in
southern Tanzania. The only places where this is a possibility is between the Tarangire habitat patch
and the Swaga Swaga habitat patch to its southwest, and the Wami Mbiki-Saadani habitat patch to the
southeast. However, extensive land conversion and high human population densities along the major
highway connecting Dar es Saalam on the coast and Dodoma in central Tanzania make the possibility of
any connection remaining between the Tarangire ecosystem and Swaga Swaga GR highly improbable,
and no link is noted by Jones et al. (2009). That being said, the Muhezi-Swaga Swaga corridor between
the two GRs likely connects the Swaga Swaga habitat patch to the vast Ruaha-Rungwa lion stronghold,
although further evidence needs to confirm this connection. However, if no corridor remains between
Swaga Swaga GR and the Tarangire ecosystem then the only other link between those lion populations
in Central Africa and the northern portion of East Africa and those found in the southern half of East
Africa and Southern Africa occurs across the non-gazetted landscape of the southern Maasai Steppe
through Wami Mbiki WMA.
Wami Mbiki WMA forms the central hub of four major corridors linking lion habitat patches in
the northern half of East Africa with those in the south. Although not under immediate threat, the cru-
cial Wami Mbiki-Hadeni corridor potentially links the Tarangire ecosystem with those habitat patches
further south, and research needs to confirm the movement of wildlife and the presence of lions in this
landscape (Mesochina et al. 2010b; Jones et al. 2009). Within the current Wami Mbiki-Saadani habitat
patch a corridor potentially exists linking Wami Mbiki WMA to Saadani NP (less than 100 km away). Lit-
tle information is known about wildlife movements in the region, but the Chalinze-Arusha highway bi-
sects the NGA between the parks, and increasing land conversion and newly established settlements
makes the near-term future of the corridor uncertain. Two corridors could connect Wami Mbiki WMA
to the vast Selous lion stronghold. The first runs southwest from the WMA to Mikumi NP (approximate-
ly 100 km away), but is crossed by the Morogoro-Dodoma highway and numerous fenced cattle ranches.
The second links Wami Mbiki with Selous GR. This corridor is also crossed by the Morogoro-Dodoma
highway, and poaching pressure is considered substantial. Both corridors require research to document
wildlife movements between these parks, and settlements, agriculture, and ranches could soon sever
the only connections between lion habitat patches in the north and south of East Africa. Jones et al.
(2009) considered both the Wami Mbiki-Mikumi and the Wami-Mbiki-Saadani as two of the five corri-
dors in Tanzania in “extreme condition,” meaning that they were likely to disappear in two years with-
out immediate conservation action.

55
Lion habitat patches in Uganda and eastern DRC are completely isolated from each other and
from those patches in the neighboring countries with one potential exception (Dricuru and Siefert 2005).
Lions are believed to have recently recolonized Lake Mburu NP in southern Uganda from northwestern
Tanzania, and this region might still retain some amount of connectivity, but Mesochina et al. (2010b)
do not believe that lion movements occur across the Uganda-Tanzania border. Jones et al. (2009) and
Mesochina et al. (2010b) note a potential corridor linking Burigi and Kimisi GRs in the northwest Tanza-
nia habitat patch with Akagera NP in Rwanda, but state that an influx of over 600,000 refugees had de-
vastated the GRs and that no information exists on wildlife movements in the area. A similar scenario
exists between the northwest Tanzania habitat patch and the Ruaha-Rungwa complex. Elephants are
thought to move between Burigi and Moyowosi/Kigosi GRs, but two large roads bisect this area and lit-
tle is known about the state of this possible connection. Within the Ruaha-Rungwa lion stronghold land
conversion and increasing human population density are impacting the current connection between
Mahale Mountains and Katavi NPs. Surveys have confirmed the movement of wildlife in a corridor be-
tween the two parks, but the route remains unprotected and fragmentation might split the habitat
patch. Another important connection within the Ruaha-Rungwa complex exists in the southern portion
of the habitat patch linking Lake Rukwa and Lukwati GRs with Rungwa GR and Ruaha NP. Jones et al.
(2009) state that while not immediately threatened, this corridor is being impacted by extensive logging
of the miombo woodlands and recent clearing of agriculture along roads bisecting this NGA. From the
Chunya West, Chunya East, and Piti West Open Areas, a new GR (Mwipa/Piti) is being proposed that
could formalize protections for this important linkage. The last important corridor in this region con-
nects Mpanga Kipengere GR with Ruaha NP to the north (the Igando-Igawa corridor). It is reported by
Jones et al. (2009) that the migratory species in southern Ruaha NP (and the carnivores that rely on
them) are reliant upon the Igando-Igawa corridor linking the dry season refuge in the Mpanga Kipengere
GR. While lions are only known as temporary in the connecting NGAs (Mesochina et al. 2010b), the loss
of the corridor would certainly result in a drastic reduction in prey species in the region, and the corridor
is already greatly reduced.
The Udzungwa-Ruaha corridor (approximately 200 km long) is arguably the most important and
seriously threatened connection in Tanzania (Jones et al. 2009). This region links two of the largest lion
strongholds in all of Africa (Ruaha-Rungwa and Selous) and the extensive clearing of land for agriculture
threatens to functionally fragment these landscapes. Recent research has confirmed the movement of
wildlife between Ruaha and Udzungwa NPs but only a single crossing of the Dar-Mbeya highway has
been verified. As noted by Jones et al. (2009), “This point may mark the only viable connection between

56
northern and southern populations of elephants in eastern and central Tanzania and needs swift action
to prevent permanent disruption…” Furthermore, several additional connections within the Selous
habitat patch are threatened with fragmentation, and these could sever the connection between Ud-
zungwa NP and the remainder of the habitat patch (thereby eliminating any link between the Ruaha-
Rungwa and Selous lion strongholds). The first important linkage occurs between Udzungwa and Miku-
mi NPs where recent movements of elephants have been documented. Heavy poaching and extensive
clearing of habitat for agriculture threaten the immediate future of this corridor. Jones et al. (2009)
state that, “The area *west+ of…Mikumi NP is likely to be the last hope for elephant movements linking
Mikumi to Udzungwa (by the northern route) and thus the Ruaha ecosystem via the Ruaha-Udzungwa
corridor.” The other potential connection linking Udzungwa NP and the remainder of the Selous ecosys-
tem occurs across the Kilombero Valley with two active corridors with documented wildlife movements
(Nyanganje and Ruipa). The 13 km long Nyanganje corridor passes through a 0.5 to 2.5 km bottleneck
while the slightly larger Ruipa corridor has a width of between 0.5 and 6 km, and traverses 20 km of a
NGA. According to Jones et al. (2009), “…it is predicted that without conservation interventions, both of
these corridors will also be blocked by the end of 2009.” The current status of these connections is un-
known, but the importance of and threats to these corridors makes this area a top conservation priority.
Many connections between lion habitat patches in Tanzania with those found in the countries to
its south are less well known. Mesochina et al. (2010b; 2010c) state that while little information is
known, lion movements are suspected between Tanzania and Zambia and Malawi; however no perma-
nent populations of lions occur in the area. However, lions were documented moving from northern
Zambia, through the northern tip of Malawi into Tanzania in 2009 (Mesochina et al. 2010c). More im-
portantly is the connection between the Selous and Niassa lion strongholds across the Ruvuma River
along the Tanzania-Mozambique border, where lions, elephants, and wild dogs are all known to cross
(Chardonnet et al. 2009; Mesochina et al. 2010b; Mpanduji 2004; Jones et al. 2009). There are two
routes that serve as linkages between Selous GR and Niassa NR. The western route is the main connec-
tion in the region with a total area of approximately 10,000 km2. Many wildlife species, including lions,
have resident populations within this corridor, and the movement of elephants and other migratory an-
imals between these PAs is well studied (Begg and Begg 2010; Mpanduji 2004; TAWIRI 2010). The sec-
ondary eastern route linking Selous, Msanjesi, and Lukwika Lumesule GRs to Niassa NR also has docu-
mented wildlife migrations. One of the threats to this vital connection is the establishment of villages
along the major roads bisecting the region, but the corridor is receiving much conservation attention as
several projects are underway to protect the Selous-Niassa corridor with assistance from the German
57
Development Bank (KfW). This work has led to the recent designation of two new WMAs (Mba-
rang’andu and Nalika in 2010 and 2009 respectively) in the northern portion of the corridor, as well as
the planned establishment of an additional three WMAs to complete the connection to the south by the
end of 2011 (Selous-Niassa Wildlife Corridor 2011).
According to the analysis of this study, and the results from Chardonnet et al. (2009), connec-
tions appear to remain linking the PAs within the delineated lion habitat patches in Mozambique. How-
ever, Chardonnet et al. (2009) state that whether or not these habitat patches are interconnected within
the country remains to be determined, and areas of high human population density and land conversion
between the patches makes connectivity unlikely. Lions are known to seasonally move from the Niassa
lion stronghold to the Liwonde ecosystem in southeastern Malawi (Chardonnet et al. 2009; Mesochina
et al. 2010c). Lion movements are also known to occur across the border from the Luangwa and Mid-
Zambezi habitat patches in Zambia to Tete Province, Mozambique north of Lake Cahora Bassa (Char-
donnet et al. 2009). Cross border movements of lions within the Gorongosa/Marromeu habitat patch
are documented between Gairezi WMA and Nyangui State Forest in Zimbabwe and Manica Province,
Mozambique (Chardonnet et al. 2009). It is also likely that lions move between Zimbabwe and Mozam-
bique within the Mid-Zambezi habitat patch, but no data is available to support this hypothesis. Within
the Greater Limpopo ecosystem lions cross the border between Gonarezhou NP in Zimbabwe and Gaza
Province, Mozambique, as well as between Kruger and Limpopo NPs in South Africa and Mozambique
(Chardonnet et al. 2009).
Lions in eastern Zambia move freely between the connected landscapes of the Luangwa and
Mid-Zambezi lion strongholds, but it is not known if connections remain linking these regions with those
habitat patches in the central and western portions of the country. While I have included Vwaza Marsh
WR in Malawi in the Luangwa habitat patch due to their proximity and low human population density
separating them, lion movements between these PAs have not been documented. This uncertainty also
exists concerning the connections between Kasungu NP and the Luangwa complex, but Mesochina et al.
(2010c) note movements as possible. Much less information exists on connectivity of lion populations in
the remainder of Zambia. However, the IUCN (2006b) recommend that a survey should be undertaken
to assess the presence of lions in the NGA separating the Kafue ecosystem in Zambia with the Okavan-
go-Hwange complex of Botswana and Zimbabwe, as a connection here would be extremely valuable to
lion conservation in the region. The Kavango-Zambezi TFCA covers a vast region of PAs and NGAs in the
heart of Southern Africa and includes six lion habitat patches across Angola, Namibia, Zambia, Botswa-

58
na, and Zimbabwe; Cuando Cubango, Sioma Ngwezi, Kafue, Mid-Zambezi, Okavango-Hwange, and
Khaudom-Caprivi. Current conservation efforts in the landscape include surveying wildlife populations,
tracking animal movements, and protecting corridors linking existing PAs. The results of this work have
shown that animals do move freely over much of the Kavango-Zambezi TFCA, especially between sou-
theastern Angola, western Zambia, Namibia’s Caprivi Strip, and the Okavango-Hwange ecosystem, but
more data is needed to fully assess the connectivity of the landscape (KAZA-TFCA 2010; Ferguson and
Chase 2010). Veterinary fences, human settlements, and large cattle ranches separate the Okavango-
Hwange lion stronghold with the Kgalagadi habitat patch to its south, and therefore it is unlikely that
much lion movement exists between these regions (Ferguson and Chase 2010).
Few connections exist for the remaining lion habitat patches in Southern Africa. Lions are sepa-
rated by human settlements and cattle ranches between the Etosha-Kunene and Khaudom-Caprivi habi-
tat patches in Namibia, and lions are not known to range across this landscape (Hanssen and Stander
2004). However, lions might move from the Etosha-Kunene complex north into southwestern Angola
(Chardonnet 2002). For the remainder of Angola, little is known about the movements of wildlife, but it
can be assumed that some connections exist between the lion habitat patches in eastern Angola and
those in western Zambia. As noted by the Shashe Limpopo Predator Research Group (2010), the Great-
er Mapungubwe TFCA is likely isolated from other lion populations. They state that a main threat to lion
survival in the region is, “Small population size with little opportunity for natural recolonization.”

59
Conclusion
By analyzing the most recent available data on lion populations across sub-Saharan Africa, I have
created the most comprehensive assessment of the status and distribution of species to-date. The
compilation of this information into a single database for future researchers and lion conservationists is
a major outcome of this project. I have also produced a series of maps detailing lion habitat patches
refined from the original LCUs by incorporating new information on lion distribution, and by excluding
areas of land conversion and high human population density. This is by no means a fully accurate distri-
bution map of lion populations, but represents the current knowledge of the species’ range, and more
data can only increase the value of the product.
The lion population assessment in this study has shown that over 30,000 lions remain in approx-
imately 3,000,000 km2 of sub-Saharan Africa, distributed across a total of 78 lion habitat patches in 27
countries. Although many of these patches remain connected, conserving linkages between lion popu-
lations is crucial to the future of the species, and research and conservation efforts need to be focused
on delineating and protecting corridors utilized by wildlife. Unfortunately, recent studies have shown
local extirpations in lion populations in a total of 17 LCUs since 2006, with five countries having lost their
lions altogether since 2002. That being said, more than half of the remaining lions in Africa reside in 11
viable populations contained within PAs that have stable or increasing lion trends. If conservation ef-
forts are focused on protecting these lion strongholds and the noted 10 potential strongholds (as well as
the connections between them) it can reasonably be argued that 25,000 lions can persist across the con-
tinent over the long-term. To suggest that lion populations have been reduced to as low as 20,000 indi-
viduals, as some conservation organizations have proposed, is imprudent and ignores the available data.
I believe petitions to upgrade the listing of the species to “endangered” are premature. However, the
incredibly low numbers of genetically distinct lions found in fragmented populations across West and
Central Africa certainly deserve legal protection.
Given the findings of the lion population assessment, it is clear that new data based on lion-
specific field surveys are necessary to appropriately evaluate the status of lions across sub-Saharan Afri-
ca. While recent reports have made a major contribution to understanding lion populations in many
range countries, the reliance on density estimates extrapolated over large regions is worrisome. Ongo-
ing research across much of Africa should help update the results of this project, and this data will be
absolutely necessary before decisions concerning the legal status of the African lion are made.

60
Literature Cited
. Plan d'action de conservation du lion au Cameroun. (2007). Cameroon. Aarde, R. v., Fourie, J., Cattau, M., Fedak, D., Jacobson, A., Mulaboa, J. S., . . . Riggio, J. (in prep). Distribu-
tion and numerical status of free-ranging lions beyond protected areas: a case study in Tete Province, Mozambique. Washington, DC: National Geographic.
Bauer, H. (2007). Status of large carnivores in Bouba Ndjida National Park, Cameroon. African Journal of
Ecology, 45, 448-450. Bauer, H., Chardonnet, P., & Nowell, K. (2005). Status and distribution of the lion (Panthera leo) in east
and southern Africa. Johannesburg, South Africa: East and Southern African Conservation Work-shop.
Bauer, H., Chardonnet, P., Nowell, K., & Crosmay, W. (2005). Conservation of the lion in West Africa and
Central Africa. Douala, Cameroon: The Workshop of Conservation of the Lion of West African and Cental Africa.
Bauer, H., & Merwe, S. V. D. (2004). Inventory of free-ranging lions Panthera leo in Africa. Oryx, 38(1),
26-31. Bauer, H., & Nowell, K. (2004). Endangered classification for West African lions. Cat News, 41, 35-36. Bauer, H., Nowell, K., & Packer, C. (2008). Panthera leo. IUCN Red List of Threatened Species, Version
2010.4, 2011, from www.iucnredlist.org Becker, M., Murdoch, J., & M'soka, J. (2010). Report to African parks network on the Liuwa carnivore
project. Mfuwe, Zambia: Zambian Carnivore Programme. Begg, C. M., & Begg, K. S. (2010). Annual Report. Rondebosch, South Africa: Niassa Carnivore Project. Bertola, L. D., Hooft, W. F. v., Vrieling, K., Weerd, D. R. U. d., York, D. S., Bauer, H., . . . Iongh, H. H. d.
(2011). Genetic diversity, evolutionary history and implications for conservation fo the lion (Pan-thera leo) in West and Central Africa. Journal of Biogeography. doi: 10.1111/j.1365-2699.2011.02500.x
Bjorklund, M. (2003). The risk of inbreeding due to habitat loss in the lion (Panthera leo). Conservation
Genetics, 4, 515-523. Boulet, H., Chardonnet, P., Crosmary, W., Ferro, P., Fritz, H., Pellerin, M., & Plasschaert, C. (2008). Car-
nets de brousse - Suivi ecologique d'especes peu communes. Paris: IGF Foundation. Breitenmoser-Wursten, C., Durant, S., & Dickman, A. (2009). Paper presented at the National conserva-
tion action planning workshop for cheetah, wild dog, and lion, Oasis Camp, Juba, Southern Su-dan.
61
Brugiere, D., Badjinca, I., Silva, C., Serra, A., & Barry, M. (2005). Distribution and status of lions and leo-pard in Southern Guinea Bissau and Western Guinea, West Africa. CAT News, 43(13-17).
Brugiere, D., & Kormos, R. (2009). Review of the protected area network in Guinea, West Africa, and
recommendations for new sites for biodiversity conservation. Biodiversity Conservation, 18, 847-868.
Brugiere, D., & Magassouba, B. (2003). Mammalian diversity in the National Park of Upper Niger, Repub-
lic of Guinea - an update. Oryx, 37(1), 19. Burton, A. C., Buendi, E. B., Balangtaa, C., Kpelle, D. G., Sam, M. K., & Brashares, J. S. (2010). The decline
of lions in Ghana's Mole National Park. African Journal of Ecology, 49, 122-126. Castley, J. G., Knight, M. H., Mills, M. G. L., & Thouless, C. (2002). Estimation of the lion (Panthera leo)
population in the southwestern Kgalagadi Transfrontier Park using a capture-recapture survey. African Zoology, 37(1), 27-34.
Chardonnet, P. (2002). Conservation of the African lion: contribution to a status survey. Paris: Interna-
tional Foundation for the Conservation of Wildlife. Chardonnet, P., Mesochina, P., Renaud, P.-C., Bento, C., Conjo, D., Fusari, A., . . . Pariela, F. (2009). Con-
servation status of the lion (Panthera leo Linnaeus, 1758) in Mozambique. Maputo, Mozambi-que: SCI Foundation, Campfire Association, DNAC/MITUR, IGF Foundation.
CIESIN. (2005). Gridded Population of the World Version 3 (GPWv3): Population Density Grids. Palisades,
NY: Socioeconomic Data and Applications Center (SEDAC), Columbia University. Creel, S., & Creel, N. M. (1997). Lion density and population structure in the Selous Game Reserve: eval-
uation of hunting quotas and offtake. African Journal of Ecology, 35, 83-93. Dricuru, M. (1999). The lions of Queen Elizabeth National Park, Uganda. Makerere University, Kampala,
Uganda. Dricuru, M., & Siefert, L. (2005). Status of the lions in Uganda. Kampala, Uganda: Uganda Wildlife Au-
thority. Ferguson, K., & Chase, M. (2010). Elephants and fencing conflicts in the GLTFCA and KAZA TFCA. In K.
Ferguson & J. Hanks (Eds.), Fencing Impacts: A review of the environmental, social and economic impacts of game and veterinary fencing in Africa with particular reference to the Great Limpopo and Kavango-Zambezi Transfrontier Conservation Areas (pp. 173-180).
Ferreira, S. M., & Funston, P. J. (2010). Estimating lion population variables: prey and disease effects in
Kruger National Park, South Africa. Wildlife Research, 37, 194-206. Ferreras, P., & Cousins, S. H. (1996). The use of a delphi technique with GIS for estimating the global ab-
undance of top predators: the lion in Africa. Oxford, UK: Zoology Department, Oxford University.

62
Frank, L., Cotterill, A., Hazzah, L., Blackburn, S., Briggs, P., Gelber, L., . . . Napao, M. (2010). Annual Re-port 2010. Nanyuki, Kenya: Living With Lions.
Frank, L., Maclennan, S., Hazzah, L., Bonham, R., & Hill, T. (2006). Lion killing in the Amboseli-Tsavo eco-
system, 2001-2006, and its implications for Kenya's lion population. Nanyuki, Kenya: Living With Lions.
Gebresenbet, F., Bauer, H., Hunter, L., & Gebretensae, K. (2009). Paper presented at the National Lion
Conservation Workshop, Addis Ababa, Ethiopia. Groom, R. (2010). Investigating the abundance, distribution, conservation status and trans-border
movements of endangered African wild dogs in Gonarezhou National Park, Zimbabwe. Birche-nough Bridge, Zimbabwe: African Wildlife Conservation Fund.
Group, S. L. P. R. (2010). The status of large carnivores of the Greater Mapungubwe Transfrontier Con-
servation Area: 2004 to 2010. Bulawayo, Zimbabwe: Shahse Limpopo Predator Research Group. Hanssen, L. (2011). Caprivi Carnivore Project, 2011, from
www.predatorconservation.com/caprivi_carnivore_project.htm Hanssen, L., & Stander, P. (2004). Namibia large carnivore atlas (Vol. 1). Windhoek, Namibia: Predator
Conservation Trust. Harrison, R. L. (1992). Toward a theory of inter-refuge corridor design. Conservation Biology, 6(2), 293-
295. Hemson, G. (2001). Lion/livestock conflict in the Makgadikgadi. Paper presented at the National Tech-
nical Predator Management and Conservation Workshop in Botswana, Maun, Botswana. Henschel, P. (2009). Panthera's role in lion conservation, and potential for collaboration in West and
Central Africa. Paper presented at the 3rd International Seminar on the Conservation and Man-agement of Lions and other Large Carnivores in West and Central Africa, Maroua, Cameroon.
Henschel, P., Azani, D., Burton, C., Malanda, G., Saidu, Y., Sam, M., & Hunter, L. (2010). Lion status up-
dates from five range countries in West and Central Africa. CAT News, 52(34-39). Hunter, L. (2006). The vanishing lion: though few people realize it, the king of beasts is in trouble. Wild-
life Conservation, 109(6), 32-39. Iongh, H. d. (2009). Ten years of ecological research on lion ecology in Northern Cameroon. Paper pre-
sented at the 3rd International Seminar on the Conservation and Management of Lions and oth-er Large Carnivores in West and Central Africa, Maroua, Cameroon.
IUCN. (2006a). Conservation strategy for the lion in West and Central Africa. Yaounde, Cameroon. IUCN. (2006b). Regional conservation strategy for the lion Panthera leo in Eastern and Southern Africa.

63
IUCN, & UNEP. (2009). The World Database on Protected Areas (WDPA). In UNEP-WCMC (Ed.). Cam-bridge, UK.
Jackman, B. (2008). Kenya's lions come roaring back, The Telegraph. Retrieved from
http://www.telegraph.co.uk/travel/destinations/africaandindianocean/1920145/Kenyas-lions-come-roaring-back.html
Jones, T., Caro, T., & Davenport, T. R. B. (2009). Wildlife Corridors in Tanzania. Arusha, Tanzania: Tanza-
nia Wildlife Research Institute. Joubert, D. (Writer). (2011). The Last Lions: National Geographic. KAZA-TFCA. (2010). Kavango Zambezi Transfrontier Conservation Area, 2011, from
www.kavangozambezi.org Kiffner, C., Meyer, B., Muhlenberg, M., & Waltert, M. (2009). Plenty of prey, few predators: what limits
lions Panthera leo in Katavi National Park, western Tanzania. Oryx, 43(1), 52-59. Kirby, A. (2003). Africa's 'shocking' lion loss, BBC News Online. Retrieved from
http://news.bbc.co.uk/1/hi/sci/tech/3171380.stm KWS. (2009). National conservation and management strategy for lion and spotted hyena in Kenya
(2009-2014). Nairobi, Kenya: Kenya Wildlife Service. Loveridge, A. J., Searle, A. W., Murindagomo, F., & Macdonald, D. W. (2007). The impact of sport-
hunting on the population dynamics of an African lion population in protected areas. Biological Conservation, 134, 548-558.
Mesochina, P., Mamang-Kanga, J.-B., Chardonnet, P., Mandjo, Y., & Yagueme, M. (2010a). Conservation
status of the lion (Panthera leo Linnaeus, 1758) in Central African Republic. Bangui, Central Afri-can Republic: Foundation IGF.
Mesochina, P., Mbangwa, O., Chardonnet, P., Mosha, R., Mtui, B., Drouet, N., . . . Kissui, B. (2010b). Con-
servation status of the lion (Panthera leo Linnaeus, 1758) in Tanzania. Paris: SCI Foundation, MNRT-WD, TAWISA, IGF Foundation.
Mesochina, P., Sefu, L., Sichali, E., Chardonnet, P., Ngalande, J., & Lipita, W. (2010c). Conservation status
of the lion (Panthera leo Linnaeus, 1758) in Malawi. Paris: SCI Foundation, DNPW. Mpanduji, D. G. (2004). Population structure, movement and health status of elephants and other wild-
life in the Selous-Niassa Wildlife Corridor, southern Tanzania. Doctor of Veterinary Medicine, Freien Unversitaet Berlin, Berlin. (2827)
Myers, N. (1975). The silent savannahs. International Wildlife, 5, 5-10. Njoroge, P., Yego, R., Muchane, M., Githiru, M., Njeri, T., & Giani, A. (2009). A survey of the large and
medium sized mammals of Arawale National Reserve, Kenya. Journal of East African Natural His-tory, 98(1), 119-128.

64
Nowell, K., & Jackson, P. (1996). Wild Cats: Status Survey and Conservation Action Plan. Gland, Switzer-land: IUCN/SSC Cat Specialist Group.
Ogutu, J. O., & Dublin, H. T. (2002). Demography of lions in relation to prey and habitat in the Maasai
Mara National Reserve, Kenya. African Journal of Ecology, 40, 120-129. Pellerin, M., Kidjo, F., Tehoou, A., Sogbohoussou, E. A., Ayegnon, D., & Chardonnet, P. (2009). Conserva-
tion status of the lion (Panthera leo Linnaeus, 1758) in Benin. Cotonou, Benin: Foundation IGF, CENAGREF.
Pflanz, M. (2009). Lions face extinction in Kenya within 20 years, The Telegraph. Retrieved from
http://www.telegraph.co.uk/news/worldnews/africaandindianocean/kenya/6045282/Lions-face-extinction-in-Kenya-within-20-years.html
Pimm, S., Dollar, L., Jacobson, A., Riggio, J., Anco, C., Angiolillo, G., . . . Smith, C. (in prep). Big cats in an
ever-smaller world: the size of savannahs in West and Central Africa. Washington, DC: National Geographic.
Place, J., Flocken, J., Travers, W., & Waterland, S. (2011). Before the Secretary of the Interior: Petition to
list the African lion (Panthera leo leo) as endangered pursuant to the U.S. Endangered Species Act. Washington, DC: The International Fund for Animal Welfare, The Human Society of the US and Humane Society International, The Born Free Foundation, Defenders of Wildlife, The Fund for Animals.
Purhase, D. G. K., & Vhurumuku, G. (2005). Evaluation of a wild-wild translocation of cheetah (Acinonyx
jubatus) from private land to Matusandona National Park, Zimbabwe. Bulawayo, Zimbabwe: The Zambezi Society.
Renaud, P.-C. (2006). Aerial & terrestrial inventory of the wildlife and mounting pressures in the Nation-
al Park of Niokolo Koba. Niokolo Koba National Park Emergency Plan Report. Sanderson, E. W., Redford, K. H., Chetkiewicz, C.-L. B., Medellin, R. A., Rabinowitz, A. R., Robinson, J. G.,
& Taber, A. B. (2002). Planning to save a species: the jaguar as a model. Conservation Biology, 16(1), 58-72.
Sechele, M. L., & Winterbach, C. W. (2001). Lion surveys in northern Botswana 1998-2000. Paper pre-
sented at the National Technical Predator Management and Conservation Workshop in Botswa-na, Maun, Botswana.
Singh, H. S., & Gibson, L. (2011). A conservation success story in the otherwise dire megafauna extinc-
tion crisis: the Asiatic lion (Panthera leo persica) of Gir Forest. Biological Conservation. doi: 10.1016/j.biocon.2011.02.009
Sogbohossou, E. A., & Tehou, A. (2007). Denombrement des lions dans la reserve de Biosphere de la
Pendjari nord Benin. Benin: Ministere de L'Agriculture de L'Elevage et de la Peche. Stander, P. (2010). The impact of male-biased mortality on the population structure of desert-adapted
lions in Namibia. Windhoek, Namibia: Desert Lion Project.
65
TAWIRI. (2010). Aerial census in the Selous-Niassa wildlife corridor: Dry season, December 2009. Arusha,
Tanzania: Tanzania Wildlife Research Institute. Tende, T., Ottosson, U., Hansson, B., Akesson, M., & Bensch, S. (2009). Population size of lions in Yankari
Game Reserve as revealed by faecal DNA sampling. African Journal of Ecology, 48(4), 949-952. Treves, A., Plumptre, A. J., Hunter, L. T. B., & Ziwa, J. (2009). Indentifying a potential lion Panthera leo
stronghold in Queen Elizabeth National Park, Uganda, and Parc National des Virunga, Democrat-ic Republic of Congo. Oryx, 43(1), 60-66.
Tumenta, P. N., Kok, J. S., Rijssel, J. C. v., Buji, R., Croes, B. M., Funston, P. J., . . . Haes, H. A. U. d. (2010).
Threat of rapid extermination of the lion (Panthera leo leo) in Waza National Park, Northern Cameroon. African Journal of Ecology, 48(4), 808-894.
Vanherle, N. (2006). Inventaire et suivi de la population de lions du Parc national de Zakouma. N'Djame-
na, Chad: Project CURESS. WildCru. (2011). Exploring our research projects, 2011, from www.wildcru.org/research/ Ziegler, S., Nikolaus, G., & Hutterer, R. (2002). High mammalian diversity in the newly established Na-
tional Park of Upper Niger, Republic of Guinea. Oryx, 36(1), 73-80. ZPWMA. (2006). Conservation strategy and action plan for the lion (Panthera leo) in Zimbabwe. Harare,
Zimbabwe: Zimbabwe Parks and Wildlife Management Authority, Ministry of Environment and Tourism.
ZAWA. (2009). Zambia's conservation strategy and action plan for the African lion. Chilanga, Zambia:
Zambia Wildlife Authority.

66
Appendix A:
Examples of Variables Used in the Creation of Lion Habitat Patches

67
Figure 1: Land Conversion in West Africa as per Google Earth Imagery (Pimm et al. in prep)

68
Figure 2: Refined Land Conversion in West Africa as per Google Earth Imagery
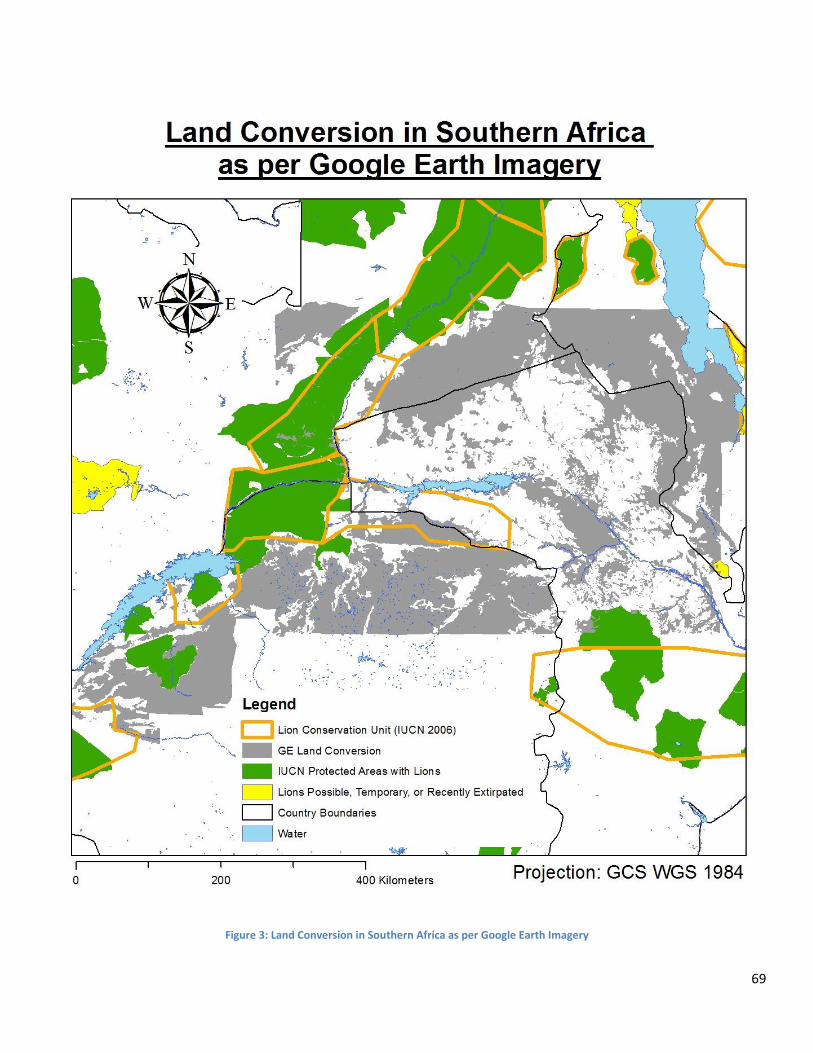
69
Figure 3: Land Conversion in Southern Africa as per Google Earth Imagery

70
Figure 4: Refined Land Conversion in Southern Africa as per Google Earth Imagery

71
Figure 5: Human Population Density in Africa for 2000 (CIESIN 2005)

72
Figure 6: Refined Human Population Density in Africa for 2000

73
Figure 7: Lion Distribution in Kenya (KWS 2009)

74
Figure 8: Lion Distribution in Tanzania (Mesochina et al. 2010b)

75
Appendix B:
Lion Distribution and
Habitat Patch Maps

76
Figure 9: Distribution of the Lion across Africa in Protected Areas and Lion Conservation Units (IUCN 2006a; IUCN 2006b)

77
Figure 10: Distribution of the Lion across Africa in Protected Areas and Lion Habitat Patches (this study)

78
Figure 11: Geographic Regions of Lion Populations in Africa as Defined in this Study

79
Figure 12: Distribution of the Lion in West Africa

80
Figure 13: Distribution of the Lion in Central Africa

81
Figure 14: Distribution of the Lion in East Africa

82
Figure 15: Distribution of the Lion in Southern Africa
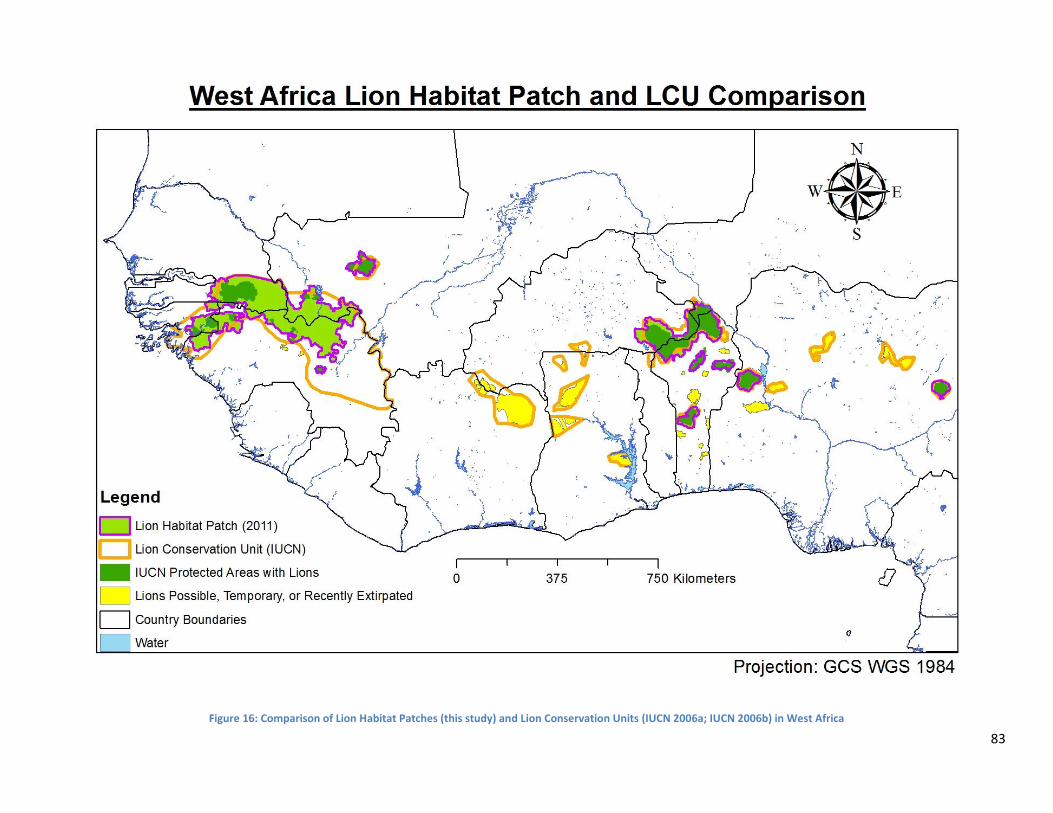
83
Figure 16: Comparison of Lion Habitat Patches (this study) and Lion Conservation Units (IUCN 2006a; IUCN 2006b) in West Africa
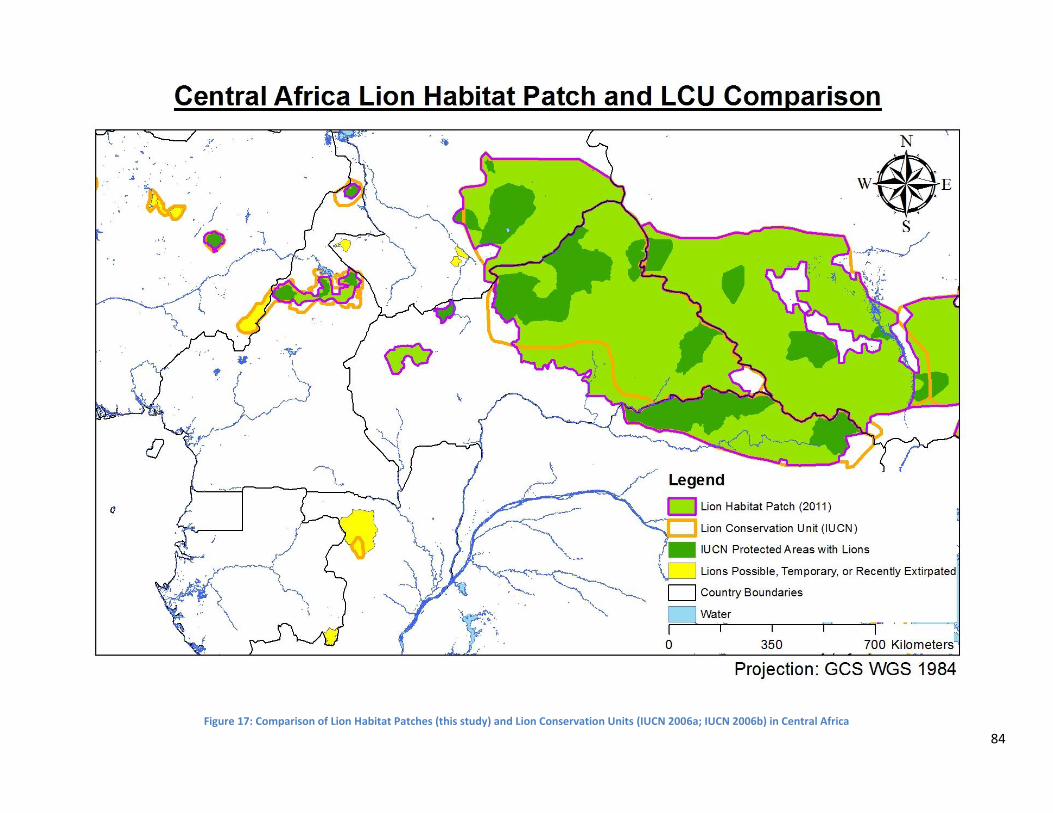
84
Figure 17: Comparison of Lion Habitat Patches (this study) and Lion Conservation Units (IUCN 2006a; IUCN 2006b) in Central Africa

85
Figure 18: Comparison of Lion Habitat Patches (this study) and Lion Conservation Units (IUCN 2006a; IUCN 2006b) in East Africa

86
Figure 19: Comparison of Lion Habitat Patches (this study) and Lion Conservation Units (IUCN 2006a; IUCN 2006b) in Southern Africa

87
Appendix C:
Lion Stronghold and
Potential Stronghold Maps

88
Figure 20: Lion Strongholds and Potential Strongholds across sub-Saharan Africa

89
Figure 21: The Niokolo-Guinea Potential Lion Stronghold in West Africa
including Estimated Number of Lions and Potential Connections between Lion Habitat Patches

90
Figure 22: The W-Arly-Pendjari Complex Lion Stronghold in West Africa
including Estimated Number of Lions and Potential Connections between Lion Habitat Patches

91
Figure 23: Potential Lion Strongholds in Central Africa including Estimated Number of Lions and Potential Connections between Lion Habitat Patches
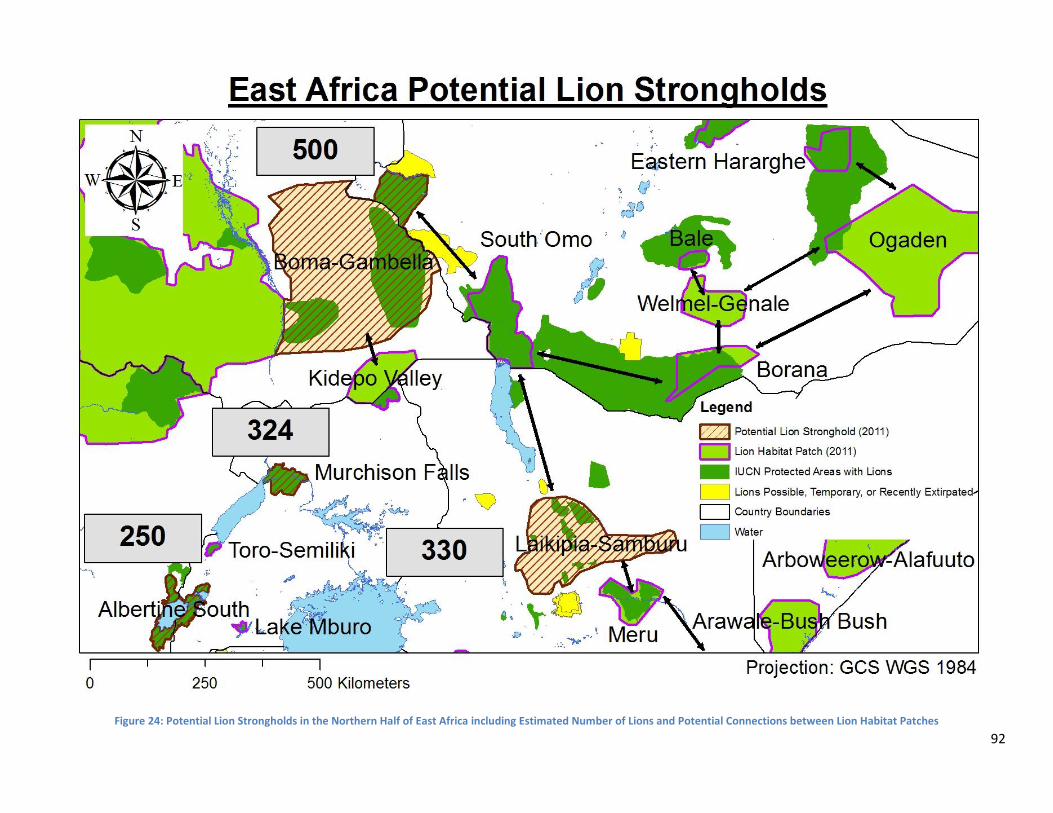
92
Figure 24: Potential Lion Strongholds in the Northern Half of East Africa including Estimated Number of Lions and Potential Connections between Lion Habitat Patches

93
Figure 25: Lion Strongholds and Potential Lion Strongholds in the Northern Half of East Africa
including Estimated Number of Lions and Potential Connections between Lion Habitat Patches

94
Figure 26: Lion Strongholds and Potential Lion Strongholds in Southern Africa including Estimated Number of Lions and Potential Connections between Lion Habitat Patches