Power Sector Update - vid.investmentguruindia.com
16
Emkay Research is also available on www.emkayglobal.com and Bloomberg EMKAY<GO>. Please refer to the last page of the report on Restrictions on Distribution. In Singapore, this research report or research analyses may only be distributed to Institutional Investors, Expert Investors or Accredited Investors as defined in the Securities and Futures Act, Chapter 289 of Singapore. India Equity Research | Power May 1, 2020 Sector Update Power Refer to important disclosures at the end of this report Sharp decline in generation on low demand during lockdown CESC BUY CMP Target Price 656 698 Gujarat Industries Power BUY CMP Target Price 59 99 JSW Energy BUY CMP Target Price 45 73 NHPC BUY CMP Target Price 21 28 NTPC BUY CMP Target Price 95 120 Power Grid Corporation BUY CMP Target Price 162 220 This report is solely produced by Emkay Global. The following person(s) are responsible for the production of the recommendation: Anuj Upadhyay [email protected] +91 22 6624 2447 Power demand fell 8.2% yoy in Mar’20 amid lockdown: Power generation declined 8.2% yoy to 107.4.1bn units in Mar’20 as peak demand declined 23-25% during the lockdown in the country. Generation is expected to decline 32.2% yoy in Apr’20. PLF: PLF declined significantly across the coal segment in Mar’20 (-882 bps yoy to 53.5%) due to the fall in demand. However, PLF improved in 1) hydro (+101bps yoy to 27.3%) due to better water availability; 2) gas (+343bps yoy to 24.2%) to maintain grid stability; and 3) nuclear plants (+1,226bps yoy to 80.0%) due to better fuel availability in Mar’20. PLF in Apr’20 is expected to decline further across the coal segment due to a lack of significant industrial and commercial activity during the lockdown. Spot rates declined in Mar’20 but deficits remained flat: Both base and power deficits remained flat at 0.4% each in Mar’20 on yoy and mom basis. Merchant rates, however, declined by 21.1% yoy to Rs2.5/kWh in Mar’20 and further by 1.8% mom to Rs2.4/kWh in Apr’20 due to subdued power demand. EAP position: We continue to prefer regulated return entities such as NTPC, PGCIL, NHPC and CESC which remains largely immune to the low power offtake by the discoms as their fixed costs are recoverable on the basis of plant availability, and not load factor. Our view: The lockdown across the country led to a significant 23-25% decline in power demand and generation due to very low power offtake from commercial and industrial consumers (C&I) that account for ~40% of the total power demand. The demand, however, is expected to witness a gradual pick-up in the coming weeks with the onset of peak summers and also some relaxations in the green zone areas. In addition, in a move to revive the economy, government is planning to provide relaxations across the selected C&I segment which should increase power demand. Further, in order to provide relief to the financially burdened discoms, the Union Power Ministry (MoP) has made a proposal to PFC/REC to provide special loans to discoms to help them clear power generators’ outstanding bills of ~Rs906bn. These special concessional loans will be given for a period of 10-12 years, along with a moratorium on principal. The loans will be secured by state government guarantees. Relaxation is also provided to discoms in maintaining lower LCs for power procurement, with moratorium on interest and principal repayment to banks. This should partially offset the stress on discoms’ working capital due to subdued power demand and low revenue collection during the lockdown period. Gencos and transmission companies’ working capital would also be under stress due to delayed payment from discoms. The MoP’s direction to discoms for the payment of availability-based fixed charges has provided a significant relief to regulated entities such as NTPC, NHPC and PGCIL. We continue to prefer regulated entities like NTPC, NHPC, CESC and PGCIL who operates on a risk-averse regulatory business environment and earns fixed return on invested project equities. These companies can recover their entire fixed costs on an availability basis. Please see our sector model portfolio (Emkay Alpha Portfolio): Power (Page 3) Financial Snapshot (Consolidated) EPS (Rs) EV/EBITDA P/E FY20E FY21E FY20E FY21E FY20E FY21E CESC 70.7 71.4 9.1 8.4 9.3 9.2 Gujarat Industries Power 17.6 19.5 2.0 2.1 3.4 3.0 JSW Energy 5.4 6.0 4.9 3.8 8.2 7.4 NHPC 2.8 2.9 8.1 8.2 7.4 7.2 NTPC 11.8 12.2 8.4 8.1 8.0 7.8 Power Grid Corporation 21.4 22.2 7.2 6.7 7.6 7.3 Source: Company, Emkay Research
Transcript of Power Sector Update - vid.investmentguruindia.com

Emkay Research is also available on www.emkayglobal.com and Bloomberg EMKAY<GO>. Please refer to the last page of the report on Restrictions on Distribution. In Singapore, this research report or research analyses may only be distributed to Institutional Investors, Expert Investors or Accredited Investors as defined in the Securities and Futures Act, Chapter 289 of Singapore.
India Equity Research | Power
May 1, 2020
Sector Update
Power Refer to important disclosures at the end of this report
Sharp decline in generation on low
demand during lockdown
CESC BUY
CMP Target Price
656 698
Gujarat Industries Power BUY
CMP Target Price
59 99
JSW Energy BUY
CMP Target Price
45 73
NHPC BUY
CMP Target Price
21 28
NTPC BUY
CMP Target Price
95 120
Power Grid Corporation BUY
CMP Target Price
162 220
This report is solely produced by Emkay Global. The following person(s) are responsible for the production of the recommendation:
Anuj Upadhyay [email protected] +91 22 6624 2447
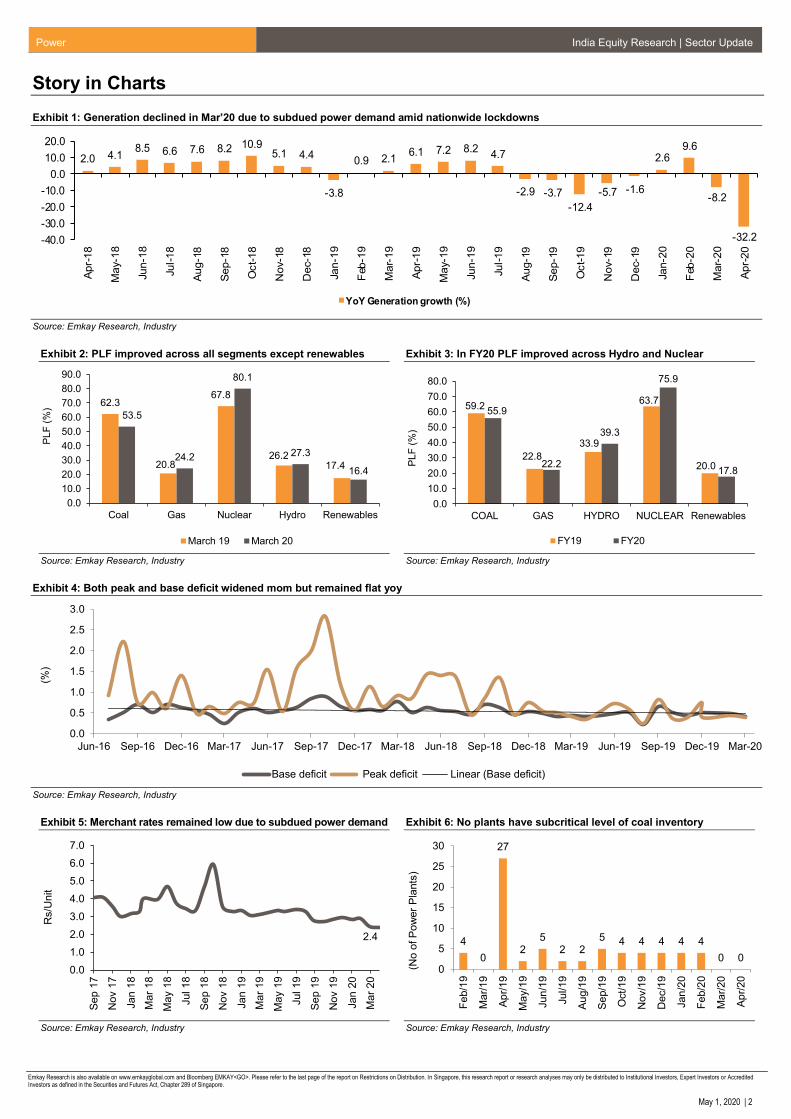
Power demand fell 8.2% yoy in Mar’20 amid lockdown: Power generation declined
8.2% yoy to 107.4.1bn units in Mar’20 as peak demand declined 23-25% during the
lockdown in the country. Generation is expected to decline 32.2% yoy in Apr’20.
PLF: PLF declined significantly across the coal segment in Mar’20 (-882 bps yoy to 53.5%)
due to the fall in demand. However, PLF improved in 1) hydro (+101bps yoy to 27.3%) due
to better water availability; 2) gas (+343bps yoy to 24.2%) to maintain grid stability; and 3)
nuclear plants (+1,226bps yoy to 80.0%) due to better fuel availability in Mar’20. PLF in
Apr’20 is expected to decline further across the coal segment due to a lack of significant
industrial and commercial activity during the lockdown.
Spot rates declined in Mar’20 but deficits remained flat: Both base and power deficits
remained flat at 0.4% each in Mar’20 on yoy and mom basis. Merchant rates, however,
declined by 21.1% yoy to Rs2.5/kWh in Mar’20 and further by 1.8% mom to Rs2.4/kWh in
Apr’20 due to subdued power demand.
EAP position: We continue to prefer regulated return entities such as NTPC, PGCIL,
NHPC and CESC which remains largely immune to the low power offtake by the discoms
as their fixed costs are recoverable on the basis of plant availability, and not load factor.
Our view: The lockdown across the country led to a significant 23-25% decline in power
demand and generation due to very low power offtake from commercial and industrial
consumers (C&I) that account for ~40% of the total power demand. The demand, however, is
expected to witness a gradual pick-up in the coming weeks with the onset of peak summers
and also some relaxations in the green zone areas. In addition, in a move to revive the
economy, government is planning to provide relaxations across the selected C&I segment
which should increase power demand. Further, in order to provide relief to the financially
burdened discoms, the Union Power Ministry (MoP) has made a proposal to PFC/REC to
provide special loans to discoms to help them clear power generators’ outstanding bills of
~Rs906bn. These special concessional loans will be given for a period of 10-12 years, along
with a moratorium on principal. The loans will be secured by state government guarantees.
Relaxation is also provided to discoms in maintaining lower LCs for power procurement, with
moratorium on interest and principal repayment to banks. This should partially offset the stress
on discoms’ working capital due to subdued power demand and low revenue collection during
the lockdown period. Gencos and transmission companies’ working capital would also be
under stress due to delayed payment from discoms. The MoP’s direction to discoms for the
payment of availability-based fixed charges has provided a significant relief to regulated
entities such as NTPC, NHPC and PGCIL.
We continue to prefer regulated entities like NTPC, NHPC, CESC and PGCIL who operates
on a risk-averse regulatory business environment and earns fixed return on invested project
equities. These companies can recover their entire fixed costs on an availability basis.
Please see our sector model portfolio (Emkay Alpha Portfolio): Power (Page 3)
Financial Snapshot (Consolidated)
EPS (Rs) EV/EBITDA P/E
FY20E FY21E FY20E FY21E FY20E FY21E
CESC 70.7 71.4 9.1 8.4 9.3 9.2
Gujarat Industries Power 17.6 19.5 2.0 2.1 3.4 3.0
JSW Energy 5.4 6.0 4.9 3.8 8.2 7.4
NHPC 2.8 2.9 8.1 8.2 7.4 7.2
NTPC 11.8 12.2 8.4 8.1 8.0 7.8
Power Grid Corporation 21.4 22.2 7.2 6.7 7.6 7.3
Source: Company, Emkay Research
Power India Equity Research | Sector Update
Emkay Research is also available on www.emkayglobal.com and Bloomberg EMKAY<GO>. Please refer to the last page of the report on Restrictions on Distribution. In Singapore, this research report or research analyses may only be distributed to Institutional Investors, Expert Investors or Accredited Investors as defined in the Securities and Futures Act, Chapter 289 of Singapore.
May 1, 2020 | 2
Story in Charts
Exhibit 1: Generation declined in Mar’20 due to subdued power demand amid nationwide lockdowns
2.0 4.18.5 6.6 7.6 8.2 10.9
5.1 4.4
-3.8
0.9 2.16.1 7.2 8.2
4.7
-2.9 -3.7
-12.4
-5.7 -1.6
2.69.6
-8.2
-32.2-40.0
-30.0
-20.0
-10.0
0.0
10.0
20.0
Apr-
18
May-1
8
Jun-1
8
Jul-18
Aug-1
8
Sep-1
8
Oct-18
Nov-1
8
Dec-1
8
Jan-1
9
Feb-1
9
Mar-
19
Apr-
19
May-1
9
Jun-1
9
Jul-19
Aug-1
9
Sep-1
9
Oct-19
Nov-1
9
Dec-1
9
Jan-2
0
Feb-2
0
Mar-
20
Apr-
20
YoY Generation growth (%)
Source: Emkay Research, Industry
Exhibit 2: PLF improved across all segments except renewables
Source: Emkay Research, Industry
Exhibit 3: In FY20 PLF improved across Hydro and Nuclear
Source: Emkay Research, Industry
Exhibit 4: Both peak and base deficit widened mom but remained flat yoy
Source: Emkay Research, Industry
Exhibit 5: Merchant rates remained low due to subdued power demand
Source: Emkay Research, Industry
Exhibit 6: No plants have subcritical level of coal inventory
Source: Emkay Research, Industry
62.3
20.8
67.8
26.217.4
53.5
24.2
80.1
27.3
16.4
0.0
10.0
20.0
30.0
40.0
50.0
60.0
70.0
80.0
90.0
Coal Gas Nuclear Hydro Renewables
PL
F (
%)
March 19 March 20
59.2
22.8
33.9
63.7
20.0
55.9
22.2
39.3
75.9
17.8
0.0
10.0
20.0
30.0
40.0
50.0
60.0
70.0
80.0
COAL GAS HYDRO NUCLEAR Renewables
PL
F (
%)
FY19 FY20
0.0
0.5
1.0
1.5
2.0
2.5
3.0
Jun-16 Sep-16 Dec-16 Mar-17 Jun-17 Sep-17 Dec-17 Mar-18 Jun-18 Sep-18 Dec-18 Mar-19 Jun-19 Sep-19 Dec-19 Mar-20
(%)
Base deficit Peak deficit Linear (Base deficit)8.46.9
0.0
1.0
2.0
3.0
4.0
5.0
6.0
7.0
Se
p 1
7
Nov 1
7
Jan
18
Ma
r 18
Ma
y 1
8
Jul 18
Se
p 1
8
Nov 1
8
Jan
19
Ma
r 19
Ma
y 1
9
Jul 19
Se
p 1
9
Nov 1
9
Jan
20
Ma
r 20
Rs/U
nit
2.4 4
0
27
25
2 25 4 4 4 4 4
0 00
5
10
15
20
25
30
Fe
b/1
9
Ma
r/19
Ap
r/19
Ma
y/1
9
Jun
/19
Jul/19
Au
g/1
9
Se
p/1
9
Oct/19
Nov/1
9
Dec/1
9
Jan
/20
Fe
b/2
0
Ma
r/20
Ap
r/20
(No o
f P
ow
er
Pla
nts
)
Power India Equity Research | Sector Update
Emkay Research is also available on www.emkayglobal.com and Bloomberg EMKAY<GO>. Please refer to the last page of the report on Restrictions on Distribution. In Singapore, this research report or research analyses may only be distributed to Institutional Investors, Expert Investors or Accredited Investors as defined in the Securities and Futures Act, Chapter 289 of Singapore.
May 1, 2020 | 3
Emkay Alpha Portfolio – Power
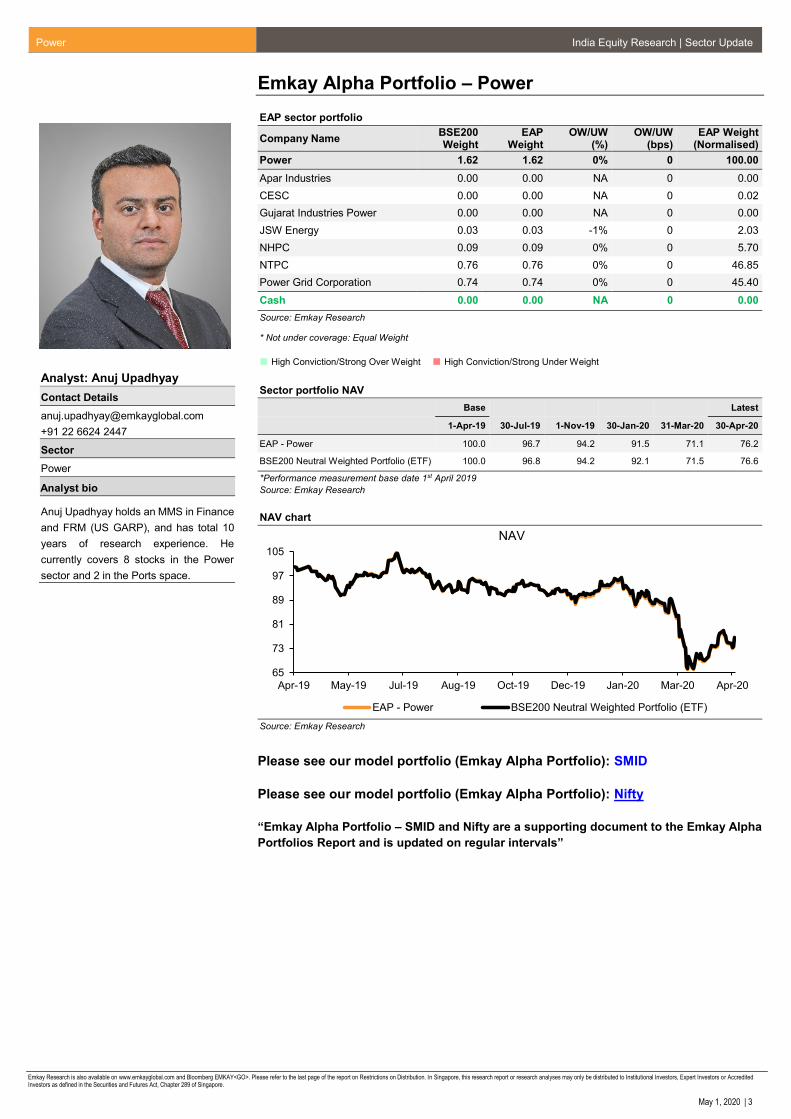
EAP sector portfolio
Company Name BSE200 Weight
EAP Weight
OW/UW (%)
OW/UW (bps)
EAP Weight (Normalised)
Power 1.62 1.62 0% 0 100.00
Apar Industries 0.00 0.00 NA 0 0.00
CESC 0.00 0.00 NA 0 0.02
Gujarat Industries Power 0.00 0.00 NA 0 0.00
JSW Energy 0.03 0.03 -1% 0 2.03
NHPC 0.09 0.09 0% 0 5.70
NTPC 0.76 0.76 0% 0 46.85
Power Grid Corporation 0.74 0.74 0% 0 45.40
Cash 0.00 0.00 NA 0 0.00
Source: Emkay Research
* Not under coverage: Equal Weight
High Conviction/Strong Over Weight High Conviction/Strong Under Weight
Sector portfolio NAV
Base Latest
1-Apr-19 30-Jul-19 1-Nov-19 30-Jan-20 31-Mar-20 30-Apr-20
EAP - Power 100.0 96.7 94.2 91.5 71.1 76.2
BSE200 Neutral Weighted Portfolio (ETF) 100.0 96.8 94.2 92.1 71.5 76.6
*Performance measurement base date 1st April 2019
Source: Emkay Research
NAV chart
Source: Emkay Research
Please see our model portfolio (Emkay Alpha Portfolio): SMID
Please see our model portfolio (Emkay Alpha Portfolio): Nifty
“Emkay Alpha Portfolio – SMID and Nifty are a supporting document to the Emkay Alpha
Portfolios Report and is updated on regular intervals”
65
73
81
89
97
105
Apr-19 May-19 Jul-19 Aug-19 Oct-19 Dec-19 Jan-20 Mar-20 Apr-20
NAV
EAP - Power BSE200 Neutral Weighted Portfolio (ETF)
Analyst: Anuj Upadhyay
Contact Details
+91 22 6624 2447
Sector
Power
Analyst bio
Anuj Upadhyay holds an MMS in Finance
and FRM (US GARP), and has total 10
years of research experience. He
currently covers 8 stocks in the Power
sector and 2 in the Ports space.

Power India Equity Research | Sector Update
Emkay Research is also available on www.emkayglobal.com and Bloomberg EMKAY<GO>. Please refer to the last page of the report on Restrictions on Distribution. In Singapore, this research report or research analyses may only be distributed to Institutional Investors, Expert Investors or Accredited Investors as defined in the Securities and Futures Act, Chapter 289 of Singapore.
May 1, 2020 | 4
Generation, PLF and prices
Generation declined 8.2% yoy in Mar’20 but was flat on full-year basis
Generation in Mar’20 declined 8.2% yoy (incl. provisional figures for renewables) as overall
demand declined 9.1% yoy to 98.8bn units. Generation declined in coal (-12.3% yoy) and
renewables (-1.3% yoy), while it improved in gas (+16.6% yoy), hydro (+4.8% yoy) and nuclear
(+18.1% yoy). Provisional data indicates that generation is expected to decline 32.2% yoy in
Apr’20, with coal declining 39.2% yoy due to subdued demand from the C&I segment. On a full-
year basis generation has remained flat at 1,378bn units.
Exhibit 7: Generation remained flat on full-year basis
Source: CEA, Emkay Research
Exhibit 8: Generation declined across coal and RES in Mar’20
(12.3)
16.6 4.8 18.1
92.1
(1.3)
(20)
(10)
0
10
20
30
40
50
60
Coal Gas Hydro Nuclear Imports RES
(%)
Source: CEA, Emkay Research
During Mar’20, peak power demand improved yoy across states like J&K (+14% yoy),
Rajasthan (+14% yoy), Gujarat (+3%), Maharashtra (+7% yoy), AP (+14%), Karnataka
(+3%), Telangana (+23%), West Bengal (+5%) and Jharkhand (+4%).
Power generation, however, increased only in five states: Delhi (+76%), Chhattisgarh
(+8%), Tamil Nadu (+2%), Bihar (+14%) and Orissa (+18%).
Exhibit 9: State-wise generation and demand scenario on a monthly basis
76%-56%
-7%
0%
-68%-15%
-12%
-3%
8%-9%
-14%-10%
-23%
-2%-23%
2%-15%
14%-11%
18%
-17%
-6%
-3%
-2%14%
-13%
14%
-10%-5%
-10%
3%
-1%
7%
14%
3%-2%
-1%
23%-6%
4%
-6%5%
-80% -60% -40% -20% 0% 20% 40% 60% 80% 100%
Delhi
Haryana
HP
J&K
Punjab
Rajasthan
UP
Uttarakhand
Chhattisgarh
Gujarat
MP
Maharashtra
AP
Karnataka
Kerala
TN
Telangana
Bihar
Jharkhand
Orissa
WB
Demand growth YoY Generation growth YoY
Source: Emkay Research
117.0 107.4
1375.5 1378.3
0.0
200.0
400.0
600.0
800.0
1000.0
1200.0
1400.0
1600.0
March 19 March 20 YTDFY19 YTDFY20
(BU
s)
Power India Equity Research | Sector Update
Emkay Research is also available on www.emkayglobal.com and Bloomberg EMKAY<GO>. Please refer to the last page of the report on Restrictions on Distribution. In Singapore, this research report or research analyses may only be distributed to Institutional Investors, Expert Investors or Accredited Investors as defined in the Securities and Futures Act, Chapter 289 of Singapore.
May 1, 2020 | 5
Company performance
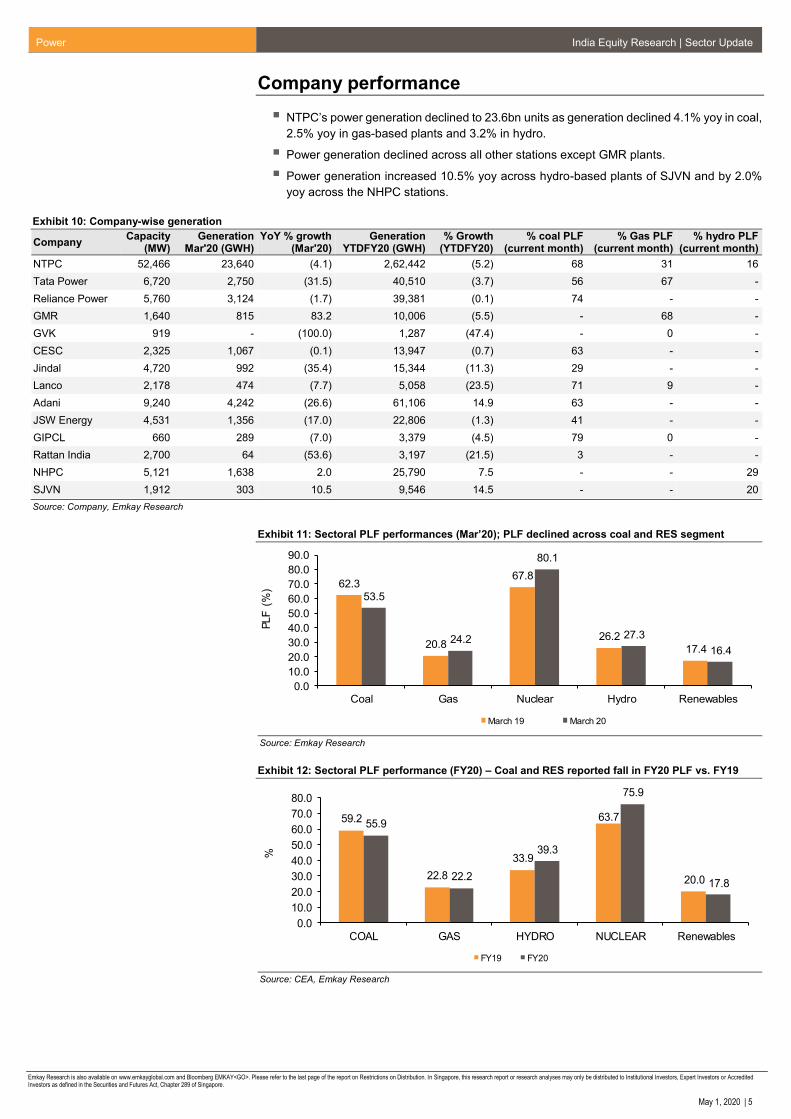
NTPC’s power generation declined to 23.6bn units as generation declined 4.1% yoy in coal,
2.5% yoy in gas-based plants and 3.2% in hydro.
Power generation declined across all other stations except GMR plants.
Power generation increased 10.5% yoy across hydro-based plants of SJVN and by 2.0%
yoy across the NHPC stations.
Exhibit 10: Company-wise generation
Company Capacity
(MW) Generation
Mar'20 (GWH) YoY % growth
(Mar'20) Generation
YTDFY20 (GWH) % Growth
(YTDFY20) % coal PLF
(current month) % Gas PLF
(current month) % hydro PLF
(current month)
NTPC 52,466 23,640 (4.1) 2,62,442 (5.2) 68 31 16
Tata Power 6,720 2,750 (31.5) 40,510 (3.7) 56 67 -
Reliance Power 5,760 3,124 (1.7) 39,381 (0.1) 74 - -
GMR 1,640 815 83.2 10,006 (5.5) - 68 -
GVK 919 - (100.0) 1,287 (47.4) - 0 -
CESC 2,325 1,067 (0.1) 13,947 (0.7) 63 - -
Jindal 4,720 992 (35.4) 15,344 (11.3) 29 - -
Lanco 2,178 474 (7.7) 5,058 (23.5) 71 9 -
Adani 9,240 4,242 (26.6) 61,106 14.9 63 - -
JSW Energy 4,531 1,356 (17.0) 22,806 (1.3) 41 - -
GIPCL 660 289 (7.0) 3,379 (4.5) 79 0 -
Rattan India 2,700 64 (53.6) 3,197 (21.5) 3 - -
NHPC 5,121 1,638 2.0 25,790 7.5 - - 29
SJVN 1,912 303 10.5 9,546 14.5 - - 20
Source: Company, Emkay Research
Exhibit 11: Sectoral PLF performances (Mar’20); PLF declined across coal and RES segment
62.3
20.8
67.8
26.2
17.4
53.5
24.2
80.1
27.3
16.4
0.0
10.0
20.0
30.0
40.0
50.0
60.0
70.0
80.0
90.0
Coal Gas Nuclear Hydro Renewables
PLF (
%)
March 19 March 20
Source: Emkay Research
Exhibit 12: Sectoral PLF performance (FY20) – Coal and RES reported fall in FY20 PLF vs. FY19
59.2
22.8
33.9
63.7
20.0
55.9
22.2
39.3
75.9
17.8
0.0
10.0
20.0
30.0
40.0
50.0
60.0
70.0
80.0
COAL GAS HYDRO NUCLEAR Renewables
%
FY19 FY20
Source: CEA, Emkay Research

Power India Equity Research | Sector Update
Emkay Research is also available on www.emkayglobal.com and Bloomberg EMKAY<GO>. Please refer to the last page of the report on Restrictions on Distribution. In Singapore, this research report or research analyses may only be distributed to Institutional Investors, Expert Investors or Accredited Investors as defined in the Securities and Futures Act, Chapter 289 of Singapore.
May 1, 2020 | 6
Deficit: Both peak and base deficits remained largely flat yoy and mom in Mar’20.
Exhibit 13: Peak and base deficits for Mar’20
0.4 0.4 0.4 0.4
0.2
0.3
0.4
0.5
0.6
0.7
0.8
Base Defict Peak Deficit
% d
eficit
March-19 March-20
Source: CEA, Emkay Research
Exhibit 14: Region-wise base deficit and peak deficit (Mar’20)
Region %
Base Deficit Peak Deficit
Northern region (1.7) (1.3)
Western region 0.0 0.0
Southern region 0.0 0.0
Eastern Region 0.0 0.0
North Eastern region (2.2) (3.4)
All India (0.4) (0.4)
Source: CEA, Emkay Research
Exhibit 15: Deficit status of eight major states (Mar’20)
Major deficit states %
Base Deficit Peak Deficit
J&K (17.9) (20.0)
Bihar 0.0 0.0
AP 0.0 (0.1)
Karnataka 0.0 0.0
UP (1.1) 0.0
Telangana 0.0 0.0
Tamil Nadu 0.0 (0.1)
Kerala 0.0 0.0
Source: CEA, Emkay Research
Exhibit 16: Peak deficit and base deficit trend
0.0
0.5
1.0
1.5
2.0
2.5
3.0
May-
16
Jul-16
Sep-1
6
Nov-
16
Jan-1
7
Mar-
17
May-
17
Jul-17
Sep-1
7
Nov-1
7
Jan-1
8
Mar-
18
May-
18
Jul-18
Sep-1
8
Nov-1
8
Jan-1
9
Mar-
19
May-1
9
Jul-19
Sep-1
9
Nov-
19
Jan-2
0
Mar-
20
(%)
Base deficit Peak deficit
8.6.
Source: CEA, Emkay Research

Power India Equity Research | Sector Update
Emkay Research is also available on www.emkayglobal.com and Bloomberg EMKAY<GO>. Please refer to the last page of the report on Restrictions on Distribution. In Singapore, this research report or research analyses may only be distributed to Institutional Investors, Expert Investors or Accredited Investors as defined in the Securities and Futures Act, Chapter 289 of Singapore.
May 1, 2020 | 7
Spot rates: Merchant rates declined 21.2% yoy and by 15.7% mom to Rs2.5/unit in Mar’20.
Merchant rates have declined further by 1.8% mom and by 25.1% yoy to Rs2.4/unit in Apr’20
due to the significant drop in power demand amid nationwide lockdowns. Prices in the South
Zone declined 26.7% yoy to Rs2.53/unit in Apr’20 and by 20.9% yoy in other Zones.
Exhibit 17: Spot exchange rate on IEX
4.7
5.9
3.63.3 3.3
3.1 3.1 3.2 3.3 3.3 3.4 3.32.8 2.7 2.9 2.9 2.9 2.9
2.5 2.4
0.0
1.0
2.0
3.0
4.0
5.0
6.0
7.0
Sep
18
Oct
18
Nov
18
Dec
18
Jan
19
Feb
19
Mar
19
Apr
19
May
19
Jun
19
Jul 1
9
Aug
19
Sep
19
Oct
19
Nov
19
Dec
19
Jan
20
Feb
20
Mar
20
Apr
20
Rs
/Un
it
Source: IEX, Emkay Research
Exhibit 18: Month-wise Zonal IEX average price trend
Zone Apr'20 Apr'19 YoY (%) Mar'20 MoM (%)
A1 2.53 3.19 -20.9 2.45 2.97
A2 2.53 3.19 -20.9 2.45 2.97
E1 2.53 3.19 -20.9 2.45 2.97
E2 2.53 3.19 -20.9 2.45 2.97
N1 2.53 3.19 -20.9 2.45 2.97
N2 2.53 3.19 -20.9 2.45 2.97
N3 2.53 3.19 -20.9 2.45 2.97
S1 2.53 3.44 -26.7 2.47 2.19
S2 2.53 3.46 -26.9 2.47 2.19
W1 2.53 3.19 -20.9 2.45 2.97
W2 2.53 3.19 -20.9 2.45 2.97
W3 2.53 3.19 -20.9 2.45 2.97
MCP 2.53 3.22 -21.6 2.46 2.85
Source: CEA, Emkay Research;
Fuel supply, prices: Production across coal mines improved by 5.3% on yoy basis to 90.3
mn tonnes in Mar’20, while coal dispatch was down by 6.9% yoy to 61.4mn tonnes. Coal
production at CIL mines increased by 6.5% yoy to 84.36 mn tonnes in Mar’20, while in
FY20 CIL produced 602.14mn tonnes of coal vs 608.1mn tonnes in FY19. Overall coal
production in FY20 has declined marginally by 0.8% yoy to 666.2mn tonnes.
Further, the outstanding dues of power generators to CIL stood at Rs138.4bn at the end of
Feb’20 vs. Rs124.2bn at the end of Jan’20.
Inventory at power stations continues to impress with zero plants facing sub-critical level of
inventory in Apr’20 vs. 27 in April’19, primarily due to the drop in demand.
Exhibit 19: Number of power plants facing sub-critical level of inventory (less than 7 days)
2825
1613
11
22
29
23
96
4
0
27
25
2 25 4 4 4 4 4
0 00
5
10
15
20
25
30
35
Apr-
18
May-
18
Jun-1
8
Jul-18
Aug-1
8
Sep-1
8
Oct-18
Nov-
18
Dec-
18
Jan-1
9
Feb
-19
Mar-
19
Apr-
19
May-
19
Jun-1
9
Jul-19
Aug-1
9
Sep-1
9
Oct-19
Nov-
19
Dec-
19
Jan-2
0
Feb
-20
Mar-
20
Apr-
20
(No o
f Pow
er Pla
nts
)
Source: CEA, Emkay Research
A1 - Tripura, Meghalaya, Manipur, Mizoram, Nagaland
A2 - Assam, Arunachal Pradesh
E1 - WB, Sikkim, Bihar, Jharkhand
E2 - Orissa
N1 - J&K, HP, Chandigarh, Haryana
N2 - UP, Uttaranchal, Rajasthan, Delhi
N3 - Punjab
S1 - AP, Telangana, Karnataka, Pondicherry (Yanam), South Goa
S2 - TN, Kerala, Pondicherry (Puducherry), Pondicherry (Karaikal), Pondicherry (Mahe)
W1 - MP
W2 - Maharashtra, Gujarat, Daman and Diu, Dadra and Nagar Haveli, North Goa
W3- Chhattisgarh

Power India Equity Research | Sector Update
Emkay Research is also available on www.emkayglobal.com and Bloomberg EMKAY<GO>. Please refer to the last page of the report on Restrictions on Distribution. In Singapore, this research report or research analyses may only be distributed to Institutional Investors, Expert Investors or Accredited Investors as defined in the Securities and Futures Act, Chapter 289 of Singapore.
May 1, 2020 | 8
As of April’20, coal stocks at 134 power plants increased by 60.6% yoy to 50.7mn tonnes
(97.7% domestic and 2.3% imported). Coal stock was also up by 12.7% mom due to better
coal supply and slowdown in demand which led to a rise in inventory levels.
Exhibit 20: Coal production and dispatch trend in Mar’20
-50.0
-40.0
-30.0
-20.0
-10.0
0.0
10.0
20.0
30.0
- 10.0 20.0
30.0 40.0 50.0
60.0 70.0 80.0
90.0
Feb
-19
Mar-
19
Apr-
19
May-
19
Jun-1
9
Jul-19
Aug-1
9
Sep-1
9
Oct-19
Nov-
19
Dec-
19
Jan-2
0
Feb
-20
(%)
(Mn T
onnes)
Coal production Coal disp atch t o power sector Dispatch to Power Coal Pro duction
Source: CEA, Emkay Research
International coal prices (RB Index 6300 kcal) declined 8.8% yoy to US$65.5/tonne in
Mar’20 and by 14.1% mom. On a landed cost basis, however, it was down by only 0.5%
yoy at Rs4,932/tonne, primarily due to rupee depreciation. The HBA Index declined 19.7%
yoy to US$65.8/tonne in Apr’20 and by 25.9% yoy to US$67.1/tonne in Mar’20.
Exhibit 21: International coal price trend (RB Index 6300 kcal) Mar’20
0
20
40
60
80
100
120
Dec-
14
Mar-
15
Jun-1
5
Sep-1
5
Dec-
15
Mar-
16
Jun-1
6
Sep-1
6
Dec-
16
Mar-
17
Jun-1
7
Sep-1
7
Dec-
17
Mar-
18
Jun-1
8
Sep-1
8
Dec-
18
Mar-
19
Jun-1
9
Sep-1
9
Dec-
19
Mar-
20
($/tonne)
Source: Emkay Research,
Exhibit 22: International coal price trend (Indonesian coal - HBA index) April’20
0.00
40.00
80.00
120.00
Dec-
14
Apr-
15
Aug-1
5
Dec-
15
Apr-
16
Aug-1
6
Dec-
16
Apr-
17
Aug-1
7
Dec-
17
Apr-
18
Aug-1
8
Dec-
18
Apr-
19
Aug-1
9
Dec-
19
Apr-
20
($/tonne)
Source: Emkay Research

Power India Equity Research | Sector Update
Emkay Research is also available on www.emkayglobal.com and Bloomberg EMKAY<GO>. Please refer to the last page of the report on Restrictions on Distribution. In Singapore, this research report or research analyses may only be distributed to Institutional Investors, Expert Investors or Accredited Investors as defined in the Securities and Futures Act, Chapter 289 of Singapore.
May 1, 2020 | 9
Natural gas production declined 8.8% yoy and by 10.2% mom to 75.5 mmscmd in Feb’20.
Exhibit 23: Domestic natural gas production trend
70.0
75.0
80.0
85.0
90.0
95.0
Feb
-16
May-
16
Aug-1
6
Nov-1
6
Feb
-17
May-
17
Aug-1
7
Nov-
17
Feb
-18
May-
18
Aug-1
8
Nov-
18
Feb-1
9
May-
19
Aug-1
9
Nov-
19
Feb-2
0
(mm
scm
d)
Source: Emkay Research
Capacity: In Mar’20, 1,320 MW capacity was added across the Coal space (660 MW – NTPC
Khargone & 660 MW Suratgarh in Rajasthan) and 270 MW capacity was added across the
Renewable sector. Apart from this, 700 MW was retired in the coal sector during the month. In
FY20, 14GW of net capacity has been added, comprising Coal (4.4GW), Hydro (300MW) and
RES (9.4GW). Currently, the all-India installed capacity is 370GW.
Exhibit 24: Current capacity fuel mix
62.3
1.8
12.3
23.5
0
10
20
30
40
50
60
70
Thermal (Coal+gas) Nuclear Hydro RES
(%)
Source: CEA, Emkay Research
Exhibit 25: Upcoming plant capacity
State Project Name LOA Date Unit Cap. (MW) Org. Comm. Sched. Ant. COD
Bihar Barh STPP St-1 March-05 1 660 August-09 June-20
Bihar Nabinagar STPP January-13 2 660 July-17 June-20
Chhattisgarh Lara STPP November-12 2 800 September-17 July-20
Madhya Pradesh Gadarwara STPP March-13 2 800 September-17 July-20
Odisha Rourkela PP-II Expansion May-16 1 250 September-18 July-20
Uttar Pradesh Harduaganj Expn II September-15 1 660 November-19 July-20
Telangana Bhadradri TPP March-15 2 270 March-17 May-20
Karnataka Yelahanka CCPP November-15 1 370 February-18 May-20
Source: Emkay Research, Industry; As per CEA report
Outstanding dues of discoms: The outstanding dues of distribution companies to power
generating companies declined 3% mom to Rs906bn in Mar’20, while the overdue amount is
down by 1% mom to Rs798bn.

Power India Equity Research | Sector Update
Emkay Research is also available on www.emkayglobal.com and Bloomberg EMKAY<GO>. Please refer to the last page of the report on Restrictions on Distribution. In Singapore, this research report or research analyses may only be distributed to Institutional Investors, Expert Investors or Accredited Investors as defined in the Securities and Futures Act, Chapter 289 of Singapore.
May 1, 2020| 10
Exhibit 26: Discoms outstanding dues data
885 897 881 860 876 889929
906
713745 760 758 765 766
808 798
500
600
700
800
900
1000
Aug-19 Sep-19 Oct-19 Nov-19 Dec-19 Jan-20 Feb-20 Mar-20
Rs b
n
Outstanding Overdue O/S
Source: Emkay Research
Exhibit 27: Total gas consumption by top 10 power developers (MMSCMD)
Developer October-19 November-19 December-19 January-20 February-20 March-20
Torrent Power 4.8 5.17 3.89 2.53 4.37 4.49
NTPC 2.98 2.3 2.4 3.06 3.41 2.8
IPGPCL 3.39 2.95 2.86 2.59 2.67 2.57
ONGC 1.82 1.6 1.56 1.88 2.49 3.93
RGPPL 2.32 2.68 2.99 2.33 2.21 1.99
NEEPCO 2.18 2.24 2.18 1.38 2.17 1.67
MAHAGENCO 2.47 2.18 1.6 1.07 1.71 0.9
Puducherry ED 0.17 0.17 1.35 0.42 1.51 3.31
APGPCL 1.02 1.12 1.09 1.65 1.03 1.07
Lanco Power 1.2 1.14 1.21 0.76 0.95 0.47
Source: Emkay Research, Elekore
Exhibit 28: Gas Consumption by Power Sector (MMSCM/Day)
Category September-19 October-19 November-19 December-19 January-20 February-20
RLNG 11 8 9 8 7 8
DOMESTIC 20 19 20 19 19 19
Total 31 27 29 27 26 27
Source: Emkay Research, Elekore
DEEP Portal Tender Outcomes in Mar’20
Exhibit 29: GUVNL RA 02 – 500 MW tender
Buyer Period Tender
Quantum (MW)
Trader Source Supply
Quantum (MW)
Supply Time
Landed cos (Rs/kWh)t
GUVNL RA 02
1st April 2020 -30th April2020
500
Adani Enterprises
Torrent 50
00-24 hrs
3.16 TPTCL 100
Adani Power 350
1st May 2020 - 31st May 2020
500 Torrent 50
3.21 Adani Power 450
1st June 2020 - 30th June 2020
500 Torrent 50
3.25 Adani Power 450
Source: Emkay Research, Elekore
Exhibit 30: Tata Power RA 82
Bidder’s Name Tariff (Rs/kwh) Period of Supply Bidder Qty (MW) LoI
Essar Power 2.8 1st June 2020 - 30th June 2020 87
LoI Issued Adani Power 2.8 1st July 2020 - 31st July 2020 87
DB Power 2.8 1st Aug 2020 - 31st Aug 2020 87
Adani Power 2.8 1st Sept 2020 - 30th Sept 2020 87
Source: Emkay Research, Elekore
Power India Equity Research | Sector Update
Emkay Research is also available on www.emkayglobal.com and Bloomberg EMKAY<GO>. Please refer to the last page of the report on Restrictions on Distribution. In Singapore, this research report or research analyses may only be distributed to Institutional Investors, Expert Investors or Accredited Investors as defined in the Securities and Futures Act, Chapter 289 of Singapore.
May 1, 2020| 11
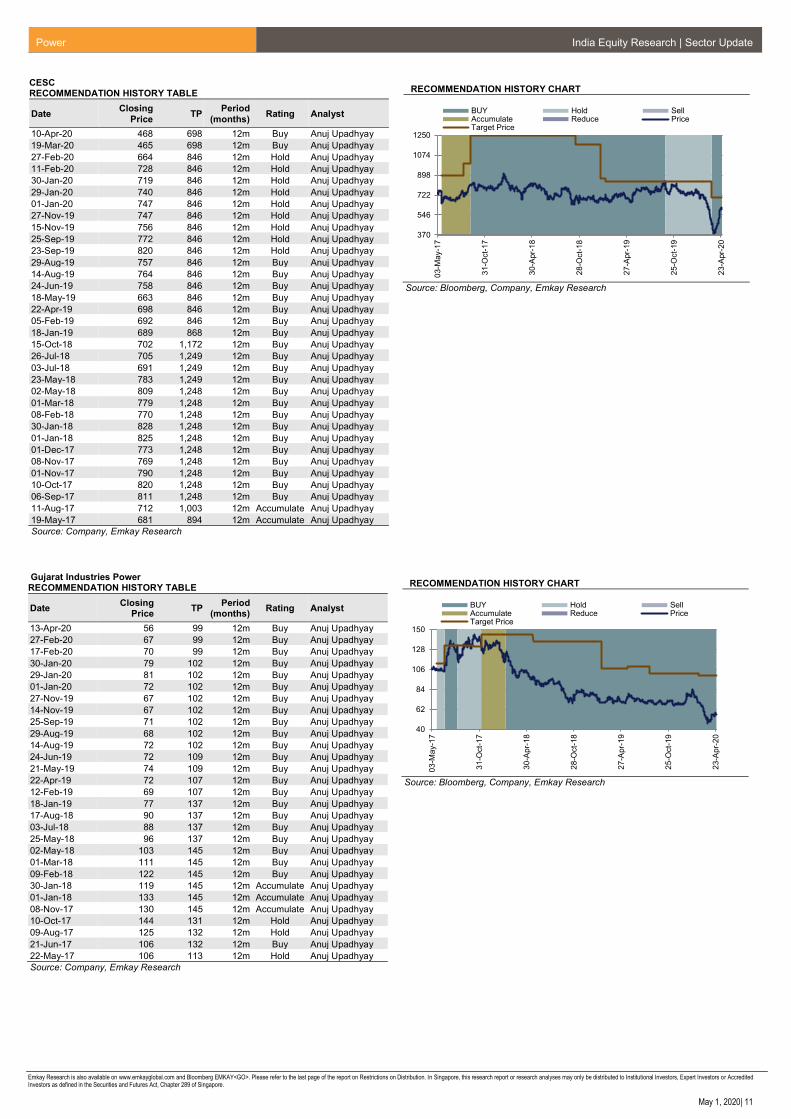
CESC RECOMMENDATION HISTORY TABLE
Date Closing
Price TP
Period
(months) Rating Analyst
10-Apr-20 468 698 12m Buy Anuj Upadhyay
19-Mar-20 465 698 12m Buy Anuj Upadhyay
27-Feb-20 664 846 12m Hold Anuj Upadhyay
11-Feb-20 728 846 12m Hold Anuj Upadhyay
30-Jan-20 719 846 12m Hold Anuj Upadhyay
29-Jan-20 740 846 12m Hold Anuj Upadhyay
01-Jan-20 747 846 12m Hold Anuj Upadhyay
27-Nov-19 747 846 12m Hold Anuj Upadhyay
15-Nov-19 756 846 12m Hold Anuj Upadhyay
25-Sep-19 772 846 12m Hold Anuj Upadhyay
23-Sep-19 820 846 12m Hold Anuj Upadhyay
29-Aug-19 757 846 12m Buy Anuj Upadhyay
14-Aug-19 764 846 12m Buy Anuj Upadhyay
24-Jun-19 758 846 12m Buy Anuj Upadhyay
18-May-19 663 846 12m Buy Anuj Upadhyay
22-Apr-19 698 846 12m Buy Anuj Upadhyay
05-Feb-19 692 846 12m Buy Anuj Upadhyay
18-Jan-19 689 868 12m Buy Anuj Upadhyay
15-Oct-18 702 1,172 12m Buy Anuj Upadhyay
26-Jul-18 705 1,249 12m Buy Anuj Upadhyay
03-Jul-18 691 1,249 12m Buy Anuj Upadhyay
23-May-18 783 1,249 12m Buy Anuj Upadhyay
02-May-18 809 1,248 12m Buy Anuj Upadhyay
01-Mar-18 779 1,248 12m Buy Anuj Upadhyay
08-Feb-18 770 1,248 12m Buy Anuj Upadhyay
30-Jan-18 828 1,248 12m Buy Anuj Upadhyay
01-Jan-18 825 1,248 12m Buy Anuj Upadhyay
01-Dec-17 773 1,248 12m Buy Anuj Upadhyay
08-Nov-17 769 1,248 12m Buy Anuj Upadhyay
01-Nov-17 790 1,248 12m Buy Anuj Upadhyay
10-Oct-17 820 1,248 12m Buy Anuj Upadhyay
06-Sep-17 811 1,248 12m Buy Anuj Upadhyay
11-Aug-17 712 1,003 12m Accumulate Anuj Upadhyay
19-May-17 681 894 12m Accumulate Anuj Upadhyay
Source: Company, Emkay Research
RECOMMENDATION HISTORY CHART
Source: Bloomberg, Company, Emkay Research
370
546
722
898
1074
1250
03
-Ma
y-1
7
31
-Oct-
17
30
-Apr-
18
28
-Oct-
18
27
-Apr-
19
25
-Oct-
19
23
-Apr-
20
BUY Hold SellAccumulate Reduce PriceTarget Price
Gujarat Industries Power RECOMMENDATION HISTORY TABLE
Date Closing
Price TP
Period (months)
Rating Analyst
13-Apr-20 56 99 12m Buy Anuj Upadhyay
27-Feb-20 67 99 12m Buy Anuj Upadhyay
17-Feb-20 70 99 12m Buy Anuj Upadhyay
30-Jan-20 79 102 12m Buy Anuj Upadhyay
29-Jan-20 81 102 12m Buy Anuj Upadhyay
01-Jan-20 72 102 12m Buy Anuj Upadhyay
27-Nov-19 67 102 12m Buy Anuj Upadhyay
14-Nov-19 67 102 12m Buy Anuj Upadhyay
25-Sep-19 71 102 12m Buy Anuj Upadhyay
29-Aug-19 68 102 12m Buy Anuj Upadhyay
14-Aug-19 72 102 12m Buy Anuj Upadhyay
24-Jun-19 72 109 12m Buy Anuj Upadhyay
21-May-19 74 109 12m Buy Anuj Upadhyay
22-Apr-19 72 107 12m Buy Anuj Upadhyay
12-Feb-19 69 107 12m Buy Anuj Upadhyay
18-Jan-19 77 137 12m Buy Anuj Upadhyay
17-Aug-18 90 137 12m Buy Anuj Upadhyay
03-Jul-18 88 137 12m Buy Anuj Upadhyay
25-May-18 96 137 12m Buy Anuj Upadhyay
02-May-18 103 145 12m Buy Anuj Upadhyay
01-Mar-18 111 145 12m Buy Anuj Upadhyay
09-Feb-18 122 145 12m Buy Anuj Upadhyay
30-Jan-18 119 145 12m Accumulate Anuj Upadhyay
01-Jan-18 133 145 12m Accumulate Anuj Upadhyay
08-Nov-17 130 145 12m Accumulate Anuj Upadhyay
10-Oct-17 144 131 12m Hold Anuj Upadhyay
09-Aug-17 125 132 12m Hold Anuj Upadhyay
21-Jun-17 106 132 12m Buy Anuj Upadhyay
22-May-17 106 113 12m Hold Anuj Upadhyay
Source: Company, Emkay Research
RECOMMENDATION HISTORY CHART
Source: Bloomberg, Company, Emkay Research
40
62
84
106
128
150
03
-Ma
y-1
7
31
-Oct-
17
30
-Apr-
18
28
-Oct-
18
27
-Apr-
19
25
-Oct-
19
23
-Apr-
20
BUY Hold SellAccumulate Reduce PriceTarget Price

Power India Equity Research | Sector Update
Emkay Research is also available on www.emkayglobal.com and Bloomberg EMKAY<GO>. Please refer to the last page of the report on Restrictions on Distribution. In Singapore, this research report or research analyses may only be distributed to Institutional Investors, Expert Investors or Accredited Investors as defined in the Securities and Futures Act, Chapter 289 of Singapore.
May 1, 2020| 12
JSW Energy RECOMMENDATION HISTORY TABLE
Date Closing
Price TP
Period
(months) Rating Analyst
13-Apr-20 41 73 12m Buy Anuj Upadhyay
27-Feb-20 60 73 12m Buy Anuj Upadhyay
18-Feb-20 66 73 12m Buy Anuj Upadhyay
05-Feb-20 62 73 12m Buy Anuj Upadhyay
30-Jan-20 64 74 12m Hold Anuj Upadhyay
29-Jan-20 66 74 12m Hold Anuj Upadhyay
01-Jan-20 69 74 12m Hold Anuj Upadhyay
27-Nov-19 74 74 12m Hold Anuj Upadhyay
03-Nov-19 70 74 12m Hold Anuj Upadhyay
25-Sep-19 64 74 12m Hold Anuj Upadhyay
29-Aug-19 67 74 12m Hold Anuj Upadhyay
06-Aug-19 68 74 12m Hold Anuj Upadhyay
24-Jun-19 67 74 12m Hold Anuj Upadhyay
17-May-19 67 74 12m Hold Anuj Upadhyay
22-Apr-19 71 73 12m Hold Anuj Upadhyay
31-Jan-19 67 73 12m Hold Anuj Upadhyay
18-Jan-19 68 73 12m Hold Anuj Upadhyay
27-Jul-18 67 73 12m Hold Anuj Upadhyay
03-Jul-18 64 73 12m Reduce Anuj Upadhyay
03-May-18 82 73 12m Reduce Anuj Upadhyay
02-May-18 82 76 12m Reduce Anuj Upadhyay
01-Mar-18 81 76 12m Reduce Anuj Upadhyay
06-Feb-18 83 76 12m Reduce Anuj Upadhyay
30-Jan-18 87 76 12m Reduce Anuj Upadhyay
01-Jan-18 91 76 12m Reduce Anuj Upadhyay
01-Dec-17 84 76 12m Reduce Anuj Upadhyay
01-Nov-17 85 76 12m Reduce Anuj Upadhyay
10-Oct-17 79 64 12m Hold Anuj Upadhyay
11-Aug-17 64 64 12m Hold Anuj Upadhyay
02-May-17 62 64 12m Hold Anuj Upadhyay
Source: Company, Emkay Research
RECOMMENDATION HISTORY CHART
Source: Bloomberg, Company, Emkay Research
30
44
58
72
86
100
03
-Ma
y-1
7
31
-Oct-
17
30
-Apr-
18
28
-Oct-
18
27
-Apr-
19
25
-Oct-
19
23
-Apr-
20
BUY Hold SellAccumulate Reduce PriceTarget Price
NHPC RECOMMENDATION HISTORY TABLE
Date Closing
Price TP
Period (months)
Rating Analyst
13-Apr-20 22 28 12m Buy Anuj Upadhyay
03-Mar-20 23 28 12m Buy Anuj Upadhyay
27-Feb-20 21 28 12m Buy Anuj Upadhyay
10-Feb-20 24 28 12m Buy Anuj Upadhyay
30-Jan-20 25 28 12m Buy Anuj Upadhyay
29-Jan-20 26 28 12m Buy Anuj Upadhyay
01-Jan-20 24 28 12m Buy Anuj Upadhyay
27-Nov-19 24 28 12m Buy Anuj Upadhyay
19-Nov-19 23 28 12m Buy Anuj Upadhyay
25-Sep-19 23 28 12m Buy Anuj Upadhyay
29-Aug-19 23 28 12m Buy Anuj Upadhyay
14-Aug-19 23 28 12m Buy Anuj Upadhyay
24-Jun-19 25 28 12m Hold Anuj Upadhyay
31-May-19 25 28 12m Hold Anuj Upadhyay
22-Apr-19 24 29 12m Buy Anuj Upadhyay
08-Feb-19 24 29 12m Buy Anuj Upadhyay
18-Jan-19 25 31 12m Buy Anuj Upadhyay
16-Dec-18 26 31 12m Buy Anuj Upadhyay
13-Aug-18 25 31 12m Buy Anuj Upadhyay
03-Jul-18 23 31 12m Accumulate Anuj Upadhyay
04-Jun-18 26 31 12m Accumulate Anuj Upadhyay
02-May-18 28 35 12m Buy Anuj Upadhyay
01-Mar-18 28 35 12m Buy Anuj Upadhyay
12-Feb-18 30 35 12m Buy Anuj Upadhyay
30-Jan-18 30 33 12m Buy Anuj Upadhyay
01-Jan-18 32 33 12m Buy Anuj Upadhyay
01-Dec-17 28 33 12m Buy Anuj Upadhyay
13-Nov-17 27 33 12m Buy Anuj Upadhyay
01-Nov-17 29 33 12m Accumulate Anuj Upadhyay
10-Oct-17 28 33 12m Accumulate Anuj Upadhyay
10-Aug-17 30 33 12m Accumulate Anuj Upadhyay
05-Jun-17 31 30 12m Hold Anuj Upadhyay
Source: Company, Emkay Research
RECOMMENDATION HISTORY CHART
Source: Bloomberg, Company, Emkay Research
10
16
22
28
34
40
03
-Ma
y-1
7
31
-Oct-
17
30
-Apr-
18
28
-Oct-
18
27
-Apr-
19
25
-Oct-
19
23
-Apr-
20
BUY Hold SellAccumulate Reduce PriceTarget Price
Power India Equity Research | Sector Update
Emkay Research is also available on www.emkayglobal.com and Bloomberg EMKAY<GO>. Please refer to the last page of the report on Restrictions on Distribution. In Singapore, this research report or research analyses may only be distributed to Institutional Investors, Expert Investors or Accredited Investors as defined in the Securities and Futures Act, Chapter 289 of Singapore.
May 1, 2020| 13
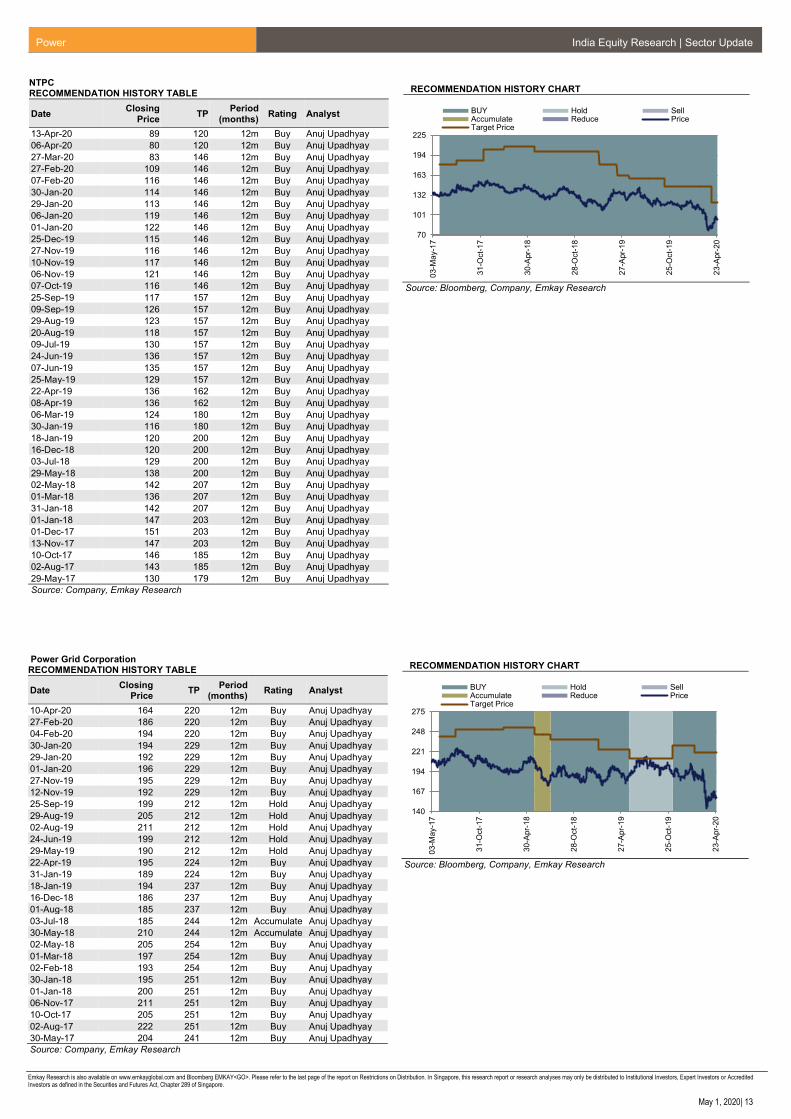
NTPC RECOMMENDATION HISTORY TABLE
Date Closing
Price TP
Period
(months) Rating Analyst
13-Apr-20 89 120 12m Buy Anuj Upadhyay
06-Apr-20 80 120 12m Buy Anuj Upadhyay
27-Mar-20 83 146 12m Buy Anuj Upadhyay
27-Feb-20 109 146 12m Buy Anuj Upadhyay
07-Feb-20 116 146 12m Buy Anuj Upadhyay
30-Jan-20 114 146 12m Buy Anuj Upadhyay
29-Jan-20 113 146 12m Buy Anuj Upadhyay
06-Jan-20 119 146 12m Buy Anuj Upadhyay
01-Jan-20 122 146 12m Buy Anuj Upadhyay
25-Dec-19 115 146 12m Buy Anuj Upadhyay
27-Nov-19 116 146 12m Buy Anuj Upadhyay
10-Nov-19 117 146 12m Buy Anuj Upadhyay
06-Nov-19 121 146 12m Buy Anuj Upadhyay
07-Oct-19 116 146 12m Buy Anuj Upadhyay
25-Sep-19 117 157 12m Buy Anuj Upadhyay
09-Sep-19 126 157 12m Buy Anuj Upadhyay
29-Aug-19 123 157 12m Buy Anuj Upadhyay
20-Aug-19 118 157 12m Buy Anuj Upadhyay
09-Jul-19 130 157 12m Buy Anuj Upadhyay
24-Jun-19 136 157 12m Buy Anuj Upadhyay
07-Jun-19 135 157 12m Buy Anuj Upadhyay
25-May-19 129 157 12m Buy Anuj Upadhyay
22-Apr-19 136 162 12m Buy Anuj Upadhyay
08-Apr-19 136 162 12m Buy Anuj Upadhyay
06-Mar-19 124 180 12m Buy Anuj Upadhyay
30-Jan-19 116 180 12m Buy Anuj Upadhyay
18-Jan-19 120 200 12m Buy Anuj Upadhyay
16-Dec-18 120 200 12m Buy Anuj Upadhyay
03-Jul-18 129 200 12m Buy Anuj Upadhyay
29-May-18 138 200 12m Buy Anuj Upadhyay
02-May-18 142 207 12m Buy Anuj Upadhyay
01-Mar-18 136 207 12m Buy Anuj Upadhyay
31-Jan-18 142 207 12m Buy Anuj Upadhyay
01-Jan-18 147 203 12m Buy Anuj Upadhyay
01-Dec-17 151 203 12m Buy Anuj Upadhyay
13-Nov-17 147 203 12m Buy Anuj Upadhyay
10-Oct-17 146 185 12m Buy Anuj Upadhyay
02-Aug-17 143 185 12m Buy Anuj Upadhyay
29-May-17 130 179 12m Buy Anuj Upadhyay
Source: Company, Emkay Research
RECOMMENDATION HISTORY CHART
Source: Bloomberg, Company, Emkay Research
70
101
132
163
194
225
03
-Ma
y-1
7
31
-Oct-
17
30
-Apr-
18
28
-Oct-
18
27
-Apr-
19
25
-Oct-
19
23
-Apr-
20
BUY Hold SellAccumulate Reduce PriceTarget Price
Power Grid Corporation RECOMMENDATION HISTORY TABLE
Date Closing
Price TP
Period (months)
Rating Analyst
10-Apr-20 164 220 12m Buy Anuj Upadhyay
27-Feb-20 186 220 12m Buy Anuj Upadhyay
04-Feb-20 194 220 12m Buy Anuj Upadhyay
30-Jan-20 194 229 12m Buy Anuj Upadhyay
29-Jan-20 192 229 12m Buy Anuj Upadhyay
01-Jan-20 196 229 12m Buy Anuj Upadhyay
27-Nov-19 195 229 12m Buy Anuj Upadhyay
12-Nov-19 192 229 12m Buy Anuj Upadhyay
25-Sep-19 199 212 12m Hold Anuj Upadhyay
29-Aug-19 205 212 12m Hold Anuj Upadhyay
02-Aug-19 211 212 12m Hold Anuj Upadhyay
24-Jun-19 199 212 12m Hold Anuj Upadhyay
29-May-19 190 212 12m Hold Anuj Upadhyay
22-Apr-19 195 224 12m Buy Anuj Upadhyay
31-Jan-19 189 224 12m Buy Anuj Upadhyay
18-Jan-19 194 237 12m Buy Anuj Upadhyay
16-Dec-18 186 237 12m Buy Anuj Upadhyay
01-Aug-18 185 237 12m Buy Anuj Upadhyay
03-Jul-18 185 244 12m Accumulate Anuj Upadhyay
30-May-18 210 244 12m Accumulate Anuj Upadhyay
02-May-18 205 254 12m Buy Anuj Upadhyay
01-Mar-18 197 254 12m Buy Anuj Upadhyay
02-Feb-18 193 254 12m Buy Anuj Upadhyay
30-Jan-18 195 251 12m Buy Anuj Upadhyay
01-Jan-18 200 251 12m Buy Anuj Upadhyay
06-Nov-17 211 251 12m Buy Anuj Upadhyay
10-Oct-17 205 251 12m Buy Anuj Upadhyay
02-Aug-17 222 251 12m Buy Anuj Upadhyay
30-May-17 204 241 12m Buy Anuj Upadhyay
Source: Company, Emkay Research
RECOMMENDATION HISTORY CHART
Source: Bloomberg, Company, Emkay Research
140
167
194
221
248
275
03
-Ma
y-1
7
31
-Oct-
17
30
-Apr-
18
28
-Oct-
18
27
-Apr-
19
25
-Oct-
19
23
-Apr-
20
BUY Hold SellAccumulate Reduce PriceTarget Price
Power India Equity Research | Sector Update
Emkay Research is also available on www.emkayglobal.com and Bloomberg EMKAY<GO>. Please refer to the last page of the report on Restrictions on Distribution. In Singapore, this research report or research analyses may only be distributed to Institutional Investors, Expert Investors or Accredited Investors as defined in the Securities and Futures Act, Chapter 289 of Singapore.
May 1, 2020| 14
Emkay Rating Distribution
Ratings Expected Return within the next 12-18 months.
BUY Over 15%
HOLD Between -5% to 15%
SELL Below -5%
Completed Date: 01 May 2020 19:54:03 (SGT) Dissemination Date: 01 May 2020 19:55:03 (SGT)
Sources for all charts and tables are Emkay Research unless otherwise specified.
GENERAL DISCLOSURE/DISCLAIMER BY EMKAY GLOBAL FINANCIAL SERVICES LIMITED (EGFSL): Emkay Global Financial Services Limited (CIN-L67120MH1995PLC084899) and its affiliates are a full-service, brokerage, investment banking, investment management and financing group. Emkay Global Financial Services Limited (EGFSL) along with its affiliates are participants in virtually all securities trading markets in India. EGFSL was established in 1995 and is one of India's leading brokerage and distribution house. EGFSL is a corporate trading member of Bombay Stock Exchange Limited (BSE), National Stock Exchange of India Limited (NSE), MCX Stock Exchange Limited (MCX-SX). EGFSL along with its subsidiaries offers the most comprehensive avenues for investments and is engaged in the businesses including stock broking (Institutional and retail), merchant banking, commodity broking, depository participant, portfolio management, insurance broking and services rendered in connection with distribution of primary market issues and financial products like mutual funds, fixed deposits. Details of associates are available on our website i.e. www.emkayglobal.com EGFSL is registered as Research Analyst with SEBI bearing registration Number INH000000354 as per SEBI (Research Analysts) Regulations, 2014. EGFSL hereby declares that it has not defaulted with any stock exchange nor its activities were suspended by any stock exchange with whom it is registered in last five years, except that NSE had disabled EGFSL from trading on October 05, October 08 and October 09, 2012 for a manifest error resulting into a bonafide erroneous trade on October 05, 2012. However, SEBI and Stock Exchanges have conducted the routine inspection and based on their observations have issued advice letters or levied minor penalty on EGFSL for certain operational deviations in ordinary/routine course of business. EGFSL has not been debarred from doing business by any Stock Exchange / SEBI or any other authorities; nor has its certificate of registration been cancelled by SEBI at any point of time. EGFSL offers research services to clients as well as prospects. The analyst for this report certifies that all of the views expressed in this report accurately reflect his or her personal views about the subject company or companies and its or their securities, and no part of his or her compensation was, is or will be, directly or indirectly related to specific recommendations or views expressed in this report. Other disclosures by Emkay Global Financial Services Limited (Research Entity) and its Research Analyst under SEBI (Research Analyst) Regulations, 2014 with reference to the subject company(s) covered in this report EGFSL and/or its affiliates may seek investment banking or other business from the company or companies that are the subject of this material. Our salespeople, traders, and other professionals may provide oral or written market commentary or trading strategies to our clients that reflect opinions that are contrary to the opinions expressed herein, and our proprietary trading and investing businesses may make investment decisions that may be inconsistent with the recommendations expressed herein. In reviewing these materials, you should be aware that any or all of the foregoing, among other things, may give rise to real or potential conflicts of interest including but not limited to those stated herein. Additionally, other important information regarding our relationships with the company or companies that are the subject of this material is provided herein. This report is not directed to, or intended for distribution to or use by, any person or entity who is a citizen or resident of or located in any locality, state, country or other jurisdiction where such distribution, publication, availability or use would be contrary to law or regulation or which would subject EGFSL or its group companies to any registration or licensing requirement within such jurisdiction. Specifically, this document does not constitute an offer to or solicitation to any U.S. person for the purchase or sale of any financial instrument or as an official confirmation of any transaction to any U.S. person. Unless otherwise stated, this message should not be construed as official confirmation of any transaction. No part of this document may be used by private customers in United Kingdom. All material presented in this report, unless specifically indicated otherwise, is under copyright to Emkay. None of the material, nor its content, nor any copy of it, may be altered in any way, transmitted to, copied or distributed to any other party, without the prior express written permission of EGFSL . All trademarks, service marks and logos used in this report are trademarks or registered trademarks of EGFSL or its Group Companies. The information contained herein is not intended for publication or distribution or circulation in any manner whatsoever and any unauthorized reading, dissemination, distribution or copying of this communication is prohibited unless otherwise expressly authorized. Please ensure that you have read “Risk Disclosure Document for Capital Market and Derivatives Segments” as prescribed by Securities and Exchange Board of India before investing in Indian Securities Market. In so far as this report includes current or historic information, it is believed to be reliable, although its accuracy and completeness cannot be guaranteed.
This publication has not been reviewed or authorized by any regulatory authority. There is no planned schedule or frequency for updating research publication relating to any issuer.
Please contact the primary analyst for valuation methodologies and assumptions associated with the covered companies or price targets Disclaimer for U.S. persons only: This research report is a product of Emkay Global Financial Services Limited (Emkay), which is the employer of the research analyst(s) who has prepared the research report. The research analyst(s) preparing the research report is/are resident outside the United States (U.S.) and are not associated persons of any U.S. regulated broker-dealer and therefore the analyst(s) is/are not subject to supervision by a U.S. broker-dealer, and is/are not required to satisfy the regulatory licensing requirements of Financial Institutions Regulatory Authority (FINRA) or required to otherwise comply with U.S. rules or regulations regarding, among other things, communications with a subject company, public appearances and trading securities held by a research analyst account. This report is intended for distribution to "Major Institutional Investors" as defined by Rule 15a-6(b)(4) of the U.S. Securities and Exchange Act, 1934 (the Exchange Act) and interpretations thereof by U.S. Securities and Exchange Commission (SEC) in reliance on Rule 15a 6(a)(2). If the recipient of this report is not a Major Institutional Investor as specified above, then it should not act upon this report and return the same to the sender. Further, this report may not be copied, duplicated and/or transmitted onward to any U.S. person, which is not the Major Institutional Investor. In reliance on the exemption from registration provided by Rule 15a-6 of the Exchange Act and interpretations thereof by the SEC in order to conduct certain business with Major Institutional Investors.
Power India Equity Research | Sector Update
Emkay Research is also available on www.emkayglobal.com and Bloomberg EMKAY<GO>. Please refer to the last page of the report on Restrictions on Distribution. In Singapore, this research report or research analyses may only be distributed to Institutional Investors, Expert Investors or Accredited Investors as defined in the Securities and Futures Act, Chapter 289 of Singapore.
May 1, 2020| 15
ANALYST CERTIFICATION BY EMKAY GLOBAL FINANCIAL SERVICES LIMITED (EGFSL) The research analyst(s) primarily responsible for the content of this research report, in part or in whole, certifies that the views about the companies and their securities expressed in this report accurately reflect his/her personal views. The analyst(s) also certifies that no part of his/her compensation was, is, or will be, directly or indirectly, related to specific recommendations or views expressed in the report. The research analyst (s) primarily responsible of the content of this research report, in part or in whole, certifies that he or his associate1 does not serve as an officer, director or employee of the issuer or the new listing applicant (which includes in the case of a real estate investment trust, an officer of the management company of the real estate investment trust; and in the case of any other entity, an officer or its equivalent counterparty of the entity who is responsible for the management of the issuer or the new listing applicant). The research analyst(s) primarily responsible for the content of this research report or his associate does not have financial interests2 in relation to an issuer or a new listing applicant that the analyst reviews. EGFSL has procedures in place to eliminate, avoid and manage any potential conflicts of interests that may arise in connection with the production of research reports. The research analyst(s) responsible for this report operates as part of a separate and independent team to the investment banking function of the EGFSL and procedures are in place to ensure that confidential information held by either the research or investment banking function is handled appropriately. There is no direct link of EGFSL compensation to any specific investment banking function of the EGFSL. 1 An associate is defined as (i) the spouse, or any minor child (natural or adopted) or minor step-child, of the analyst; (ii) the trustee of a trust of which the analyst, his spouse, minor child (natural or adopted) or minor step-child, is a beneficiary or discretionary object; or (iii) another person accustomed or obliged to act in accordance with the directions or instructions of the analyst. 2 Financial interest is defined as interest that are commonly known financial interest, such as investment in the securities in respect of an issuer or a new listing applicant, or financial accommodation arrangement between the issuer or the new listing applicant and the firm or analysis. This term does not include commercial lending conducted at the arm’s length, or investments in any collective investment scheme other than an issuer or new listing applicant notwithstanding the fact that the scheme has investments in securities in respect of an issuer or a new listing applicant.
COMPANY-SPECIFIC / REGULATORY DISCLOSURES BY EMKAY GLOBAL FINANCIAL SERVICES LIMITED (EGFSL):
Disclosures by Emkay Global Financial Services Limited (Research Entity) and its Research Analyst under SEBI (Research Analyst) Regulations, 2014 with reference to the subject company(s) covered in this report-: 1. EGFSL, its subsidiaries and/or other affiliates do not have a proprietary position in the securities recommended in this report as of May 1, 2020 2. EGFSL, and/or Research Analyst does not market make in equity securities of the issuer(s) or company(ies) mentioned in this Research Report Disclosure of previous investment recommendation produced: 3. EGFSL may have published other investment recommendations in respect of the same securities / instruments recommended in this research
report during the preceding 12 months. Please contact the primary analyst listed in the first page of this report to view previous investment recommendations published by EGFSL in the preceding 12 months.
4. EGFSL , its subsidiaries and/or other affiliates and Research Analyst or his/her relative’s does not have any material conflict of interest in the securities recommended in this report as of May 1, 2020.
5. EGFSL, its subsidiaries and/or other affiliates and Research Analyst or his/her relative’s does not have actual/beneficial ownership of 1% or more securities of the subject company at the end of the month immediately preceding the May 1, 2020
6. EGFSL, its subsidiaries and/or other affiliates and Research Analyst have not received any compensation in whatever form including compensation for investment banking or merchant banking or brokerage services or for products or services other than investment banking or merchant banking or brokerage services from securities recommended in this report (subject company) in the past 12 months.
7. EGFSL, its subsidiaries and/or other affiliates and/or and Research Analyst have not received any compensation or other benefits from securities recommended in this report (subject company) or third party in connection with the research report.
8. Securities recommended in this report (Subject Company) has not been client of EGFSL, its subsidiaries and/or other affiliates and/or and Research Analyst during twelve months preceding the May 1, 2020
Power India Equity Research | Sector Update
Emkay Research is also available on www.emkayglobal.com and Bloomberg EMKAY<GO>. Please refer to the last page of the report on Restrictions on Distribution. In Singapore, this research report or research analyses may only be distributed to Institutional Investors, Expert Investors or Accredited Investors as defined in the Securities and Futures Act, Chapter 289 of Singapore.
May 1, 2020| 16
RESTRICTIONS ON DISTRIBUTION
General This report is not directed to, or intended for distribution to or use by, any person or entity who is a citizen or resident of or located in any locality, state, country or other jurisdiction where such distribution, publication, availability or use would be contrary to law or regulation.
Australia This report is not for distribution into Australia.
Hong Kong This report is not for distribution into Hong Kong.
Indonesia This report is being distributed in Indonesia by PT DBS Vickers Sekuritas Indonesia.
Malaysia This report is not for distribution into Malaysia.
Singapore
This report is distributed in Singapore by DBS Bank Ltd (Company Regn. No. 16800306E) or DBSVS (Company Regn. No. 1860024G) both of which are Exempt Financial Advisers as defined in the Financial Advisers Act and regulated by the Monetary Authority of Singapore. DBS Bank Ltd and/or DBSVS, may distribute reports produced by its respective foreign entities, affiliates or other foreign research houses pursuant to an agreement under Regulation 32C of the financial Advisers Regulations. Singapore recipients should contact DBS Bank Ltd at 6327 2288 for matters arising from, or in connection with the report.
Thailand This report is being distributed in Thailand by DBS Vickers Securities (Thailand) Co Ltd.
United Kingdom
This report is disseminated in the United Kingdom by DBS Vickers Securities (UK) Ltd, ("DBSVUK"). DBSVUK is authorised and regulated by the Financial Conduct Authority in the United Kingdom.
In respect of the United Kingdom, this report is solely intended for the clients of DBSVUK, its respective connected and associated corporations and affiliates only and no part of this document may be (i) copied, photocopied or duplicated in any form or by any means or (ii) redistributed without the prior written consent of DBSVUK. This communication is directed at persons having professional experience in matters relating to investments. Any investment activity following from this communication will only be engaged in with such persons. Persons who do not have professional experience in matters relating to investments should not rely on this communication.
Dubai International Financial Centre
This research report is being distributed by DBS Bank Ltd., (DIFC Branch) having its office at units 608-610, 6th Floor, Gate Precinct Building 5, PO Box 506538, Dubai International Financial Centre (DIFC), Dubai, United Arab Emirates. DBS Bank Ltd., (DIFC Branch) is regulated by The Dubai Financial Services Authority. This research report is intended only for professional clients (as defined in the DFSA rulebook) and no other person may act upon it.
United Arab Emirates
This report is provided by DBS Bank Ltd (Company Regn. No. 196800306E) which is an Exempt Financial Adviser as defined in the Financial Advisers Act and regulated by the Monetary Authority of Singapore. This report is for information purposes only and should not be relied upon or acted on by the recipient or considered as a solicitation or inducement to buy or sell any financial product. It does not constitute a personal recommendation or take into account the particular investment objectives, financial situation, or needs of individual clients. You should contact your relationship manager or investment adviser if you need advice on the merits of buying, selling or holding a particular investment. You should note that the information in this report may be out of date and it is not represented or warranted to be accurate, timely or complete. This report or any portion thereof may not be reprinted, sold or redistributed without our written consent.
United States
DBSVUSA did not participate in its preparation. The research analyst(s) named on this report are not registered as research analysts with FINRA and are not associated persons of DBSVUSA. The research analyst(s) are not subject to FINRA Rule 2241 restrictions on analyst compensation, communications with a subject company, public appearances and trading securities held by a research analyst. This report is being distributed in the United States by DBSVUSA, which accepts responsibility for its contents. This report may only be distributed to Major U.S. Institutional Investors (as defined in SEC Rule 15a-6) and to such other institutional investors and qualified persons as DBSVUSA may authorize. Any U.S. person receiving this report who wishes to effect transactions in any securities referred to herein should contact DBSVUSA directly and not its affiliate.
Other jurisdictions In any other jurisdictions, except if otherwise restricted by laws or regulations, this report is intended only for qualified, professional, institutional or sophisticated investors as defined in the laws and regulations of such jurisdictions.
Emkay Global Financial Services Ltd.
CIN - L67120MH1995PLC084899
7th Floor, The Ruby, Senapati Bapat Marg, Dadar - West, Mumbai - 400028. India
Tel: +91 22 66121212 Fax: +91 22 66121299 Web: www.emkayglobal.com