Retail sector update - redefine.co.za
30
Retail sector update Virtual vs brick and mortar: The post-pandemic retail landscape 29 September 2021 REDEFINE PROPERTIES LIMITED
Transcript of Retail sector update - redefine.co.za

Retail sector update
Virtual vs brick and mortar: The post-pandemic retail landscape
29 September 2021
REDEFINE PROPERTIES LIMITED
Retail overview
Conclusion
Supplementary information
Our conversation
1

Nashil Chotoki, national retail asset manager
Retail overview
2

SA retail market
3

4
National card purchase trend volumes – Jan 2019 to Aug 2021Nedbank merchant point-of-sale device data used as the base for analysis
In-store card purchases§ Total in-store card purchase volumes have
decreased by 7% in 2020 compared to 2019§ If you compare 2021 year to date in-store
volumes to the last eight months of 2020, there was an 8% growth in volumes
§ This shows that the COVID-19 lockdown did impact people's spending patterns. Current volumes, however, indicate a return to pre-COVID-19 levels
Digital card purchases§ Total digital card purchase volumes have
increased by 80% in 2020 compared to 2019§ If you compare 2021 year-to-date digital
volumes to the last 8 months of 2020, there was a 17% growth in volumes
§ This shows that although people are moving towards more digital sales, digital card purchases still only make up 12% of total card purchase volumes
Source: Nedbank

§ Trading density exceeds pre-COVID levels
§ Quick recovery after lockdown levels
5
MSCI annualised trading density growthTrading density up 7.6% year on year to June 2021

§ Super regional centres most impacted by COVID-19
§ Convenience retail recovers quickly
6
MSCI trading density growth per segmentCommunity centres the only segment to grow trading density above pre-COVID levels

§ Foot count remained below pre-COVID levels in Q2, 2021
§ Foot traffic is influenced by office usage and lockdown restriction on entertainment
7
MSCI trading density growthPredominantly driven by increased spend per visit

§ Restructuring of leases and COVID-19 rental relief reduces retailers’ cost of occupancy
8
MSCI cost of occupancyDriven by sales rebound, gross rental growth still trending down

§ Negative rental reversions driven by large format centres
9
MSCI rental reversionsStill in play until occupational demand increases
-0.8%
-0.3%
3.9%
1.5%
-0.2%
-2.1%-4,0%
-2,0%
0,0%
2,0%
4,0%
6,0%
8,0%
10,0%
12,0%
Dec-18
Mar-19
Jun-1
9
Sep-19
Dec-19
Mar-20
Jun-2
0
Sep-20
Dec-20
Mar-21
Jun-2
1
Annual gross rental growth percentage
Regional Small Regional Neighbourhood Community Super Reg
R372.66
R250.07
R217.74
R194.72
R193.58
Super Reg
Regional
Small Regional
Community
Neighbourhood
Gross rental in June 2021
Source: MSCI Real Estate

§ Increase in vacancy driven by large format centres
10
MSCI vacancy performanceVacancy increased by 300bps since December 2019

% change in tenant mix by retail category
Super regional Regional Small regional Community
Apparel
Electronics
Food service
Entertainment
Food
Accessories, jewellery and watches
Luggage
Health and beauty
Services
Eyewear and optometristsSportswear and outdoor
Speciality
Department storesBooks/cards/stationeryHomeware, furniture and interior
-0,3
0
0
-0,4
-0,3
0
0
0
0
-0,2
-0,7
0,2
-0,3
0
0
-0,1
-0,1
-1
-0,1
-0,2
0
0
0
-0,1
-0,1
0,6
-0,4
0,1
-0,6
-1,1
0,4
0,2
0,1
0,1
0,1
0
0
0
-0,1
-0,1
-0,2
-0,2
-0,4
-1
-1,6
0,9
0
-2,8
0
-0,1
0
0
0,4
0
0
1
0,1
-0,1
0,3
-0,1
MSCI COVID-19 impact on tenant mix
Larger malls have less apparel than pre-COVID-19(smaller stores and vacancy)
Higher weighting in homeware, books, department stores
Incl Edgars impact
Pressure on vacancy and affordability caused shifts
§ Retailers focus on right sizing
11

§ Green shoots for recovery of large format centres
§ Quick recovery from third wave lockdown restrictions
12
MSCI trading density performanceSuper regional centres – sharpest Q2, 2021 rebound

Our retail portfolio
13

Our retail portfolio snapshotDiversified retail portfolio proven to be defensive despite volatility
14
39%
33%
15%
6%7%
Type by value
38%
32%
10%
9%
11% Type by GLA
39%
33%
13%
7%
8% Type by GMR
Community/Small regionalRegionalSuper regional
OtherNeighbourhood
Number of properties70
Carrying valueR24.3 billion (FY20 | R25.7bn)
GLA 1.3 million m² (FY20 | 1.4 million m²)
Average gross rent per m²R173.7
Weighted averageretention rate by GLA95.7%
Active vacancy5.5%
Trading density -7.4% (HY20 | 3.6%)
Weighted average in force lease escalations by GMR6.4%
Weighted average unexpired lease term (remaining) by GMR 2.9 years
Figures as at 28 February 2021
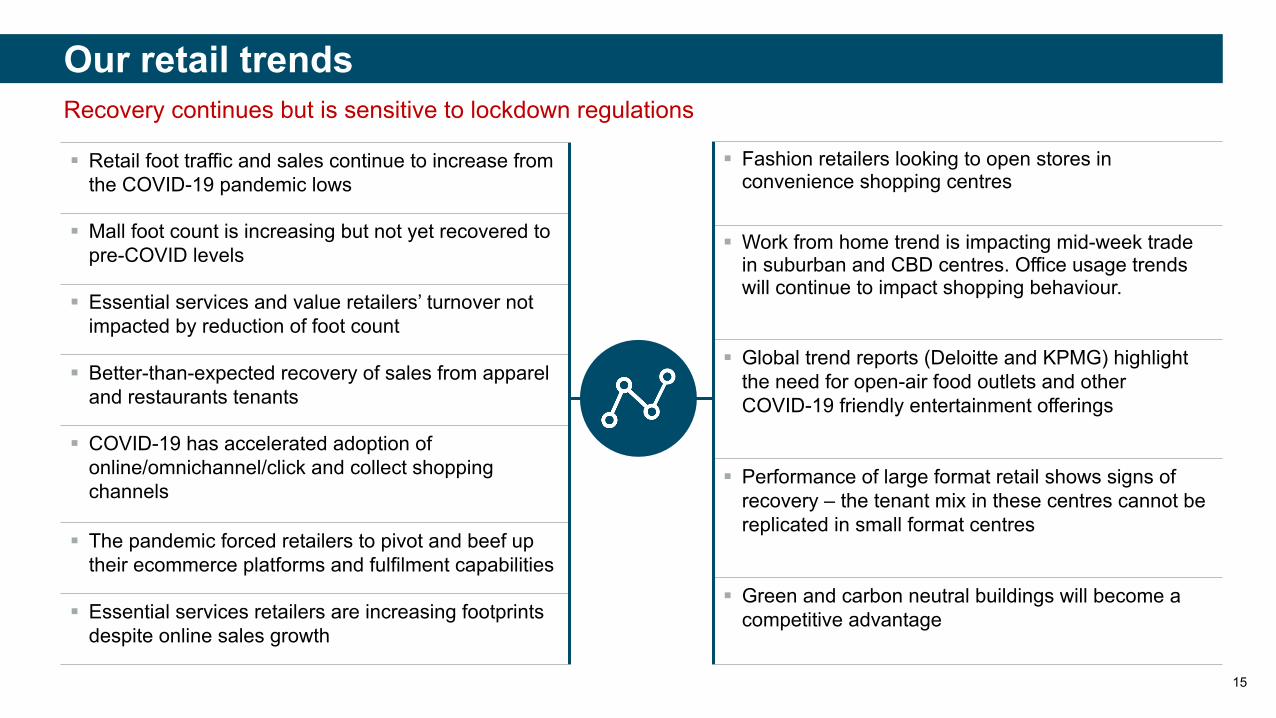
§ Retail foot traffic and sales continue to increase from the COVID-19 pandemic lows
§ Mall foot count is increasing but not yet recovered to pre-COVID levels
§ Essential services and value retailers’ turnover not impacted by reduction of foot count
§ Better-than-expected recovery of sales from apparel and restaurants tenants
§ COVID-19 has accelerated adoption of online/omnichannel/click and collect shopping channels
§ The pandemic forced retailers to pivot and beef up their ecommerce platforms and fulfilment capabilities
§ Essential services retailers are increasing footprints despite online sales growth
15
Our retail trendsRecovery continues but is sensitive to lockdown regulations
§ Fashion retailers looking to open stores in convenience shopping centres
§ Work from home trend is impacting mid-week trade in suburban and CBD centres. Office usage trends will continue to impact shopping behaviour.
§ Global trend reports (Deloitte and KPMG) highlight the need for open-air food outlets and other COVID-19 friendly entertainment offerings
§ Performance of large format retail shows signs of recovery – the tenant mix in these centres cannot be replicated in small format centres
§ Green and carbon neutral buildings will become a competitive advantage

We believe physical shopping centres will continue to be the mainstay of shopping activity, but online must be part of the offering to consumers.
Online opportunities
Objectives§ Compliment
convenience through online channels – the ability to shop multiple stores on a single platform
§ Give independent retailers an online presence
The plan§ Work with Quench, who
is launching an online platform called Pocketmall
§ Quench already has a track record in providing online shopping forvarious nationals, restaurants and takeaways
Why Quench§ No monthly costs, no risk, no
subscription fees
§ National fleet of drivers executing on-demand orders
§ Shopping centre owners can track sales and turnover performance
§ Critical mass with other landlords participating
Next steps§ Pilot to be
launched at Kyalami Corner,first week of December 2021
§ If pilot successful; roll-out to be carried out to other centres in our portfolio
16
Online is growing at an unprecedent pace, however, makes up only 2.8% of total retail sales in SA
Our online strategy

Turnover for 12 months to July 21 vs July 19:§ Essential services – 115%
§ Apparel – 101%
§ Hard hit categories – 92%
§ Hardware and homeware – 145% however, starting to taper off
§ Sit-down restaurants (10% of GMR) – 95%
§ Takeaways/fast food – 126%
§ Consumers prefer convenience centres for essential services
17
Our retail turnover performance by tenant type Turnover recovery driven by essential services
0%
20%
40%
60%
80%
100%
120%
140%
160%
180%
200%
Aug-19
Sep-19
Oct-19
Nov-19
Dec-19
Jan-20
Feb-20
Mar-20
Apr-20
May-20
Jun-20
Jul-20
Aug-20
Sep-20
Oct-20
Nov-20
Dec-20
Jan-21
Feb-21
Mar-21
Apr-21
May-21
Jun-21
Jul-21
Turnover recovery per tenant type vs Aug 19
Total Turnover Essential Services Apparel Hard-hit Category
Lockdown level 5Christmas trade
41% of total turnover and 15% of GMR
29% of total turnover and 30% of GMR
4% of total turnover and 9% of GMR

§ Foot count is still below pre-COVID levels due to change in consumer behaviour and lockdown restrictions
§ Turnover recovered to pre-COVID levels driven by essential services
§ Foot count recovery better in CPT at 87%, mainly due to Kenilworth Centre, and Gauteng at 81% of pre-COVID levels
§ Turnover recovery better in Gauteng at 112%, due to our concentration of convenience centers in Gauteng, than CPT at 105% of pre-COVID levels
18
Our retail turnover and foot count Foot count still lagging, but turnover is recovering to pre-COVID levels
0%
20%
40%
60%
80%
100%
120%
140%
160%
180%
Aug-19
Sep-19
Oct-19
Nov-19
Dec-19
Jan-20
Feb-20
Mar-20
Apr-20
May-20
Jun-20
Jul-20
Aug-20
Sep-20
Oct-20
Nov-20
Dec-20
Jan-21
Feb-21
Mar-21
Apr-21
May-21
Jun-21
Jul-21
Recovery trend – turnover and foot count vs Aug 19
Convenience Centre Turnovers Large Format Centres Turnovers
Large Format Footcounts Convenience Shopping Centre Footcounts
Lockdown level 5Christmas trade
0%
0%
0%
0%
0%
0%
0%
Sep-19
Oct-19
Nov-19
Dec-19
Jan-2
0
Feb-20
Mar-20
Apr-20
May-20
Jun-2
0Ju
l-20
Aug-20
Sep-20
Oct-20
Nov-20
Dec-20
Jan-2
1
Feb-21
Mar-21
Apr-21
May-21
Jun-2
1Ju
l-21
Aug-21
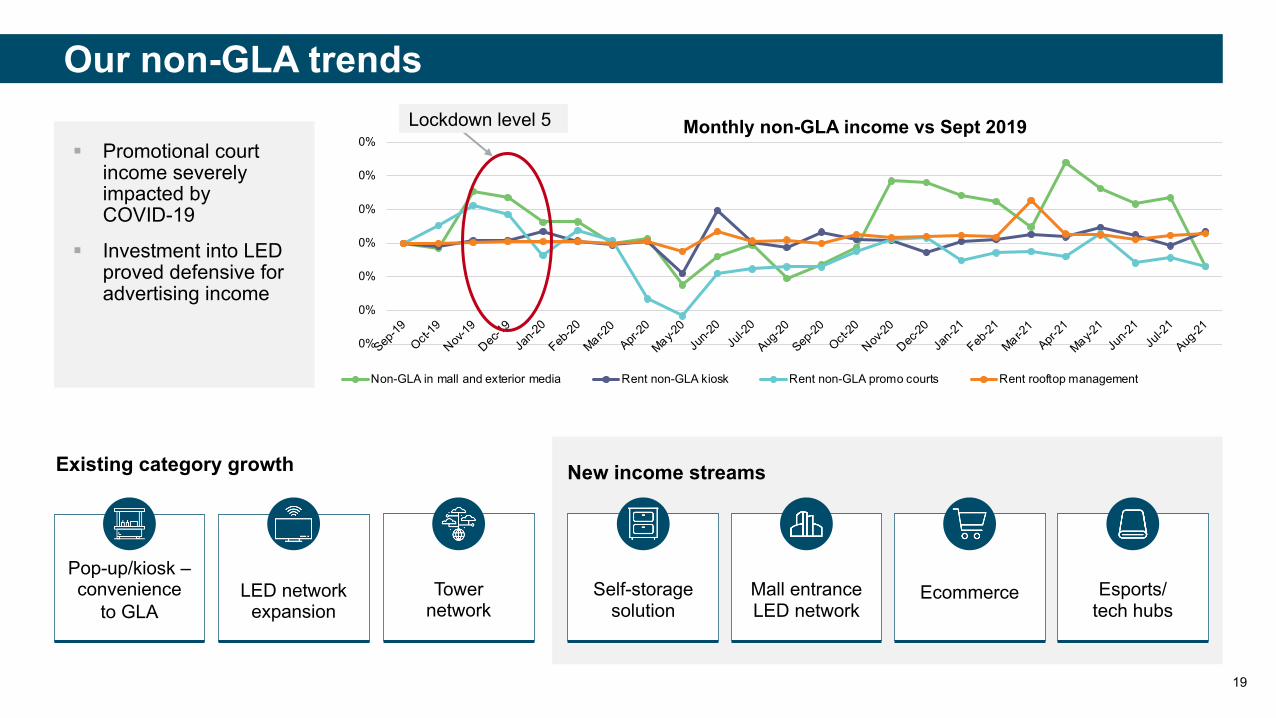
Monthly non-GLA income vs Sept 2019
Non-GLA in mall and exterior media Rent non-GLA kiosk Rent non-GLA promo courts Rent rooftop management
19
Our non-GLA trendsLockdown level 5
Existing category growth New income streams
Pop-up/kiosk –convenience
to GLALED network
expansionTower
networkMall entrance LED network
Self-storage solution
Ecommerce Esports/tech hubs
§ Promotional court income severely impacted by COVID-19
§ Investment into LED proved defensive for advertising income
20
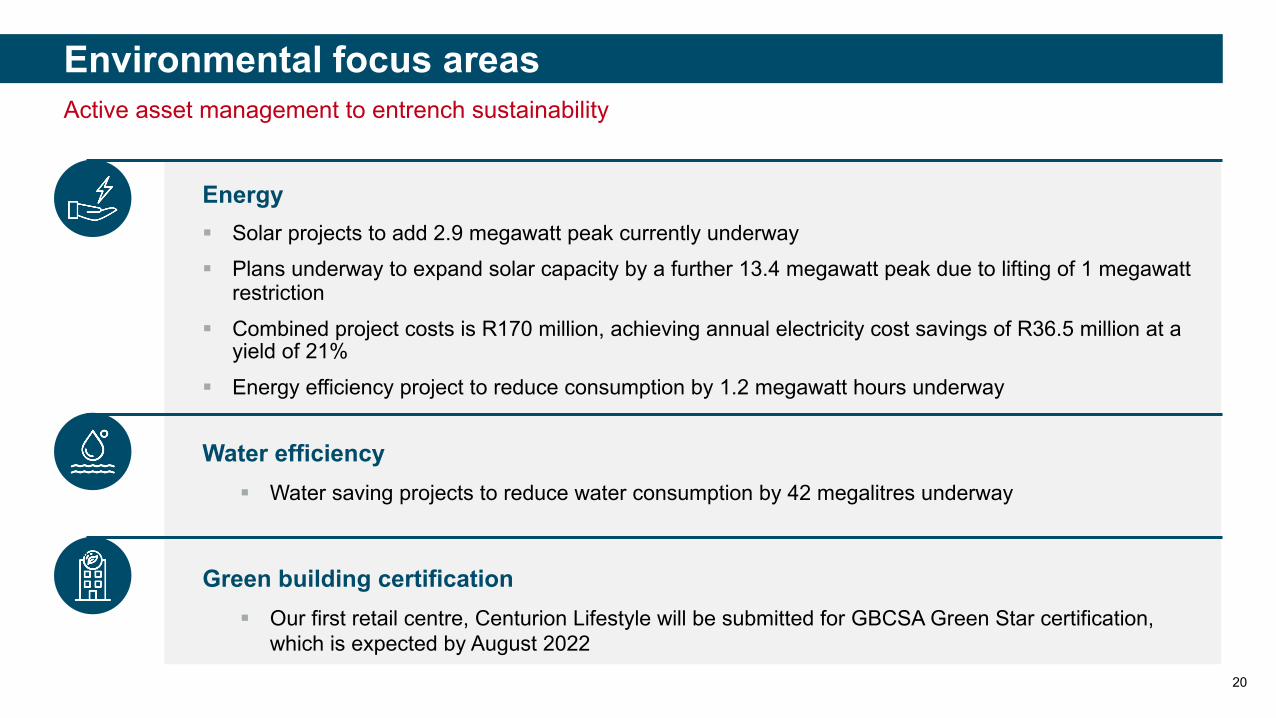
Environmental focus areasActive asset management to entrench sustainability
Energy§ Solar projects to add 2.9 megawatt peak currently underway § Plans underway to expand solar capacity by a further 13.4 megawatt peak due to lifting of 1 megawatt
restriction§ Combined project costs is R170 million, achieving annual electricity cost savings of R36.5 million at a
yield of 21%§ Energy efficiency project to reduce consumption by 1.2 megawatt hours underway
Water efficiency § Water saving projects to reduce water consumption by 42 megalitres underway
Green building certification§ Our first retail centre, Centurion Lifestyle will be submitted for GBCSA Green Star certification,
which is expected by August 2022

Property GLA HY21 value Number of tenants Extent of damage
Chris Hani Crossing (100%)*
41 526 R1 085.2m 107
§ The entire mall was looted with various degrees of damage involved§ 3 971m2 of GLA (10%) extensively damaged by fire, which is expected to trade early 2022§ 56% of the mall by GLA is currently trading, was expected to be 90% – delays in tenant fitout§ 0.2% of the tenants by GLA have vacated§ The rebuilding programme has commenced, and community-based entities are part of the reconstruction§ Final costs for the replacement of damaged shopfronts are currently being quantified.
The Mall @ Scottsville
14 425 R207.9m 45
§ Nine tenants occupying 3 300m2 (23% of GLA) were looted and shops damaged§ Damage was limited to shopfronts, fixture and fittings§ Food Lovers storeroom was looted and R2.4m worth of stock lost§ Replacement of damaged shopfronts finalised at a cost of R180 000§ All tenants resumed trade by 31 August 2021
320 West Street Durban
10 745 R111.3m 49
§ Eight tenants occupying 3 631m2 (34% of retail GLA) with street-facing entrances were looted and shops damaged
§ Shopfront replacement and other repairs completed at a cost of R45 000§ All tenants resumed trade by 31 August 2021
Isipingo Junction
5 398 R74.5m 12
§ The entire mall was looted with various degrees of damage involved§ Extensive damage to shopfronts, roller shutter doors, tenant commercial equipment (including ovens),
common area facilities and DB rooms.§ Shopfront replacement and other repairs completed at a cost of R390 000§ All tenants resumed trade by 31 August 2021
21
Damage to retail assets due to civil unrestFull recovery expected by end February 2022

22
Conclusion
§ Leasing market will remain very competitive
§ We will continue to be flexible in lease negotiations to ensure tenant retention and sustainability
§ As markets gradually ease mobility restrictions and more consumers are vaccinated, retail will continue to rebound, and consumers will return
§ Fewer shoppers visiting malls in 2020 but spending more per visit, driving growth in sales
§ We will continue to recalibrate the tenant mix and increase exposure to essential services
§ Embrace omnichannel opportunities to become more client centric and position as complimentary to physical retail
§ Having a diversified retail portfolio cushions against volatile consumer behaviour
§ Environmental considerations are becoming more important, and retailers and shopping centresmust reflect this in their brand identities
Recovery continues as vaccination roll-out gains momentum

Supplementary information
23

24
Centurion Mall
Asset type Super regional shopping centreLocation Tshwane, GautengRetail GLA 118 972m²Office GLA 13 220m²Total GLA 132 193m²Property valuation R3.4 billionOccupancy 95%Development cost R1.06 billionNumber of tenants 271Anchor tenants Woolworths, Game, Pick n Pay, Dis-Chem, CheckersAverage monthly footfall 800 000Annual turnover R2.77 billionAnnual mall trading density R30 919Annual spend per head R3 161Parking 5 830 bays
§ Redeveloped over three phases
§ Repositioning upper level for convenience anchored by Shoprite currently under way

25
Centurion Lifestyle Centre
Asset type Regional shopping centreLocation Tshwane, GautengGLA 61 520m²Property valuation R943 millionOccupancy 97.2%Number of tenants 81
Anchor tenants Pick n Pay, Mr Price Home, Checkers, Virgin Active, Decathlon, Builders Warehouse
Annual turnover R1.02 billionAnnual mall trading density R25 485Parking 1 597 bays
§ Redevelopment of Checkers was completed in August 2021 to enhance convenience by opening the mall into the parking area and reconfiguring vehicle traffic flow directly to the new Checkers entrance

26
Kyalami Corner
Asset type Small regional shopping centreLocation Kyalami, JohannesburgGLA 27 764m²Property valuation R715 millionOccupancy 96.77%Number of tenants 81Anchor tenants Checkers, Clicks, Dis-Chem, Virgin Active, WoolworthsAverage monthly footfall 413 000Annual turnover R847 millionAnnual mall trading density R43 403Annual spend per head R2 052Parking 1 264 bays
§ Completed reconfiguration of tenant mix to accommodate Dis-Chem and strengthened fashion
§ Effective vacancy of 4.64% (incl. future let)

27
Mall of the South
Asset type Regional shopping centreLocation Johannesburg, GautengGLA 73 000m²Property valuation R1.63 billionOccupancy 96.0%
Audience § Primary catchment area: Aspen Hills§ LSM 7-10
Number of tenants 145Major anchor tenants Checkers, Dis-Chem, Game, Pick n Pay, WoolworthsAverage monthly footfall 570 000Annual turnover R1.87 billionAnnual mall trading density R31 380Annual spend per head R3 290Parking 4 325 bays
§ Ownership is split 80% Rand Merchant Bank Group and 20% Redefine§ Redefine managing property from 1 December 2020§ Key achievements:
▫ Unlocking additional income streams through investing R2.6 million in digital screens, yielding 22%
▫ 99% tenant retention by GMR▫ No reversions on renewals▫ Approved 4.5 MW solar PV plant costing R39 million, yielding 28%

28
Kwena Square | New development
Asset type Neighbourhood convenience centre Location Little Falls – Wilgeheuwel, on Hendrik Potgieter Rd, RoodepoortGLA 10 004m²Property valuation Projected valuation of R210 177 000Development budget R210 177 000Yield 9.84%
Audience
§ Total market potential of 50 000 people§ Primary catchment: Little Falls, Wilgespruit, Wilro Park,
Heldekruin, Strubbens Valley, Ruimsig§ LSM 7-10
Number of tenants 23Major anchor tenants Checkers, Checkers Liquor, RocoMamas Drive-ThruProject start date 11 January 2021Project end date 19 May 2021Parking bays 407 bays provided – parking ratio of 4.6 per 100m²
§ Opening 1 July 2022
§ 40% of the electricity for the centre will be generated through solar panels
§ 60% of GLA pre let

Redefine Properties (or co-owners names or project name) supports adherence and compliance with all COVID-19 health protocols, including the wearing of masks, sanitising of hands, and social distancing practices. Should, in any example of our marketing/advertising material, a model/actor/actress be depicted without a mask, this should be considered in light of the fact that the model/actor/actress is simply portraying a scenario which may not necessarily be during a state of lockdown, and that Redefine’s support of, and adherence to, all COVID-19 health protocols remains.
For more information contact [email protected]