Technology sector update
76
Scott Colvin, Managing Director [email protected] PRIVATE & CONFIDENTIAL – NOT FOR DISTRIBUTION June Quarter 2021 Technology sector update
Transcript of Technology sector update

Scott Colvin, Managing Director
PRIVATE & CONFIDENTIAL – NOT FOR DISTRIBUTION
June Quarter 2021
Technology sector update

PRIVATE & CONFIDENTIAL | 1
Blackpeak is a leading independent investment banking & advisory firm
▪ We are an independent corporate advisory firm based in Sydney providing corporate finance and strategic advice on mergers &
acquisitions, strategy and capital raisings
▪ We strive to be our client's trusted adviser and confidant and are focused on building long term relationships with clients to assist
them achieve their growth ambitions and maximise value
▪ Blackpeak is the most active independent adviser to technology growth companies in ANZ, completing ~40 technology
transactions in the last 6 years
Mergers & acquisitions
▪ Strategic and financial evaluation
▪ Execution of private and public market
transactions including takeover
defence
▪ Designing optimal sale processes to
create competitive tension to maximise
value
▪ Negotiating and structuring complex
transactions
Strategic advice
▪ Evaluate all options to maximise
shareholder value
▪ Identify & evaluate acquisition targets
▪ Portfolio review to consider value
impacts of potential divestments
▪ Balance sheet & capital structure
advice
▪ Capital management options including
dividend policy and other initiatives
Capital raising advisory
▪ Private capital raising including pre-
IPO financing
▪ Advice on IPOs and secondary equity
capital raisings including both initial
planning, structuring and execution
▪ Debt and hybrid raisings

PRIVATE & CONFIDENTIAL | 2
AGC strategic alliance: leading local coverage + global distribution AGC Partners
▪ Leading tech investment bank: AGC is ranked as the most
active boutique bank dedicated to tech, having completed more
than 400 M&A and growth equity transactions since inception in
2003. More than 50 professionals, including 20 partners, with
offices in Boston (HQ), Silicon Valley, New York, Chicago, Dallas,
Los Angeles, Minneapolis, Austin, Atlanta and London
▪ Strong connectivity with buyers/ investors: relationships with
over 1,000 technology investors and strategic buyers across
North America, Europe, and Asia
▪ Domain knowledge: Experience and in-depth domain knowledge
across all key technology sub-sectors including Application
Software, Cybersecurity, Defence Technology, Digital Media /
Internet, Energy & Industrial Tech, FinTech, Healthcare IT & Life
Sciences, Infrastructure / Cloud, Internet of Things, Mobility
Solutions, Semiconductors and Tech-Enabled Services
▪ Industry conferences: AGC runs industry conferences in Boston,
San Francisco, London and Las Vegas, providing one-on-one
meetings with strategic tech acquirers, investors, and emerging
growth companies
Benefits for Blackpeak’s clients
▪ Alliance will uniquely position Blackpeak to provide global
technology investment banking capabilities, combined with leading
local coverage, service and support to technology growth
companies in ANZ that are institutional size and quality
▪ Alliance enhances Blackpeak’s access to strategic acquirers and
investors in US and Europe as well as proprietary market
intelligence and industry content (particularly relevant in the
context of running sell side M&A or capital raising processes)
Blackpeak and AGC’s Global Reach
Leading local coverage to service ANZ tech Co’s
Extensive experience in tech financing + M&A
Global investor/ buyer connectivity (APAC, USA, EU)
NZ
access
Asia
access
Blackpeak offices
AGC offices
Los Angeles
Silicon Valley
MinneapolisChicago
Sydney
AtlantaNew York
Boston
London
Austin Dallas
Melbourne

PRIVATE & CONFIDENTIAL | 3
Blackpeak service offerings
PRIVATE CAPITALPRE-IPO CAPITAL
Experienced in advising
companies with the final round
of private fundraising before an
IPO by considering investor
suitability and structuring
alternatives
PRIVATE M&A ADVISORY
IPO and ECM ADVISORY
Assisting companies and
founders find the right partner
for growth and/or selldown
Extensive experience in
management and execution of
IPO’s and equity capital
markets transactions with
significant shareholder value
realised by our clients
With a focus on sell-side M&A,
Blackpeak has a track record of
achieving outstanding
outcomes for our clients.
Extensive public markets M&A
experience and capability sets
Blackpeak apart from boutique
competitors
PUBLIC MARKETS M&A

2021
Sale of Elevio to
Dixa
Financial Adviser
PRIVATE & CONFIDENTIAL | 4
Blackpeak is a leading adviser to technology companies in Australia & NZ
2019
Private raising
Financial Adviser
2020
Pre-IPO Raising
A$25m
Financial Adviser
2020
Convertible note
investment into Jaxsta
Financial Adviser
2020
Growth equity
investment A$50m
Financial Adviser
2020
Strategic Review
Financial Adviser
2020
Primary/ Secondary
Raising ~A$14m
Financial Adviser
2020
Private Raising
$A11m
Financial Adviser
2021
Sale of Minority
Interest
Financial Adviser
2021
Growth equity
investment A$45m
Financial Adviser
2021
Rights issue &
convertible note
restructuring
Financial Adviser
2021
Acquisition of Massive
Music
Financial Adviser
2021
Initial Public
Offering A$188m
Financial Adviser

PRIVATE & CONFIDENTIAL | 5
Blackpeak is a leading adviser to technology companies in Australia & NZ

SaaS Software Online
Classifieds
Tech Enabled
Services
Online/
Digital
Tech Hardware
& Equipment
Fintech IT Services
PRIVATE & CONFIDENTIAL | 6
Deep domain expertise in ANZ technology markets
▪ Blackpeak has deep domain expertise across multiple ANZ technology sectors in both the private and public market
▪ We have a deep understanding of listed technology companies and key metrics
▪ We create in-house technology sector reports that contain detailed sector analytics and valuation benchmarking data
▪ Blackpeak offers a differentiated service for clients in the technology sector based on a highly analytical approach and our focus on
understanding the value proposition and key valuation drivers of our clients
158Listed tech companies
covered by Blackpeak’s
research and analytics4
Proprietary technology
sector reports released
every quarter
Proprietary insights and detailed sector analytics
The most comprehensive ANZ technology database
▪ Technology market themes
▪ Private equity and venture capital financing
▪ Private and public market M&A
▪ Technology IPOs
▪ Public comparables
▪ Valuation and performance benchmarking
▪ Technology deal metrics
Dominant technology
sector expertiseExecution excellence

PRIVATE & CONFIDENTIAL | 7
Senior corporate finance professionals
Max Billingham
Executive [email protected]
M +61 417 208 845
Scott Colvin
Managing [email protected]
M +61 416 335 455
Jamie Taylor
M +61 414 922 560
Tom Ng
M +61 490 796 752
▪ Formerly a Managing Director at Credit Suisse
▪ Qualified as a chartered accountant
▪ Global experience, worked in New York and London
▪ INSEAD, MBA
▪ Bachelor of Business, University of Technology Sydney
▪ Prior to founding Blackpeak Capital, Scott held senior
positions with Credit Suisse and Wilson HTM
▪ AGSM UNSW, Executive MBA
▪ London Business School, Masters in Finance
▪ Graduate Diploma, FINSIA
▪ Bachelor of Commerce, UNSW
▪ Previous roles include Head of Australian Institutional
Sales for Merrill Lynch (London-based), and Head of
Corporate Finance For Wilson HTM (Sydney-based)
▪ Bachelor of Economics, Monash University
▪ Formerly a senior FIG banker at Credit Suisse and
regulator at Bank of England
▪ Oxford University, MPhil (Economics)
▪ B. Econ (Hons), UNSW
▪ Graduate of Royal Military College, Duntroon
28
23
35
22
Name/ position Prior experience Education/ experience Years of experience
PRIVATE & CONFIDENTIAL | 8
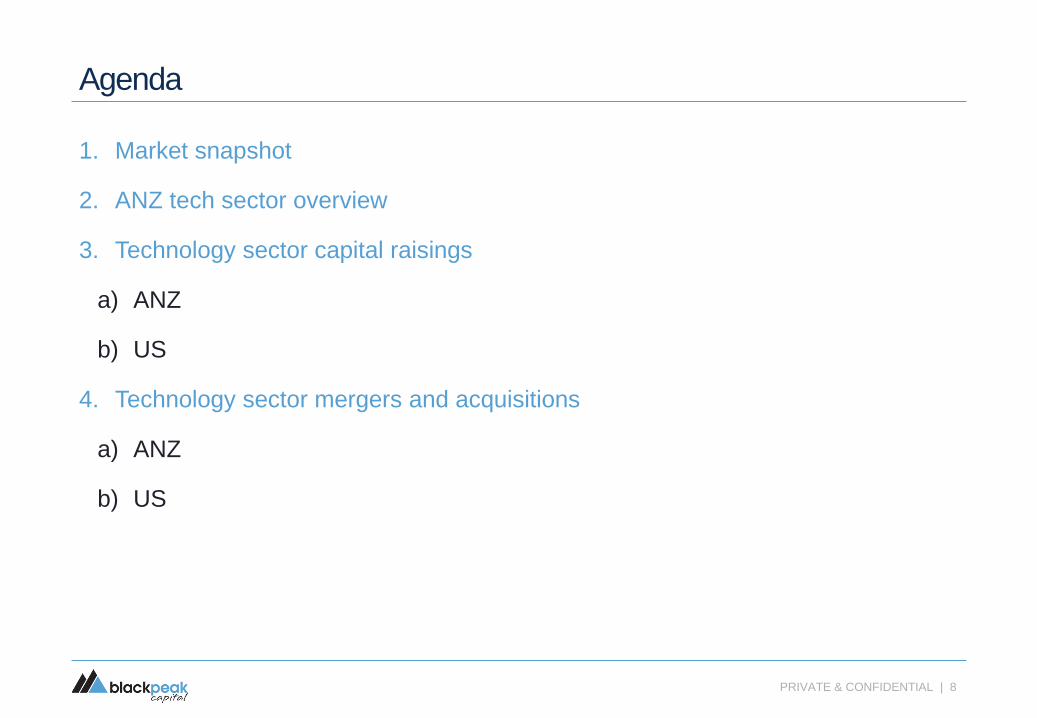
Agenda
1. Market snapshot
2. ANZ tech sector overview
3. Technology sector capital raisings
a) ANZ
b) US
4. Technology sector mergers and acquisitions
a) ANZ
b) US

PRIVATE & CONFIDENTIAL | 9
Market snapshot

Market themes
PRIVATE & CONFIDENTIAL | 10
Market overview
Context for
public capital
raising
▪ Tech sector IPO activity was quiet during the June quarter, with only Keypath Education hitting
the bourse. On the other hand, secondary raising activity was strong in 2Q21, with online car
classifieds business Carsales.com raising $600m while connectivity and managed services
firm Superloop raised $100m
▪ Despite lower levels of activity in 2Q21, the pipeline of tech IPOs during the quarter was
strong, and in early July, both property tech company PEXA and healthcare technology firm
Lumos Diagnostics hit the ASX boards
▪ The June quarter proved difficult for prospective IPO candidates as investor sentiment towards
new listings largely soured. This shift in attitude was mainly due to the poor performance of a
number of recent debutants and their continuing share price struggles in 2Q21
▪ Global equity markets continued to perform well in 2Q21, with all major indices having
advanced since the beginning of the year. The three major US indices as well as the ASX 200
all reached record highs during the quarter, with inflation worries being allayed by the US
Federal Reserve’s assertion that current inflation is transitory and unlikely to persist
▪ Growth in global equity markets was buoyed by strong vaccination rollouts as well as
continuing monetary and fiscal stimulus, with the US Federal Reserve continuing their bond-
buying program
▪ Countries around the globe have vaccinated large proportions of their populations, with 67% of
Britons and 55% of Americans having received at least one dose by the end of June. Despite
this, the prevalence of the Delta variant has prompted the reintroduction of restrictions in many
countries
▪ After underperforming the broader market in 1Q21, the ASX IT index has delivered a strong
performance in the June quarter, advancing 12.1% while the ASX 200 increased by 7.7%
Source: Capital IQ, company filings, Blackpeak Capital.
1) As at 30 June 2021

Market themes
PRIVATE & CONFIDENTIAL | 11
Context for
private capital
raising
Market outlook
▪ Private raising activity was once again in the spotlight, with a number of firms hitting record
valuations. Deployment and release management tool, Octopus Deploy shot into the spotlight
after a $221m equity contribution from Insight Ventures brought the firm closer to unicorn
status. Likewise, SafetyCulture reached a post-money valuation of $2.2bn after raising $99m
from a number of global investors
▪ Australian tech darling Canva has also been active in private capital markets. After sealing a
A$19.7bn valuation with a A$93m raise in April, the unicorn seems set to raise even more
capital in July in a funding round that could value the firm at over A$40bn
▪ Local VC fund raising activity was lower in the June quarter. The only sizeable fundraising
came from Tenacious Ventures, which closed a $35m fund seeking to focus on agri-tech
investments
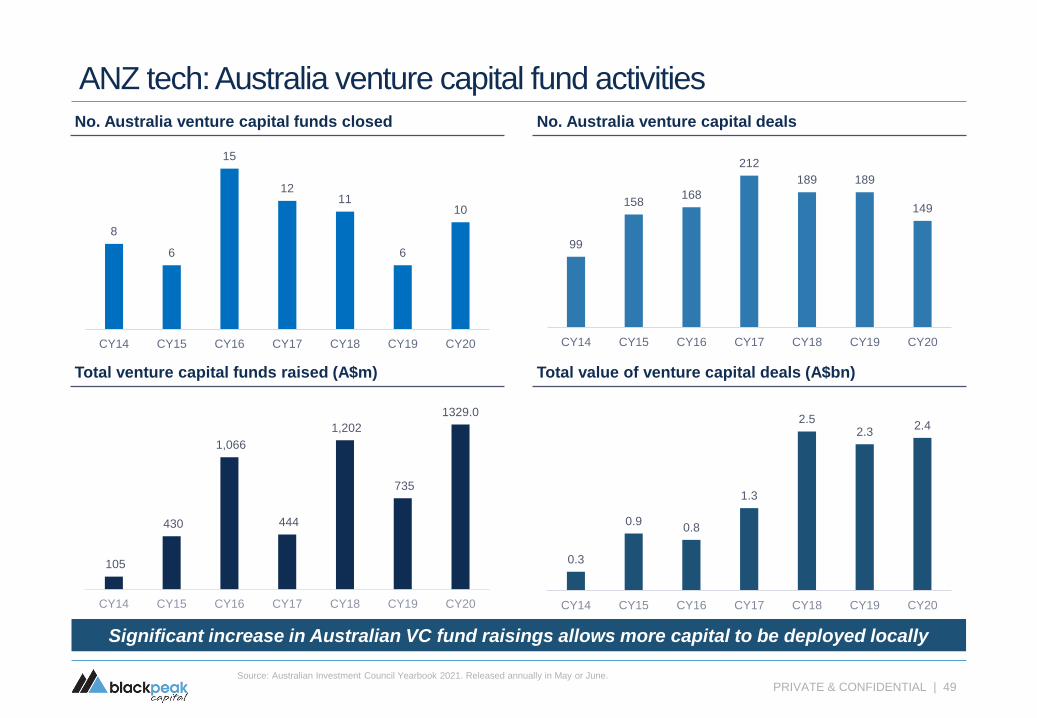
▪ The latest Australian Investment Council Yearbook data was released during 2Q21. The
figures highlighted that while venture deal activity was steady at roughly $2.4bn during 2020,
the amount of venture capital funds raised nearly doubled from $735m in CY19 to $1,329m in
CY20
▪ The outlook for global equity markets is highly uncertain, with the threat of inflation playing on
the minds of investors, despite assurances by central banks that it is temporary
▪ The spread of the highly infectious Delta COVID-19 variant has also increased uncertainty in
global equity markets due to the threat it poses to the global economic recovery, particularly as
nations like the United Kingdom ease almost all restrictions
▪ While Australian equity markets have largely shrugged off the poor vaccine rollout in recent
months, the reintroduction of lockdowns in NSW, Victoria and South Australia in July may have
significant repercussions for the local bourse
Source: Capital IQ, company filings, Blackpeak Capital.
1) As at 30 June 2021

PRIVATE & CONFIDENTIAL | 12
Overview EV/ Revenue EV/ EBITDA IPO metrics
CompanyIPO
dateCategory
Raising
size (A$m)IPO year
Forecast
yearIPO year
Forecast
year
Revenue
growth1Recurring
revenue2EBITDA
margin2Market cap at
IPO (A$m)3Return
since IPO
Oct-20 Fintech 35.0 1.0x 0.8x n.a. n.a. (3.9%) n.a n.a. 149.0 (45.3%)
Oct-20 Technology H&E 131.4 10.7x 5.8x 49.2x 15.6x 153.6% n.a. 21.8% 339.7 (65.1%)
Oct-20 Online/ Digital 269.5 6.9x 3.9x n.a. n.a. 65.4% n.a. 4.1% 635.3 (36.6%)
Nov-20 Online marketplace 100.4 6.3x 5.3x 46.8x 29.0x 11.0% 90.0% 13.0% 318.5 22.0%
Nov-20 Fintech 92.5 3.5x n.a. n.a. n.a. 16.1% n.a n.a. 353.2 (56.9%)
Dec-20 Fintech 65.0 5.3x n.a. n.a. n.a. (5.0%) n.a n.a. 136.4 (58.4%)
Dec-20 E-commerce 43.2 1.8x 1.5x 49.9x 31.9x 28.4% n.a 3.6% 315.9 14.8%
Dec-20 SaaS 953.0 9.9x 9.0x 31.5x 27.5x 26.0% 88.7% 31.6% 1,684.9 (58.4%)
Dec-20 Fintech 18.5 7.7x n.a. n.a. n.a. 188.5% n.a n.a. 106.8 (57.9%)
Jan-21 Online marketplace 12.0 9.7x n.a. n.a. n.a. 22.7% n.a n.a. 47.4 (25.0%)
Mar-21 Online marketplace 83.7 9.3x n.a. n.a. n.a. 37.9% n.a n.a. 255.4 69.2%
Jun-21Technology
enabled services212.1 5.7x 4.5x n.a. n.a. 64.1% n.a n.a. 772.5 (0.3%)
Source: Capital IQ, company filings, Blackpeak Capital. Market data as at 30 June 2021
1) Completed transactions
2) IPO year
3) (Share outstanding post-offer * IPO price) from Capital IQ
Recent ASX tech IPO’s ( > A$10m raised)1

0.00x
20.00x
40.00x
60.00x
80.00x
100.00x
Jul-20 Sep-20 Nov-20 Jan-21 Mar-21 May-21
ASX 200 ASX 200 IT
24%30% 29%
-23%
36% 39%
5% 5%
43%
7% 8%
27%
AS
X2
00
Sm
all
Ord
s
Ma
teria
ls
Utilit
ies
Fin
an
cia
ls IT
Hea
lth
Ca
re
Con
s.
Sta
ple
s
Con
s.
Dis
c.
En
erg
y
Indu
str
ials
Te
leco
m
0.00
10.00
20.00
30.00
40.00
50.00
60.00
70.00
80.00
90.00
2007 2008 2009 2010 2011 2012 2013 2014 2015 2016 2017 2018 2019 2020 2021
PRIVATE & CONFIDENTIAL | 13
Equity markets have recovered strongly from the COVID-19 crash
Source: Capital IQ, company filings, Blackpeak Capital. Market data as at 30 June 2021
1) Market-cap weighted
2) 1 year forward P/E
After declining in 1Q21, tech valuations have nearly regained their all time highs in 2Q21
18.3x
ASX 200 10 year average: 15.6x
ASX 200 IT 10 year average: 29.3x
88.8x
Tech indices1 outperformed amidst the market volatility Volatility (VIX) is returning to pre-pandemic levels
Tech was the second strongest ASX sector (LTM) Tech valuations are well above long term average2
GFC peak COVID-19 peak
(40.0%)
0.0%
40.0%
80.0%
120.0%
160.0%
200.0%
Jul-20 Sep-20 Nov-20 Jan-21 Mar-21 May-21
ASX200 S&P500 Nasdaq FTSE100
Hang Seng WAAAX FAANG

-5.0%
0.0%
5.0%
10.0%
15.0%
20.0%
25.0%
01-Jan-21 01-Feb-21 01-Mar-21 01-Apr-21 01-May-21 01-Jun-21
ASX 200 Dow Jones S&P500 Nasdaq FTSE 100 Nikkei 225 Hang Seng
CY21 global index performance
US, UK and Australian indices advanced during 2Q21, while the Japanese benchmark declined
Source: Capital IQ, company filings, Blackpeak Capital. Market data as at 30 June 2021
1-Jan-21 30-Jun-21 YTD change 2Q21 change
ASX 200 6,587 7,313 11.0% 7.7%
Dow Jones 30,606 34,503 12.7% 4.6%
S&P500 3,756 4,297 14.4% 8.2%
Nasdaq 12,888 14,504 12.5% 9.5%
FTSE 100 6,461 7,037 8.9% 4.8%
Nikkei 225 27,444 28,792 4.9% -1.3%
Hang Seng 27,231 28,828 5.9% 1.6%
PRIVATE & CONFIDENTIAL | 14
-30.0%
-25.0%
-20.0%
-15.0%
-10.0%
-5.0%
0.0%
5.0%
10.0%
15.0%
Jan-21 Feb-21 Mar-21 Apr-21 May-21 Jun-21
ASX 200 ASX All Ords ASX All Tech ASX 200 IT
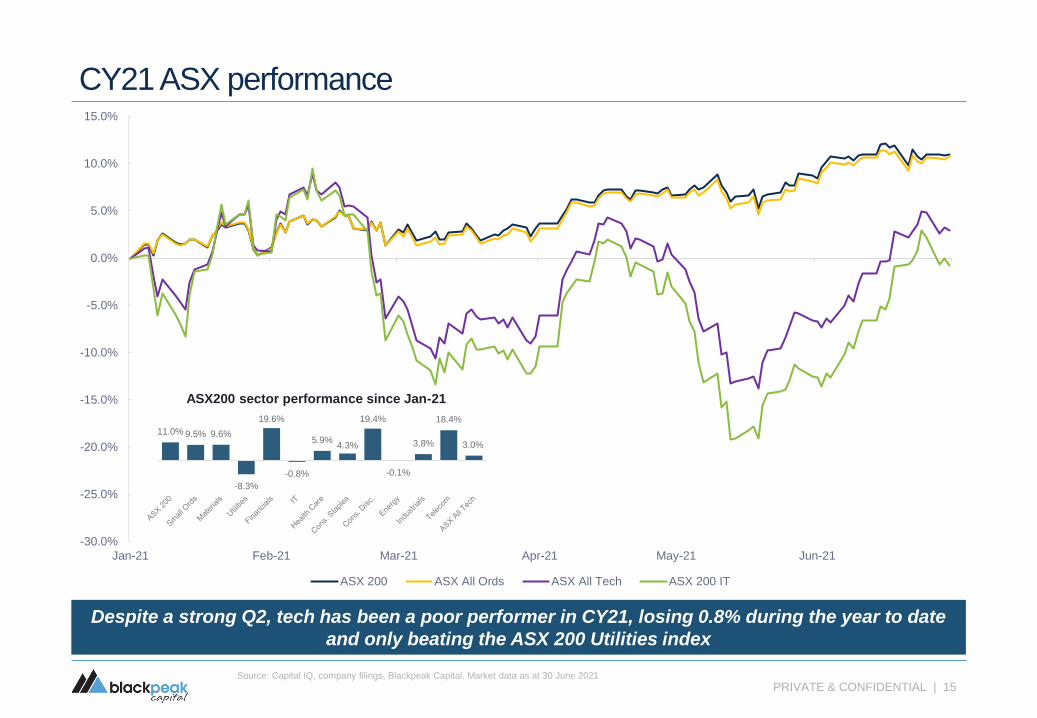
CY21 ASX performance
Despite a strong Q2, tech has been a poor performer in CY21, losing 0.8% during the year to date
and only beating the ASX 200 Utilities index
ASX200 sector performance since Jan-21
Source: Capital IQ, company filings, Blackpeak Capital. Market data as at 30 June 2021
PRIVATE & CONFIDENTIAL | 15
11.0% 9.5% 9.6%
-8.3%
19.6%
-0.8%
5.9%4.3%
19.4%
-0.1%
3.8%
18.4%
3.0%
-30.00%
-15.00%
0.00%
15.00%
30.00%
45.00%
60.00%
Jan-21 Feb-21 Mar-21 Apr-21 May-21 Jun-21
ANZ SaaS ANZ software Online classifieds Tech enabled services Online marketplaces
E-commerce Tech H&E Fintech Infrastructure/ Cloud IT services
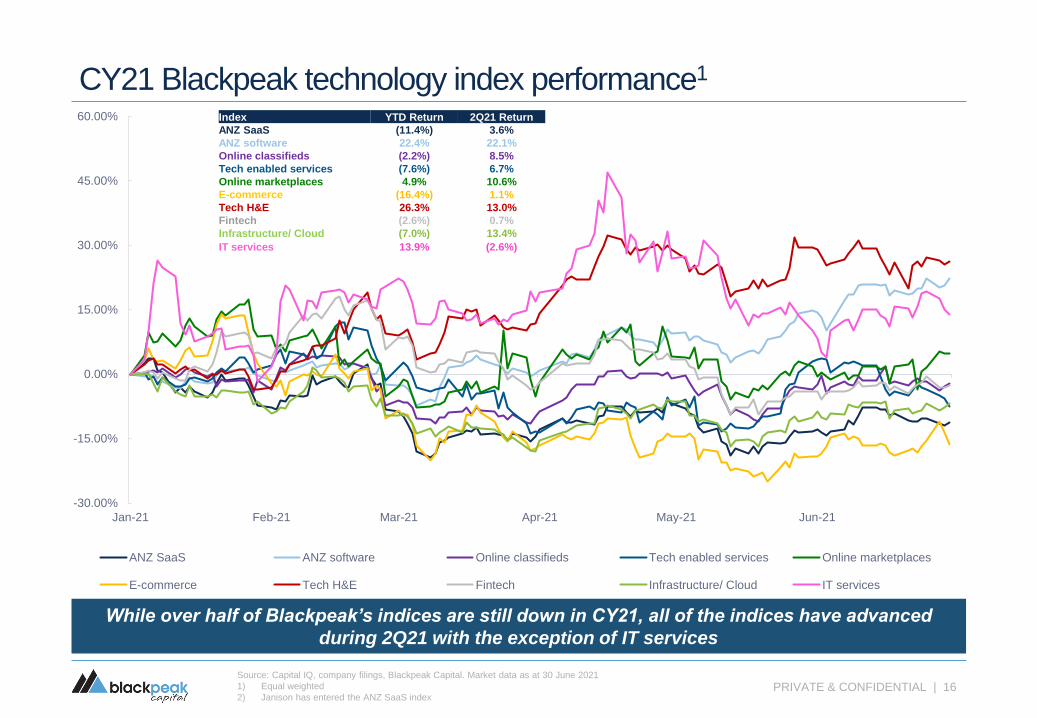
CY21 Blackpeak technology index performance1
While over half of Blackpeak’s indices are still down in CY21, all of the indices have advanced
during 2Q21 with the exception of IT services
Source: Capital IQ, company filings, Blackpeak Capital. Market data as at 30 June 2021
1) Equal weighted
2) Janison has entered the ANZ SaaS indexPRIVATE & CONFIDENTIAL | 16
Index YTD Return 2Q21 Return
ANZ SaaS (11.4%) 3.6%
ANZ software 22.4% 22.1%
Online classifieds (2.2%) 8.5%
Tech enabled services (7.6%) 6.7%
Online marketplaces 4.9% 10.6%
E-commerce (16.4%) 1.1%
Tech H&E 26.3% 13.0%
Fintech (2.6%) 0.7%
Infrastructure/ Cloud (7.0%) 13.4%
IT services 13.9% (2.6%)

0.00
0.20
0.40
0.60
0.80
1.00
1.20
Oct-07 Oct-08 Oct-09 Oct-10 Oct-11 Oct-12 Oct-13 Oct-14 Oct-15 Oct-16 Oct-17 Oct-18 Oct-19 Oct-20
AUD/USD
The AUD continues to hover over 0.75 USD as iron-ore prices continue to move higher and financial
markets bet on interest rates rising sooner than the RBA’s 2024 prediction
AUD peaked in February 2021 at
nearly 0.80 USD before and has since
declined slightly in 2Q21
AUD/ USD since Jul-20
Low during GFC of
$0.61 in Oct-08
Source: Capital IQ, company filings, Blackpeak Capital. Market data as at 30 June 2021
PRIVATE & CONFIDENTIAL | 17
0.50
0.55
0.60
0.65
0.70
0.75
0.80
Jul-20 Aug-20 Sep-20 Oct-20 Nov-20 Dec-20 Jan-21 Feb-21Mar-21 Apr-21 May-21 Jun-21

Blackpeak ASX tech indices performance1
PRIVATE & CONFIDENTIAL | 18
A handful of tech sectors are trading at record high valuations
Source: Capital IQ, company filings, Blackpeak Capital. Market data as at 30 June 2021
1) Equal weighted
Tech valuations have fallen slightly in recent months after peaking in Feb-21
SaaS SoftwareOnline
classifieds
Tech
enabled
services
Online
marketplacesE-commerce Tech H&E Fintech
Infrastructure/
CloudIT services ASX 200 ASX 200 IT
1 month 2.2% 6.7% 1.5% (10.4%) 3.1% 3.6% (2.5%) 1.6% 3.4% 3.4% 2.1% 13.4%
3 months 3.6% 22.1% 8.5% 6.7% 10.6% 1.1% 13.0% 0.7% 13.4% (2.6%) 7.7% 12.1%
6 months (11.4%) 22.4% (2.2%) (7.6%) 4.9% (16.4%) 26.3% (2.6%) (7.0%) 13.9% 11.0% (0.8%)
12 months 78.8% 55.3% 47.9% 6.4% 99.2% 32.9% 93.8% 40.1% 10.3% 188.6% 24.0% 38.9%
Blackpeak ASX tech indices EV/ NTM revenue multiple
5.9x
4.5x
9.9x
2.7x4.1x
1.7x
5.1x5.7x
13.2x
2.4x3.4x
9.2x7.9x
3.7x
10.5x
4.0x4.9x
2.4x
4.2x
6.4x
14.0x
2.1x3.3x
9.8x
5.5x
3.5x
8.7x
5.3x
1.2x
2.8x 3.1x
6.3x
13.6x
1.5x
3.1x
7.3x
0.0x
2.0x
4.0x
6.0x
8.0x
10.0x
12.0x
14.0x
16.0x
ANZ SaaS ANZ Software Onlineclassifieds
Tech enabledservices
Onlinemarketplaces
E-commerce Tech H&E Fintech Infrastructure/Cloud
IT services ASX 200 ASX 200 IT
Current 6 months 12 months ago

17.5%
36.3%
25.9%
NTM EBITDA margin
Snapshot of Blackpeak ANZ & US SaaS and software universe1
Source: Capital IQ, company filings, Blackpeak Capital. Market data as at 30 June 2021
1) All points represent the median LTM or median last reported figures, unless stated otherwise
2) Includes capitalised development costs
3) Median company for Rule of 40% (NTM) differs from median companies for EBITDA margin and revenue growth
PRIVATE & CONFIDENTIAL | 19
Recurring revenue S&M expense/ revenue
NTM revenue growth
Gross margin
Total R&D expense/ revenue2
Rule of 40% (NTM)
EV/ NTM revenue
EV/ NTM EBITDA
ANZ software
ANZ SaaS
US SaaS
ANZ software
US SaaS
ANZ software
ANZ SaaS US SaaS
ANZ software
ANZ SaaS US SaaS
ANZ software
ANZ SaaS
US SaaS
ANZ software
ANZ SaaSUS SaaS
ANZ software
ANZ SaaS
US SaaS
ANZ software
ANZ SaaS
US SaaS
ANZ SaaS
ANZ software ANZ SaaS
US SaaS
77.0%
90.9% 92.7%
4.4%
27.1%
40.4% 22.6%
-4.7%
13.3%
8.6%
25.1%22.2%
4.5x5.9x
13.0x
84.9% 85.2%
72.6% 36.7%
45.5%
38.5%22.3x
13.4x
32.0x

PRIVATE & CONFIDENTIAL | 20
ANZ: Technology sector overview
SaaS SoftwareOnline
classifieds
Tech enabled
services
Online
marketplacesE-commerce
Tech
H&EFintech
Infrastructure/
Cloud
IT
servicesASX 200
ASX 200
IT
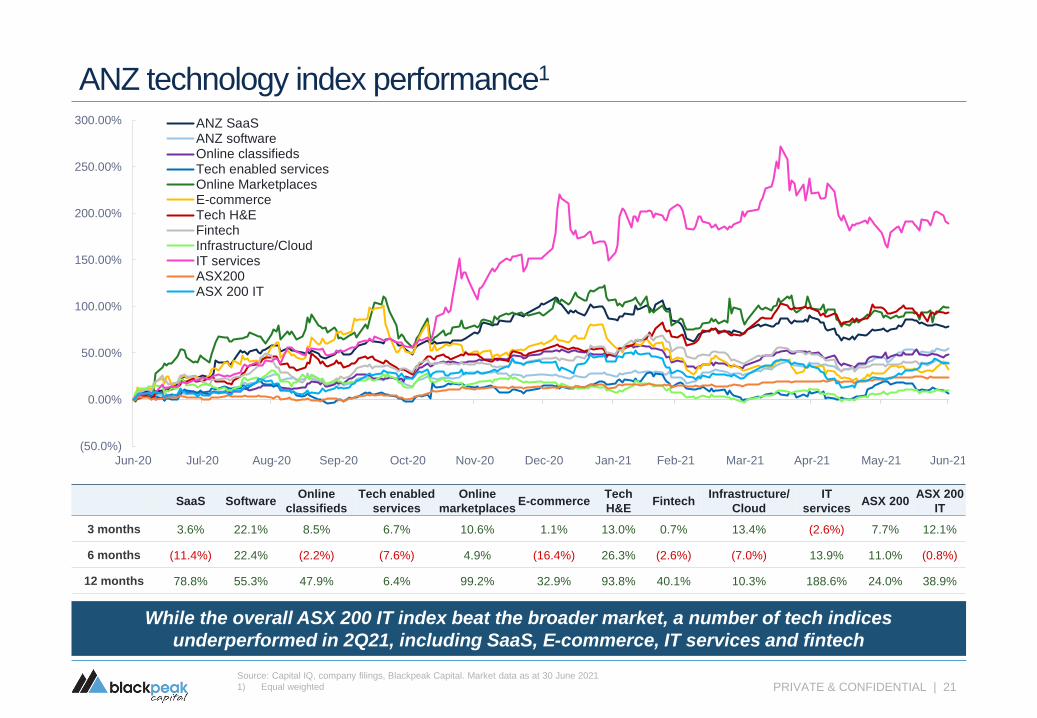
3 months 3.6% 22.1% 8.5% 6.7% 10.6% 1.1% 13.0% 0.7% 13.4% (2.6%) 7.7% 12.1%
6 months (11.4%) 22.4% (2.2%) (7.6%) 4.9% (16.4%) 26.3% (2.6%) (7.0%) 13.9% 11.0% (0.8%)
12 months 78.8% 55.3% 47.9% 6.4% 99.2% 32.9% 93.8% 40.1% 10.3% 188.6% 24.0% 38.9%
PRIVATE & CONFIDENTIAL | 21Source: Capital IQ, company filings, Blackpeak Capital. Market data as at 30 June 2021
1) Equal weighted
ANZ technology index performance1
While the overall ASX 200 IT index beat the broader market, a number of tech indices
underperformed in 2Q21, including SaaS, E-commerce, IT services and fintech
(50.0%)
0.00%
50.00%
100.00%
150.00%
200.00%
250.00%
300.00%
Jun-20 Jul-20 Aug-20 Sep-20 Oct-20 Nov-20 Dec-20 Jan-21 Feb-21 Mar-21 Apr-21 May-21 Jun-21
ANZ SaaSANZ softwareOnline classifiedsTech enabled servicesOnline MarketplacesE-commerceTech H&EFintechInfrastructure/CloudIT servicesASX200ASX 200 IT

PRIVATE & CONFIDENTIAL | 22
ANZ technology EV/ NTM revenue
ANZ tech valuations are slightly above their levels 12 months ago
Source: Capital IQ, company filings, Blackpeak Capital. Market data as at 30 June 2021
1) Equal weighted
SaaS SoftwareOnline
classifieds
Tech enabled
services
Online
marketplacesE-commerce Tech H&E Fintech
Infrastructure/
Cloud
IT
services
ASX
200
ASX
200 IT
12 months ago 5.5x 3.5x 8.7x 5.3x 1.2x 2.8x 3.1x 6.3x 13.6x 1.5x 3.1x 7.3x
Current 5.9x 4.5x 9.9x 2.7x 4.1x 1.7x 5.1x 5.7x 13.2x 1.7x 3.4x 9.2x
0.0x
1.0x
2.0x
3.0x
4.0x
5.0x
6.0x
7.0x
8.0x
9.0x
10.0x
11.0x
12.0x
13.0x
14.0x
15.0x
16.0x
17.0x
Jul-20 Sep-20 Nov-20 Jan-21 Mar-21 May-21
ANZ SaaS ANZ Software Online classifieds Tech enabled services Online marketplaces E-commerce
Tech H&E Fintech Infrastructure/ Cloud IT services ASX 200 ASX 200 IT

PRIVATE & CONFIDENTIAL | 23Source: Capital IQ, company filings, Blackpeak Capital. Market data as at 30 June 2021
ANZ technology EV/ NTM revenue
SaaS
Median: 5.9xSoftware
Median: 4.5x
Online Classifieds
Median: 9.9x
Tech enabled
services
Median: 2.7x
Online
marketplace
Median: 4.1x
Tech H&E
Median: 5.1x Fintech
Median: 5.7x
IT Services
Median: 1.7x
E-commerce
Median: 1.7x
Infrastructure/Cloud
Median: 20.0x
0.0x
10.0x
20.0x
30.0x
40.0x
50.0x
ANZ SaaS ANZ software Online classifieds Tech enabled services Online marketplaces
E-commerce Tech H&E Fintech Infrastructure/ Cloud IT services

0.0x
10.0x
20.0x
30.0x
40.0x
50.0x
60.0x
70.0x
80.0x
ANZ SaaS ANZ software Online classifieds Tech enabled services Online marketplaces
E-commerce Tech H&E Fintech Infrastructure/ Cloud IT services
Source: Capital IQ, company filings, Blackpeak Capital. Market data as at 30 June 2021
ANZ technology EV/ NTM EBITDA1
SaaS
Median: 13.4xSoftware
Median: 22.3x
Online Classifieds
Median: 28.3x
Tech H&E
Median: 64.4x
IT Services
Median: 12.9x
Fintech
Median: 18.7x
Online
marketplace
Median: 25.9x
E-commerce
Median: 40.2x
Infrastructure/Cloud
Median: 30.8x
PRIVATE & CONFIDENTIAL | 24
Tech enabled
services
Median: 23.1x

0.0x
5.0x
10.0x
15.0x
20.0x
25.0x
30.0x
0% 10% 20% 30% 40% 50% 60% 70% 80% 90% 100%
EV/NTM revenue
NTM revenue growth
ANZ SaaS ANZ software Online classifieds Tech enabled services Online marketplaces
E-commerce Tech H&E Fintech Infrastructure/ Cloud IT services
PRIVATE & CONFIDENTIAL | 25Source: Capital IQ, company filings, Blackpeak Capital. Market data as at 30 June 2021
ANZ technology EV/ NTM revenue vs NTM revenue growth rate %
Post COVID-19 revenue multiples seem to be less correlated with growth rates than what we have
seen in previous periods
PRIVATE & CONFIDENTIAL | 26
ANZ tech: Public equity capital raisings

PRIVATE & CONFIDENTIAL | 27Source: Capital IQ, company filings, Blackpeak Capital. Market data as at 30 June 2021
1) Completed transactions, figures do not include announced deals that are incomplete
2) Australian Financial Review – 25 March 2021
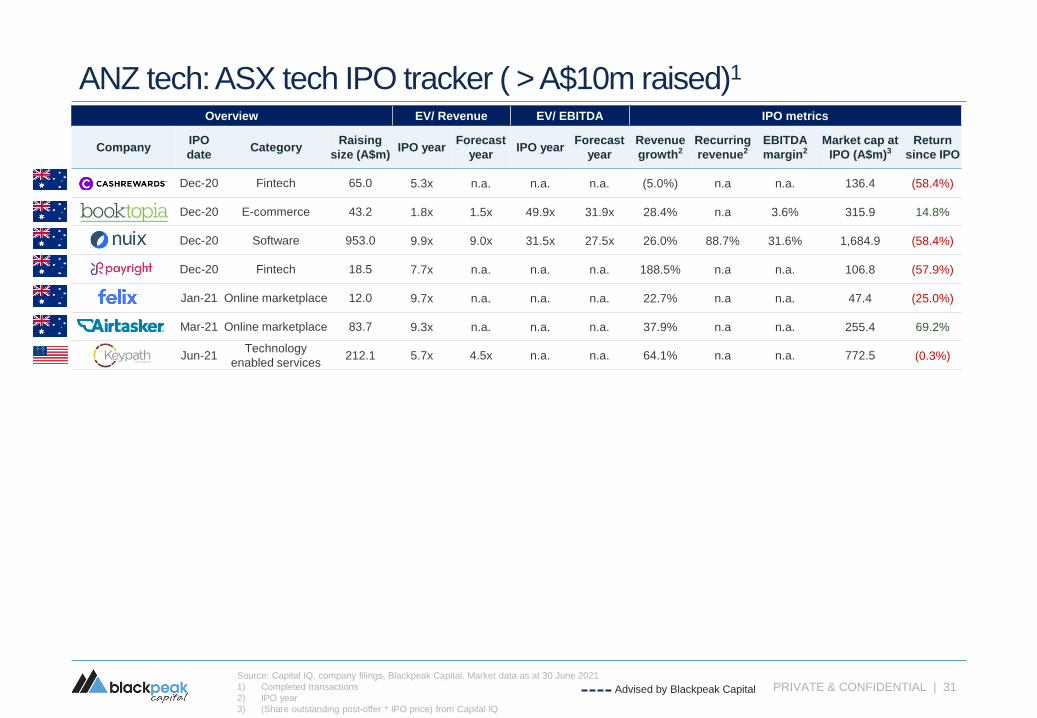
ANZ tech: ASX tech IPO tracker ( > A$10m raised)1
▪ IPO activity in the Australian tech space was once again
limited during 2Q21, with Keypath Education being the
only significant tech player to join the bourse.
▪ Keypath Education hit the ASX boards in early June,
raising A$212.1m at an indicative market capitalisation of
A$772.5m. After falling as much as 18.6% during its first
few days of trading, Keypath finished the quarter only
0.3% below its offer price.
▪ The June quarter proved difficult for prospective IPO
candidates as investor sentiment towards new listings
largely soured. This shift in attitude was mainly due to the
poor performance of a number of recent debutants and
their continuing share price struggles in 2Q21
▪ Despite this, the pipeline of tech IPOs remains strong,
with Lumos Diagnostics, PEXA and Silk Logistics all
slated to hit the ASX early in July.
▪ Likewise, Judo Bank and Marketplacer are just some of
the tech names expected to list later in 2021 when the
IPO window reopens after reporting season.
IPO activity was muted in 2Q21, although the pipeline of tech listings remains strong
No. ANZ tech IPO’s
Total ANZ tech IPO capital raised (A$m)
12
87
16
11
3
CY16 CY17 CY18 CY19 CY20 YTD21
421150 192
8461,043
239
159
22 20
481
1,277
69
580
173213
1,327
2,319
308
CY16 CY17 CY18 CY19 CY20 YTD21
Primary proceeds
Secondary proceeds
Total proceeds

PRIVATE & CONFIDENTIAL | 28Source: Capital IQ, company filings, Blackpeak Capital. Market data as at 30 June 2021
1) Completed transactions
2) IPO year
3) (Share outstanding post-offer * IPO price) from Capital IQ
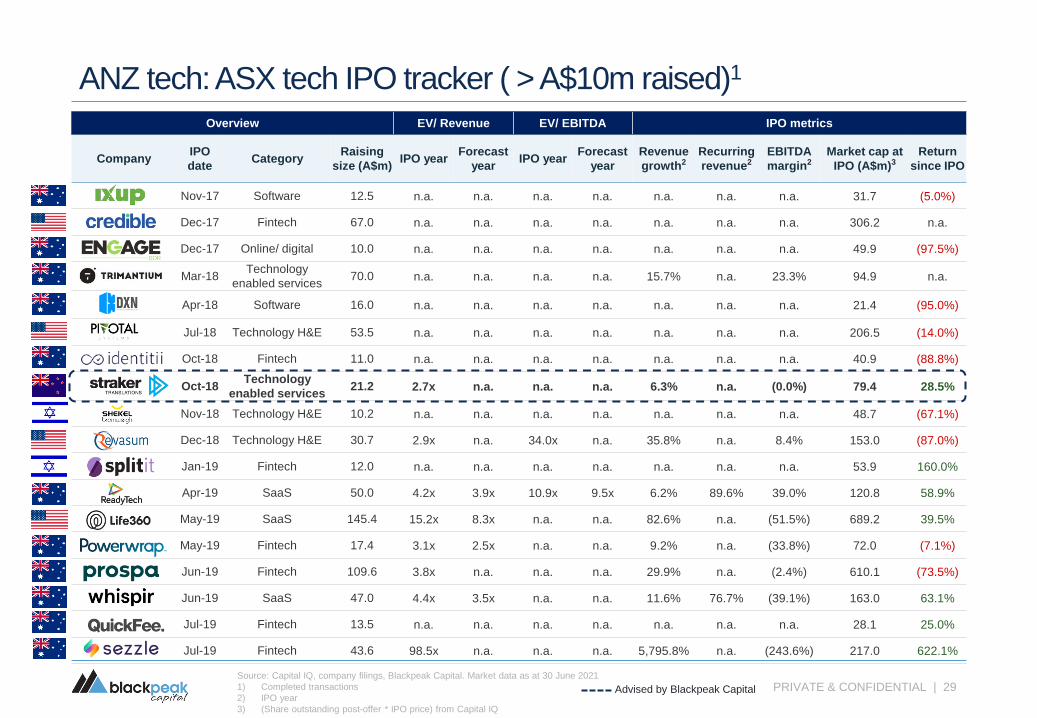
ANZ tech: ASX tech IPO tracker ( > A$10m raised)1
Overview EV/ Revenue EV/ EBITDA IPO metrics
CompanyIPO
dateCategory
Raising
size (A$m)IPO year
Forecast
yearIPO year
Forecast
year
Revenue
growth2Recurring
revenue2EBITDA
margin2Market cap at
IPO (A$m)3Return
since IPO
Mar-16 Software 62.4 n.a. n.a. n.a. n.a. n.a. n.a. n.a. 194.4 (86.9%)
Apr-16 SaaS 167.6 8.7x 6.6x 29.7x 18.5x 28.1% 98.0% 29.4% 973.6 853.1%
May-16 Fintech 25.0 n.a. n.a. n.a. n.a. n.a. n.a. n.a. 165.0 11717.0%
May-16 Online/ digital 39.8 1.8x 1.2x n.a. n.a. 61.2% n.a. (9.2%) 267.7 171.4%
Jun-16 Online/ digital 10.0 n.a. n.a. n.a. n.a. n.a. n.a. n.a. 40.0 102.5%
Jun-16 Online/ digital 25.0 n.a. n.a. n.a. n.a. 632.0% n.a. n.a. 80.6 (92.0%)
Jun-16 Fintech 15.0 n.a. n.a. n.a. n.a. n.a. n.a. n.a. 39.1 (86.3%)
Aug-16 Online classifieds 30.0 n.a. n.a. n.a. n.a. n.a. n.a. n.a. 108.1 177.0%
Sep-16 Online/ digital 12.2 n.a. n.a. n.a. n.a. 4.3% n.a. (12.8%) 22.0 202.5%
Nov-16 Software 148.1 1.6x n.a. 9.5x n.a. 1.6% 57.0% 17.2% 310.6 142.1%
Dec-16Technology
enabled services25.0 1.4x n.a. 6.3x n.a. 6.8% n.a. 9.0% 86.0 n.a.
Dec-16 Technology H&E 10.0 n.a. n.a. n.a. n.a. n.a. n.a. n.a. 24.4 (79.0%)
Mar-17 SaaS 12.0 3.2x n.a. n.a. n.a. 38.0% 92.0% n.a. 45.8 336.5%
May-17 SaaS 15.0 1.7x 1.4x 12.4x 7.7x (1.1%) 47.6% 13.6% 62.3 (46.0%)
Jun-17 SaaS 25.0 5.1x 3.8x 97.7x 31.3x 24.8% 96.0% 5.5% 108.3 113.0%
Jun-17 Technology H&E 21.0 4.0x 3.1x n.a. n.a. 27.1% n.a. (4.6%) 72.6 566.4%
Sep-17 Software 10.0 n.a. n.a. n.a. n.a. n.a. n.a. n.a. 40.0 11.7%
Advised by Blackpeak Capital
PRIVATE & CONFIDENTIAL | 29Source: Capital IQ, company filings, Blackpeak Capital. Market data as at 30 June 2021
1) Completed transactions
2) IPO year
3) (Share outstanding post-offer * IPO price) from Capital IQ
ANZ tech: ASX tech IPO tracker ( > A$10m raised)1
Overview EV/ Revenue EV/ EBITDA IPO metrics
CompanyIPO
dateCategory
Raising
size (A$m)IPO year
Forecast
yearIPO year
Forecast
year
Revenue
growth2Recurring
revenue2EBITDA
margin2Market cap at
IPO (A$m)3Return
since IPO
Nov-17 Software 12.5 n.a. n.a. n.a. n.a. n.a. n.a. n.a. 31.7 (5.0%)
Dec-17 Fintech 67.0 n.a. n.a. n.a. n.a. n.a. n.a. n.a. 306.2 n.a.
Dec-17 Online/ digital 10.0 n.a. n.a. n.a. n.a. n.a. n.a. n.a. 49.9 (97.5%)
Mar-18Technology
enabled services70.0 n.a. n.a. n.a. n.a. 15.7% n.a. 23.3% 94.9 n.a.
Apr-18 Software 16.0 n.a. n.a. n.a. n.a. n.a. n.a. n.a. 21.4 (95.0%)
Jul-18 Technology H&E 53.5 n.a. n.a. n.a. n.a. n.a. n.a. n.a. 206.5 (14.0%)
Oct-18 Fintech 11.0 n.a. n.a. n.a. n.a. n.a. n.a. n.a. 40.9 (88.8%)
Oct-18Technology
enabled services21.2 2.7x n.a. n.a. n.a. 6.3% n.a. (0.0%) 79.4 28.5%
Nov-18 Technology H&E 10.2 n.a. n.a. n.a. n.a. n.a. n.a. n.a. 48.7 (67.1%)
Dec-18 Technology H&E 30.7 2.9x n.a. 34.0x n.a. 35.8% n.a. 8.4% 153.0 (87.0%)
Jan-19 Fintech 12.0 n.a. n.a. n.a. n.a. n.a. n.a. n.a. 53.9 160.0%
Apr-19 SaaS 50.0 4.2x 3.9x 10.9x 9.5x 6.2% 89.6% 39.0% 120.8 58.9%
May-19 SaaS 145.4 15.2x 8.3x n.a. n.a. 82.6% n.a. (51.5%) 689.2 39.5%
May-19 Fintech 17.4 3.1x 2.5x n.a. n.a. 9.2% n.a. (33.8%) 72.0 (7.1%)
Jun-19 Fintech 109.6 3.8x n.a. n.a. n.a. 29.9% n.a. (2.4%) 610.1 (73.5%)
Jun-19 SaaS 47.0 4.4x 3.5x n.a. n.a. 11.6% 76.7% (39.1%) 163.0 63.1%
Jul-19 Fintech 13.5 n.a. n.a. n.a. n.a. n.a. n.a. n.a. 28.1 25.0%
Jul-19 Fintech 43.6 98.5x n.a. n.a. n.a. 5,795.8% n.a. (243.6%) 217.0 622.1%
Advised by Blackpeak Capital

PRIVATE & CONFIDENTIAL | 30Source: Capital IQ, company filings, Blackpeak Capital. Market data as at 30 June 2021
1) Completed transactions
2) IPO year
3) (Share outstanding post-offer * IPO price) from Capital IQ
ANZ tech: ASX tech IPO tracker ( > A$10m raised)1
Overview EV/ Revenue EV/ EBITDA IPO metrics
CompanyIPO
dateCategory
Raising
size (A$m)IPO year
Forecast
yearIPO year
Forecast
year
Revenue
growth2Recurring
revenue2EBITDA
margin2Market cap at
IPO (A$m)3Return
since IPO
Aug-19 Software 211.0 5.6x n.a. 75.2x n.a. 30.9% n.a. 11.8% 661.0 56.0%
Oct-19 SaaS 49.3 5.1x n.a. 25.1x n.a. 39.4% 69.5% 20.3% 123.7 (7.8%)
Dec-19 Fintech 287.1 4.8x n.a. n.a. n.a. 26.8% n.a. (0.3%) 1,376.6 33.8%
Dec-19Technology
Enabled Services25.0 6.3x n.a. 19.4x n.a. n.a. n.a. n.a. 94.4 (33.0%)
Dec-19 SaaS 110.2 7.4x 4.5x n.a. n.a. 14.4% 49.9% (13.1%) 325.0 89.5%
Dec-19 Fintech 45.0 3.8x n.a. 60.4x n.a. 43.6% n.a. 6.3% 211.8 79.2%
Dec-19 Fintech 50.0 8.3x n.a. n.a. n.a. 61.8% n.a. n.a. 150.0 (10.6%)
Dec-19 SaaS 100.0 6.6x 5.5x n.a. n.a. 19.4% 96.2% (19.1%) 452.9 (61.9%)
Aug-20Technology
Enabled Services34.8 1.4x n.a. 6.7x n.a. 6.6% n.a. 21.1% 134.3 (1.1%)
Sep-20 Fintech 80.1 12.3x n.a. n.a. n.a. 92.1% n.a. n.a. 246.0 (62.4%)
Sep-20Technology
Enabled Services65.5 3.6x n.a. n.a. n.a. 15.6% n.a. (11.0%) 452.9 (29.7%)
Sep-20 Fintech 55.0 4.6x n.a. n.a. n.a. 43.9% n.a. n.a. 280.3 (18.8%)
Oct-20 Online marketplace 40.0 14.4x n.a. n.a. n.a. 209.1% n.a. 4.4% 258.8 (40.5%)
Oct-20 Fintech 15.0 5.7x n.a. n.a. n.a. 8.7% n.a. n.a. 79.0 64.3%
Oct-20 Fintech 35.0 1.0x 0.8x n.a. n.a. (3.9%) n.a n.a. 149.0 (45.3%)
Oct-20 Technology H&E 131.4 10.7x 5.8x 49.2x 15.6x 153.6% n.a. 21.8% 339.7 (65.1%)
Oct-20 Online/ Digital 269.5 6.9x 3.9x n.a. n.a. 65.4% n.a. 4.1% 635.3 (36.6%)
Nov-20 Online marketplace 100.4 6.3x 5.3x 46.8x 29.0x 11.0% 90.0% 13.0% 318.5 22.0%
Nov-20 Fintech 92.5 3.5x n.a. n.a. n.a. 16.1% n.a n.a. 353.2 (56.9%)
Advised by Blackpeak Capital
PRIVATE & CONFIDENTIAL | 31Source: Capital IQ, company filings, Blackpeak Capital. Market data as at 30 June 2021
1) Completed transactions
2) IPO year
3) (Share outstanding post-offer * IPO price) from Capital IQ
ANZ tech: ASX tech IPO tracker ( > A$10m raised)1
Overview EV/ Revenue EV/ EBITDA IPO metrics
CompanyIPO
dateCategory
Raising
size (A$m)IPO year
Forecast
yearIPO year
Forecast
year
Revenue
growth2Recurring
revenue2EBITDA
margin2Market cap at
IPO (A$m)3Return
since IPO
Dec-20 Fintech 65.0 5.3x n.a. n.a. n.a. (5.0%) n.a n.a. 136.4 (58.4%)
Dec-20 E-commerce 43.2 1.8x 1.5x 49.9x 31.9x 28.4% n.a 3.6% 315.9 14.8%
Dec-20 Software 953.0 9.9x 9.0x 31.5x 27.5x 26.0% 88.7% 31.6% 1,684.9 (58.4%)
Dec-20 Fintech 18.5 7.7x n.a. n.a. n.a. 188.5% n.a n.a. 106.8 (57.9%)
Jan-21 Online marketplace 12.0 9.7x n.a. n.a. n.a. 22.7% n.a n.a. 47.4 (25.0%)
Mar-21 Online marketplace 83.7 9.3x n.a. n.a. n.a. 37.9% n.a n.a. 255.4 69.2%
Jun-21Technology
enabled services212.1 5.7x 4.5x n.a. n.a. 64.1% n.a n.a. 772.5 (0.3%)
Advised by Blackpeak Capital

PRIVATE & CONFIDENTIAL | 32Source: Capital IQ, company filings, Blackpeak Capital. Market data as at 30 June 2021
1) Completed transactions, figures do not include announced deals that are incomplete
2) Includes share purchase plans > A$10m
3) Total capital raised for secondary raisings > A$10m
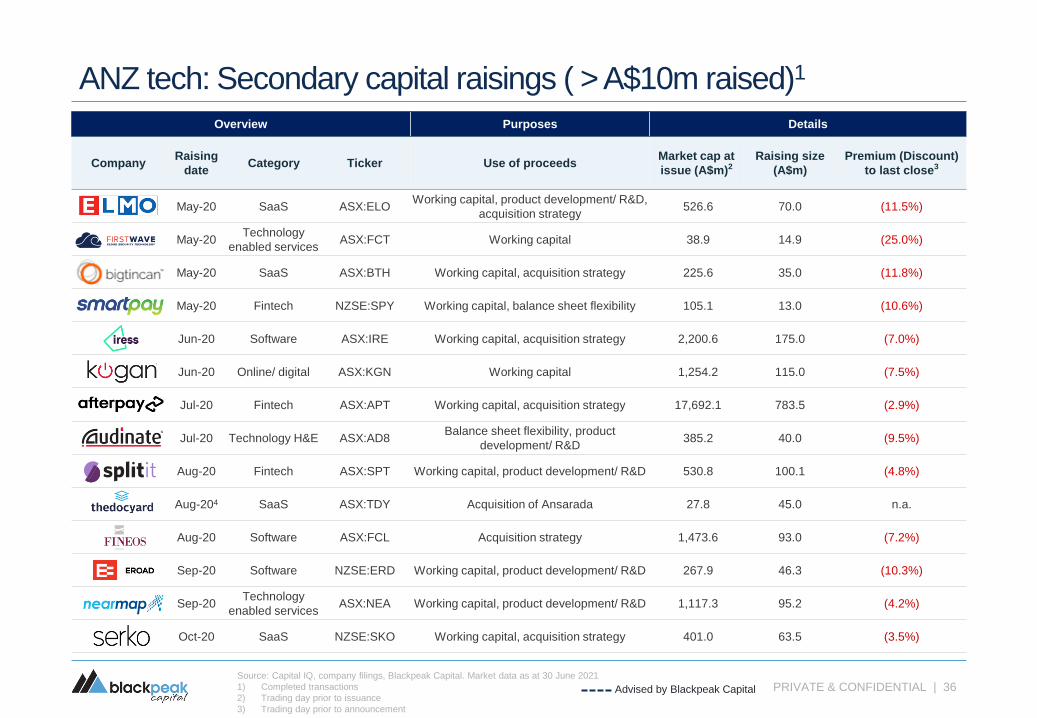
Secondary raising activity improved in 2Q21 with a large number of acquisition-driven offerings
▪ 2Q21 saw a large increase in secondary raising activity in
the ANZ technology sector. Local players sought to take
advantage of improving technology valuations in a quarter
marked by acquisition-fuelled raisings
▪ The largest offering for the quarter came from
Carsales.com, who sought to raise $600m via a
renounceable rights offer in order to fund the acquisition of
Trader Interactive, a US online listings business
▪ Superloop also launched a sizeable raising, seeking
$100m to fund the acquisition of Exetel in a move that
would quadruple its home broadband subscriptions
▪ Likewise, performance tech company Catapult raised
$48.4m in order to fund its purchase of UK based SBG
Sports Software, while Airtasker raised $20.7m to acquire
US marketplace Zaarly and strengthen its push into the
American market
▪ Janison and Envriosuite each chimed in with smaller
raisings of $17m and $14m respectively, with both firms
looking to accelerate international expansion
ANZ tech: Secondary capital raisings ( > A$10m raised)1
No. ANZ tech secondary capital raisings2
Total ANZ tech secondary capital raised (A$m)3
9
16
2220
22
42
18
CY15 CY16 CY17 CY18 CY19 CY20 YTD21
493 622
1,334 1,295
1,840
2,879
1,164
CY15 CY16 CY17 CY18 CY19 CY20 YTD21

PRIVATE & CONFIDENTIAL | 33Source: Capital IQ, company filings, Blackpeak Capital. Market data as at 30 June 2021
1) Completed transactions
2) Trading day prior to issuance
3) Trading day prior to announcement
ANZ tech: Secondary capital raisings ( > A$10m raised)1
Advised by Blackpeak Capital
Overview Purposes Details
CompanyRaising
dateCategory Ticker Use of proceeds
Market cap at
issue (A$m)2Raising size
(A$m)
Premium (Discount)
to last close3
Feb-18 Software ASX:LNU Product development, R&D 73.0 10.0 0.0%
Mar-18 Technology H&E ASX:MP1 Working capital 454.4 60.0 (7.4%)
Mar-18 Technology H&E ASX:CAT Working capital, product development, R&D 202.8 25.0 (6.8%)
Mar-18 SaaS ASX:ELO Acquisition strategy 325.4 45.0 (10.1%)
Apr-18Technology
enabled servicesASX:NXT Working capital, acquisition strategy 2,329.6 377.4 (5.6%)
Apr-18Technology
enabled servicesASX:LNK Balance sheet flexibility 4,286.1 300.0 (1.6%)
May-18 SaaS ASX:WTCAcquisition strategy, strengthening
balance sheet4,288.7 100.6 (3.8%)
Jun-18 SaaS ASX:BTH Acquisition strategy 75.6 15.0 (6.7%)
Jul-18 Software NZSE:GTK Acquisition strategy, balance sheet flexibility 587.2 83.1 (3.3%)
Aug-18 SaaS NZSE:SKOAcquisition strategy, working capital, product
development, R&D212.6 13.6 6.3%
Aug-18 IT services ASX:CSVAcquisition strategy, working capital, balance
sheet flexibility87.2 18.0 (24.5%)
Aug-18 Fintech ASX:APT Working capital 4,302.8 142.0 (8.1%)
Sep-18 Fintech ASX:WJA Acquisition strategy, working capital 131.0 35.6 4.8%

PRIVATE & CONFIDENTIAL | 34Source: Capital IQ, company filings, Blackpeak Capital. Market data as at 30 June 2021
1) Completed transactions
2) Trading day prior to issuance
3) Trading day prior to announcement
ANZ tech: Secondary capital raisings ( > A$10m raised)1
Advised by Blackpeak Capital
Overview Purposes Details
CompanyRaising
dateCategory Ticker Use of proceeds
Market cap at
issue (A$m)2Raising size
(A$m)
Premium (Discount)
to last close3
Oct-18 Fintech ASX:ISX Working capital 145.2 10.0 (9.4%)
Oct-18Technology
enabled servicesASX:OTW Acquisition strategy 240.3 21.5 (1.1%)
Mar-19Technology
enabled servicesASX:APX Acquisition strategy, balance sheet flexibility 2,712.4 300.0 (11.8%)
Mar-19 Technology H&E ASX:MP1 Working capital, product development, R&D 526.1 60.0 (4.8%)
Mar-19 SaaS ASX:WTC Working capital 6,900.9 335.7 (9.8%)
Mar-19 SaaS ASX:LVHAccelerate international expansion, balance
sheet flexibility155.7 15.0 (10.4%)
Apr-19Technology
enabled servicesASX:DUB Working capital, global growth 164.0 22.0 (21.1%)
May-19 Software ASX:BVS Working capital, acquisition strategy 1,274.0 165.0 (7.9%)
Apr-19 SaaS ASX:BTHWorking capital, product development/ R&D,
acquisitions strategy138.8 15.6 (21.5%)
May-19 Fintech ASX:SPT Working capital, product development/ R&D 0.9 30.3 (6.4%)
Jun-19 Technology H&E ASX:AD8 Accelerate growth 456.8 20.0 (5.9%)
Jun-19 Fintech ASX:APT Working capital 6,477.8 347.4 (4.8%)
Jun-19 Technology H&E ASX:BRN Working capital, product development/ R&D 71.6 10.7 (36.2%)

PRIVATE & CONFIDENTIAL | 35Source: Capital IQ, company filings, Blackpeak Capital. Market data as at 30 June 2021
1) Completed transactions
2) Trading day prior to issuance
3) Trading day prior to announcement
ANZ tech: Secondary capital raisings ( > A$10m raised)1
Advised by Blackpeak Capital
Overview Purposes Details
CompanyRaising
dateCategory Ticker Use of proceeds
Market cap at
issue (A$m)2Raising size
(A$m)
Premium (Discount)
to last close3
Sep-19 SaaS ASX:ELOWorking capital, product development/ R&D,
acquisition strategy390.1 70.0 (9.2%)
Sep-19 SaaS ASX:BTH Acquisition strategy 163.7 20.0 (10.0%)
Oct-19 SaaS ASX:EVSAccelerate international expansion, balance
sheet flexibility126.1 10.0 (13.8%)
Nov-19 Fintech ASX:EML Working capital, balance sheet flexibility 1,415.8 181.4 (6.2%)
Nov-19 Fintech ASX:Z1P Working capital, expansion 3.7 61.9 (2.2%)
Nov-19 Fintech ASX:APT Accelerate international expansion 8,208.3 200.0 (2.4%)
Jan-20 SaaS ASX:EVS Acquisition strategy 83.6 84.0 (23.1%)
Jan-20 IT services ASX:CGL Acquisition strategy 236.7 137.4 (5.5%)
Apr-20Technology
enabled servicesASX:NXT Working capital, product development/ R&D 3,961.8 863.7 (15.0%)
Apr-20 Technology H&E ASX:MP1 Working capital, product development/ R&D 1,488.4 72.5 (9.5%)
Apr-20 Software NZSE:VGL Working capital 235.7 61.4 (20.8%)
Apr-20 IT services ASX:RHP Working capital, acquisition strategy 231.2 33.8 (9.6%)
Apr-20 SaaS ASX:IFM Working capital, acquisition strategy 493.7 84.9 (11.8%)
PRIVATE & CONFIDENTIAL | 36
ANZ tech: Secondary capital raisings ( > A$10m raised)1
Advised by Blackpeak Capital
Overview Purposes Details
CompanyRaising
dateCategory Ticker Use of proceeds
Market cap at
issue (A$m)2Raising size
(A$m)
Premium (Discount)
to last close3
May-20 SaaS ASX:ELOWorking capital, product development/ R&D,
acquisition strategy526.6 70.0 (11.5%)
May-20Technology
enabled servicesASX:FCT Working capital 38.9 14.9 (25.0%)
May-20 SaaS ASX:BTH Working capital, acquisition strategy 225.6 35.0 (11.8%)
May-20 Fintech NZSE:SPY Working capital, balance sheet flexibility 105.1 13.0 (10.6%)
Jun-20 Software ASX:IRE Working capital, acquisition strategy 2,200.6 175.0 (7.0%)
Jun-20 Online/ digital ASX:KGN Working capital 1,254.2 115.0 (7.5%)
Jul-20 Fintech ASX:APT Working capital, acquisition strategy 17,692.1 783.5 (2.9%)
Jul-20 Technology H&E ASX:AD8Balance sheet flexibility, product
development/ R&D385.2 40.0 (9.5%)
Aug-20 Fintech ASX:SPT Working capital, product development/ R&D 530.8 100.1 (4.8%)
Aug-204 SaaS ASX:TDY Acquisition of Ansarada 27.8 45.0 n.a.
Aug-20 Software ASX:FCL Acquisition strategy 1,473.6 93.0 (7.2%)
Sep-20 Software NZSE:ERD Working capital, product development/ R&D 267.9 46.3 (10.3%)
Sep-20Technology
enabled servicesASX:NEA Working capital, product development/ R&D 1,117.3 95.2 (4.2%)
Oct-20 SaaS NZSE:SKO Working capital, acquisition strategy 401.0 63.5 (3.5%)
Source: Capital IQ, company filings, Blackpeak Capital. Market data as at 30 June 2021
1) Completed transactions
2) Trading day prior to issuance
3) Trading day prior to announcement
PRIVATE & CONFIDENTIAL | 37
ANZ tech: Secondary capital raisings ( > A$10m raised)1
Advised by Blackpeak Capital
Overview Purposes Details
CompanyRaising
dateCategory Ticker Use of proceeds
Market cap at
issue (A$m)2Raising size
(A$m)
Premium (Discount)
to last close3
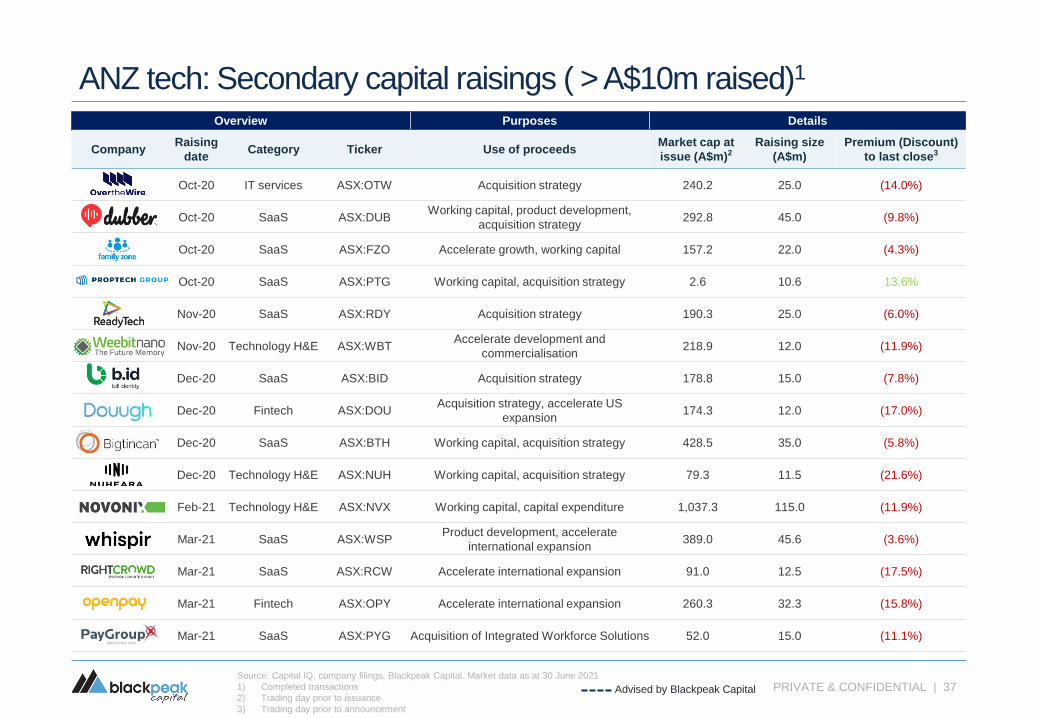
Oct-20 IT services ASX:OTW Acquisition strategy 240.2 25.0 (14.0%)
Oct-20 SaaS ASX:DUBWorking capital, product development,
acquisition strategy292.8 45.0 (9.8%)
Oct-20 SaaS ASX:FZO Accelerate growth, working capital 157.2 22.0 (4.3%)
Oct-20 SaaS ASX:PTG Working capital, acquisition strategy 2.6 10.6 13.6%
Nov-20 SaaS ASX:RDY Acquisition strategy 190.3 25.0 (6.0%)
Nov-20 Technology H&E ASX:WBTAccelerate development and
commercialisation 218.9 12.0 (11.9%)
Dec-20 SaaS ASX:BID Acquisition strategy 178.8 15.0 (7.8%)
Dec-20 Fintech ASX:DOUAcquisition strategy, accelerate US
expansion174.3 12.0 (17.0%)
Dec-20 SaaS ASX:BTH Working capital, acquisition strategy 428.5 35.0 (5.8%)
Dec-20 Technology H&E ASX:NUH Working capital, acquisition strategy 79.3 11.5 (21.6%)
Feb-21 Technology H&E ASX:NVX Working capital, capital expenditure 1,037.3 115.0 (11.9%)
Mar-21 SaaS ASX:WSPProduct development, accelerate
international expansion389.0 45.6 (3.6%)
Mar-21 SaaS ASX:RCW Accelerate international expansion 91.0 12.5 (17.5%)
Mar-21 Fintech ASX:OPY Accelerate international expansion 260.3 32.3 (15.8%)
Mar-21 SaaS ASX:PYG Acquisition of Integrated Workforce Solutions 52.0 15.0 (11.1%)
Source: Capital IQ, company filings, Blackpeak Capital. Market data as at 30 June 2021
1) Completed transactions
2) Trading day prior to issuance
3) Trading day prior to announcement
PRIVATE & CONFIDENTIAL | 38
ANZ tech: Secondary capital raisings ( > A$10m raised)1
Advised by Blackpeak Capital
Overview Purposes Details
CompanyRaising
dateCategory Ticker Use of proceeds
Market cap at
issue (A$m)2Raising size
(A$m)
Premium (Discount)
to last close3
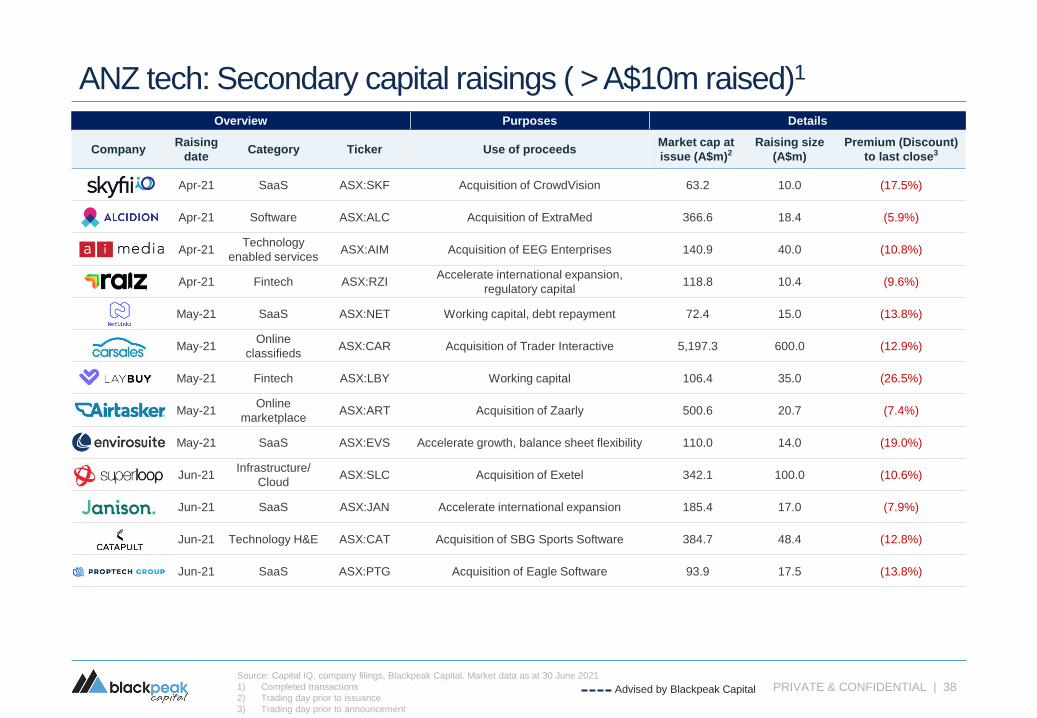
Apr-21 SaaS ASX:SKF Acquisition of CrowdVision 63.2 10.0 (17.5%)
Apr-21 Software ASX:ALC Acquisition of ExtraMed 366.6 18.4 (5.9%)
Apr-21Technology
enabled servicesASX:AIM Acquisition of EEG Enterprises 140.9 40.0 (10.8%)
Apr-21 Fintech ASX:RZIAccelerate international expansion,
regulatory capital118.8 10.4 (9.6%)
May-21 SaaS ASX:NET Working capital, debt repayment 72.4 15.0 (13.8%)
May-21Online
classifiedsASX:CAR Acquisition of Trader Interactive 5,197.3 600.0 (12.9%)
May-21 Fintech ASX:LBY Working capital 106.4 35.0 (26.5%)
May-21Online
marketplaceASX:ART Acquisition of Zaarly 500.6 20.7 (7.4%)
May-21 SaaS ASX:EVS Accelerate growth, balance sheet flexibility 110.0 14.0 (19.0%)
Jun-21Infrastructure/
CloudASX:SLC Acquisition of Exetel 342.1 100.0 (10.6%)
Jun-21 SaaS ASX:JAN Accelerate international expansion 185.4 17.0 (7.9%)
Jun-21 Technology H&E ASX:CAT Acquisition of SBG Sports Software 384.7 48.4 (12.8%)
Jun-21 SaaS ASX:PTG Acquisition of Eagle Software 93.9 17.5 (13.8%)
Source: Capital IQ, company filings, Blackpeak Capital. Market data as at 30 June 2021
1) Completed transactions
2) Trading day prior to issuance
3) Trading day prior to announcement

PRIVATE & CONFIDENTIAL | 39
ANZ tech: Private equity capital raisings

PRIVATE & CONFIDENTIAL | 40Source: Capital IQ, company filings, Blackpeak Capital. Market data as at 30 June 2021
1) Completed transactions, figures do not include announced deals that are incomplete
2) Total capital raised for private raisings > A$10m, figures do not include announced deals that are incomplete
▪ Once again, private market activity was strong in 2Q21, and
accounted for a large proportion of the overall capital raised
by ANZ tech companies
▪ Octopus Deploy, an automated deployment and release
management tool, raised $221m from US venture capital
fund Insight Ventures. The raising was the largest of the
quarter, and saw the firm move closer to unicorn status
▪ Likewise, SafetyCulture continued with its liquidity based
raising strategy, securing $99m in funding at a post-money
valuation of A$2.2bn
▪ ANZ Fintech was once again in favour with investors from
around the globe, with Athena ($90m), mx51 ($32.3m) and
Stake ($40m) all raising significant amounts. Likewise,
business banking fintech Zeller closed a $50m funding
round that valued the company at $400m
▪ Local VC fund raising activity was lower in the June quarter.
The only sizeable fundraising came from Tenacious
Ventures, which closed a $35m fund seeking to focus on
agri-tech investments
ANZ tech: Private capital raisings ( > A$10m raised)1
No. ANZ tech private capital raisings
Total ANZ tech private capital raised (A$m)2
Private raising activity was once again strong in 2Q21, with ANZ fintech drawing attention from
global strategic and financial investors
245.8 311.7225.9
720.1
1,168.5
1,717.2
1,226.6
CY15 CY16 CY17 CY18 CY19 CY20 YTD21
7
16
9
20
34 3532
CY15 CY16 CY17 CY18 CY19 CY20 YTD21

PRIVATE & CONFIDENTIAL | 41
ANZ tech: Private capital raisings ( > A$10m raised)1
Overview Details
CompanyRaising
dateInvestor(s)
Post-money
valuation (A$m)
Raising size
(A$m)
Jan-19 Blackbird Ventures; Sequoia Capital; CSIRO 45.7
Jan-19 ANU Connect Ventures; Anzu Partners 11.4
Feb-19 Sequoia Capital; Right Click Capital; AirTree Ventures; Qualgro Partners; Atami Capital 27.9
Mar-19 SEEK; Y Combinator; M12; Larsen Ventures 30.0
Mar-19 Blackbird Ventures; Costanoa Venture Capital; M12 39.5
Mar-19Gobi Partners; Tencent; Horizons Ventures; Hillhouse Capital; Sequoia Capital;
DST Global; Square Peg Capital1,406.9 140.7
Apr-19 Arrowroot Capital Management 14.0
Apr-19 Australian Renewable Energy Agency 10.0
Apr-19 Herbert Smith Freehills; Cibus Group; Acorn Capital 15.0
Apr-19 Nexus Venture Partners; Blackbird Ventures; K1W1 14.1
May-19New Zealand Venture Investment Fund; Finistere Ventures; Yamaha Motor Ventures & Laboratory
Silicon Valley; Inception Asset Management12.6
May-19 General Catalyst Partners; Felicis Ventures; Blackbird Ventures; Bond Ventures 3,600.0 101.0
May-19Uniseed; Blackbird Ventures; Clean Energy Finance Corporation; Right Click Capital; CSIRO;
Skip Capital
Jun-19 Gallagher Australia 14.8
Source: Capital IQ, company filings, Blackpeak Capital. Market data as at 30 June 2021
1) Completed transactions with disclosed transaction values Advised by Blackpeak Capital
PRIVATE & CONFIDENTIAL | 42
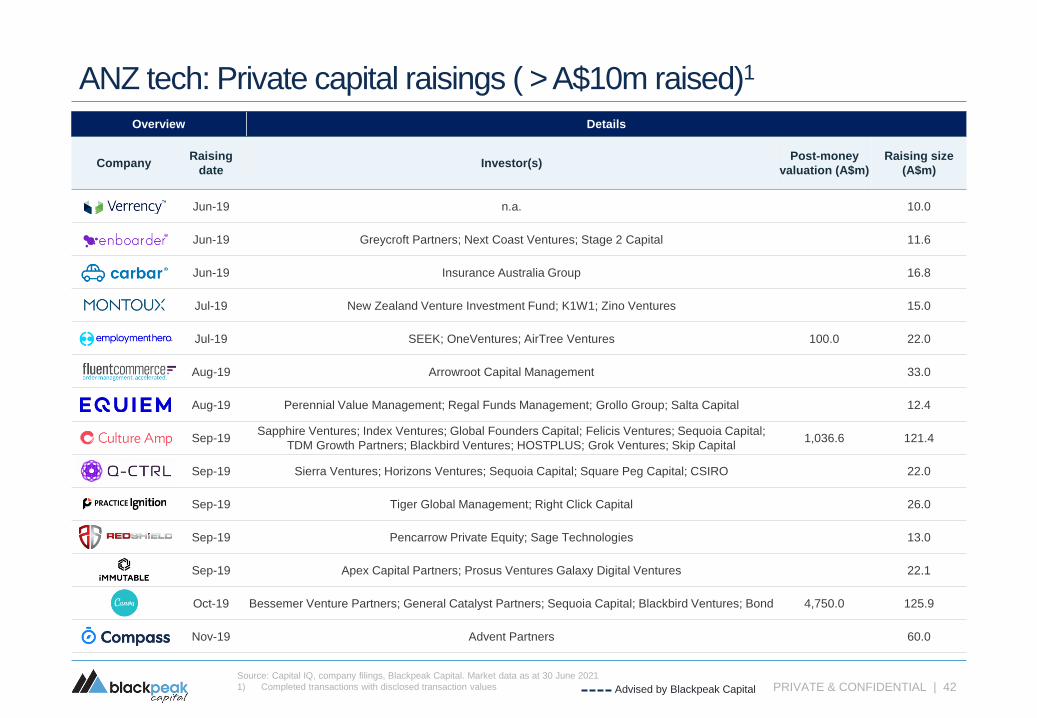
ANZ tech: Private capital raisings ( > A$10m raised)1
Overview Details
CompanyRaising
dateInvestor(s)
Post-money
valuation (A$m)
Raising size
(A$m)
Jun-19 n.a. 10.0
Jun-19 Greycroft Partners; Next Coast Ventures; Stage 2 Capital 11.6
Jun-19 Insurance Australia Group 16.8
Jul-19 New Zealand Venture Investment Fund; K1W1; Zino Ventures 15.0
Jul-19 SEEK; OneVentures; AirTree Ventures 100.0 22.0
Aug-19 Arrowroot Capital Management 33.0
Aug-19 Perennial Value Management; Regal Funds Management; Grollo Group; Salta Capital 12.4
Sep-19Sapphire Ventures; Index Ventures; Global Founders Capital; Felicis Ventures; Sequoia Capital;
TDM Growth Partners; Blackbird Ventures; HOSTPLUS; Grok Ventures; Skip Capital1,036.6 121.4
Sep-19 Sierra Ventures; Horizons Ventures; Sequoia Capital; Square Peg Capital; CSIRO 22.0
Sep-19 Tiger Global Management; Right Click Capital 26.0
Sep-19 Pencarrow Private Equity; Sage Technologies 13.0
Sep-19 Apex Capital Partners; Prosus Ventures Galaxy Digital Ventures 22.1
Oct-19 Bessemer Venture Partners; General Catalyst Partners; Sequoia Capital; Blackbird Ventures; Bond 4,750.0 125.9
Nov-19 Advent Partners 60.0
Source: Capital IQ, company filings, Blackpeak Capital. Market data as at 30 June 2021
1) Completed transactions with disclosed transaction values Advised by Blackpeak Capital
PRIVATE & CONFIDENTIAL | 43
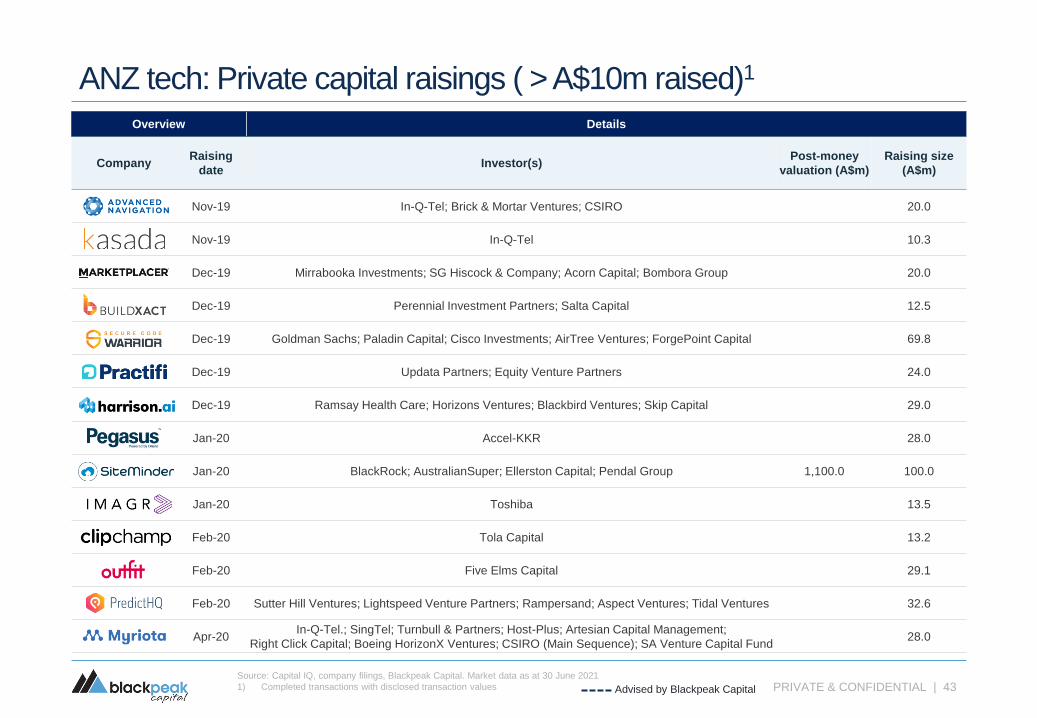
ANZ tech: Private capital raisings ( > A$10m raised)1
Overview Details
CompanyRaising
dateInvestor(s)
Post-money
valuation (A$m)
Raising size
(A$m)
Nov-19 In-Q-Tel; Brick & Mortar Ventures; CSIRO 20.0
Nov-19 In-Q-Tel 10.3
Dec-19 Mirrabooka Investments; SG Hiscock & Company; Acorn Capital; Bombora Group 20.0
Dec-19 Perennial Investment Partners; Salta Capital 12.5
Dec-19 Goldman Sachs; Paladin Capital; Cisco Investments; AirTree Ventures; ForgePoint Capital 69.8
Dec-19 Updata Partners; Equity Venture Partners 24.0
Dec-19 Ramsay Health Care; Horizons Ventures; Blackbird Ventures; Skip Capital 29.0
Jan-20 Accel-KKR 28.0
Jan-20 BlackRock; AustralianSuper; Ellerston Capital; Pendal Group 1,100.0 100.0
Jan-20 Toshiba 13.5
Feb-20 Tola Capital 13.2
Feb-20 Five Elms Capital 29.1
Feb-20 Sutter Hill Ventures; Lightspeed Venture Partners; Rampersand; Aspect Ventures; Tidal Ventures 32.6
Apr-20In-Q-Tel.; SingTel; Turnbull & Partners; Host-Plus; Artesian Capital Management;
Right Click Capital; Boeing HorizonX Ventures; CSIRO (Main Sequence); SA Venture Capital Fund28.0
Source: Capital IQ, company filings, Blackpeak Capital. Market data as at 30 June 2021
1) Completed transactions with disclosed transaction values Advised by Blackpeak Capital

PRIVATE & CONFIDENTIAL | 44
ANZ tech: Private capital raisings ( > A$10m raised)1
Overview Details
CompanyRaising
dateInvestor(s)
Post-money
valuation (A$m)
Raising size
(A$m)
Apr-20 Index Ventures; TDM Growth Partners; Blackbird Ventures; Skip Capital 1,300.0 60.5
Apr-20Horizons Ventures; Hillhouse Capital Management; Sequoia Capital; Tencent; DST Global;
Salesforce Ventures; ANZi Ventures3,389.6 391.1
May-20 Navegar 31.2
May-20 Norwest Venture Partners; Northgate Capital Group; The Four Rivers Group 27.1
May-20 Yamaha Motor Ventures & Laboratory Silicon Valley; Bosch 11.0
May-20Madrona Venture Group; SEEK; M12; Salesforce Ventures; Our Innovation Fund;
Madrona Acceleration Fund61.5
May-20 Washington H. Soul Pattinson and Company 30.5
Jun-20 Reinventure Group; Ten Eleven Ventures; CSIRO (Main Sequence) 14.4
Jun-20 Advent Partners > 10.0
Jun-20 General Catalyst Partners; Felicis Ventures; Sequoia Capital; Blackbird Ventures; Bond Capital 8,694.0 86.9
Jun-20 n.a. 12.0
Jul-20 Blackbird Ventures; Costanoa Venture Capital 25.3
Aug-20 General Catalyst Partners; OpenView Advisors 200.0 28.0
Source: Capital IQ, company filings, Blackpeak Capital. Market data as at 30 June 2021
1) Completed transactions with disclosed transaction values Advised by Blackpeak Capital
PRIVATE & CONFIDENTIAL | 45
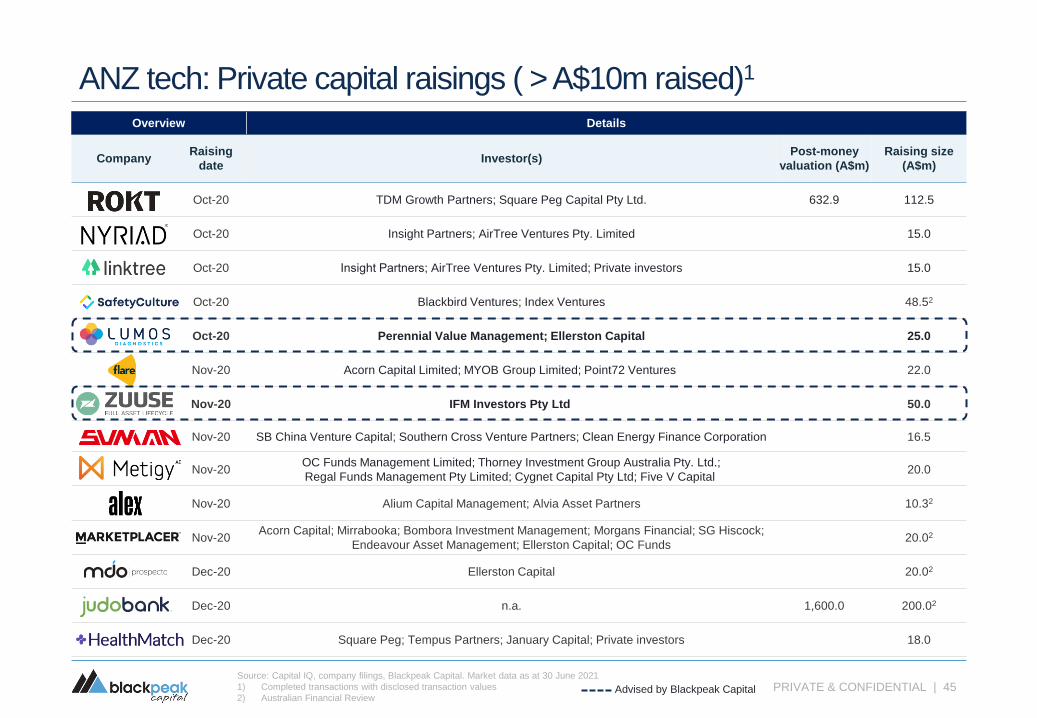
ANZ tech: Private capital raisings ( > A$10m raised)1
Overview Details
CompanyRaising
dateInvestor(s)
Post-money
valuation (A$m)
Raising size
(A$m)
Oct-20 TDM Growth Partners; Square Peg Capital Pty Ltd. 632.9 112.5
Oct-20 Insight Partners; AirTree Ventures Pty. Limited 15.0
Oct-20 Insight Partners; AirTree Ventures Pty. Limited; Private investors 15.0
Oct-20 Blackbird Ventures; Index Ventures 48.52
Oct-20 Perennial Value Management; Ellerston Capital 25.0
Nov-20 Acorn Capital Limited; MYOB Group Limited; Point72 Ventures 22.0
Nov-20 IFM Investors Pty Ltd 50.0
Nov-20 SB China Venture Capital; Southern Cross Venture Partners; Clean Energy Finance Corporation 16.5
Nov-20OC Funds Management Limited; Thorney Investment Group Australia Pty. Ltd.;
Regal Funds Management Pty Limited; Cygnet Capital Pty Ltd; Five V Capital20.0
Nov-20 Alium Capital Management; Alvia Asset Partners 10.32
Nov-20Acorn Capital; Mirrabooka; Bombora Investment Management; Morgans Financial; SG Hiscock;
Endeavour Asset Management; Ellerston Capital; OC Funds20.02
Dec-20 Ellerston Capital 20.02
Dec-20 n.a. 1,600.0 200.02
Dec-20 Square Peg; Tempus Partners; January Capital; Private investors 18.0
Source: Capital IQ, company filings, Blackpeak Capital. Market data as at 30 June 2021
1) Completed transactions with disclosed transaction values
2) Australian Financial ReviewAdvised by Blackpeak Capital
PRIVATE & CONFIDENTIAL | 46
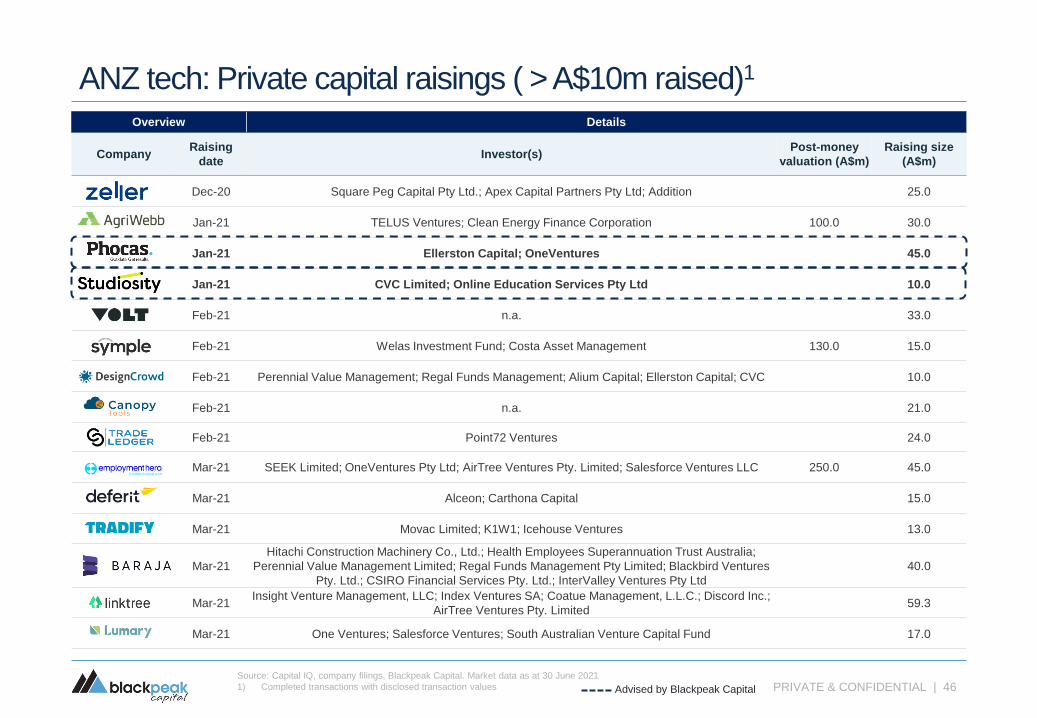
ANZ tech: Private capital raisings ( > A$10m raised)1
Overview Details
CompanyRaising
dateInvestor(s)
Post-money
valuation (A$m)
Raising size
(A$m)
Dec-20 Square Peg Capital Pty Ltd.; Apex Capital Partners Pty Ltd; Addition 25.0
Jan-21 TELUS Ventures; Clean Energy Finance Corporation 100.0 30.0
Jan-21 Ellerston Capital; OneVentures 45.0
Jan-21 CVC Limited; Online Education Services Pty Ltd 10.0
Feb-21 n.a. 33.0
Feb-21 Welas Investment Fund; Costa Asset Management 130.0 15.0
Feb-21 Perennial Value Management; Regal Funds Management; Alium Capital; Ellerston Capital; CVC 10.0
Feb-21 n.a. 21.0
Feb-21 Point72 Ventures 24.0
Mar-21 SEEK Limited; OneVentures Pty Ltd; AirTree Ventures Pty. Limited; Salesforce Ventures LLC 250.0 45.0
Mar-21 Alceon; Carthona Capital 15.0
Mar-21 Movac Limited; K1W1; Icehouse Ventures 13.0
Mar-21
Hitachi Construction Machinery Co., Ltd.; Health Employees Superannuation Trust Australia;
Perennial Value Management Limited; Regal Funds Management Pty Limited; Blackbird Ventures
Pty. Ltd.; CSIRO Financial Services Pty. Ltd.; InterValley Ventures Pty Ltd
40.0
Mar-21Insight Venture Management, LLC; Index Ventures SA; Coatue Management, L.L.C.; Discord Inc.;
AirTree Ventures Pty. Limited59.3
Mar-21 One Ventures; Salesforce Ventures; South Australian Venture Capital Fund 17.0
Source: Capital IQ, company filings, Blackpeak Capital. Market data as at 30 June 2021
1) Completed transactions with disclosed transaction values Advised by Blackpeak Capital

PRIVATE & CONFIDENTIAL | 47
ANZ tech: Private capital raisings ( > A$10m raised)1
Overview Details
CompanyRaising
dateInvestor(s)
Post-money
valuation (A$m)
Raising size
(A$m)
Apr-21T. Rowe Price Group, Inc.; Blackbird Ventures Pty. Ltd.; Dragoneer Investment Group, LLC; Skip
Enterprises Pty Limited19,656.0 93.0
Apr-21 AirTree Ventures Pty. Limited; TEN13 Management Pty Ltd 11.0
Apr-21 Insight Venture Management, LLC 221.0
Apr-21 Blackbird Ventures Pty. Ltd. 29.7
Apr-21 333 Capital, Investment Arm; NCN Investments Pty Ltd; Our Innovation Fund, LP; Kin Group 10.9
May-21Insight Venture Management, LLC; Index Ventures SA; Tiger Global Management LLC; Blackbird
Ventures Pty. Ltd.2,200.0 99.0
May-21 Moelis Australia Limited (nka:MA Financial Group Limited) 15.0
May-21
Sunsuper Pty Ltd; AustralianSuper; AustralianSuper Pty. Ltd.; Host-Plus Pty. Limited; Macquarie
Bank Limited, Investment Arm; Square Peg Capital Pty. Ltd.; AirTree Ventures Pty. Limited;
Salesforce Ventures, LLC; Apex Capital Partners Pty Ltd
90.0
May-21 Tiger Global Management LLC; DST Global 40.0
May-21
ANU Connect Ventures Pty Ltd; Moelis Australia Asset Management Ltd; Anzu Partners; F1
Solutions, Inc.; Moelis Australia Asset Management Limited - Moelis Australia Growth Capital Fund
II
17.7
May-21 Tola Capital, LLC; Fifth Wall Ventures Management, LLC; Ironspring Ventures 25.8
May-21 Artesian Capital; Mastercard Incorporated; Acorn Capital Limited; Commencer Capital Pty Ltd 32.3
May-21 n.a. 12.8
Source: Capital IQ, company filings, Blackpeak Capital. Market data as at 30 June 2021
1) Completed transactions with disclosed transaction values Advised by Blackpeak Capital

PRIVATE & CONFIDENTIAL | 48
ANZ tech: Private capital raisings ( > A$10m raised)1
Overview Details
CompanyRaising
dateInvestor(s)
Post-money
valuation (A$m)
Raising size
(A$m)
Jun-21 Perennial Value Management Limited; Tidal Ventures 16.0
Jun-21 n.a. 31.0
Jun-21 BMY Group, Investment Arm 19.4
Jun-21Spark Capital Partners, LLC; Square Peg Capital Pty. Ltd.; Apex Capital Partners Pty Ltd; Addition
Ventures LLC400.0 50.0
Jun-21 ASX Limited; AirTree Ventures Pty. Limited 33.0
Source: Capital IQ, company filings, Blackpeak Capital. Market data as at 30 June 2021
1) Completed transactions with disclosed transaction values Advised by Blackpeak Capital
PRIVATE & CONFIDENTIAL | 49Source: Australian Investment Council Yearbook 2021. Released annually in May or June.
Significant increase in Australian VC fund raisings allows more capital to be deployed locally
ANZ tech: Australia venture capital fund activities
No. Australia venture capital funds closed No. Australia venture capital deals
Total venture capital funds raised (A$m) Total value of venture capital deals (A$bn)
8
6
15
1211
6
10
CY14 CY15 CY16 CY17 CY18 CY19 CY20
99
158168
212
189 189
149
CY14 CY15 CY16 CY17 CY18 CY19 CY20
0.3
0.90.8
1.3
2.52.3
2.4
CY14 CY15 CY16 CY17 CY18 CY19 CY20
105
430
1,066
444
1,202
735
1329.0
CY14 CY15 CY16 CY17 CY18 CY19 CY20

Overview Details
Venture capital fund Raising date Raising size (A$m)
Mar-19 50.0
Apr-19 45.0
May-19 250.0
Jun-19 340.0
Jul-192 29.0
Oct-19 22.0
Oct-19 50.0
Oct-19 275.0
Jun-20 350.0
Jul-20 80.0
Jul-20 30.0
Aug-20 500.0
Nov-20 10.0
Dec-20 50.0
Dec-20 600.0
Feb-21 80.0
Mar-21 55.0
Mar-21 21.0
May-21 35.0
PRIVATE & CONFIDENTIAL | 50Source: Crunchbase, Australian Financial Review, Capital IQ, company filings, Blackpeak Capital.
1) Completed transactions
2) New Zealand fund, NZ$30m
ANZ tech: Selected ANZ venture capital fund raisings1
Overview Details
Venture capital fund Raising date Raising size (A$m)
Jan-17 > 50.0
Feb-17 50.0
Mar-17 20.0
Mar-17 234.0
Jul-17 100.0
Jul-17 50.0
Jun-17 200.0
Aug-17 100.0
Sep-17 40.0
Apr-18 261.0
May-18 > 10.0
May-18 50.0
May-18 10.0
Jun-18 > 150.0
Aug-18 100.0
Sep-18 100.0
Oct-18 55.0
Late 2018 50.0
Feb-19 35.0
Feb-19 50.0

PRIVATE & CONFIDENTIAL | 51
ANZ tech: Mergers and acquisitions
PRIVATE & CONFIDENTIAL | 52Source: Capital IQ, company filings, Blackpeak Capital. Market data as at 30 June 2021
1) Completed transactions, figures do not include announced deals that are incomplete
ANZ tech: Mergers and acquisitions
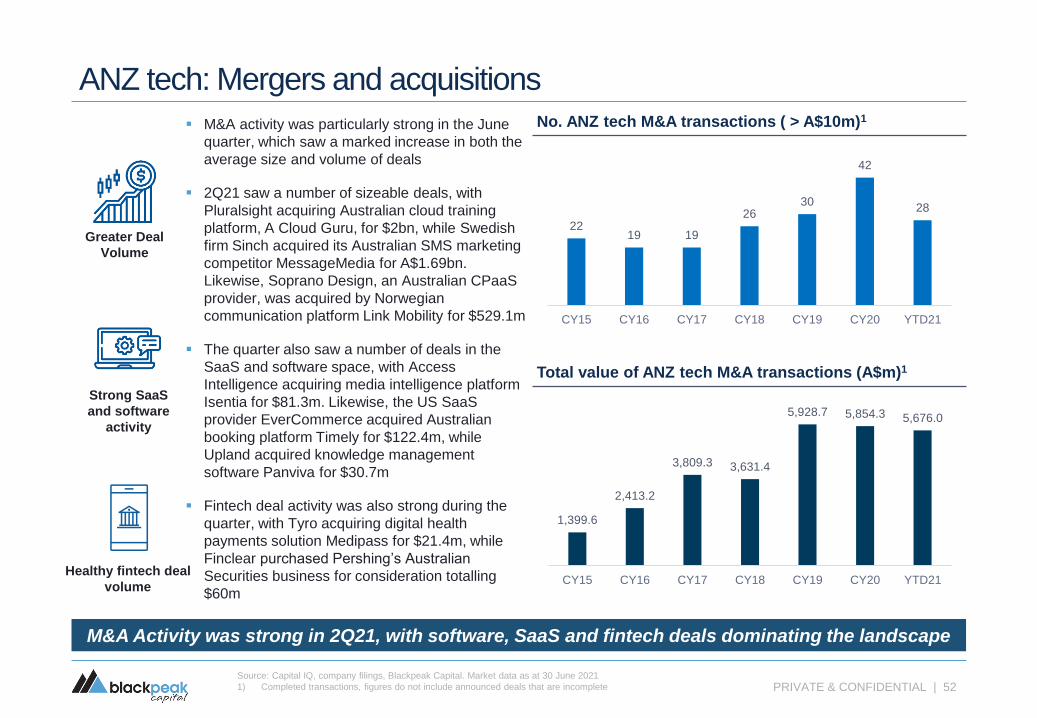
M&A Activity was strong in 2Q21, with software, SaaS and fintech deals dominating the landscape
Strong SaaS
and software
activity
▪ M&A activity was particularly strong in the June
quarter, which saw a marked increase in both the
average size and volume of deals
▪ 2Q21 saw a number of sizeable deals, with
Pluralsight acquiring Australian cloud training
platform, A Cloud Guru, for $2bn, while Swedish
firm Sinch acquired its Australian SMS marketing
competitor MessageMedia for A$1.69bn.
Likewise, Soprano Design, an Australian CPaaS
provider, was acquired by Norwegian
communication platform Link Mobility for $529.1m
▪ The quarter also saw a number of deals in the
SaaS and software space, with Access
Intelligence acquiring media intelligence platform
Isentia for $81.3m. Likewise, the US SaaS
provider EverCommerce acquired Australian
booking platform Timely for $122.4m, while
Upland acquired knowledge management
software Panviva for $30.7m
▪ Fintech deal activity was also strong during the
quarter, with Tyro acquiring digital health
payments solution Medipass for $21.4m, while
Finclear purchased Pershing’s Australian
Securities business for consideration totalling
$60m
No. ANZ tech M&A transactions ( > A$10m)1
Total value of ANZ tech M&A transactions (A$m)1
Healthy fintech deal
volume
Greater Deal
Volume
2219 19
2630
42
28
CY15 CY16 CY17 CY18 CY19 CY20 YTD21
1,399.6
2,413.2
3,809.3 3,631.4
5,928.7 5,854.3 5,676.0
CY15 CY16 CY17 CY18 CY19 CY20 YTD21

Transaction overview Multiples
Target Date Acquirer Transaction value (A$m)2 EV/ LTM revenue EV/ LTM EBITDA
Jan-19 373.5 n.a. n.a.
Asia Pacific Data Center Feb-19 252.7 n.a. n.a.
Feb-19 163.4 0.8x 11.5x
Feb-19 97.6 6.4x n.a.
Mar-19 14.1 n.a. n.a.
May-19 43.2 n.a. n.a.
May-19 21.3 1.3x 5.5x
Jun-19 13.4 2.4x n.a.
Jun-19 135.0 2.4x n.a.
Jun-19 20.0 n.a. n.a.
Jul-19 243.8 2.4x 14.1x
New Zealand Aug-19 3,384.2 n.a. n.a.
Aug-19 68.7 n.a. n.a.
Aug-19 50.0 n.a. n.a.
PRIVATE & CONFIDENTIAL | 53
ANZ tech: Mergers and acquisitions ( > A$10m)1
Advised by Blackpeak Capital
Source: Capital IQ, Mergermarket, company filings, Blackpeak Capital. Market data as at 30 June 2021
1) Completed transactions unless otherwise indicated
2) Transaction values include potential earnouts
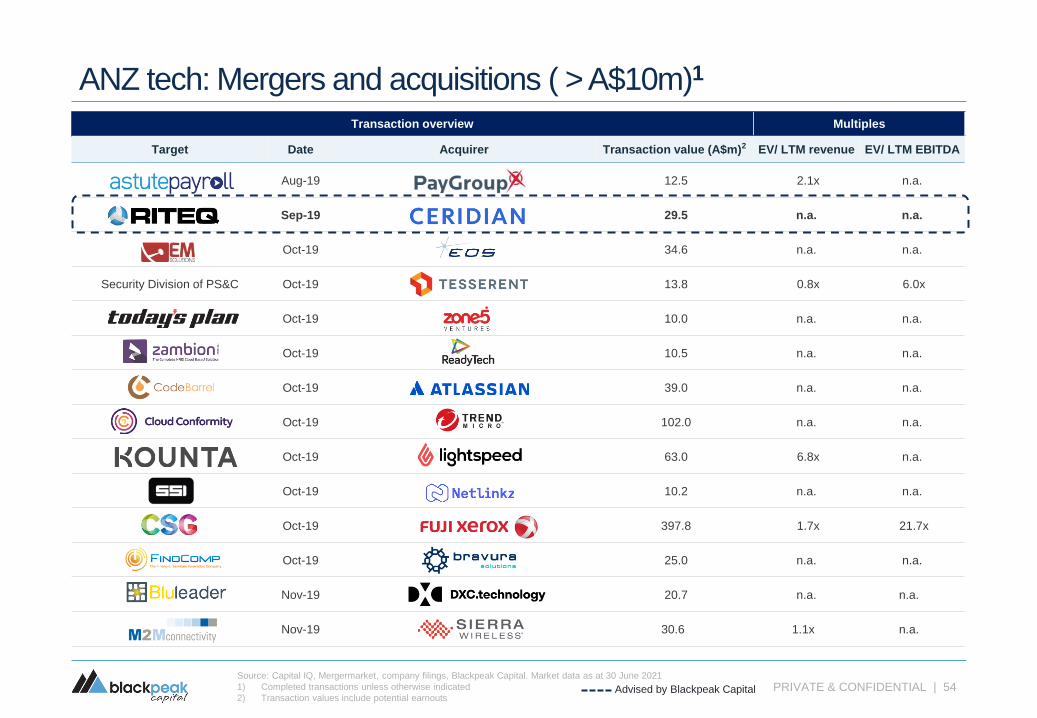
Transaction overview Multiples
Target Date Acquirer Transaction value (A$m)2 EV/ LTM revenue EV/ LTM EBITDA
Aug-19 12.5 2.1x n.a.
Sep-19 29.5 n.a. n.a.
Oct-19 34.6 n.a. n.a.
Security Division of PS&C Oct-19 13.8 0.8x 6.0x
Oct-19 10.0 n.a. n.a.
Oct-19 10.5 n.a. n.a.
Oct-19 39.0 n.a. n.a.
Oct-19 102.0 n.a. n.a.
Oct-19 63.0 6.8x n.a.
Oct-19 10.2 n.a. n.a.
Oct-19 397.8 1.7x 21.7x
Oct-19 25.0 n.a. n.a.
Nov-19 20.7 n.a. n.a.
Nov-19 30.6 1.1x n.a.
PRIVATE & CONFIDENTIAL | 54
ANZ tech: Mergers and acquisitions ( > A$10m)1
Advised by Blackpeak Capital
Source: Capital IQ, Mergermarket, company filings, Blackpeak Capital. Market data as at 30 June 2021
1) Completed transactions unless otherwise indicated
2) Transaction values include potential earnouts

Transaction overview Multiples
Target Date Acquirer Transaction value (A$m)2 EV/ LTM revenue EV/ LTM EBITDA
Nov-19 35.0 n.a. n.a.
Jan-20 ~ 2,640.0 n.a. n.a.
Jan-20 36.3 n.a. n.a.
Jan-20 109.8 2.1x n.a.
Jan-20 18.2 9.3x n.a.
Jan-20 25.0 n.a. n.a.
Enterprise Division Feb-20 35.0 n.a. n.a.
Feb-20 20.0 n.a. n.a.
Mar-20 14.0 n.a. n.a.
Mar-20 10.0 n.a. n.a.
Mar-20First Credit Union; CRX Investments;
Police and Families Credit Union12.3 1.2x 16.8x
Jun-20 14.0 n.a. n.a.
Jun-20 27.5 1.9x n.a.
Jul-20 18.5 n.a. n.a.
Jul-20 61.9 12.7x n.a.
PRIVATE & CONFIDENTIAL | 55
ANZ tech: Mergers and acquisitions ( > A$10m)1
Advised by Blackpeak Capital
Source: Capital IQ, Mergermarket, company filings, Blackpeak Capital. Market data as at 30 June 2021
1) Completed transactions unless otherwise indicated
2) Transaction values include potential earnouts

Transaction overview Multiples
Target Date Acquirer Transaction value (A$m)2 EV/ LTM revenue EV/ LTM EBITDA
Jul-20 15.0 2.7x n.a.
Aug-20 16.6 n.a. n.a.
Clayton
Data CentreAug-20 416.7 n.a. n.a.
Aug-20 52.5 n.a. n.a.
Aug-20 194.1 3.0x 11.5x
Aug-20 n.a. n.a. n.a.
Reliance IT/ Beachhead Group/
Altitude ITAug-20 10.4 0.9x n.a.
Aug-20 15.0 0.6x 5.6x
Aug-20 30.0 n.a. n.a.
Sep-20 79.2 1.2x 4.2x
Sep-20 503.1 4.2x 17.4x
Sep-20 39.7 n.a. n.a.
Sep-20 203.0 1.1x 6.6x
PRIVATE & CONFIDENTIAL | 56
ANZ tech: Mergers and acquisitions ( > A$10m)1
Advised by Blackpeak Capital
Source: Capital IQ, Mergermarket, company filings, Blackpeak Capital. Market data as at 30 June 2021
1) Completed transactions unless otherwise indicated
2) Transaction values include potential earnouts
3) Transaction announced

Transaction overview Multiples
Target Date Acquirer Transaction value (A$m)2 EV/ LTM revenue EV/ LTM EBITDA
Sep-20 16.0 0.7x 5.7x
Oct-20 39.0 2.1x 7.3x
Oct-20 45.0 n.a. n.a.
Oct-20 44.0 n.a. n.a.
Oct-20 25.0 n.a. n.a.
Oct-20 14.3 1.3x n.a.
Oct-20 41.5 1.1x n.a.
Nov-20 56.0 n.a. n.a.
Nov-20 112.6 0.8x 7.2x
Nov-20 19.5 n.a. n.a.
Dec-20 22.5 1.0x 9.8x
Dec-20 122.4 1.0x 12.4x
Property
DivisionDec-20 91.0 n.a. n.a.
PRIVATE & CONFIDENTIAL | 57
ANZ tech: Mergers and acquisitions ( > A$10m)1
Advised by Blackpeak Capital
Source: Capital IQ, Mergermarket, company filings, Blackpeak Capital. Market data as at 30 June 2021
1) Completed transactions unless otherwise indicated
2) Transaction values include potential earnouts
3) Transaction announced

Transaction overview Multiples
Target Date Acquirer Transaction value (A$m)2 EV/ LTM revenue EV/ LTM EBITDA
Dec-20 58.3 7.4x 58.3x
Dec-20 39.1 n.a. n.a.
Jan-21 308.94 n.a. n.a.
Feb-21 13.0 2.6x 4.3x
Feb-21 n.a. n.a. n.a.
Feb-21 16.5 n.a. n.a.
Feb-21 40.0 n.a. n.a.
Mar-21 ~300.05 n.a. n.a.
Managed Security
Services BusinessMar-21 22.3 2.5x 5.3x
Mar-21 59.7 n.a. n.a.
Mar-21 102.0 n.a. n.a.
Mar-21 153.86 n.a. n.a.
Mar-21 17.3 3.6x n.a.
Apr-21 n.a. n.a. n.a.
PRIVATE & CONFIDENTIAL | 58
ANZ tech: Mergers and acquisitions ( > A$10m)1
Advised by Blackpeak Capital
Source: Capital IQ, Mergermarket, company filings, Blackpeak Capital. Market data as at 30 June 2021
1) Completed transactions unless otherwise indicated
2) Transaction values include potential earnouts
3) Transaction announced
4) Cognizant 2020 10-K report, Note 20 – Preliminary purchase price of $240m converted to AUD
5) The Australian – March 16 2021
6) Times of India – 1 April 2021

Transaction overview Multiples
Target Date Acquirer Transaction value (A$m)2 EV/ LTM revenue EV/ LTM EBITDA
May-21 30.0 n.a. n.a.
May-21 21.4 12.5x n.a.
May-21 128.9 n.a. n.a.
May-21 529.1 n.a. n.a.
May-21 40-50 n.a. n.a.
May-21 99.5 66.7x n.a.
Jun-21 2,000.0 n.a. n.a.
Jun-21 n.a. n.a. n.a.
Jun-21 18.1 n.a. n.a.
Jun-21 110.0 0.7x 9.9x
Jun-21 1,688.2 8.5x 25.3x
Securities
AustraliaJun-21 60.0 n.a. n.a.
Jun-21 81.3 0.7x 7.9x
Jun-21 10.4 n.a. n.a.
Jun-21 30.7 n.a. n.a.
Median 2.1x 9.5x
PRIVATE & CONFIDENTIAL | 59
ANZ tech: Mergers and acquisitions ( > A$10m)1
Advised by Blackpeak Capital
Source: Capital IQ, Mergermarket, company filings, Blackpeak Capital. Market data as at 30 June 2021
1) Completed transactions unless otherwise indicated
2) Transaction values include potential earnouts
3) Transaction announced

PRIVATE & CONFIDENTIAL | 60
ANZ tech: Selected private equity acquisitions1
Transaction overview Multiples
Target Date Acquirer Transaction value (A$m)2 EV/ LTM revenue EV/ LTM EBITDA
Sep-18 n.a. n.a. n.a.
Sep-18 n.a. n.a. n.a.
Oct-18 2,071.7 5.6x 18.5x
Oct-18 n.a. n.a. n.a.
Dec-18 n.a. n.a. n.a.
Dec-18 n.a. n.a. n.a.
Mar-19 n.a. n.a. n.a.
Apr-19 n.a. n.a. n.a.
Jun-19 n.a. n.a. n.a.
Jul-19 n.a. n.a. n.a.
Aug-19 n.a. n.a. n.a.
Aug-19 n.a. n.a. n.a.
Advised by Blackpeak Capital
Source: Capital IQ, Mergermarket, company filings, Blackpeak Capital. Market data as at 30 June 2021
1) Completed transactions unless otherwise indicated
2) Transaction values include potential earnouts
3) Transaction announced
PRIVATE & CONFIDENTIAL | 61
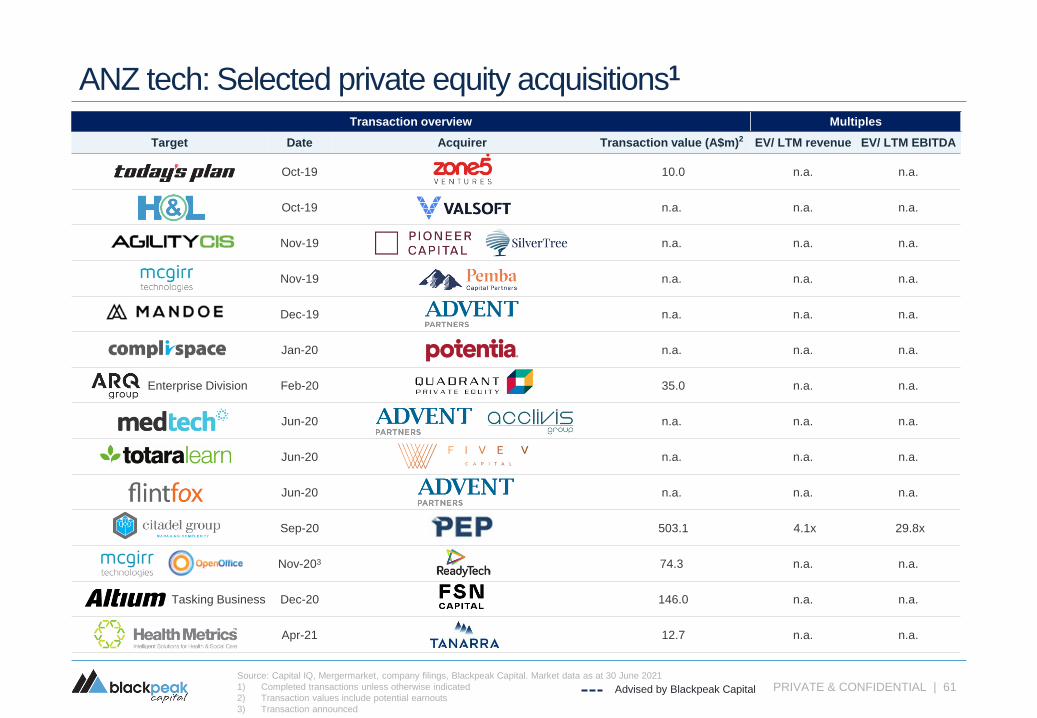
ANZ tech: Selected private equity acquisitions1
Transaction overview Multiples
Target Date Acquirer Transaction value (A$m)2 EV/ LTM revenue EV/ LTM EBITDA
Oct-19 10.0 n.a. n.a.
Oct-19 n.a. n.a. n.a.
Nov-19 n.a. n.a. n.a.
Nov-19 n.a. n.a. n.a.
Dec-19 n.a. n.a. n.a.
Jan-20 n.a. n.a. n.a.
Enterprise Division Feb-20 35.0 n.a. n.a.
Jun-20 n.a. n.a. n.a.
Jun-20 n.a. n.a. n.a.
Jun-20 n.a. n.a. n.a.
Sep-20 503.1 4.1x 29.8x
Nov-203 74.3 n.a. n.a.
Tasking Business Dec-20 146.0 n.a. n.a.
Apr-21 12.7 n.a. n.a.
Advised by Blackpeak Capital
Source: Capital IQ, Mergermarket, company filings, Blackpeak Capital. Market data as at 30 June 2021
1) Completed transactions unless otherwise indicated
2) Transaction values include potential earnouts
3) Transaction announced
PRIVATE & CONFIDENTIAL | 62
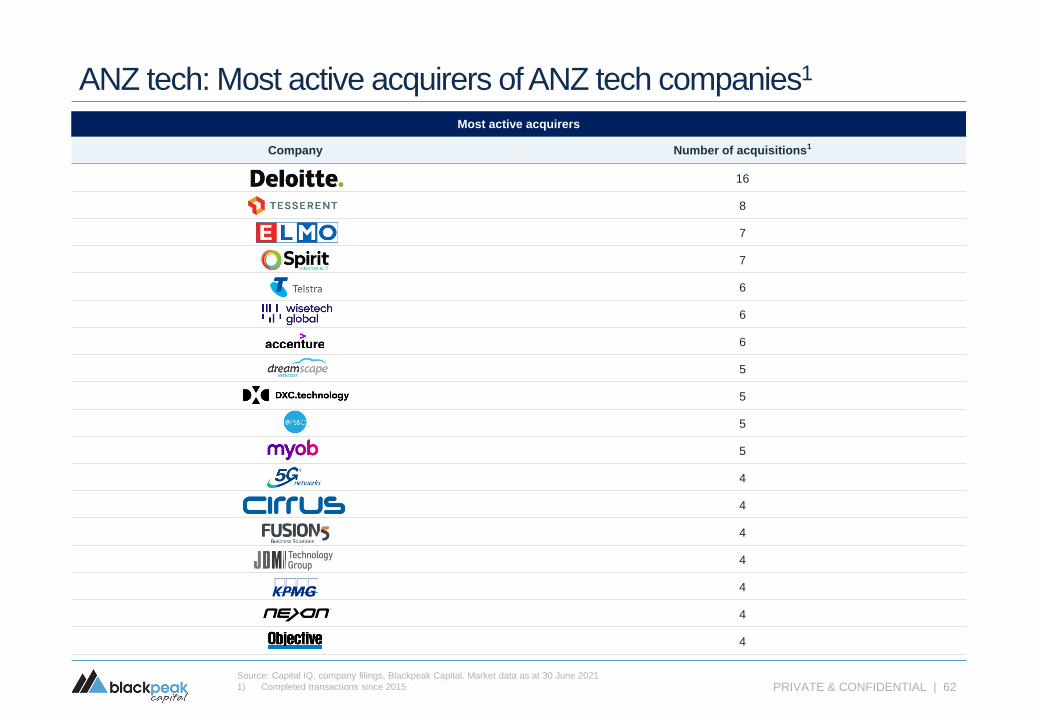
ANZ tech: Most active acquirers of ANZ tech companies1
Most active acquirers
Company Number of acquisitions1
16
8
7
7
6
6
6
5
5
5
5
4
4
4
4
4
4
4
Source: Capital IQ, company filings, Blackpeak Capital. Market data as at 30 June 2021
1) Completed transactions since 2015

PRIVATE & CONFIDENTIAL | 63
US tech: M&A and equity capital raisings

PRIVATE & CONFIDENTIAL | 64Source: Capital IQ, company filings, Blackpeak Capital. Market data as at 30 June 2021
1) Completed transactions with disclosed transaction values > A$10m
2) Completed transactions with amount raised > A$100m
3) CNBC
▪ The US economic recovery continued in
2Q21 with 850,000 jobs being added in
June and a vaccine rollout that has seen
over 55% of the population receive at least
one dose
▪ Nonetheless, uncertainty is increasing due
to larger than expected inflation figures as
well as the global spread of the highly
infectious COVID-19 delta variant
▪ Activity in the US tech sector was steady
in the June quarter, with strong IPO
activity being offset by a weaker period for
M&A and secondary raisings
▪ Once again tech IPOs dominated the
financial news, with multiple tech
companies raising over A$1bn on debut
(SentinelOne, Confluent and Marqeta)
▪ The June quarter saw some of the heat
come out of the booming SPAC market.
Whereas SPAC issuances accounted for
over 75% of all US IPOs in 1Q21, this
number dipped to 20% in April and has
only rebounded to 50% in June3
Record tech capital market activity has been offset by a decline in M&A activity
Economic
Recovery
Tech IPOs &
SPACs
US tech: Market themesMean and median tech M&A transaction values (A$m)1
Mean and median tech IPO’s raising size (A$m)2COVID-19
uncertainty
reemerges
63 86 81 103 101 106 107
1,007
784
342
934
1,210
645
465
CY15 CY16 CY17 CY18 CY19 CY20 YTD21
Median Mean
176 184246
317 304
562
418
560
224
450 455 454
850
752
CY15 CY16 CY17 CY18 CY19 CY20 YTD21
Median Mean

6,724
2,245
7,197
10,017
6,806
20,40819,551
1210
16 2215
24
26
0
5
10
15
20
25
30
0
5,000
10,000
15,000
20,000
25,000
CY15 CY16 CY17 CY18 CY19 CY20 YTD21
Volume Value (A$m)
PRIVATE & CONFIDENTIAL | 65
US tech: IPO’s ( > A$100m raised)1
Context for US tech IPO’s
Tech IPOs dominated the US markets in 1Q21, continuing a dominant run seen in 2020
No. US tech IPO’s and total capital raised at IPO’s (A$m)
Includes IPO’s of
Slack ($400m) and
Zoom ($1.0bn)
Source: PwC, Capital IQ, company filings, Blackpeak Capital. Market data as at 30 June 2021
1) Completed transactions with disclosed values – doesn’t include SPAC deals
▪ US tech IPO activity still shows no signs of decline, with the strong momentum and record valuations
continuing into the June quarter
▪ Cybersecurity company SentinelOne’s debut in late June was the highest-valued cybersecurity IPO ever,
with its shares closing 21% higher on its first day of trading. Likewise, payment processing fintech Marqeta
hit the Nasdaq in June, closing 13% up at a market cap of over $16bn
▪ All eyes are currently looking towards the next wave of tech debutants. Particular focus is being placed on
Robinhood, an online brokerage app which has been subject to increasing scrutiny from regulators in recent
months, including a $70m fine for misleading customers
Includes IPO’s of
GreenSky ($1.1bn),
DocuSign ($833m) and
Dropbox ($981m)
Includes IPO’s of
Snowflake ($4.6bn),
Airbnb ($4.7b) and
DoorDash ($4.5b)
Includes IPO of
Bumble ($2.8bn)

PRIVATE & CONFIDENTIAL | 66
US tech: Secondary capital raisings ( > A$100m raised)1
Context for US tech secondary capital raisings
Bullish equity markets have seen US tech companies continue to raise secondary capital
Source: Capital IQ, company filings, Blackpeak Capital. Market data as at 30 June 2021
1) Completed transactions with disclosed values
No. US tech secondary capital raisings and total secondary capital raised (A$m)
▪ Secondary raising activity has continued to decline in 2Q21, with the continuing economic recovery
largely negating the need for capital raisings that characterised US equity markets in 2020. Nonetheless,
the quarter saw a number of large raisings from Fiserv ($3.0bn), MongoDB ($1.2bn) and Box ($0.6bn)
▪ Tech players across multiple verticals are continuing to raise additional capital, taking advantage of
record valuations in the sector to accelerate expansion and capture growth opportunities that are
emerging in the wake of the pandemic
Includes SoftBank’s sale of
$21.5bn stake in T-Mobile
32,617
17,76621,313
30,397
38,447
103,195
24,267
4035
43
64
66
102
44
0
20
40
60
80
100
120
0
10,000
20,000
30,000
40,000
50,000
60,000
70,000
80,000
90,000
100,000
110,000
CY15 CY16 CY17 CY18 CY19 CY20 YTD21
Volume Value (A$m)

61,213
106,929
59,432
177,342
35,634
83,87280,914
51,090
21,17031,332
21,800
39,050
66,924
42,424
91,363
117,841
181,125
101,179
62,36461,895
23,302
7,716
67,543
88,606
57,112
17,437
97 95 93 117
77
94
7179
73
9487
7785
77 78
101
81 72
91
9281
32
80
9789
67
0
20
40
60
80
100
120
140
0
20,000
40,000
60,000
80,000
100,000
120,000
140,000
160,000
180,000
200,000
1Q15 2Q15 3Q15 4Q15 1Q16 2Q16 3Q16 4Q16 1Q17 2Q17 3Q17 4Q17 1Q18 2Q18 3Q18 4Q18 1Q19 2Q19 3Q19 4Q19 1Q20 2Q20 3Q20 4Q20 1Q21 2Q21
Volume Value (A$m) Total value of transactions Number of deals
Includes Worldpay ($61.4bn),
First Data ($58.1bn)
Ultimate Software ($15.2bn)
and Ellie Mae ($5.2bn)
acquisitions
Source: PwC. Deloitte, Capital IQ, company filings, Blackpeak Capital. Market data as at 30 June 2021
1) Completed transactions with disclosed values – doesn’t include SPAC deals
US tech: Mergers and acquisitions ( > A$10m)1
Context for US tech mergers and acquisitions
No. US tech M&A transactions and total value of transactions (A$m)
M&A activity in the US tech sector has continued to decline in the March quarter
▪ M&A activity once again declined during 2Q21, with a marked decrease in both the volume and overall
size of deals. M&A in the June quarter was characterised by relatively small acquisitions
▪ Strategic acquisitions continued to account for a majority of the activity, with Mastercard acquiring Ekata
for A$1.1bn in order to advance its digital identity capabilities. Likewise, Bill.com acquired DivvyPay for
A$3.2bn in order to augment its platform with spend management functionality
▪ 2Q21 saw ABRY Partners spearhead a $1.3bn merger between Aspect Software and Noble Systems to
form Alvaria, a CX and workforce management platform majority owned by ABRY
PRIVATE & CONFIDENTIAL | 67
PRIVATE & CONFIDENTIAL | 68
Appendix: Index constituents

PRIVATE & CONFIDENTIAL | 69
Blackpeak ANZ tech indices constituentsMultiples Operating metrics
Capitalisation EV/ Revenue EV/ EBITDAFCF
marginMargins (LTM)
Revenue
growthExpenses SaaS
Recurring
revenueAttrition
CompanyEquity Value
(A$m)
Enterprise
Value (A$m)FY21 FY22E FY21 FY22E NTM Gross EBITDA LTM NTM
S&M/
revenue
R&D/
revenue
SaaS
magic
number
Last
reported
Last
reported
ANZ SaaS
WiseTech 10,328 10,117 20.1x 16.5x 55.1x 42.5x 12.0% 85.2% 39.7% 16.3% 16.7% 12.5% 36.5% 2.0x 89.0% 0.6%
Xero 20,274 20,126 26.1x 20.0x n.a. n.a. (1.6%) 86.0% 23.7% 18.2% 28.0% 37.2% 37.6% 0.8x 97.6% 12.1%
Class 204 203 3.8x 3.3x 9.2x 8.1x 6.9% 94.8% 44.6% 24.4% 22.2% 2.3% 27.0% 13.1x 90.9% 0.5%
ELMO 380 335 4.9x 3.6x n.a. n.a. (35.1%) 88.6% (3.9%) 23.8% 37.7% 43.4% 47.7% 1.5x 97.4% 10.0%
Eroad 472 457 5.4x 4.8x 16.0x 14.2x (2.4%) 89.1% 34.6% 12.8% 10.0% n.a. 23.3% n.a. 92.8% 5.1%
BigTinCan 531 498 11.3x 8.8x n.a. n.a. (71.2%) 85.0% (29.2%) 44.4% 42.6% 56.2% 58.3% 0.9x 95.0% 11.0%
ReadyTech 245 237 4.8x 3.4x 12.7x 9.2x 18.3% 93.3% 44.6% 15.7% 25.1% 1.1% 29.6% 31.0x 89.0% 5.0%
Serko 744 671 58.0x 19.4x n.a. n.a. (72.0%) 84.0% (212.1%) (48.0%) 198.8% 16.6% 85.6% 10.1x 91.1% n.a.
Whispir 305 297 5.9x 4.7x n.a. n.a. (13.8%) 60.7% (8.7%) 28.7% 28.1% 34.6% 24.7% 1.2x 96.5% 2.6%
LiveTiles 129 114 2.6x 2.0x n.a. n.a. 13.9% 91.3% n.a. 32.2% n.a. 5.8% 15.2% 1.2x 72.0% n.a.
LiveHire 119 103 18.7x 9.8x n.a. n.a. (126.1%) 70.5% (176.9%) 33.6% 58.3% 11.2% 44.6% n.a. 90.0% 14.0%
Damstra 154 153 5.2x 3.9x 22.8x 14.1x 1.7% 81.0% 31.1% 17.2% 51.8% n.a. 32.5% n.a. 92.0% 1.0%
Life360 1,012 941 7.4x 5.3x n.a. n.a. (16.0%) 80.9% (19.9%) 36.8% 18.6% 37.4% 42.3% 1.4x 72.5% n.a.
Pro Medicus 6,119 6,071 87.2x 61.7x n.a. 85.4x 39.8% 99.2% 70.3% 9.3% 22.5% 2.5% 12.4% 49.4x 99.7% n.a.
Volpara 292 267 14.5x 10.6x n.a. n.a. (23.2%) 91.4% (81.7%) 56.7% 31.0% 62.2% 75.3% 0.5x 91.9% n.a.
Infomedia 577 484 5.1x 4.1x 10.7x 8.9x 13.0% n.a. 47.9% 2.5% 1.0% n.a. 45.9% 0.3x 97.0% n.a.
Limeade 176 138 2.0x 1.8x n.a. n.a. (13.8%) 77.9% (6.6%) 19.3% (9.4%) 32.6% 36.3% 0.1x 97.0% 9.9%
Nitro 611 554 8.6x 6.9x n.a. n.a. (19.4%) 90.5% (22.8%) 12.7% 20.7% 52.5% 23.4% 1.0x 61.0% 15.0%
intelliHR 60 56 n.a. n.a. n.a. n.a. n.a. n.a. n.a. 125.7% n.a. 27.1% 119.3% 6.9x 83.3% n.a.
Plexure 111 74 2.7x 2.4x n.a. n.a. (27.5%) 68.2% (22.5%) 15.9% 14.7% 1.8% n.a. 6.1x 62.3% n.a.
Dubber 792 752 33.5x 17.1x n.a. n.a. n.a. 62.5% (64.0%) 53.7% 132.6% n.a. n.a. n.a. 71.9% 3.7%
Nuix 701 611 3.4x 3.1x 9.3x 8.4x 3.6% 89.2% 38.0% 17.1% 0.9% 33.0% 27.8% (0.4x) 87.0% 4.2%
Janison 204 198 6.7x 5.3x 39.5x 30.1x (1.0%) 54.1% 18.9% 10.4% 37.1% 12.7% 15.6% 6.5x 74.2% n.a.
Median 6.3x 5.0x 14.3x 14.1x (2.4%) 85.2% (3.9%) 18.2% 25.1% 27.1% 36.3% 1.4x 90.9% 5.1%
Max 87.2x 61.7x 55.1x 85.4x 39.8% 99.2% 70.3% 125.7% 198.8% 62.2% 119.3% 49.4x 99.7% 15.0%
Min 2.0x 1.8x 9.2x 8.1x (126.1%) 54.1% (212.1%) (48.0%) (9.4%) 1.1% 12.4% (0.4x) 61.0% 0.5%
Source: Capital IQ, company filings, Blackpeak Capital. Market data as at 30 June 2021

PRIVATE & CONFIDENTIAL | 70
Blackpeak ANZ tech indices constituentsMultiples Operating metrics
Capitalisation EV/ Revenue EV/ EBITDA FCF margin Margins (LTM) Revenue growth Expenses
CompanyEquity Value
(A$m)
Enterprise
Value (A$m)FY21 FY22E FY21 FY22E NTM Gross EBITDA LTM NTM
S&M/
revenue
R&D/
revenue
ANZ software
FINEOS 1,177 1,139 6.9x 6.2x 83.3x 53.9x (13.2%) 64.3% 8.7% 35.3% 18.2% 4.8% 34.4%
Iress 2,468 2,676 4.4x 4.2x 19.0x 17.6x 16.9% 66.6% 23.0% 6.6% 11.2% n.a. 0.7%
TechnologyOne 2,994 2,922 9.2x 8.5x 23.7x 21.1x 18.4% 84.9% 37.5% 3.5% 6.0% 1.8% 23.7%
Altium 4,815 4,715 19.1x 17.0x 51.6x 45.8x 27.0% 97.5% 36.8% 5.2% 12.2% 3.8% 13.0%
Hansen 1,241 1,353 4.3x 4.5x 11.4x 13.6x 23.8% n.a. 39.7% 13.7% 3.2% n.a. 4.6%
Integrated Research 335 341 4.4x 3.9x 17.6x 10.6x 37.2% n.a. 21.0% (11.4%) (29.3%) 53.6% 33.6%
Objective 1,642 1,628 n.a. n.a. n.a. n.a. n.a. 94.9% - 25.8% n.a. 39.1% 23.2%
Praemium 547 538 8.1x 6.8x 32.6x 24.8x 6.5% 70.1% 29.8% 16.6% 29.5% 2.1% 11.4%
Vista Group 509 485 4.5x 3.6x 25.9x 17.4x (8.0%) n.a. (0.7%) (39.4%) 27.0% 4.0% 37.5%
Bravura 868 850 3.5x 3.1x 16.9x 13.7x 6.6% 91.7% 19.9% (4.3%) (11.3%) n.a. 17.5%
Gentrack 190 182 1.9x 2.0x 20.1x 26.7x 9.9% n.a. 8.0% (6.5%) (0.3%) 0.7% 15.9%
Envirosuite 101 96 2.0x 1.7x n.a. n.a. 17.8% 40.6% (18.2%) 598.0% 103.3% 28.0% 21.4%
RPM Global 408 383 5.9x 5.4x 51.8x 36.1x 21.3% 96.3% 10.5% (11.1%) (19.1%) 6.5% 17.2%
Median 4.5x 4.3x 23.7x 21.1x 17.3% 84.9% 19.9% 5.2% 8.6% 4.4% 17.5%
Max 19.1x 17.0x 83.3x 53.9x 37.2% 97.5% 39.7% 598.0% 103.3% 53.6% 37.5%
Min 1.9x 1.7x 11.4x 10.6x (13.2%) 40.6% (18.2%) (39.4%) (29.3%) 0.7% 0.7%
Source: Capital IQ, company filings, Blackpeak Capital. Market data as at 30 June 2021

PRIVATE & CONFIDENTIAL | 71
Blackpeak ANZ tech indices constituentsMultiples Operating metrics
Capitalisation EV/ Revenue EV/ EBITDA Margins Revenue growth
CompanyEquity Value
(A$m)
Enterprise
Value (A$m)FY21 FY22E FY21 FY22E
FCF
(NTM)EBITDA (LTM) LTM NTM
ANZ online classifieds
REA 22,331.8 22,476.0 24.7x 20.3x 40.9x 33.3x 35.3% 62.6% (3.7%) 10.8%
carsales.com 5,571.7 5,992.9 13.9x 12.5x 24.2x 21.7x 33.4% 65.0% (10.5%) 8.8%
SEEK 11,689.0 12,885.4 8.0x 11.7x 27.1x 29.1x 13.8% 30.9% (8.2%) 1.4%
Domain 3,014.8 3,175.0 11.2x 9.6x 32.5x 25.3x 14.2% 38.2% (13.5%) 1.3%
Frontier Digital Ventures 475.0 416.4 8.1x 6.1x n.a. n.a. (58.8%) (20.9%) 35.7% 148.1%
iCar Asia 119.0 120.0 5.8x 4.3x n.a. n.a. n.a. (43.2%) (5.3%) 48.0%
Median 9.6x 10.6x 29.8x 27.2x 14.2% 34.5% (6.7%) 9.8%
Max 24.7x 20.3x 40.9x 33.3x 35.3% 65.0% 35.7% 148.1%
Min 5.8x 4.3x 24.2x 21.7x (58.8%) (43.2%) (13.5%) 1.3%
ANZ technology enabled services
Appen 1,673.8 1,620.6 2.7x 2.3x 14.6x 12.1x 2.3% 15.1% 12.0% 0.3%
Nearmap 922.5 805.0 7.1x 6.0x 37.8x 31.0x (14.1%) 20.3% 18.7% 17.4%
Straker 130.9 133.0 4.6x 2.7x n.a. n.a. (5.9%) (4.5%) 12.9% 68.0%
Aerometrex 63.2 49.9 2.5x 1.9x 26.6x 9.9x (44.8%) 10.1% (4.0%) 0.0%
DUG Technology 120.9 147.0 2.6x 2.1x n.a. 9.9x (11.8%) 0.2% n.a. n.a.
Median 2.7x 2.3x 26.6x 11.0x (11.8%) 10.1% 12.4% 8.8%
Max 7.1x 6.0x 37.8x 31.0x 2.3% 20.3% 18.7% 68.0%
Min 2.5x 1.9x 14.6x 9.9x (44.8%) (4.5%) (4.0%) 0.0%
Source: Capital IQ, company filings, Blackpeak Capital. Market data as at 30 June 2021

PRIVATE & CONFIDENTIAL | 72
Blackpeak ANZ tech indices constituentsMultiples Operating metrics
Capitalisation EV/ Revenue EV/ EBITDA Margins Revenue growth
CompanyEquity Value
(A$m)
Enterprise Value
(A$m)FY21 FY22E FY21 FY22E
FCF
(NTM)
EBITDA
(LTM)LTM NTM
ANZ Online marketplaces
Freelancer 549.8 540.5 n.a. n.a. n.a. n.a. n.a. n.a. 1.5% n.a.
Redbubble 976.9 854.6 1.5x 1.5x 14.5x 20.3x 7.5% 9.5% 77.4% 59.5%
MyDeal.com.au 154.0 106.1 2.7x 1.9x n.a. n.a. (7.3%) (15.5%) n.a. 150.1%
Hipages 388.8 366.3 6.6x 5.4x 47.4x 25.7x 17.8% 15.1% n.a. n.a.
Airtasker 455.1 441.0 18.0x 12.1x n.a. n.a. (24.7%) (18.6%) n.a. 37.3%
Median 4.6x 3.6x 31.0x 23.0x 0.1% (3.0%) 39.4% 59.5%
Max 18.0x 12.1x 47.4x 25.7x 17.8% 15.1% 77.4% 150.1%
Min 1.5x 1.5x 14.5x 20.3x (24.7%) (18.6%) 1.5% 37.3%
ANZ E-commerce
Kogan 1,234.0 1,168.5 1.5x 1.4x 19.2x 16.1x 2.3% 8.8% 62.4% 54.0%
Temple & Websters 1,299.7 1,215.4 3.7x 2.8x 61.7x 90.9x 5.6% 7.5% 108.7% 85.9%
Adore Beauty 402.9 377.9 2.2x 1.8x 79.3x 47.4x 2.4% 2.9% n.a. 44.9%
Booktopia 362.6 358.5 1.6x 1.3x 25.1x 18.2x n.a. 7.0% n.a. 35.6%
Median 1.9x 1.6x 43.4x 32.8x 2.4% 7.2% 85.5% 49.4%
Max 3.7x 2.8x 79.3x 90.9x 5.6% 8.8% 108.7% 85.9%
Min 1.5x 1.3x 19.2x 16.1x 2.3% 2.9% 62.4% 35.6%
ANZ Technology Hardware & Equipment
Audinate 620.1 556.2 17.3x 13.3x n.a. n.a. (6.3%) 6.6% (2.5%) 7.7%
Catapult 432.1 410.9 4.6x 4.0x n.a. 64.9x (7.8%) (9.1%) n.a. 19.4%
Codan 3,254.5 3,172.3 7.1x 5.1x 20.5x 16.4x 11.8% 41.6% 18.5% 28.2%
Pivotal 193.6 188.5 4.7x 3.3x n.a. 30.7x (18.7%) (17.7%) 44.1% 36.4%
Median 5.9x 4.6x 20.5x 30.7x (7.0%) (1.3%) 18.5% 23.8%
Max 17.3x 13.3x 20.5x 64.9x 11.8% 41.6% 44.1% 36.4%
Min 4.6x 3.3x 20.5x 16.4x (18.7%) (17.7%) (2.5%) 7.7%
Source: Capital IQ, company filings, Blackpeak Capital. Market data as at 30 June 2021

PRIVATE & CONFIDENTIAL | 73
Blackpeak ANZ tech indices constituentsMultiples Operating metrics
Capitalisation EV/ Revenue EV/ EBITDA Margins Revenue growth
CompanyEquity Value
(A$m)
Enterprise Value
(A$m)FY21 FY22E FY21 FY22E
FCF
(NTM)
EBITDA
(LTM)LTM NTM
ANZ fintech
Afterpay 34,216.4 33,866.6 36.1x 21.7x n.a. n.a. (46.9%) 17.0% 115.2% 80.3%
Splitit 238.2 207.1 9.3x 4.8x n.a. n.a. (604.2%) (389.8%) 309.2% 148.0%
Prospa 164.0 358.8 3.1x 2.5x n.a. n.a. 12.3% n.a. (41.2%) (17.6%)
Sezzle 1,742.7 1,723.4 10.8x 6.8x n.a. n.a. (48.1%) (11.7%) 251.3% 102.4%
Zip 4,255.4 5,671.4 14.8x 9.1x n.a. n.a. 3.1% (43.1%) 110.5% 137.0%
Pushpay 1,850.9 1,847.8 7.7x 7.0x 25.5x 21.2x 24.3% 31.9% 40.4% 14.7%
EML 1,259.2 1,166.9 6.3x 4.8x 22.5x 16.0x 18.6% 34.3% 43.0% 53.8%
OFX 324.6 281.3 2.1x 1.9x 14.7x 7.9x 6.4% 17.3% (2.6%) 7.4%
Hub24 1,948.2 1,870.0 14.4x 11.5x n.a. n.a. 16.3% n.a. 17.1% 18.1%
Netwealth 4,181.2 4,100.0 27.7x 23.7x 51.2x 44.2x 40.0% 59.2% 26.0% 21.2%
Wisr 342.3 519.0 19.6x 9.2x n.a. n.a. (34.0%) n.a. 113.0% 269.8%
Tyro 1,882.4 1,726.6 7.5x 5.3x n.a. 81.4x 1.3% 1.6% (3.5%) 9.5%
MoneyMe 384.0 497.8 8.3x 5.2x n.a. n.a. 34.0% n.a. 54.6% 25.8%
Money3 699.1 802.6 5.6x 4.5x 10.3x 9.1x (56.0%) 60.3% 13.4% 16.5%
Laybuy 134.9 131.2 4.3x 2.2x n.a. n.a. (79.8%) (73.3%) 137.7% 97.7%
Credit Clear 129.8 117.6 n.a. n.a. n.a. n.a. n.a. - n.a. n.a.
Smartpay 190.2 199.2 6.3x 4.0x 65.1x 16.5x 2.1% 16.9% 19.7% 57.8%
Openpay 187.0 197.4 6.7x 3.1x n.a. n.a. (169.5%) (195.3%) 60.8% 61.7%
Humm 490.3 2,544.3 5.7x 5.0x n.a. n.a. n.a. n.a. (27.7%) (1.1%)
Harmoney 152.4 257.5 3.2x 2.9x n.a. n.a. (4.2%) n.a. n.a. 130.0%
Zebit 81.8 74.4 0.3x 0.2x n.a. 29.4x (2.7%) n.a. 2.5% 84.4%
Cashrewards 56.7 17.3 0.8x 0.4x n.a. n.a. (130.9%) (164.0%) n.a. 17.8%
Median 6.7x 4.8x 24.0x 18.8x (0.7%) 1.6% 40.4% 53.8%
Max 36.1x 23.7x 65.1x 81.4x 40.0% 60.3% 309.2% 269.8%
Min 0.3x 0.2x 10.3x 7.9x (604.2%) (390%) (41.2%) (17.6%)
Source: Capital IQ, company filings, Blackpeak Capital. Market data as at 30 June 2021

PRIVATE & CONFIDENTIAL | 74
Blackpeak ANZ tech indices constituentsMultiples Operating metrics
Capitalisation EV/ Revenue EV/ EBITDA Margins Revenue growth
CompanyEquity Value
(A$m)
Enterprise Value
(A$m)FY21 FY22E FY21 FY22E
FCF
(NTM)
EBITDA
(LTM)LTM NTM
ANZ Infrastructure/ Cloud
NEXTDC 5,405.8 5,547.9 22.1x 18.3x 42.1x 33.9x (101.9%) 58.0% 25.4% 22.1%
Netlinkz 79.8 79.8 n.a. n.a. n.a. n.a. n.a. - 1,163.6% n.a.
Superloop 389.3 440.3 3.8x 2.0x 24.1x 14.0x (0.4%) 16.8% (0.5%) 7.9%
Megaport 2,886.1 2,757.7 34.9x 24.1x n.a. n.a. (29.6%) (20.5%) 49.1% 35.7%
Median 22.1x 18.3x 33.1x 24.0x (29.6%) 8.4% 37.3% 22.1%
Max 34.9x 24.1x 42.1x 33.9x (0.4%) 58.0% 1,163.6% 35.7%
Min 3.8x 2.0x 24.1x 14.0x (101.9%) (20.5%) (0.5%) 7.9%
ANZ IT Services
Data#3 863.8 823.1 0.4x 0.4x 17.9x 15.7x (2.4%) 2.6% 18.4% 13.3%
Webcentral Group (ARQ) 73.8 126.2 n.a. n.a. 16.9x n.a. n.a. 14.3% (37.5%) n.a.
Rhipe 336.6 282.3 4.5x 3.5x 16.0x 12.3x 17.7% 29.5% 11.6% 12.5%
OvertheWire 288.9 330.6 3.0x 2.4x 14.1x 10.3x 11.3% 24.7% 7.9% 27.6%
Empired 142.7 154.8 0.8x 0.8x 5.4x 4.9x n.a. 16.9% (0.2%) 12.2%
Median 3.0x 2.4x 16.5x 12.3x 11.3% 19.5% 9.7% 13.3%
Max 4.5x 3.5x 17.9x 15.7x 17.7% 29.5% 18.4% 27.6%
Min 0.4x 0.4x 14.1x 10.3x (2.4%) 2.6% (37.5%) 12.5%
Source: Capital IQ, company filings, Blackpeak Capital. Market data as at 30 June 2021
40-42 Young St
Sydney, New South Wales, 2000
www.blackpeakcapital.com.au
Copyright © blackpeak capital Pty Ltd (ABN 52 601 350 841). All rights reserved.
Australian Financial Services Licence: 472221