Possible Use of Synthetic Aperture Radar Images in …...Possible Use of Synthetic Aperture Radar...
16
Possible Use of Synthetic Aperture Radar Images in IACS György Surek – Zoltán Friedl - Gizella Nádor - Mátyás Rada - Anikó Kulcsár - Irén Hubik Government Office Capital City Budapest, Department of Geodesy, Remote Sensing and Land Offices Bernadett Csonka Hungarian State Treasury, Directorate of Direct Payment 51st Panta Rhei Conference Hungary - April 2017.
Transcript of Possible Use of Synthetic Aperture Radar Images in …...Possible Use of Synthetic Aperture Radar...

Possible Use
of Synthetic
Aperture
Radar Images
in IACS
György Surek – Zoltán Friedl - Gizella Nádor - Mátyás Rada - Anikó Kulcsár - Irén Hubik
Government Office Capital City Budapest, Department of Geodesy, Remote Sensing and LandOffices
Bernadett CsonkaHungarian State Treasury, Directorate of Direct Payment
51st Panta Rhei Conference
Hungary - April 2017.

New Sentinel sattelite images avaiable for IACS COPERNICUS is financed by the EC:
- Developed for vegetation monitoring, one of the main target is the
agriculture and environment policy
SENTINEL 1 – Synthetic Aperture Radar (SAR) continuous all-weather, day-
and-night imagery at C-band, dual polarization - can transmit a signal in one
polarization mode (H or V) and receive in both horizontal (H) and vertical (V)
polarization
20 m spatial resolution, Revisit time: 6 days
SENTINEL-2 – Optical MultiSpectral Instrument (MSI) 13 spectral bands: four
bands at 10 metres, six bands at 20 metres and three bands at 60 meters
spatial resolution. ESA delivers orthorectified products 100 km tiles in
UTM/WGS84 projection.
Revisit time: 10 days (5 days will be if S2B will be operative – in a few
month
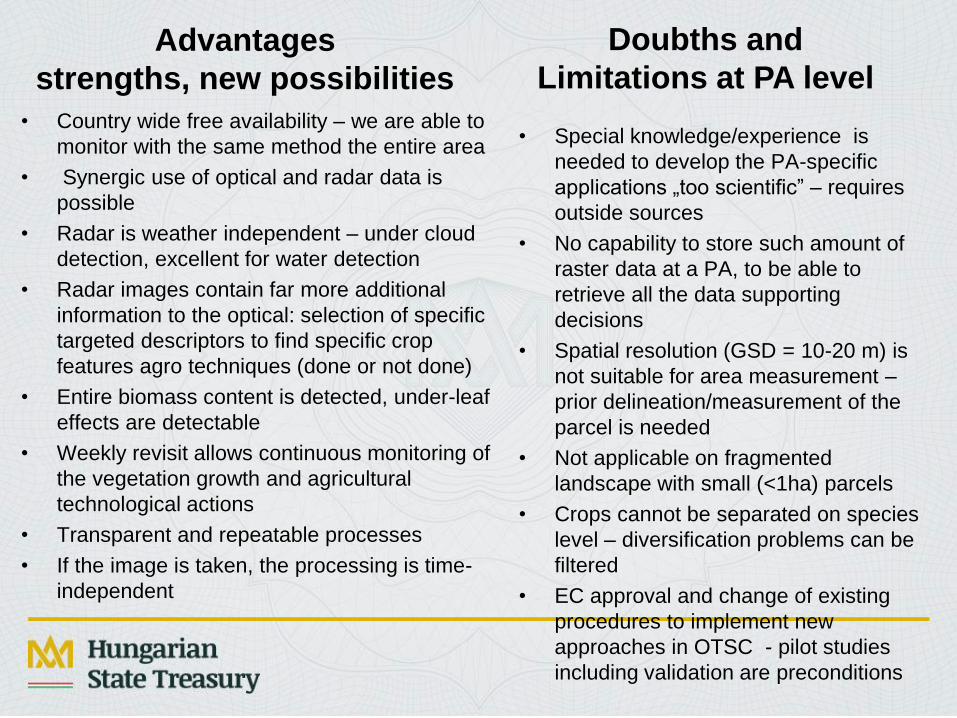
Advantages
strengths, new possibilities
• Country wide free availability – we are able to
monitor with the same method the entire area
• Synergic use of optical and radar data is
possible
• Radar is weather independent – under cloud
detection, excellent for water detection
• Radar images contain far more additional
information to the optical: selection of specific
targeted descriptors to find specific crop
features agro techniques (done or not done)
• Entire biomass content is detected, under-leaf
effects are detectable
• Weekly revisit allows continuous monitoring of
the vegetation growth and agricultural
technological actions
• Transparent and repeatable processes
• If the image is taken, the processing is time-
independent
• Special knowledge/experience is
needed to develop the PA-specific
applications „too scientific” – requires
outside sources
• No capability to store such amount of
raster data at a PA, to be able to
retrieve all the data supporting
decisions
• Spatial resolution (GSD = 10-20 m) is
not suitable for area measurement –
prior delineation/measurement of the
parcel is needed
• Not applicable on fragmented
landscape with small (<1ha) parcels
• Crops cannot be separated on species
level – diversification problems can be
filtered
• EC approval and change of existing
procedures to implement new
approaches in OTSC - pilot studies
including validation are preconditions
Doubths and
Limitations at PA level
Results of the remote sensing for agriculture
Hungarian research team - Government Office Capital City
Budapest, Department of Geodesy, Remote Sensing and Land Offices
• The state institute responsible for geodesy, cartography and remote
sensing had been continuously working together with the PA for LPIS and
CwRS development and maintenance since 2004
• Polarimetric radar application team is acting since 2006.
Main results:
– Participation in ESA and COPERNICUS projects
– Participation in SOAR-EU project of the Canadian Space Agency
– Synergic use of multi temporal optical and radar images
– Arable crop type and crop phenophasis identification
– Detecting crop damages and deceases (corn root warm)
– Detecting force majeure and it’s damage (waterlog, drought, ice storm)
– Land cover classification - grassland and natural vegetation types
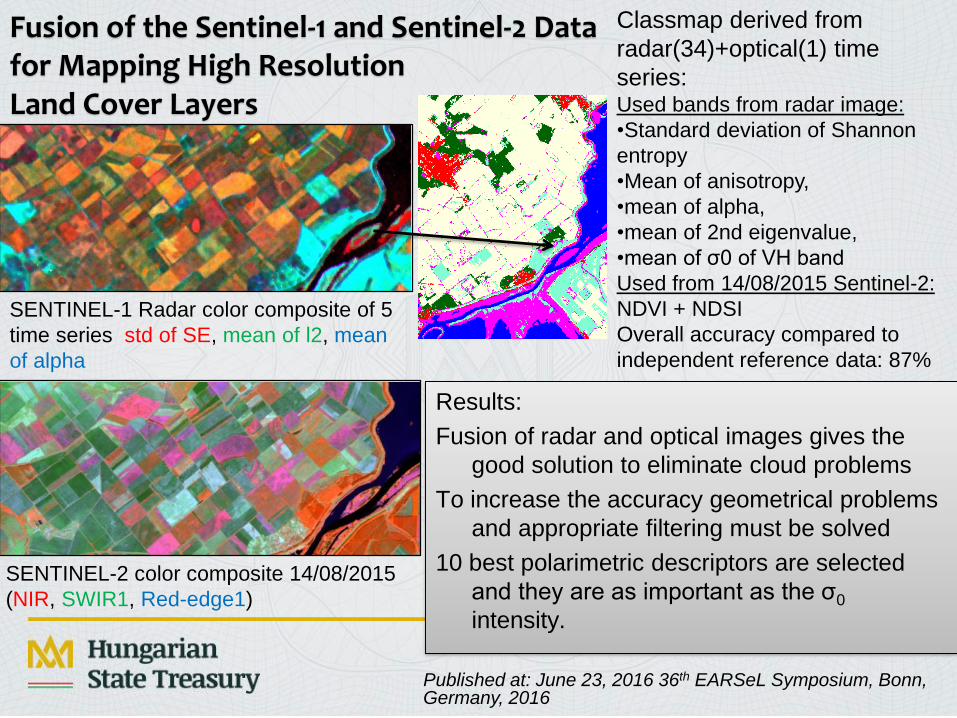
Fusion of the Sentinel-1 and Sentinel-2 Data for Mapping High Resolution Land Cover Layers
Results:
Fusion of radar and optical images gives the
good solution to eliminate cloud problems
To increase the accuracy geometrical problems
and appropriate filtering must be solved
10 best polarimetric descriptors are selected
and they are as important as the σ0
intensity.
Published at: June 23, 2016 36th EARSeL Symposium, Bonn, Germany, 2016
SENTINEL-2 color composite 14/08/2015
(NIR, SWIR1, Red-edge1)
SENTINEL-1 Radar color composite of 5
time series std of SE, mean of l2, mean
of alpha
Classmap derived from
radar(34)+optical(1) time
series: Used bands from radar image:
•Standard deviation of Shannon
entropy
•Mean of anisotropy,
•mean of alpha,
•mean of 2nd eigenvalue,
•mean of σ0 of VH band
Used from 14/08/2015 Sentinel-2:
NDVI + NDSI
Overall accuracy compared to
independent reference data: 87%
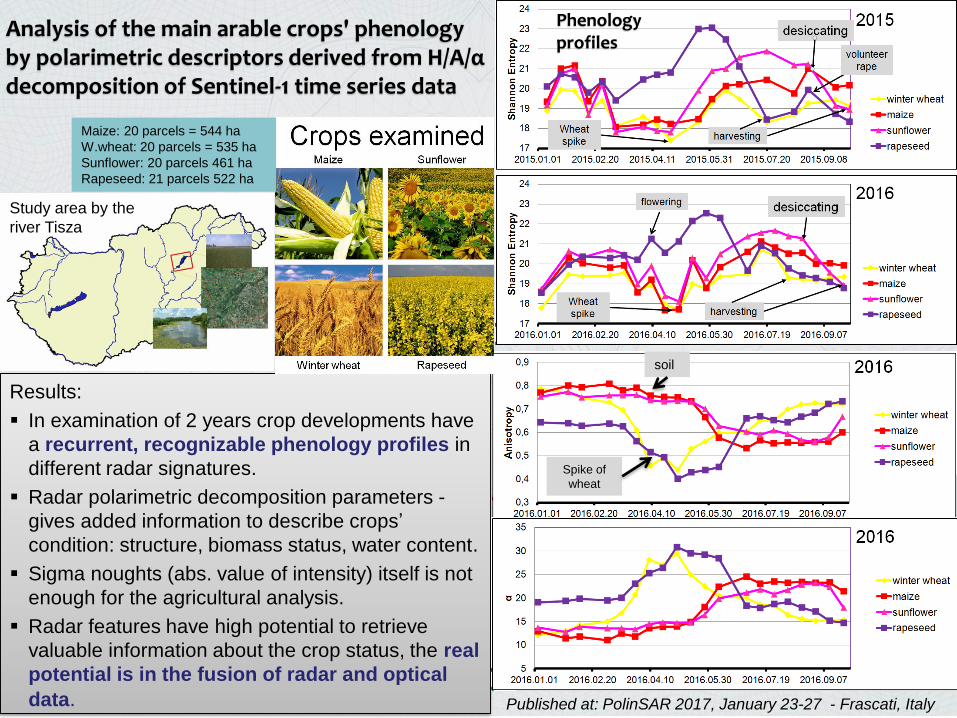
Analysis of the main arable crops' phenologyby polarimetric descriptors derived from H/A/αdecomposition of Sentinel-1 time series data
Published at: PolinSAR 2017, January 23-27 - Frascati, Italy
Results:
In examination of 2 years crop developments have
a recurrent, recognizable phenology profiles in
different radar signatures.
Radar polarimetric decomposition parameters -
gives added information to describe crops’
condition: structure, biomass status, water content.
Sigma noughts (abs. value of intensity) itself is not
enough for the agricultural analysis.
Radar features have high potential to retrieve
valuable information about the crop status, the real
potential is in the fusion of radar and optical
data.
Study area by the
river Tisza
Phenologyprofiles
Maize: 20 parcels = 544 ha
W.wheat: 20 parcels = 535 ha
Sunflower: 20 parcels 461 ha
Rapeseed: 21 parcels 522 ha
soil
Spike of
wheat

H-Alpha Space 2016
7
• The winter crops and
summer crops are
separated well.
• There is a short mixing
period when summer
crops are growing and
winter crops are
harvested.
• The rapeseed has a
characteristic
separation in different
short period.
• Maize and sunflower
have a similar features
in H-α space
Published at: PolinSAR 2017, January 23-27 - Frascati, Italy

Operational projects in Hungary where radar is used
Monitoring the spread of ragweed =
Ambrosia artemisiifolia – allergic weed –
the example shows the presence of
flowering ragweed in a sunflower parcel
Since 2010
Monitoring of western corn rootworm
damage in maize fields by using integrated
radar (ALOS PALSAR) and optical (IRS LISS,
AWiFS) satellite data
L-band polarimetric radar data introduce a
competitive indicator to detect structural
(disorder) damages.

Operational use of radar in the Agricultural Risk Management System - force majeure: drought on arable crops
Vegetation index
NDVI
Comparing the radar polarimetric descriptors
how the difference between the „usual” and
„drought-effected” parcels can be detected
https://www.researchgat
e.net/publication/27771
5078_COMPARISON_OF
_EFFICIENCY_OF_OPTIC
AL_AND_RADAR_DATA_F
OR_LAND_COVER_CLAS
SIFICATION
H/A/α and Yamaguchi
decomposition

Operational use of radar in the Agricultural RiskManagement System - force majeure: ice storm damage
Ice storm damage – example shows a winter wheat parcel
- Yellow: not demaged reference parcella
- Blue: damaged parcella

• Focusing on agricultural parcel level
inspection
• Fast and objective
• Reducing field visits
• The method fits to the current
regulative environment, technical
recommendations if the parcel
boundary is already validated on a
VHR or on-the-spot
Challenges for the paying agencies of using Sentinelimages in IACS controls
• Detecting the
– existence and duration of catch crops
– timing of the hay cut on PP
– ploughing on a set-aside parcel
– if the winter soil cover is kept
– weed, encroachment of scrubs
– non compliance with minimum
activity
• Verifying force majeure cases
• Standardised monitoring of the entire
population of declared parcels to
filter problems and to target OTSC
• Reducing accepted area based
on HR or HHR images
• Pilot projects are needed for proving the
methodology, validation and real
implementation in the IACS workflow.
• Best approaches must be proven by the EC
before operational use.
• MS are willing to cooperate but also
expressed the need of EC/ESA/JRC support.
• The developments requires extra funding if
EC recommends to use the new technologies.
• Common data availability is essential.

Possibilities of using the crop clustermap in IACS:- helping to localise the parcels already at declaration stage (input support for better result!) - filtering crop and diversification non-compliances and supporting CwRS decision - opens the possibility for „overall monitoring method” and filtering problems for larger parcels
Ortho images, cluster map and declaration are all from year 2015

Challenges of using the new image sources and processing technologies in LPIS maintenance –
simplification ! Does the current direction of increasing the spatial accuracy for LPIS and parcel
measurement leads to better finding the risk of the found or not?
Are we on the right way to spend resources on delineating by CAPI hardly delineable natural
non-eligible features at 100-500 m2 size on a single VHR image? - rather than working on
monitoring the eligibility and MA during the entire vegetation period, to filter larger areas
with essential risk?
Are we able to decide the eligible area of a PP temporary effected by water or being marshy
on a single true colour ortho image? – or monitoring of biomass suitable for animal feed
during the entire vegetation period would lead to better categorisation, and also capable to
detect self maintaining pasture?
Synergic use of optical and radar images are capable to more detailed grassland
categorisation = update of PP layer ???
Calculation and update of PP pro-rata can be supported by multi temporal image analysis ???
Automatic detection of LCC changes and changes of artificial surfaces can direct the RP
udpate ???

Haycut detectionOrto 2015 PP with hay cut
se1_20150109_0415_06
14_0720_0813_se.img
Multitemporal
Shannon entropy
composite
se1_20150109_0415_0614_072
0_0813_l2.img
Average temporal development of polarimetric
descriptor „SE”(a) and NDVI (b) for different
categories based on reference data (Lake Tisza site)
a) a)
The real potential of this
method is the possibility to
follow the cut weakly!
General conclusions
• The real challenge of using the Sentinels’ data in IACS is the timing:
weakly free availability – the possibility of continuously monitoring the
agricultural activity opens new approaches at most steps of the IACS
workflow: LPIS, declaration, controls, retroactive analysis …
• Radar images brings new additional information about the structure and
about the entire vegetation content (not only it’s surface) of the crops,
that is why synergic use with the optical multi spectral images leads to
retrieving additional information.
• There are several very promising technical result as a solid knowledge
base of using Sentinels, but operational implementation in the IACS
workflow is still limited. Pilot projects could force the validation of best
approaches.
• MS requires the active involvement of the EC to support the use of
Sentinels’ data in IACS: improving data availability, sources for pilots,
validation of methods, evaluation of the technical guidance….
Thank you for the [email protected]