Ports 2013 MARCH - IBEF · P - Data for FY12 is provisional, ... Krishnapatnam, ... Coal supply gap...
41
1 1 For updated information, please visit www.ibef.org Ports MARCH 2013
Transcript of Ports 2013 MARCH - IBEF · P - Data for FY12 is provisional, ... Krishnapatnam, ... Coal supply gap...
1 1 For updated information, please visit www.ibef.org
Ports MARCH
2013

2 2
Contents
Advantage India
Market overview and trends
Growth drivers
Success stories: Mundra port, JNPT
Opportunities
Useful information
For updated information, please visit www.ibef.org
Ports MARCH
2013
3 3
Ports
For updated information, please visit www.ibef.org ADVANTAGE INDIA
Advantage India
MARCH
2013
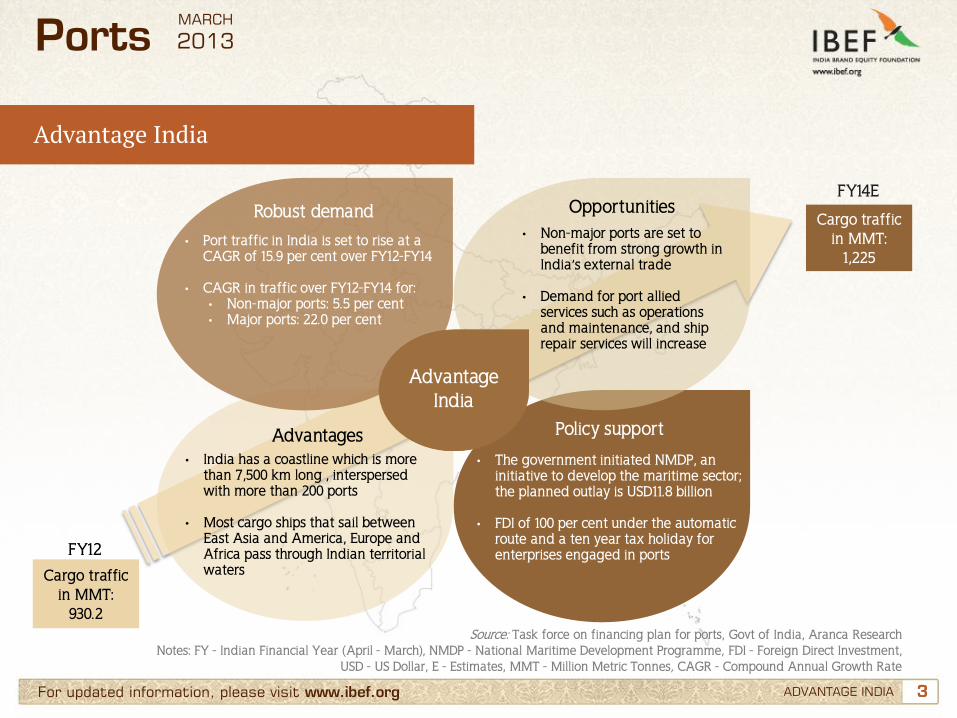
Advantage India
• Port traffic in India is set to rise at a CAGR of 15.9 per cent over FY12-FY14
• CAGR in traffic over FY12-FY14 for: • Non-major ports: 5.5 per cent • Major ports: 22.0 per cent
• Non-major ports are set to benefit from strong growth in India’s external trade
• Demand for port allied services such as operations and maintenance, and ship repair services will increase
• India has a coastline which is more than 7,500 km long , interspersed with more than 200 ports
• Most cargo ships that sail between East Asia and America, Europe and Africa pass through Indian territorial waters
• The government initiated NMDP, an initiative to develop the maritime sector; the planned outlay is USD11.8 billion
• FDI of 100 per cent under the automatic route and a ten year tax holiday for enterprises engaged in ports
Cargo traffic in MMT:
1,225
FY14E
Cargo traffic in MMT:
930.2
FY12
Source: Task force on financing plan for ports, Govt of India, Aranca Research Notes: FY - Indian Financial Year (April - March), NMDP - National Maritime Development Programme, FDI - Foreign Direct Investment,
USD - US Dollar, E - Estimates, MMT - Million Metric Tonnes, CAGR - Compound Annual Growth Rate
Robust demand Opportunities
Advantages Policy support
4 4
Contents
Advantage India
Market overview and trends
Growth drivers
Success stories: Mundra port, JNPT
Opportunities
Useful information
For updated information, please visit www.ibef.org
Ports MARCH
2013
5 5 For updated information, please visit www.ibef.org MARKET OVERVIEW AND TRENDS
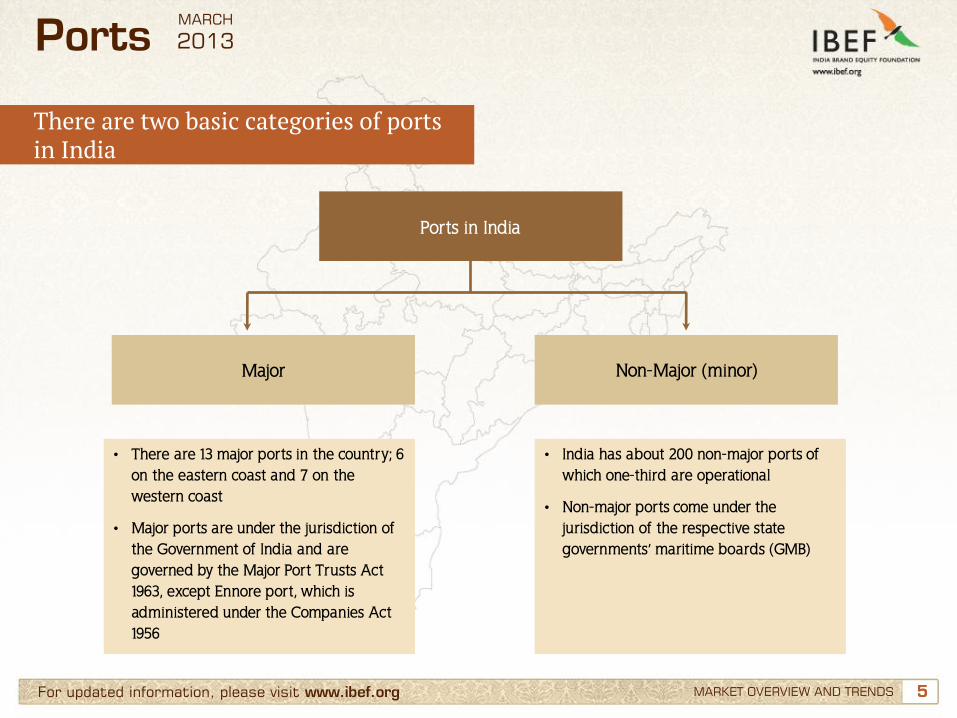
There are two basic categories of ports in India
Ports
• There are 13 major ports in the country; 6 on the eastern coast and 7 on the western coast
• Major ports are under the jurisdiction of the Government of India and are governed by the Major Port Trusts Act 1963, except Ennore port, which is administered under the Companies Act 1956
• India has about 200 non-major ports of which one-third are operational
• Non-major ports come under the jurisdiction of the respective state governments’ maritime boards (GMB)
Ports in India
Major Non-Major (minor)
MARCH
2013
6 6 For updated information, please visit www.ibef.org
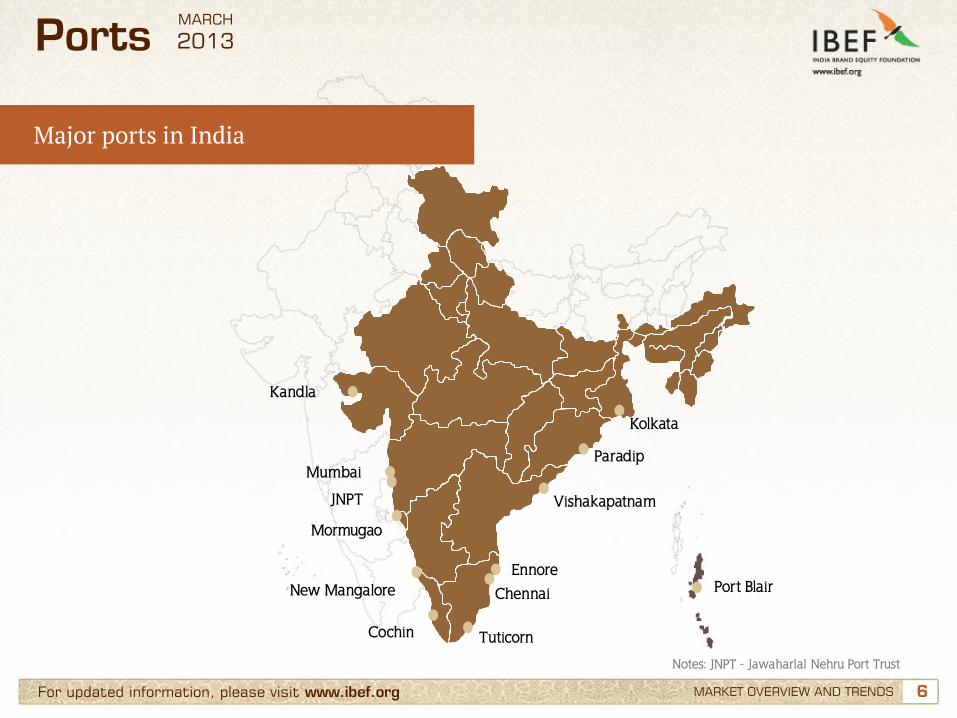
Major ports in India
MARKET OVERVIEW AND TRENDS
Ports
Mumbai
JNPT
Kandla
Mormugao
New Mangalore
Cochin Tuticorn
Ennore
Vishakapatnam
Paradip
Kolkata
Port Blair
Notes: JNPT - Jawaharlal Nehru Port Trust
MARCH
2013
Chennai
7 7 For updated information, please visit www.ibef.org MARKET OVERVIEW AND TRENDS
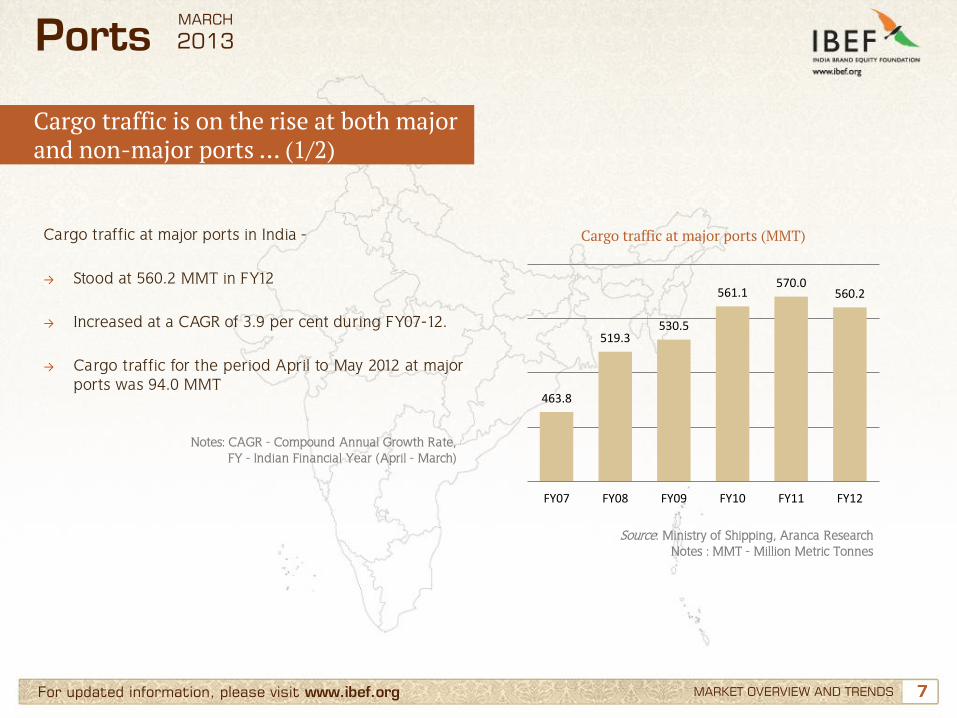
Cargo traffic at major ports in India - → Stood at 560.2 MMT in FY12
→ Increased at a CAGR of 3.9 per cent during FY07-12.
→ Cargo traffic for the period April to May 2012 at major
ports was 94.0 MMT
Cargo traffic at major ports (MMT)
Ports
Source: Ministry of Shipping, Aranca Research Notes : MMT - Million Metric Tonnes
463.8
519.3 530.5
561.1 570.0
560.2
FY07 FY08 FY09 FY10 FY11 FY12
Notes: CAGR - Compound Annual Growth Rate, FY - Indian Financial Year (April - March)
MARCH
2013
Cargo traffic is on the rise at both major and non-major ports … (1/2)
8 8
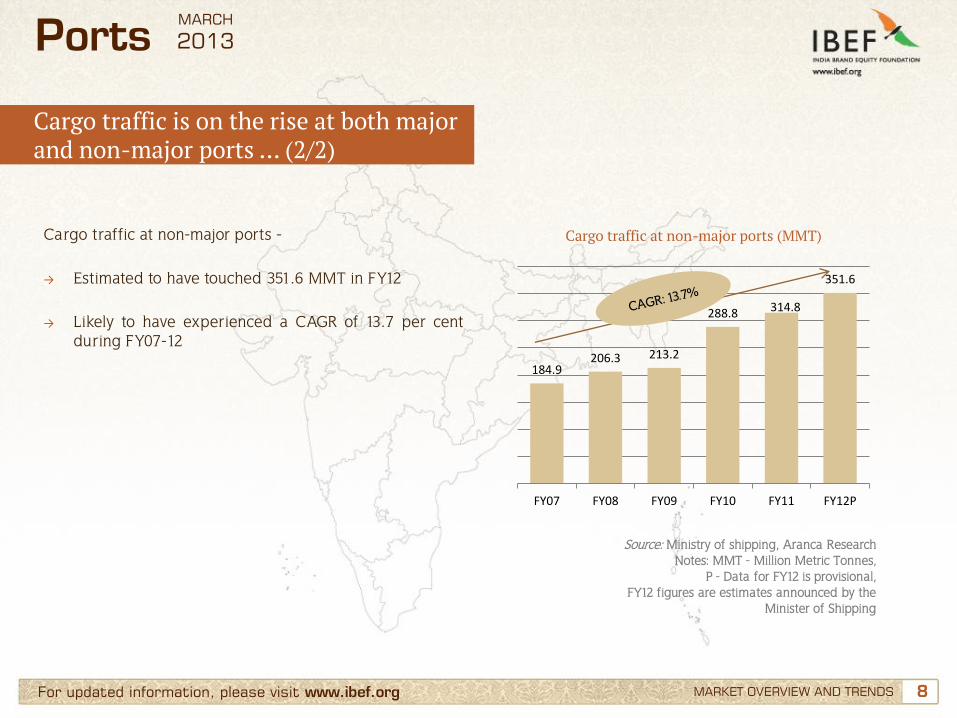
184.9 206.3 213.2
288.8 314.8
351.6
FY07 FY08 FY09 FY10 FY11 FY12P
For updated information, please visit www.ibef.org MARKET OVERVIEW AND TRENDS
Cargo traffic at non-major ports - → Estimated to have touched 351.6 MMT in FY12
→ Likely to have experienced a CAGR of 13.7 per cent
during FY07-12
Cargo traffic at non-major ports (MMT)
Source: Ministry of shipping, Aranca Research Notes: MMT - Million Metric Tonnes,
P - Data for FY12 is provisional, FY12 figures are estimates announced by the
Minister of Shipping
Ports MARCH
2013
Cargo traffic is on the rise at both major and non-major ports … (2/2)
9 9 For updated information, please visit www.ibef.org MARKET OVERVIEW AND TRENDS
Ports
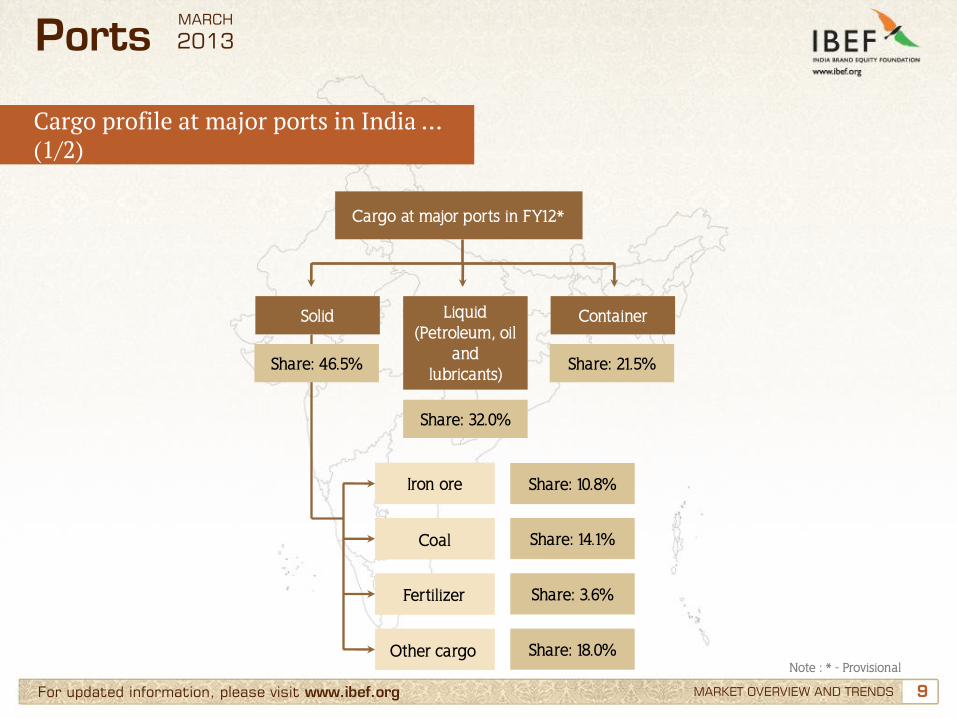
Cargo at major ports in FY12*
Solid Liquid (Petroleum, oil
and lubricants)
Container
Share: 46.5%
Share: 32.0%
Share: 21.5%
Iron ore
Coal
Fertilizer
Other cargo
Share: 10.8%
Share: 14.1%
Share: 3.6%
Share: 18.0% Note : * - Provisional
MARCH
2013
Cargo profile at major ports in India … (1/2)
10 10 For updated information, please visit www.ibef.org MARKET OVERVIEW AND TRENDS
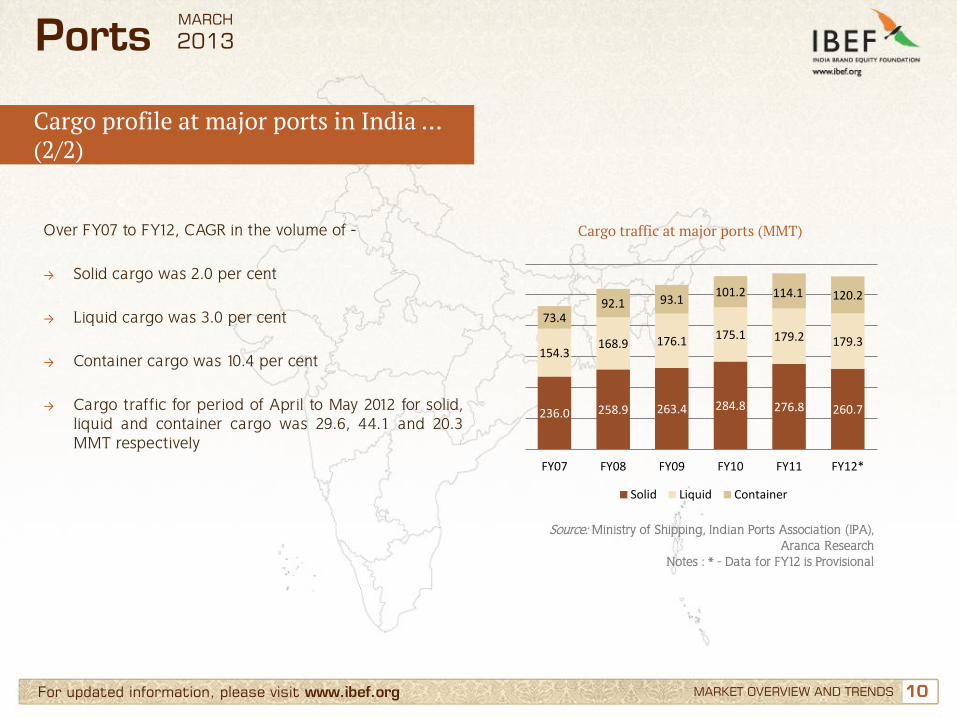
Over FY07 to FY12, CAGR in the volume of - → Solid cargo was 2.0 per cent
→ Liquid cargo was 3.0 per cent
→ Container cargo was 10.4 per cent
→ Cargo traffic for period of April to May 2012 for solid,
liquid and container cargo was 29.6, 44.1 and 20.3 MMT respectively
Cargo traffic at major ports (MMT)
Source: Ministry of Shipping, Indian Ports Association (IPA), Aranca Research
Notes : * - Data for FY12 is Provisional
Ports
236.0 258.9 263.4 284.8 276.8 260.7
154.3 168.9 176.1 175.1 179.2 179.3
73.4 92.1 93.1
101.2 114.1 120.2
FY07 FY08 FY09 FY10 FY11 FY12*
Solid Liquid Container
MARCH
2013
Cargo profile at major ports in India … (2/2)
11 11 For updated information, please visit www.ibef.org
Increase in capacity over the years
MARKET OVERVIEW AND TRENDS
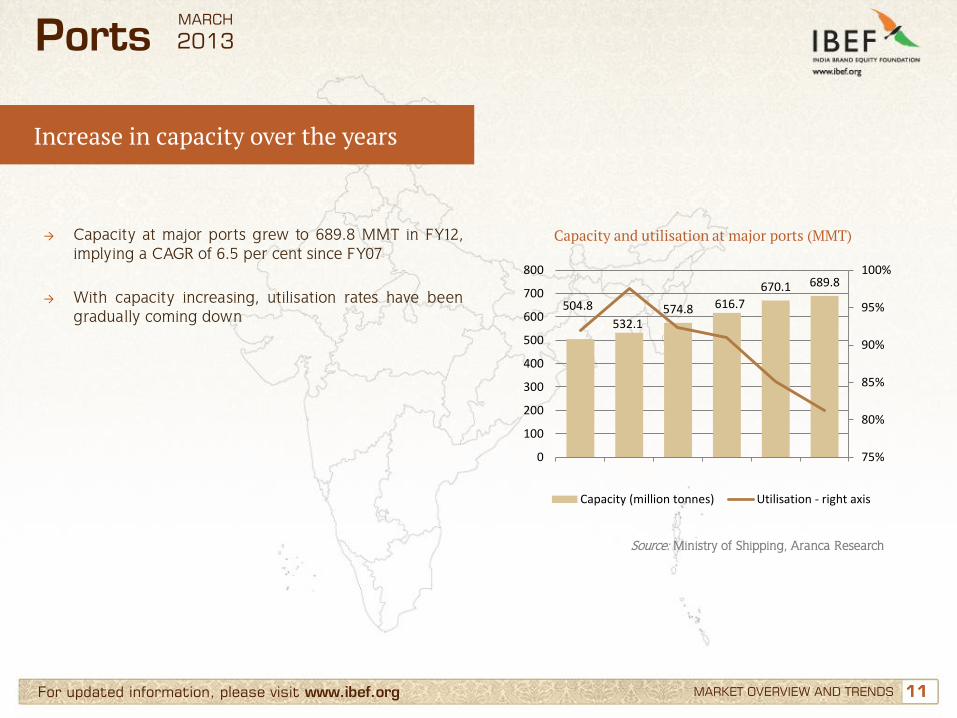
→ Capacity at major ports grew to 689.8 MMT in FY12, implying a CAGR of 6.5 per cent since FY07
→ With capacity increasing, utilisation rates have been gradually coming down
Capacity and utilisation at major ports (MMT)
Source: Ministry of Shipping, Aranca Research
Ports
504.8
532.1 574.8 616.7
670.1 689.8
75%
80%
85%
90%
95%
100%
0
100
200
300
400
500
600
700
800
Capacity (million tonnes) Utilisation - right axis
MARCH
2013
12 12 For updated information, please visit www.ibef.org MARKET OVERVIEW AND TRENDS
Ports
Drop in turnaround time in FY12
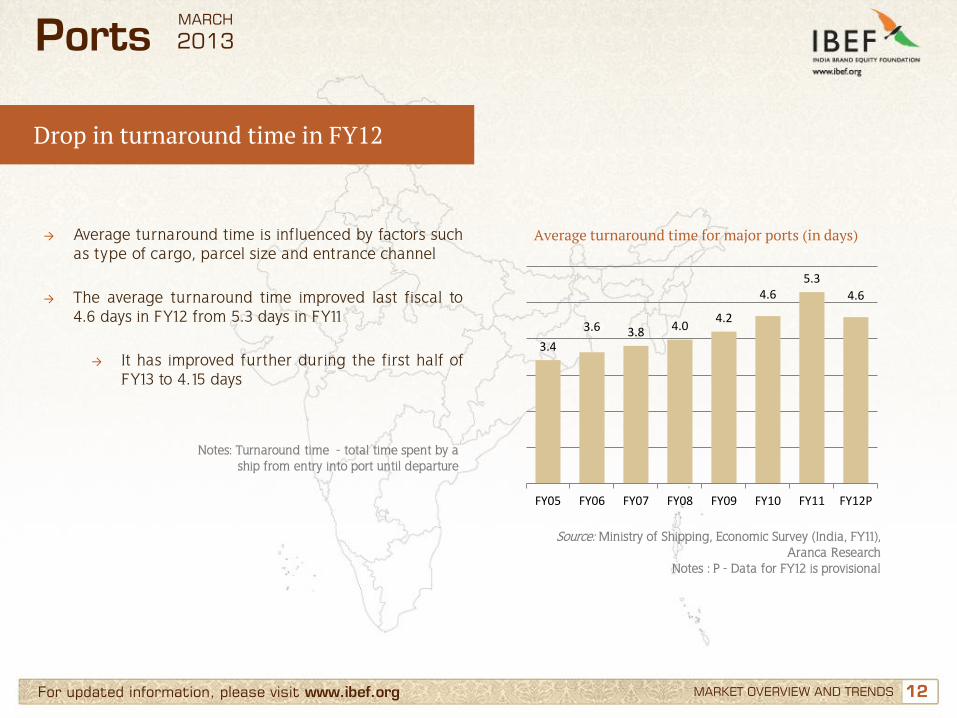
→ Average turnaround time is influenced by factors such as type of cargo, parcel size and entrance channel
→ The average turnaround time improved last fiscal to 4.6 days in FY12 from 5.3 days in FY11
→ It has improved further during the first half of FY13 to 4.15 days
Average turnaround time for major ports (in days)
Notes: Turnaround time - total time spent by a ship from entry into port until departure
Source: Ministry of Shipping, Economic Survey (India, FY11), Aranca Research
Notes : P - Data for FY12 is provisional
3.4
3.6 3.8 4.0 4.2
4.6 5.3
4.6
FY05 FY06 FY07 FY08 FY09 FY10 FY11 FY12P
MARCH
2013
13 13 For updated information, please visit www.ibef.org MARKET OVERVIEW AND TRENDS
Ports
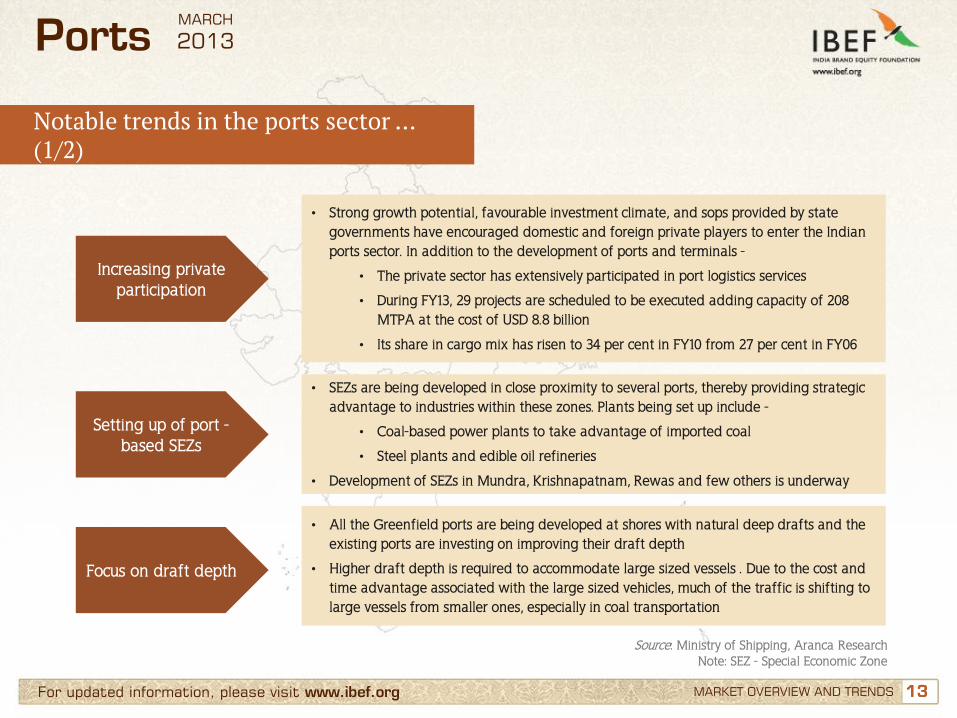
Increasing private participation
• Strong growth potential, favourable investment climate, and sops provided by state governments have encouraged domestic and foreign private players to enter the Indian ports sector. In addition to the development of ports and terminals -
• The private sector has extensively participated in port logistics services
• During FY13, 29 projects are scheduled to be executed adding capacity of 208 MTPA at the cost of USD 8.8 billion
• Its share in cargo mix has risen to 34 per cent in FY10 from 27 per cent in FY06
Setting up of port - based SEZs
• SEZs are being developed in close proximity to several ports, thereby providing strategic advantage to industries within these zones. Plants being set up include -
• Coal-based power plants to take advantage of imported coal
• Steel plants and edible oil refineries
• Development of SEZs in Mundra, Krishnapatnam, Rewas and few others is underway
Focus on draft depth
• All the Greenfield ports are being developed at shores with natural deep drafts and the existing ports are investing on improving their draft depth
• Higher draft depth is required to accommodate large sized vessels . Due to the cost and time advantage associated with the large sized vehicles, much of the traffic is shifting to large vessels from smaller ones, especially in coal transportation
Source: Ministry of Shipping, Aranca Research Note: SEZ - Special Economic Zone
MARCH
2013
Notable trends in the ports sector … (1/2)
14 14 For updated information, please visit www.ibef.org MARKET OVERVIEW AND TRENDS
Ports
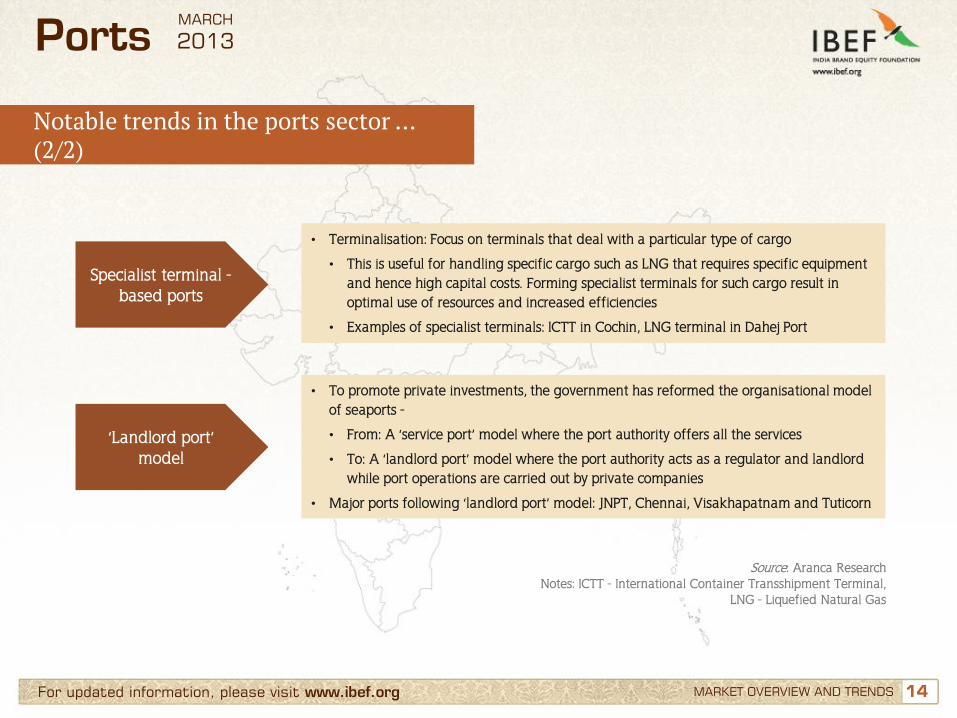
Specialist terminal - based ports
• Terminalisation: Focus on terminals that deal with a particular type of cargo
• This is useful for handling specific cargo such as LNG that requires specific equipment and hence high capital costs. Forming specialist terminals for such cargo result in optimal use of resources and increased efficiencies
• Examples of specialist terminals: ICTT in Cochin, LNG terminal in Dahej Port
‘Landlord port’ model
• To promote private investments, the government has reformed the organisational model of seaports -
• From: A ‘service port’ model where the port authority offers all the services
• To: A ‘landlord port’ model where the port authority acts as a regulator and landlord while port operations are carried out by private companies
• Major ports following ‘landlord port’ model: JNPT, Chennai, Visakhapatnam and Tuticorn
Source: Aranca Research Notes: ICTT - International Container Transshipment Terminal,
LNG - Liquefied Natural Gas
MARCH
2013
Notable trends in the ports sector … (2/2)
15 15
Contents
Advantage India
Market overview and trends
Growth drivers
Success stories: Mundra port, JNPT
Opportunities
Useful information
For updated information, please visit www.ibef.org
Ports MARCH
2013
16 16 For updated information, please visit www.ibef.org GROWTH DRIVERS
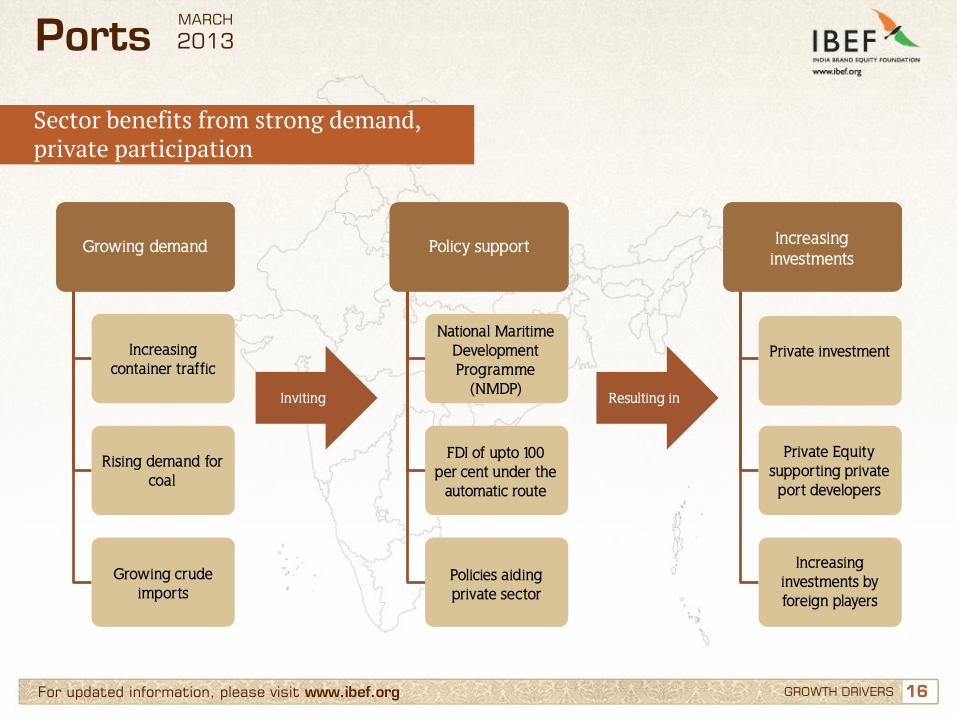
Strong
government
support
Inviting Resulting in
Growing demand Policy support Increasing investments
Increasing container traffic
National Maritime Development Programme
(NMDP)
Private investment
Rising demand for coal
FDI of upto 100 per cent under the
automatic route
Private Equity supporting private port developers
Growing crude imports
Policies aiding private sector
Increasing investments by foreign players
Ports MARCH
2013
Sector benefits from strong demand, private participation
17 17 For updated information, please visit www.ibef.org GROWTH DRIVERS
Ports
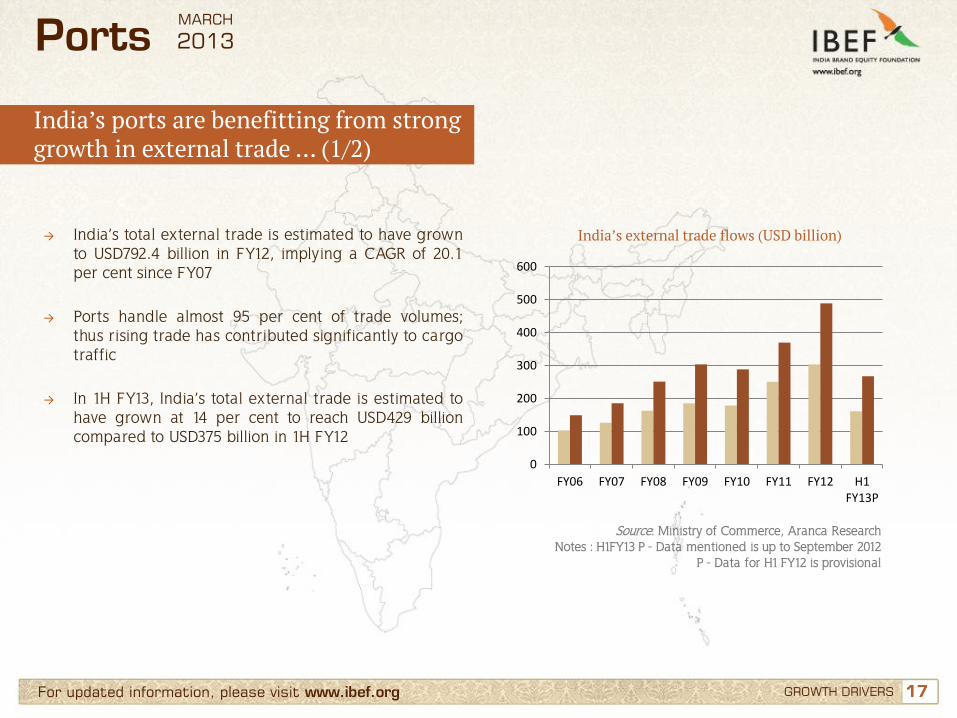
→ India’s total external trade is estimated to have grown to USD792.4 billion in FY12, implying a CAGR of 20.1 per cent since FY07
→ Ports handle almost 95 per cent of trade volumes; thus rising trade has contributed significantly to cargo traffic
→ In 1H FY13, India’s total external trade is estimated to have grown at 14 per cent to reach USD429 billion compared to USD375 billion in 1H FY12
India’s external trade flows (USD billion)
Source: Ministry of Commerce, Aranca Research Notes : H1FY13 P - Data mentioned is up to September 2012
P - Data for H1 FY12 is provisional
0
100
200
300
400
500
600
FY06 FY07 FY08 FY09 FY10 FY11 FY12 H1FY13P
MARCH
2013
India’s ports are benefitting from strong growth in external trade … (1/2)

18 18 For updated information, please visit www.ibef.org GROWTH DRIVERS
Ports
→ Increasing trade is translating into higher demand for containerisation due to their efficiency
→ During FY07-12, container traffic rose to 120.2 million tonnage TEU, implying a CAGR of 10.4 per cent
Container traffic (million tonnage TEU)
Source: Indian Ports Association, Aranca Research Notes : * - Tentative, TEU - Twenty Foot Equivalent Unit
73.4
92.1 93.4
101.2
114.1 120.2
FY07 FY08 FY09 FY10 FY11 FY12*
CAGR: 10.4%
MARCH
2013
India’s ports are benefitting from strong growth in external trade … (2/2)
19 19 For updated information, please visit www.ibef.org GROWTH DRIVERS
Ports
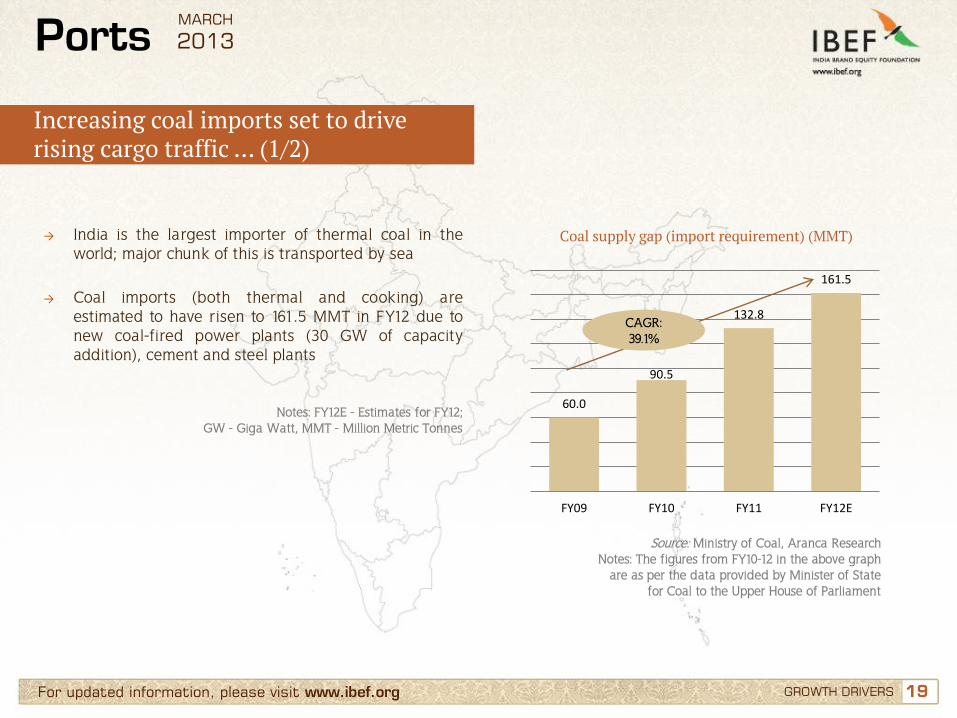
→ India is the largest importer of thermal coal in the world; major chunk of this is transported by sea
→ Coal imports (both thermal and cooking) are estimated to have risen to 161.5 MMT in FY12 due to new coal-fired power plants (30 GW of capacity addition), cement and steel plants
Coal supply gap (import requirement) (MMT)
Source: Ministry of Coal, Aranca Research Notes: The figures from FY10-12 in the above graph
are as per the data provided by Minister of State for Coal to the Upper House of Parliament
Notes: FY12E - Estimates for FY12; GW - Giga Watt, MMT - Million Metric Tonnes
60.0
90.5
132.8
161.5
FY09 FY10 FY11 FY12E
CAGR: 39.1%
MARCH
2013
Increasing coal imports set to drive rising cargo traffic … (1/2)

20 20 For updated information, please visit www.ibef.org GROWTH DRIVERS
Ports
→ Increasing coal imports are set to drive coal cargo traffic upwards at both major and non-major ports
→ With private ports boosting their coal handling capacities, non-major ports look set to handle majority of coal imports in the future.
→ Coal cargo traffic has grown at a CAGR 16.2 per cent over FY07-FY12 to reach 157.3 MMT
Coal cargo traffic (MMT)
Source: Ministry of Shipping, Aranca Research Notes: P - Data for FY12 is provisional
60 69 77 72 75 79
14 15
21 41 58
78
FY07 FY08 FY09 FY10 FY11 FY12P
Major ports Minor ports
MARCH
2013
Increasing coal imports set to drive rising cargo traffic … (2/2)
21 21
112 122
133
159 164 171
FY07 FY08 FY09 FY10 FY11 FY12P
For updated information, please visit www.ibef.org GROWTH DRIVERS
Ports
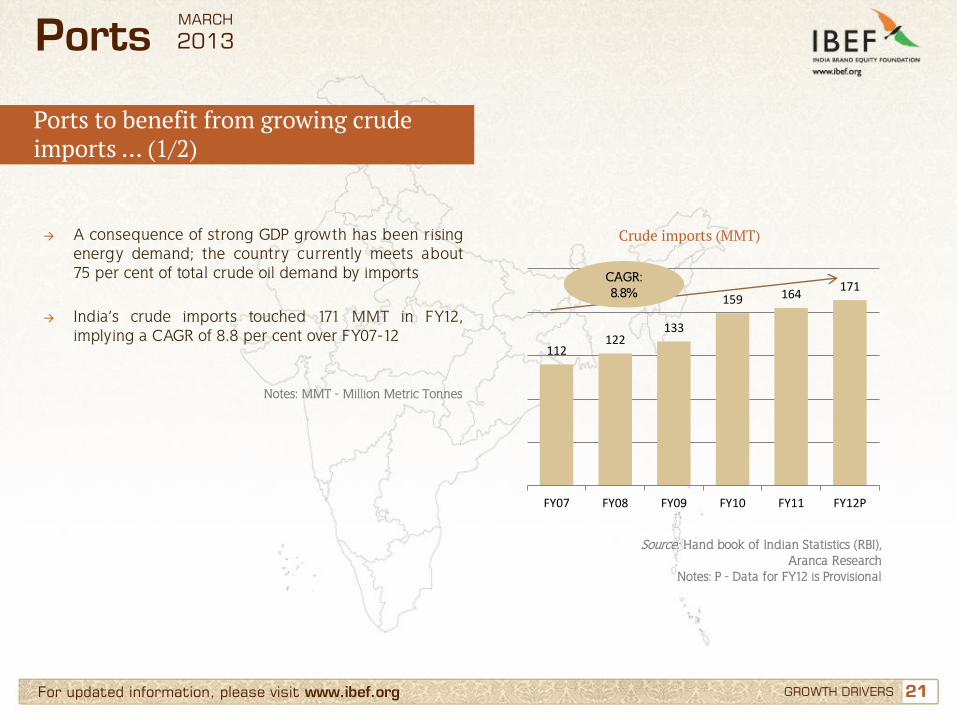
→ A consequence of strong GDP growth has been rising energy demand; the country currently meets about 75 per cent of total crude oil demand by imports
→ India’s crude imports touched 171 MMT in FY12, implying a CAGR of 8.8 per cent over FY07-12
Crude imports (MMT)
Source: Hand book of Indian Statistics (RBI), Aranca Research
Notes: P - Data for FY12 is Provisional
Notes: MMT - Million Metric Tonnes
CAGR: 8.8%
MARCH
2013
Ports to benefit from growing crude imports … (1/2)
22 22 For updated information, please visit www.ibef.org GROWTH DRIVERS
Ports
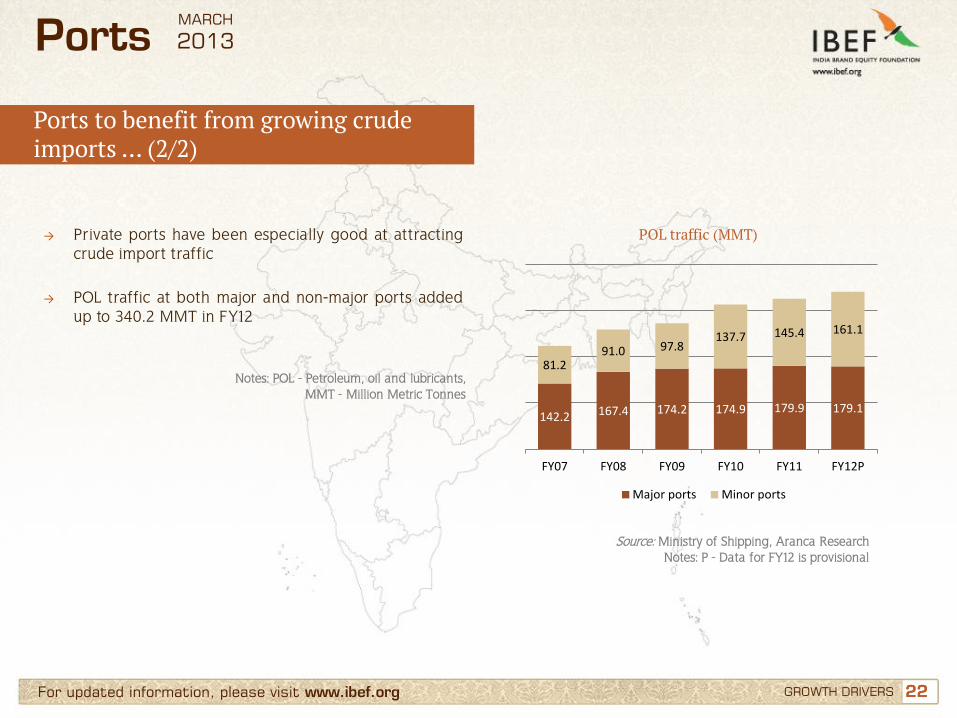
→ Private ports have been especially good at attracting crude import traffic
→ POL traffic at both major and non-major ports added up to 340.2 MMT in FY12
POL traffic (MMT)
Source: Ministry of Shipping, Aranca Research Notes: P - Data for FY12 is provisional
Notes: POL - Petroleum, oil and lubricants, MMT - Million Metric Tonnes
#
142.2 167.4 174.2 174.9 179.9 179.1
81.2 91.0 97.8
137.7 145.4 161.1
FY07 FY08 FY09 FY10 FY11 FY12P
Major ports Minor ports
MARCH
2013
Ports to benefit from growing crude imports … (2/2)
23 23 For updated information, please visit www.ibef.org GROWTH DRIVERS
Ports
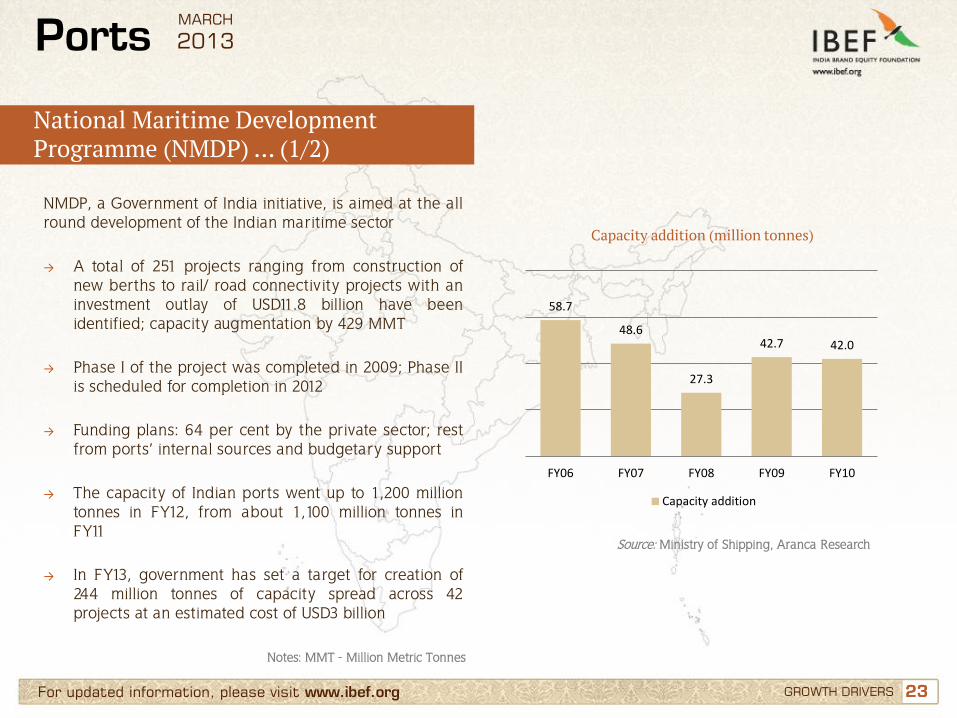
NMDP, a Government of India initiative, is aimed at the all round development of the Indian maritime sector → A total of 251 projects ranging from construction of
new berths to rail/ road connectivity projects with an investment outlay of USD11.8 billion have been identified; capacity augmentation by 429 MMT
→ Phase I of the project was completed in 2009; Phase II is scheduled for completion in 2012
→ Funding plans: 64 per cent by the private sector; rest from ports’ internal sources and budgetary support
→ The capacity of Indian ports went up to 1,200 million tonnes in FY12, from about 1,100 million tonnes in FY11
→ In FY13, government has set a target for creation of 244 million tonnes of capacity spread across 42 projects at an estimated cost of USD3 billion
Capacity addition (million tonnes)
Source: Ministry of Shipping, Aranca Research
Notes: MMT - Million Metric Tonnes
58.7
48.6
27.3
42.7 42.0
FY06 FY07 FY08 FY09 FY10
Capacity addition
MARCH
2013
National Maritime Development Programme (NMDP) … (1/2)
24 24 For updated information, please visit www.ibef.org GROWTH DRIVERS
Ports
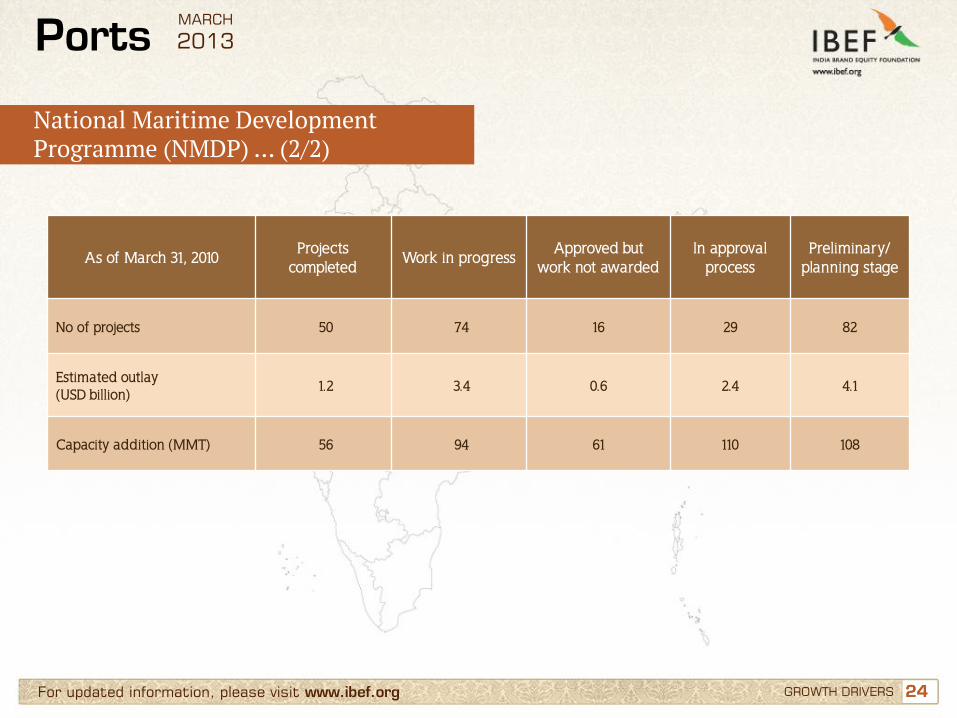
As of March 31, 2010 Projects
completed Work in progress
Approved but work not awarded
In approval process
Preliminary/ planning stage
No of projects 50 74 16 29 82
Estimated outlay (USD billion)
1.2 3.4 0.6 2.4 4.1
Capacity addition (MMT) 56 94 61 110 108
MARCH
2013
National Maritime Development Programme (NMDP) … (2/2)

25 25 For updated information, please visit www.ibef.org GROWTH DRIVERS
Ports
De-licensing and tax holidays
• Government has allowed FDI of up to 100 per cent under the automatic route for construction and maintenance of ports and harbours
• A 10-year tax holiday to enterprises engaged in the business of developing, maintaining and operating ports, inland waterways and inland ports
Price flexibility • Private ports enjoy price flexibility as the government allows non-major ports to
determine their own tariffs in consultation with the State Maritime Boards; at major ports, tariffs are regulated by the Tariff Authority for Major Ports (TAMP)
Model Concession Agreement ( MCA)
• An MCA has been finalised to bring transparency and uniformity to contractual agreements that major ports would enter into with selected bidders for projects under the Build, Operate and Transfer (BOT) model
Monopoly prevention
• The Ministry of Shipping has passed a regulation to prevent monopoly power -
• An existing private operator (at a port) cannot bid for the next terminal to handle similar kind of cargo at the same port
Source: Ministry of Shipping, Aranca Research Notes: FDI - Foreign Direct Investment
MARCH
2013
Favourable policies assisting the private sector
26 26 For updated information, please visit www.ibef.org GROWTH DRIVERS
Ports
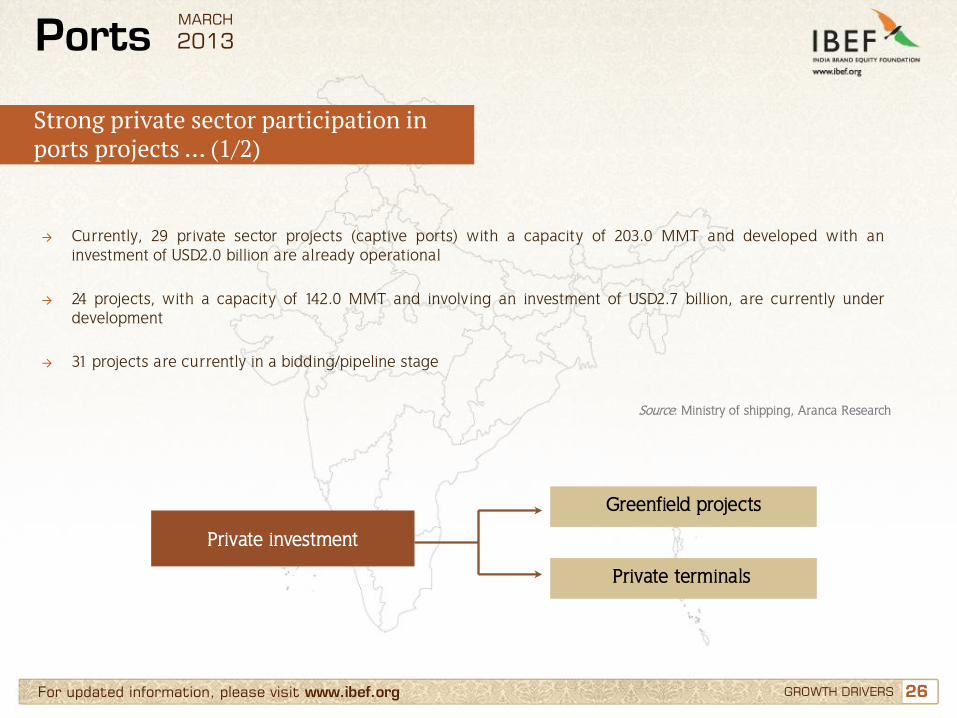
Private investment
Greenfield projects
Private terminals
Source: Ministry of shipping, Aranca Research
→ Currently, 29 private sector projects (captive ports) with a capacity of 203.0 MMT and developed with an investment of USD2.0 billion are already operational
→ 24 projects, with a capacity of 142.0 MMT and involving an investment of USD2.7 billion, are currently under development
→ 31 projects are currently in a bidding/pipeline stage
MARCH
2013
Strong private sector participation in ports projects … (1/2)
27 27 For updated information, please visit www.ibef.org GROWTH DRIVERS
Ports
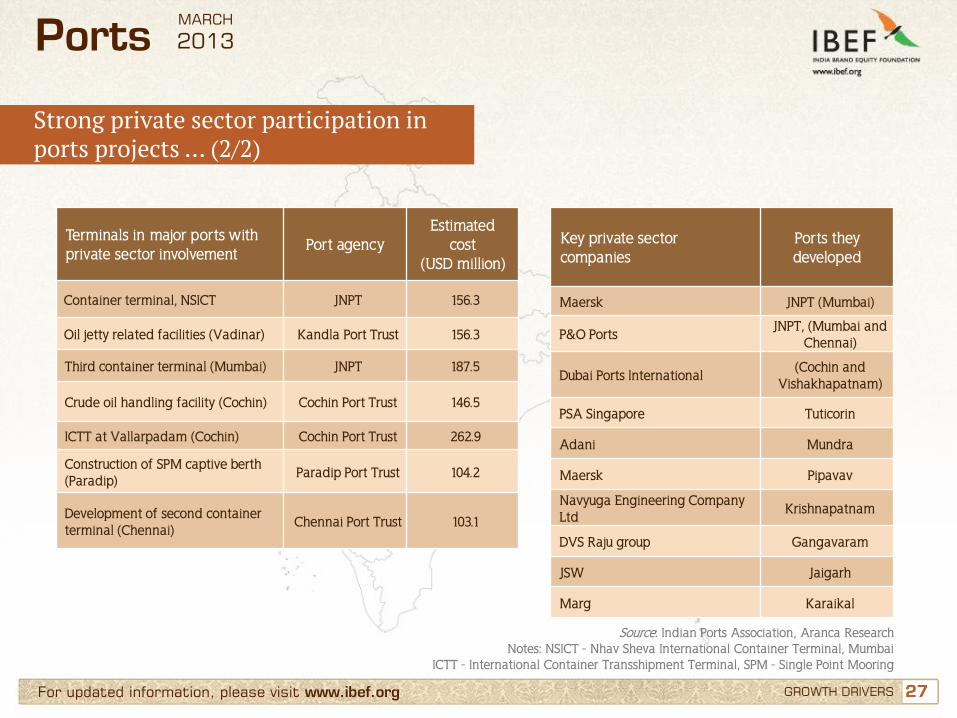
Private investment Terminals in major ports with private sector involvement
Port agency Estimated
cost (USD million)
Container terminal, NSICT JNPT 156.3
Oil jetty related facilities (Vadinar) Kandla Port Trust 156.3
Third container terminal (Mumbai) JNPT 187.5
Crude oil handling facility (Cochin) Cochin Port Trust 146.5
ICTT at Vallarpadam (Cochin) Cochin Port Trust 262.9
Construction of SPM captive berth (Paradip)
Paradip Port Trust 104.2
Development of second container terminal (Chennai)
Chennai Port Trust 103.1
Key private sector companies
Ports they developed
Maersk JNPT (Mumbai)
P&O Ports JNPT, (Mumbai and
Chennai)
Dubai Ports International (Cochin and
Vishakhapatnam)
PSA Singapore Tuticorin
Adani Mundra
Maersk Pipavav
Navyuga Engineering Company Ltd
Krishnapatnam
DVS Raju group Gangavaram
JSW Jaigarh
Marg Karaikal
Source: Indian Ports Association, Aranca Research Notes: NSICT - Nhav Sheva International Container Terminal, Mumbai
ICTT - International Container Transshipment Terminal, SPM - Single Point Mooring
MARCH
2013
Strong private sector participation in ports projects … (2/2)
28 28 For updated information, please visit www.ibef.org GROWTH DRIVERS
Ports
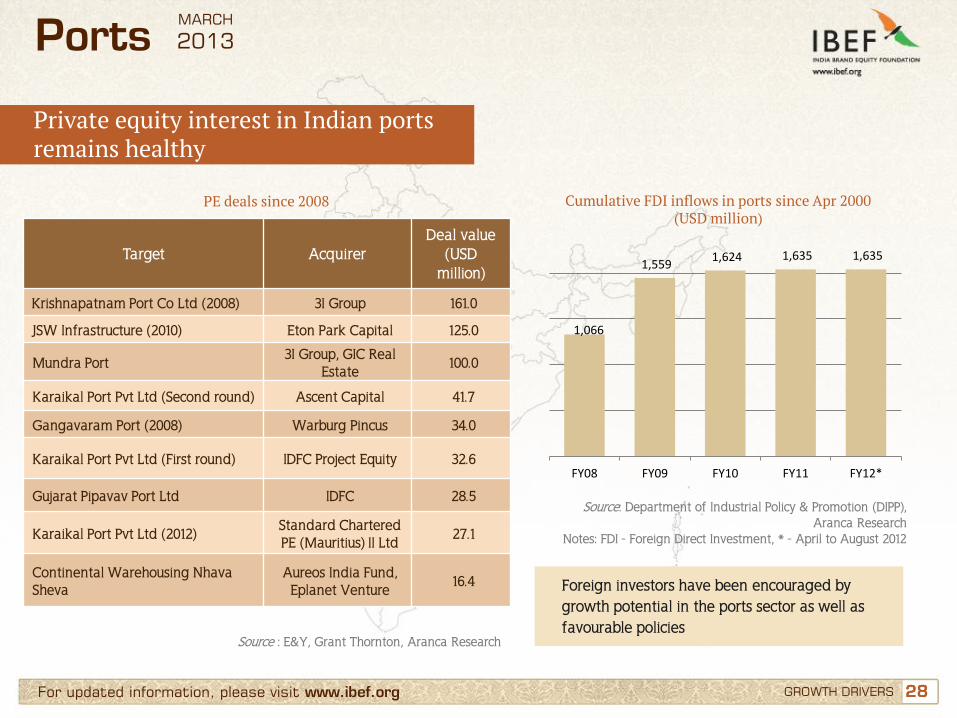
Target Acquirer Deal value
(USD million)
Krishnapatnam Port Co Ltd (2008) 3I Group 161.0
JSW Infrastructure (2010) Eton Park Capital 125.0
Mundra Port 3I Group, GIC Real
Estate 100.0
Karaikal Port Pvt Ltd (Second round) Ascent Capital 41.7
Gangavaram Port (2008) Warburg Pincus 34.0
Karaikal Port Pvt Ltd (First round) IDFC Project Equity 32.6
Gujarat Pipavav Port Ltd IDFC 28.5
Karaikal Port Pvt Ltd (2012) Standard Chartered PE (Mauritius) II Ltd
27.1
Continental Warehousing Nhava Sheva
Aureos India Fund, Eplanet Venture
16.4
Source : E&Y, Grant Thornton, Aranca Research
PE deals since 2008 Cumulative FDI inflows in ports since Apr 2000 (USD million)
Source: Department of Industrial Policy & Promotion (DIPP), Aranca Research
Notes: FDI - Foreign Direct Investment, * - April to August 2012
Foreign investors have been encouraged by growth potential in the ports sector as well as favourable policies
1,066
1,559 1,624 1,635 1,635
FY08 FY09 FY10 FY11 FY12*
MARCH
2013
Private equity interest in Indian ports remains healthy
29 29
Contents
Advantage India
Market overview and trends
Growth drivers
Success stories: Mundra port, JNPT
Opportunities
Useful information
For updated information, please visit www.ibef.org
Ports MARCH
2013
30 30
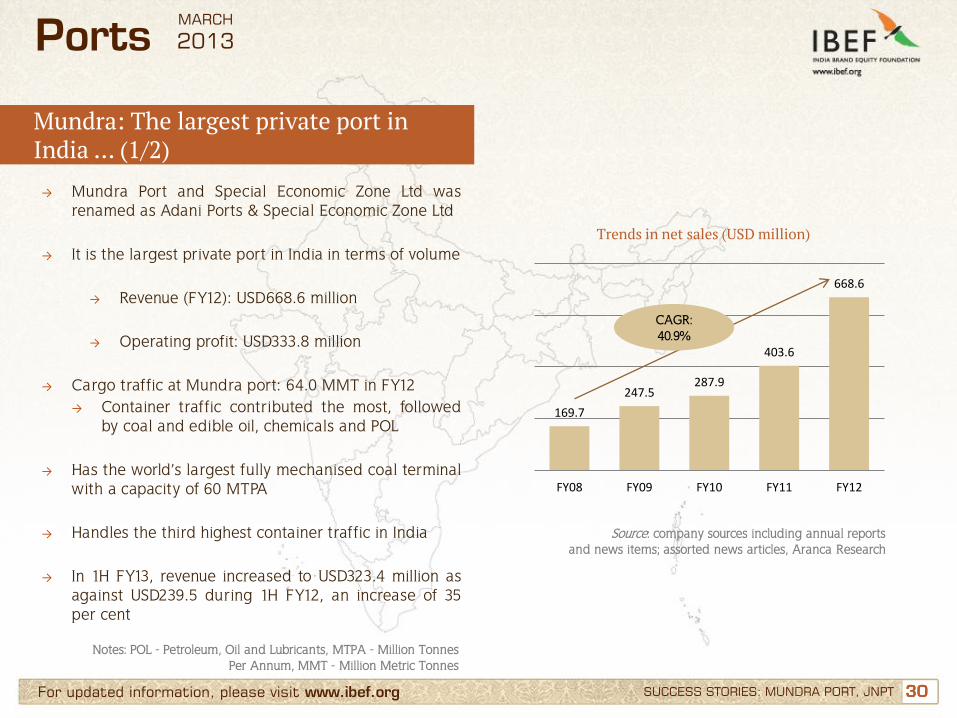
169.7
247.5 287.9
403.6
668.6
FY08 FY09 FY10 FY11 FY12
CAGR: 40.9%
For updated information, please visit www.ibef.org SUCCESS STORIES: MUNDRA PORT, JNPT
Ports
→ Mundra Port and Special Economic Zone Ltd was renamed as Adani Ports & Special Economic Zone Ltd
→ It is the largest private port in India in terms of volume
→ Revenue (FY12): USD668.6 million
→ Operating profit: USD333.8 million
→ Cargo traffic at Mundra port: 64.0 MMT in FY12 → Container traffic contributed the most, followed
by coal and edible oil, chemicals and POL
→ Has the world’s largest fully mechanised coal terminal with a capacity of 60 MTPA
→ Handles the third highest container traffic in India
→ In 1H FY13, revenue increased to USD323.4 million as against USD239.5 during 1H FY12, an increase of 35 per cent
Trends in net sales (USD million)
Notes: POL - Petroleum, Oil and Lubricants, MTPA - Million Tonnes Per Annum, MMT - Million Metric Tonnes
Source: company sources including annual reports and news items; assorted news articles, Aranca Research
MARCH
2013
Mundra: The largest private port in India … (1/2)
31 31 For updated information, please visit www.ibef.org SUCCESS STORIES: MUNDRA PORT, JNPT
Ports
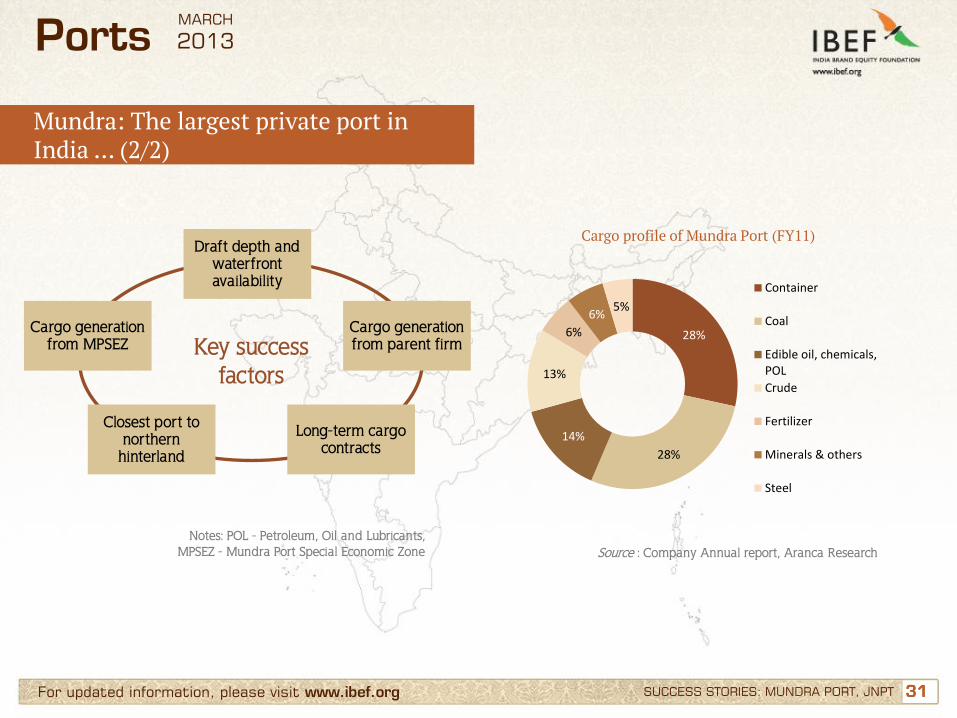
Cargo profile of Mundra Port (FY11)
Notes: POL - Petroleum, Oil and Lubricants, MPSEZ - Mundra Port Special Economic Zone
Draft depth and waterfront availability
Cargo generation from MPSEZ
Closest port to northern
hinterland
Cargo generation from parent firm
Long-term cargo contracts
28%
28%
14%
13%
6%
6% 5%
Container
Coal
Edible oil, chemicals,POL
Crude
Fertilizer
Minerals & others
Steel
Source : Company Annual report, Aranca Research
MARCH
2013
Key success factors
Mundra: The largest private port in India … (2/2)
32 32 For updated information, please visit www.ibef.org SUCCESS STORIES: MUNDRA PORT, JNPT
Ports
→ Jawaharlal Nehru Port Trust (JNPT) has the third highest cargo traffic and the highest container traffic in the country
→ It is a container-focussed port with container traffic of 58.3 MMT in FY12 (about 89 per cent of it’s total cargo traffic)
→ Traffic handled at JNPT for 1H FY13 was 32.6 MMT → Distribution of JNPT’s container traffic for FY12 across its various terminals was as follows -
→ Jawaharlal Nehru Port Container Terminal (JNPCT): 1.03 million TEUs
→ Nhava Sheva International Container Terminal (NSICT): 1.40 MMT → APM Terminals: 1.9 MMT
Notes : TEU - Twenty foot Equivalent Unit, MMT - Million Metric Tonnes
MARCH
2013
JNPT: Major port with the largest container capacity … (1/2)
33 33 For updated information, please visit www.ibef.org SUCCESS STORIES: MUNDRA PORT, JNPT
Ports
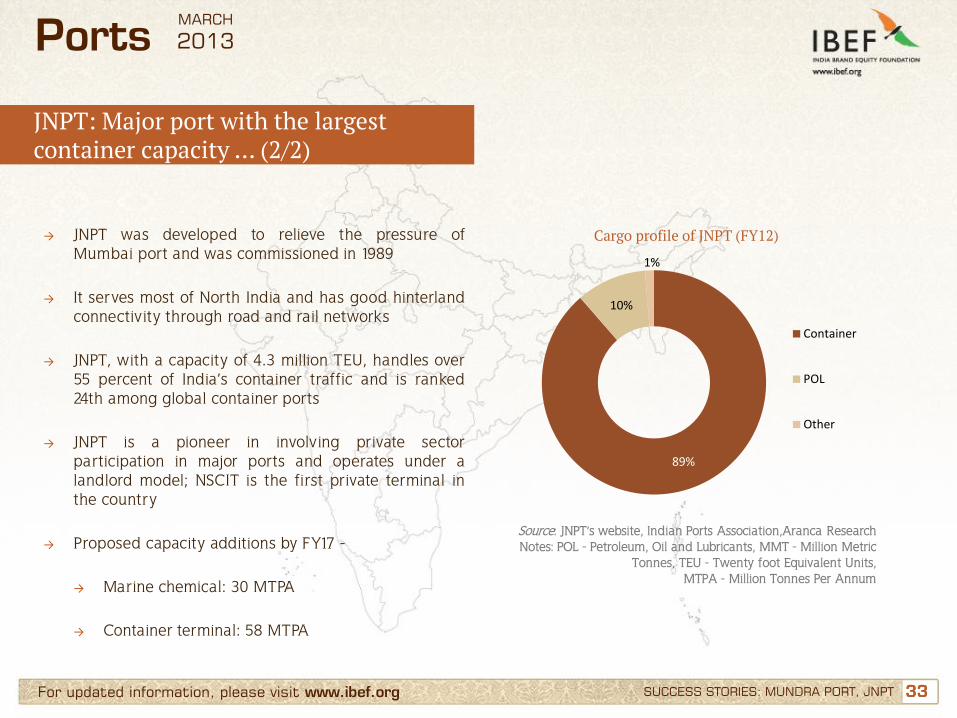
→ JNPT was developed to relieve the pressure of Mumbai port and was commissioned in 1989
→ It serves most of North India and has good hinterland connectivity through road and rail networks
→ JNPT, with a capacity of 4.3 million TEU, handles over 55 percent of India’s container traffic and is ranked 24th among global container ports
→ JNPT is a pioneer in involving private sector participation in major ports and operates under a landlord model; NSCIT is the first private terminal in the country
→ Proposed capacity additions by FY17 - → Marine chemical: 30 MTPA
→ Container terminal: 58 MTPA
Cargo profile of JNPT (FY12)
Source: JNPT’s website, Indian Ports Association,Aranca Research Notes: POL - Petroleum, Oil and Lubricants, MMT - Million Metric
Tonnes, TEU - Twenty foot Equivalent Units, MTPA - Million Tonnes Per Annum
89%
10%
1%
Container
POL
Other
MARCH
2013
JNPT: Major port with the largest container capacity … (2/2)
34 34
Contents
Advantage India
Market overview and trends
Growth drivers
Success stories: Mundra port, JNPT
Opportunities
Useful information
For updated information, please visit www.ibef.org
Ports MARCH
2013
35 35 For updated information, please visit www.ibef.org OPPORTUNITIES
Opportunities
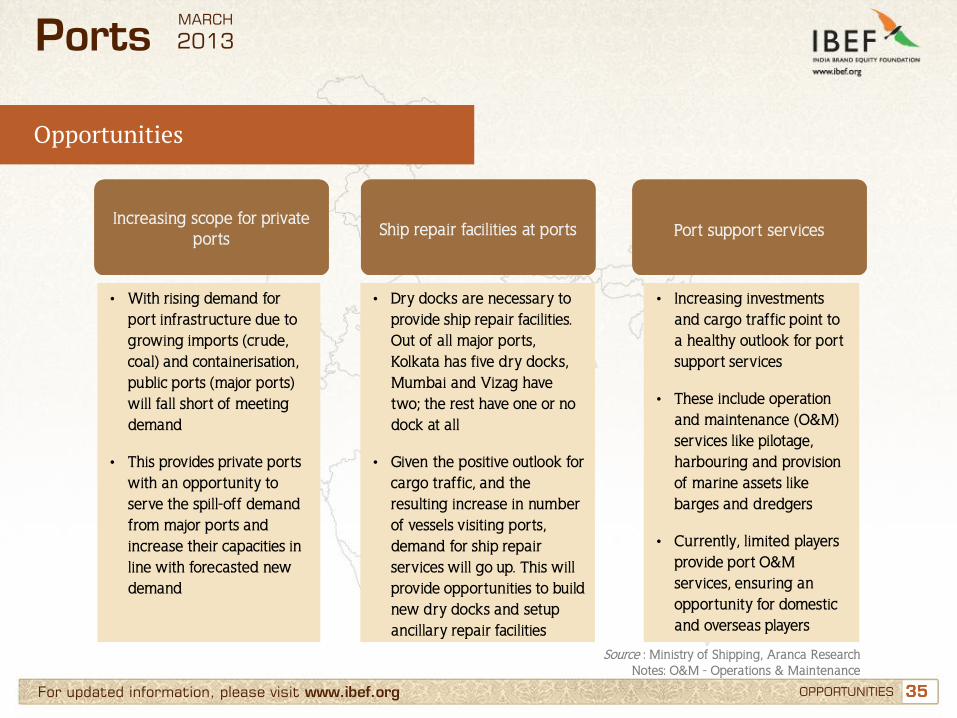
• With rising demand for port infrastructure due to growing imports (crude, coal) and containerisation, public ports (major ports) will fall short of meeting demand
• This provides private ports with an opportunity to serve the spill-off demand from major ports and increase their capacities in line with forecasted new demand
• Dry docks are necessary to provide ship repair facilities. Out of all major ports, Kolkata has five dry docks, Mumbai and Vizag have two; the rest have one or no dock at all
• Given the positive outlook for cargo traffic, and the resulting increase in number of vessels visiting ports, demand for ship repair services will go up. This will provide opportunities to build new dry docks and setup ancillary repair facilities
• Increasing investments and cargo traffic point to a healthy outlook for port support services
• These include operation and maintenance (O&M) services like pilotage, harbouring and provision of marine assets like barges and dredgers
• Currently, limited players provide port O&M services, ensuring an opportunity for domestic and overseas players
Increasing scope for private ports Ship repair facilities at ports Port support services
Ports
Source : Ministry of Shipping, Aranca Research Notes: O&M - Operations & Maintenance
MARCH
2013
36 36
Contents
Advantage India
Market overview and trends
Growth drivers
Success stories: Mundra port, JNPT
Opportunities
Useful information
For updated information, please visit www.ibef.org
Ports MARCH
2013
37 37 For updated information, please visit www.ibef.org USEFUL INFORMATION
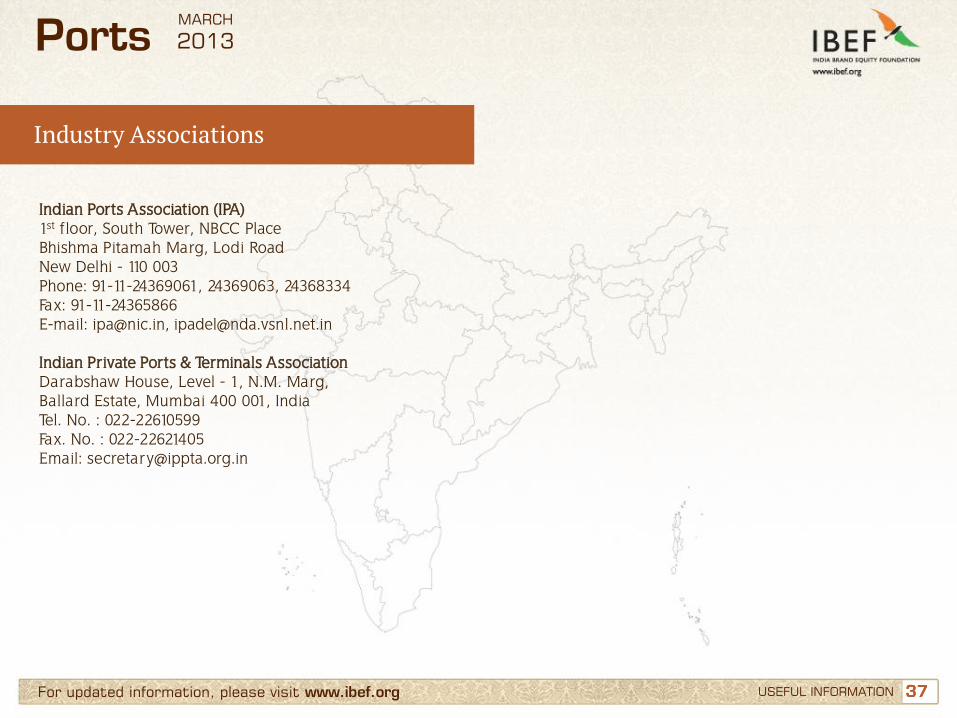
Industry Associations
Ports
Indian Ports Association (IPA) 1st floor, South Tower, NBCC Place Bhishma Pitamah Marg, Lodi Road New Delhi - 110 003 Phone: 91-11-24369061, 24369063, 24368334 Fax: 91-11-24365866 E-mail: [email protected], [email protected] Indian Private Ports & Terminals Association Darabshaw House, Level - 1, N.M. Marg, Ballard Estate, Mumbai 400 001, India Tel. No. : 022-22610599 Fax. No. : 022-22621405 Email: [email protected]
MARCH
2013
38 38 For updated information, please visit www.ibef.org
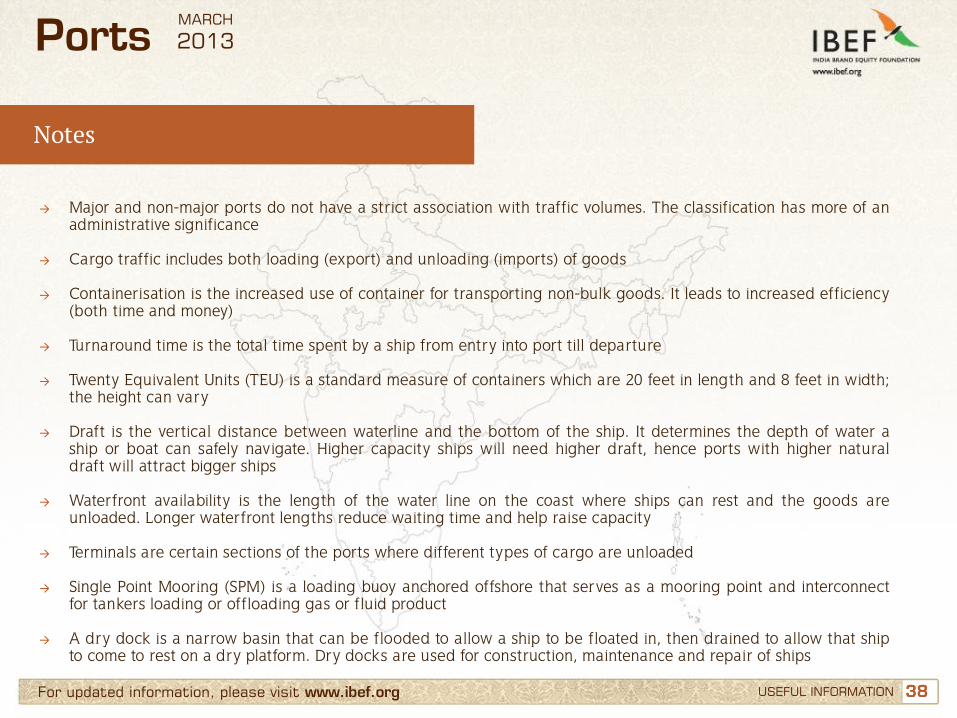
Notes
→ Major and non-major ports do not have a strict association with traffic volumes. The classification has more of an administrative significance
→ Cargo traffic includes both loading (export) and unloading (imports) of goods
→ Containerisation is the increased use of container for transporting non-bulk goods. It leads to increased efficiency
(both time and money)
→ Turnaround time is the total time spent by a ship from entry into port till departure
→ Twenty Equivalent Units (TEU) is a standard measure of containers which are 20 feet in length and 8 feet in width; the height can vary
→ Draft is the vertical distance between waterline and the bottom of the ship. It determines the depth of water a ship or boat can safely navigate. Higher capacity ships will need higher draft, hence ports with higher natural draft will attract bigger ships
→ Waterfront availability is the length of the water line on the coast where ships can rest and the goods are unloaded. Longer waterfront lengths reduce waiting time and help raise capacity
→ Terminals are certain sections of the ports where different types of cargo are unloaded
→ Single Point Mooring (SPM) is a loading buoy anchored offshore that serves as a mooring point and interconnect for tankers loading or offloading gas or fluid product
→ A dry dock is a narrow basin that can be flooded to allow a ship to be floated in, then drained to allow that ship to come to rest on a dry platform. Dry docks are used for construction, maintenance and repair of ships
USEFUL INFORMATION
Ports MARCH
2013
39 39 For updated information, please visit www.ibef.org
Glossary … (1/2)
→ FY: Indian Financial Year (April to March) - So FY11 implies April 2010 to March 2011
→ USD: US Dollar - Conversion rate used: USD1= INR48
→ FDI: Foreign Direct Investment
→ IPA: Indian Ports Association
→ NMDP : National Maritime Development Programme
→ POL : Petroleum, Oil & Lubricants
→ SEZ : Special Economic Zone
→ CAGR : Compounded Annual Growth Rate
→ ICTT: International Container Transshipment Terminal
→ TEU : Twenty Foot Equivalent Units
→ MMTPA: Million Metric Tonnes Per Annum
→ MMT :Million Metric Tonnes
USEFUL INFORMATION
Ports MARCH
2013
40 40 For updated information, please visit www.ibef.org
Glossary … (2/2)
→ GOI : Government of India
→ NSICT : Nhav Sheva International Container Terminal, Mumbai
→ O&M : Operation and Maintenance services
→ LNG : Liquefied Natural Gas
→ Wherever applicable, numbers have been rounded off to the nearest whole number
USEFUL INFORMATION
Ports MARCH
2013
41
India Brand Equity Foundation (IBEF) engaged Aranca to prepare this presentation and the same has been prepared by Aranca in consultation with IBEF. All rights reserved. All copyright in this presentation and related works is solely and exclusively owned by IBEF. The same may not be reproduced, wholly or in part in any material form (including photocopying or storing it in any medium by electronic means and whether or not transiently or incidentally to some other use of this presentation), modified or in any manner communicated to any third party except with the written approval of IBEF. This presentation is for information purposes only. While due care has been taken during the compilation of this
presentation to ensure that the information is accurate to the best of Aranca and IBEF’s knowledge and belief, the content is not to be construed in any manner whatsoever as a substitute for professional advice. Aranca and IBEF neither recommend nor endorse any specific products or services that may have been mentioned in this presentation and nor do they assume any liability or responsibility for the outcome of decisions taken as a result of any reliance placed on this presentation. Neither Aranca nor IBEF shall be liable for any direct or indirect damages that may arise due to any act or omission on the part of the user due to any reliance placed or guidance taken from any portion of this presentation.
For updated information, please visit www.ibef.org DISCLAIMER
Ports MARCH
2013
Disclaimer