
Types of Maps Mercator Projections Conic Projections Gnomonic Projections Topographic Maps.
MINISTRY OF EDUCATlO I UNDPI UNESCO
EDUCATION SECTOR STUDY PROJECT
IMYA /90 / 0041
• •No. 1.5
Population Projections
by
U Ny_n Myin!
Myenme, Educetlon A....rch B....uY_noon
FebruIry • 1992
\
Population Projections
by
U Nyan Myint
(Institute of Economics)
Aclrnowledgement: This paper IS the outcome of the collaborative effort of ESS Working Group No.l(Education Data Review and AnalysIs). The working group, chaired by U Tun Hla (OBE), included the followingmembers: U Myat Nalng (MERB), U Saw Win (Institute of Economics), U Nyan Myint (Institute of Economics),U Them Htay (OHEl, U Nyunt Maung lOTAVEl, Or. Tracy Sein (Institute of Medicme 1l, U Them Wan (MERB),Oaw Nge Ma Ma Than (Institute of Computer SCience and Technology).
ABSTRACT
This paper makes a set of population projections for Myanmar with special reference to thepopulation projections for school-going age groups. Information about fertility, mortality andmigration levels has been used in making these projections. The findings show among other things,that the population at the primary school going ages, 5-9, was around 4.6 million in 1983 and willbecome 5.9 million and 6.8 million by the year 2000 and 2013 respectively.
PREFACE
The Ministry of Education, UNDP and UNESCO are engaged in a joint effort to review the presentstate of education and manpower training in the Union of Myanmar. This review is being carriedout under the Education Sector Study project, which began in mid-1990. The objective of theproject is to help improving Myanrnar's education system so it can make contribute moreeffectively to the country's social and economic development. The first phase of the EducationSector Study (ESS), a detailed diagnosis and analysis of the needs of the education sector, is nowcompleted. A synthesis of the main findings has been issued in a separate report.
This paper is one of a series of working papers produced by Myanmar ESS participants. The seriescovers various important aspects of education, s~ch as quality and efficiency, linkages betweeneducation and employment, costs and financing, school facilities, and sector organization andmanagement. The ESS Working Papers series addresses itself to all professional staff in theeducation sector, as well as to interested researchers. It is hoped that these papers will contributeto stimulate a national discussion on ways and means to improve Myanmar's education system.
Khin Maung Kyweh:~\IIO!',\: : 'i\)Je~t Dl\ectol
Antoine SchwartL
C;!, t!t I echnlcd; I\JVlb(~1

DBEDHEDTAVEESSMERB
LIST OF ABBREVIATIONS
Department of Basic EducationDepartment of Higher EducationDepartment of Technical, Agricultural and Vocational EducationEducation Sector StudyMyanmar Education Research Bureau
TABLE OF CONTENTS
Page
I. INTRODUCTION .
11. GROWTH OF THE POPULATION OF MYANMAR 2
Ill. GEOGRAPHIC AND DEMOGRAPHIC BACKGROUND . . . . . . . . . . . . . . . . . . . . . .. 3
IV. PREPARATION FOR THE PROJECTIONS. . . . . . . . . . . . . . . . . . . . . . . . . . . . . .. 8
V. METHOD AND OUTPUT OF THE PROJECTIONS 15
VI. CONCLUSION. . . . . . . . . . . . . . . . . . . . . . . . . . . . . . . . . . . . . . . . . . . . . . .. 17
BIBLIOGRAPHY 21
ANNEXES
12
3
4
5678
9
1011
12345
LIST OF TABLES
Censuses and Population of Myanmar, 1901-1990Population, Area, Density, Percentage of Urban Residents and Percentage ofPopulation in States and Divisions (1983)Number of Towns Covered by the Vital Registration, Crude Birth and Death Rates,and Infant and Maternal Mortality Rates in the Urban Areas, 1949-89Estimated Crude Birth Rates, Total Fertility Rates and Sex-Ratios at Birth:1973-1983Projected Total Fertility Rates: (1983-88 and 2013-18)Estimated Life Expectancy at Birth by SexProjected Life Expectancy at Birth by Sex (1983-88 and 2013-18)Total Fertility Rate and Life Expectancies for Myanmar and its Neighbours, 1960-65and 1980-85Percentage of Total Population in Each StateI Division and Average Annual growthRates for the PeriodsDependency Ratios and Sex Ratios for the Years 1983, 2000 and 2013Population at the Selected School-Going Ages for the Years 1983, 2000 and 2013(in Thousands)
LIST OF GRAPHS
Crude Birth and Death Rates in MyanmarAge-Specific Fertility Rate (1982-83)Projected Total Fertility RatesLife Expectancy at Birth for Both SexesProjected Population of Myanmar
Page
2
4
5
9101213
13
1718
19
CHAYfER I
INTRODUCTION
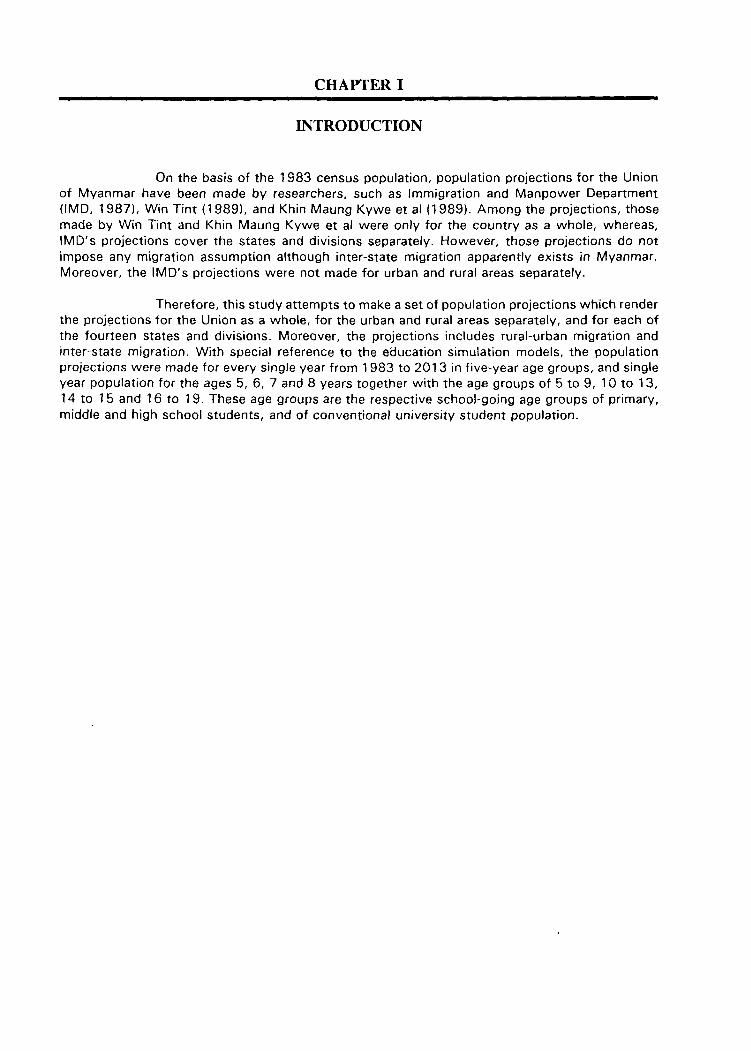
On the basis of the 1983 census population, population projections for the Unionof Myanmar have been made by researchers, such as Immigration and Manpower Department(IMD, 1987), Win Tint (1989), and Khin Maung Kywe et al (1989). Among the projections, thosemade by Win Tint and Khin Maung Kywe et al were only for the country as a whole, whereas,IMD's projections cover the states and divisions separately. However, those projections do notimpose any migration assumption although inter-state migration apparently exists in Myanmar.Moreover, the IMD's projections were not made for urban and rural areas separately.
Therefore, this study attempts to make a set of population projections which renderthe proj~ctions for the Union as a whole, for the urban and rural areas separately, and for each ofthe fourteen states and divisions. Moreover, the projections includes rural-urban migration andinter-state migration. With special reference to the eaucation simulation models, the populationprojections were made for every single year from 1983 to 2013 in five-year age groups, and singleyear population for the ages 5, 6, 7 and 8 years together with the age groups of 5 to 9, 10 to 13,14 to 15 and 16 to 19. These age groups are the respective school-going age groups of primary,middle and high school students, and of conventional university student population.
CHAPTERn
GROWTH OF THE POPULATION OF MYANMAR
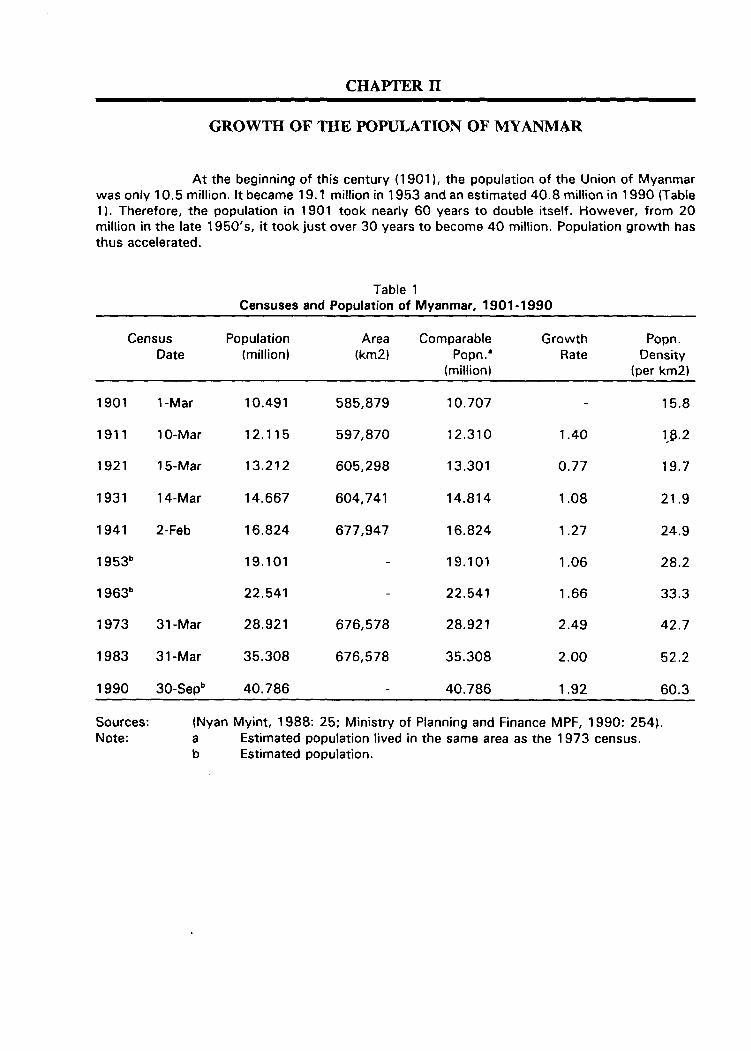
At the beginning of this century (1901), the population of the Union of Myanmarwas only 10.5 million. It became 19.1 million in 1953 and an estimated 40.8 million in 1990 (Table1). Therefore, the population in 1901 took nearly 60 years to double itself. However, from 20million in the late 1950's, it took just over 30 years to become 40 million. Population growth hasthus accelerated.
Table 1Censuses and Population of Myanmar, 1901-1990
Census Population Area Comparable Growth Popn.Date (million) (km2) Popn.· Rate Density
(million) (per km2)
1901 1-Mar 10.491 585,879 10.707 15.8
1911 10-Mar 12.115 597,870 12.310 1.40 lJ~.2
1921 15-Mar 13.212 605,298 13.301 0.77 19.7
1931 14-Mar 14.667 604,741 14.814 1.08 21.9
1941 2-Feb 16.824 677,947 16.824 1.27 24.9
1953b 19.101 19.101 1.06 28.2
1963b 22.541 22.541 1.66 33.3
1973 31-Mar 28.921 676,578 28.921 2.49 42.7
1983 31-Mar 35.308 676,578 35.308 2.00 52.2
1990 30-Sepb 40.786 40.786 1.92 60.3
Sources: (Nyan Myint, 1988: 25; Ministry of Planning and Finance MPF, 1990: 254~.
Note: a Estimated population lived in the same area as the 1973 census.b Estimated population.
CHAPTER ID
GEOGRAPHIC AND DEMOGRAPHIC BACKGROUND
Myanmar is situated in the Indo-China peninsula and borders with China in thenorth, Laos and Thailand in the east, and Bangladesh and India in the west. Myanmar has about2,300 kilometres of coastline in the west and south along the Bay of Bengal. The area of Myanmaris 676,578 square kilometres of which about 48 per cent is covered by forests and more than halfof the land is mountainous. Central and Lower Myanmar consist of valleys or flat plains with smallhills, but the northern and eastern parts are hilly and mountainous. Three mountain ranges,beginning from the eastern extremity of the Himalayan mountain range, run parallel to each otherfrom north to south.
Some parts of the Western Mountain Ranges, with a height of 1,000 to 3,000metres above sea level, make a natural wall between Myanmar and India. Similarly, the mountainsof Tibet, with an average height of 3,000 metres, and the Eastern Ranges, with a height of 1,000metres, separate Myanmar from China, Laos and Thailand. These walls have protected Myanmarfrom huge waves of immigration along the land routes from two population giants, China and India.
Myanmar comprises seven states and seven divisions. Under these 14 mainadministrative entities, there are 31 8 townships. The major ethnic groups, in descending order bythe size of population, are Bama, Shan, Kayin, Rakhine, Mon, Chin, Kachin and Kayah. Bama livemainly in the divisions, and the other major ethnic groups live mainly in the states with their ethnicnames. As most parts of Myanmar are mountainous and covered with deep forests, and asMyanmar also has plenty of rivers and streams, communications, not only between Myanmar andits neighbours but also within Myanmar, especially in the sta~es are still very difficult.
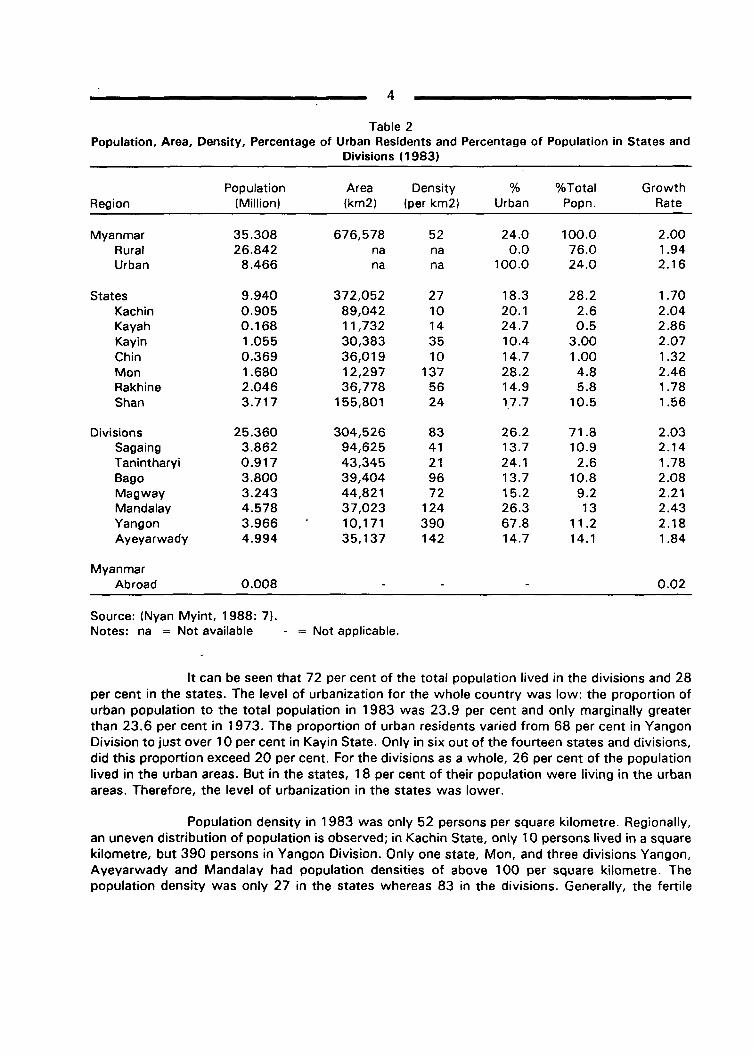
According to the 1983 census, the total population of Myanmar was 35.3 million,of which 17.8 (50.4 per cent) were females and 17.5 million were males. Thus, the sex ratio ofthe whole population was 98.5 (males per 100 females). Of the total population, 69 per cent wereBama. Again, 40 per cent of the total population were under the age of 15, and only 6 per centwere 60 and above. The population residing in the states and divisions are presented in Table 2together with the area, population density, percentage of urban residents and percentage ofpopulation living in each state/division.
4
Table 2Population, Area, Density, Percentage of Urban Residents and Percentage of Population in States and
Divisions (1983)
Population Area Density % %Total GrowthRegion (Million) (km2) (per km2l Urban Popn. Rate
Myanmar 35.308 676,578 52 24.0 100.0 2.00Rural 26.842 na na 0.0 76.0 1.94Urban 8.466 na na 100.0 24.0 2.16
States 9.940 372,052 27 18.3 28.2 1.70Kachin 0.905 89,042 10 20.1 2.6 2.04Kayah 0.168 11,732 14 24.7 0.5 2.86Kayin 1.055 30,383 35 10.4 3.00 2.07Chin 0.369 36,019 10 14.7 1.00 1.32Mon 1.680 12,297 137 28.2 4.8 2.46Rakhine 2.046 36,778 56 14.9 5.8 1.78Shan 3.717 155,801 24 1,7 .7 10.5 1.56
Divisions 25.360 304,526 83 26.2 71.8 2.03Sagaing 3.862 94,625 41 13.7 10.9 2.14Tanintharyi 0.917 43,345 21 24.1 2.6 1.788ago 3.800 39,404 96 13.7 10.8 2.08Magway 3.243 44,821 72 15.2 9.2 2.21Mandalay 4.578 37,023 124 26.3 13 2.43Yangon 3.966 10,171 390 67.8 11.2 2.18Ayeyarwady 4.994 35,137 142 14.7 14.1 1.84
MyanmarAbroad 0.008 0.02
Source: (Nyan Myint, 1988: 7).Notes: na = Not available - = Not applicable.
It can be seen that 72 per cent of the total population lived in the divisions and 28per cent in the states. The level of urbanization for the whole country was low: the proportion ofurban population to the total population in 1983 was 23.9 per cent and only marginally greaterthan 23.6 per cent in 1973. The proportion of urban residents varied from 68 per cent in YangonDivision to just over 10 per cent in Kayin State. Only in six out of the fourteen states and divisions,did this proportion exceed 20 per cent. For the divisions as a whole, 26 per cent of the populationlived in the urban areas. But in the states, 18 per cent of their population were living in the urbanareas. Therefore, the level of urbanization in the states was lower.
Population density in 1983 was only 52 persons per square kilometre. Regionally,an uneven distribution of population is observed; in Kachin State, only 10 persons lived in a squarekilometre, but 390 persons in Yangon Division. Only one state, Mon, and three divisions Yangon,Ayeyarwady and Mandalay had population densities of above 100 per square kilometre. Thepopulation density was only 27 in the states whereas 83 in the divisions. Generally, the fertile
5
lowlands and the delta of the Ayeyarwady basin are densely populated, whilst the northern andeastern parts of Myanmar are sparsely populated. If compared with the neighbouring countries,Myanmar population density is the third lowest in South-East Asia after Laos and Kampuchea.
During the last intercensal period, 1973-83, the annual population growth rates ofthe Union of Myanmar was 2.0 per cent. Although the growth rate of 2 per cent could be regardedas moderately low by developing countries' standard, Myanmar population will again be doubledwithin 35 years if the recent growth rate continues. That is, Myanmar population will become 80million by 2025. On the other hand, the Union of Myanmar has been regarded as underpopulatedby its governments although its population has been increasing throughout the century (UnitedNations Fund for Population Activities, UNFPA, 1987: 79).
Fertility and Mortality
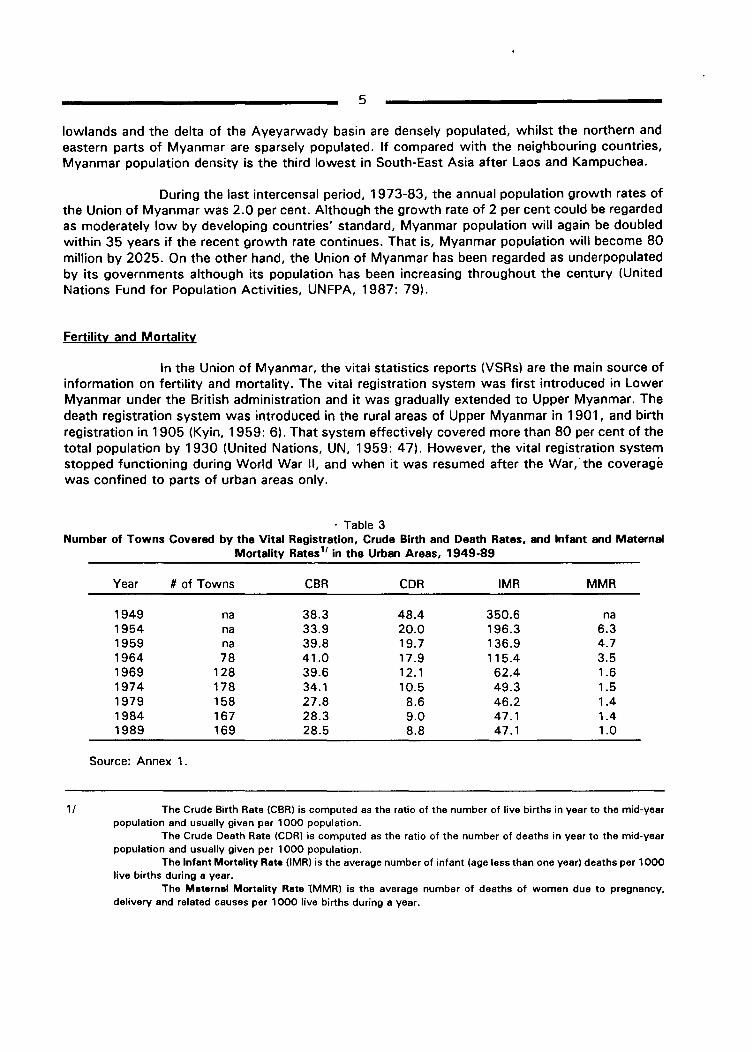
In the Union of Myanmar, the vital statistics reports (VSRs) are the main source ofinformation on fertility and mortality. The vital registration system was first introduced in LowerMyanmar under the British administration and it was gradually extended to Upper Myanmar. Thedeath registration system was introduced in the rural areas of Upper Myanmar in 1901, and birthregistration in 1905 (Kyin, 1959: 6). That system effectively covered more than 80 per cent of thetotal population by 1930 (United Nations, UN, 1959: 47). However, the vital registration systemstopped functioning during World War 11, and when it was resumed after the War, the coveragewas confined to parts of urban areas only .
. Table 3Number of Towns Covered by the Vital Registration, Crude Birth and Death Rates, and Infant and Maternal
Mortality Rates1/ in the Urban Areas, 1949-89
Year # of Towns CBR CDR IMR MMR
1949 na 38.3 48.4 350.6 na1954 na 33.9 20.0 196.3 6.31959 na 39.8 19.7 136.9 4.71964 78 41.0 17.9 115.4 3.51969 128 39.6 12.1 62.4 1.61974 178 34.1 10.5 49.3 1.51979 158 27.8 8.6 46.2 1.41984 167 28.3 9.0 47.1 1.41989 169 28.5 8.8 47.1 1.0
Source: Annex 1.
l' The Crude Birth Rate (CBR) is computed as the ratio of the number of live births in year to the mid-yearpopulation and usually given per 1000 population.
The Crude Death Rate (COR) is computed as the ratio of the number of deaths in year to the mid-yearpopulation and usually given per 1000 populatio!1.
The Infant Mortality Rate (IMR) is the average number of infant (age less than one year) deaths per 1000live births during a year.
The Maternal Mortality Rate 1MMR) is the average number of deaths of women due to pregnancy,delivery and related causes per 1000 live births during a year.
6
The current vital registration system covers nearly 90 per cent of the total urbanpopulation, but less than 10 per cent of the total rural population (CSO, 1989: 1). Moreover, thenumber of towns covered by the system varies (Table 3) and births and deaths are severelyunder-reported (Hpu, 1984: 126). Therefore, the vital statistics reports cannot be taken asaccurate even for the urban areas. In the given situation, however, these figures are the onlyinformation available to shed some light on the general trend of fertility and mortality in the Unionof Myanmar.
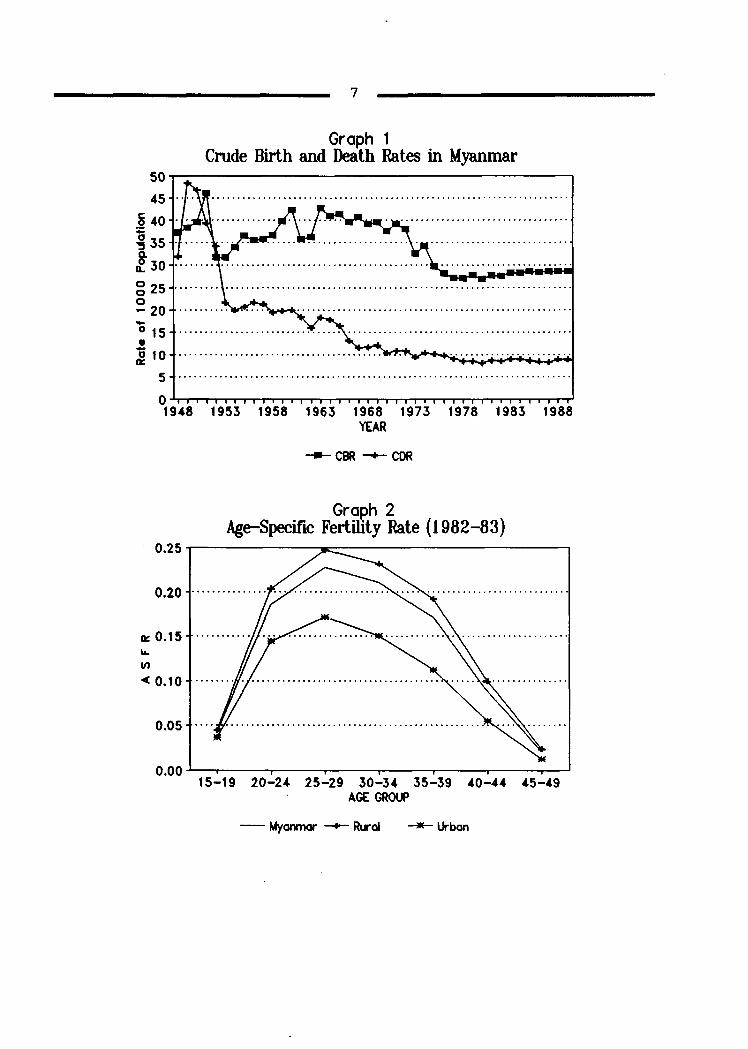
According to the vital statistics reports, the CBR was found to fall around 40between the early 1960s and early 1970s (Table 3 and Annex I for detail). Then, it declinedgradually to around 28 in 1976 and remained more or less constant from then on. The COR startedto decline by the early 1950s and has remaine1 almost constant at about 9 since 1977 (Graph 1).A drastic IMR decline was observed, from an extremely high level of 351 in 1949 to under 50 by1978. Similarly, the MMR declined from above 6 to around 1 per 1,000 live births. Although theinfant mortality seems to stabilize since late 1970s, it may be generally observed that both fertilityand mortality had declined in the recent past.
Migration
. A considerable variation in population growth rates of the states and divisions,(Table 2), indicates the existence of internal migration. The higher population growth rate in theurban areas, even though with a lower level of fertility, may be taken as an indication of themovements of people from the rural to urban areas. With a change in the Government's economicpolicy, the rural-to-urban migration (or urbanization) could become pronounced as more and morenew job opportunities are likely to be created in the urban areas. However, as yet, no study hasbeen made on the recent trends and levels of internal migration in Myanmar.
From Myanmar, international migration has not been significant, (UN, 1987: 90).In 1973 and 1983, according to the censuses, the number of Myanmar nationals abroad were only1,500 and 8,000 respectively. It could become significant, in future, with the country's movetowards the adoption of more market-oriented economic policies.
7
Graph 1Crude Birth and Death Rates in Myanmar
50..,.......-::---------------------,
45
~ 40;:.g 35130 .g 25 .o- 20~
o 15•0100::
5 .
O~"""T"""T-r-r-""T""'T'""r'T""r-.-..........,r-T"""r"""T"""T""T""T"..,........-r..-T'"T"""'lr-T'""l"""T"""T""T'"T"""T""'T'""r'T""r-.-r-r
1948 1953 1958 1963 1968 1973 1978 1983 1988YEAR
-CBR -+- COR
Graph 2Age-Specific Fertility Rate (1982-83)
0.25 T"""""-----__.;:::---------------,
0.20
....en~ 0.10
0.05
0.00 ..L---,----r---~--_,_--y__-__r--~--J15-19 20-24 25-29 30-34 35-39 40-44 45-49
AGE GROUP
- Myanmar --+- Rtral ------ Urban
CHAPTER IV
PREPARATION FOR THE PROJECTIONS
For making population projections, it is necessary to know the recent levels offertility, mortality and migration as well as their future trends. As mentioned above, the vitalregistration system cannot give reliable information on the levels of fertility and mortality for theUnion of Myanmar as a whole, and neither for the states and divisions separately. Thus, the leveland age pattern of fertility are estimated on the basis of the census information on the number ofchildren born during the last twelve months, and the level of mortality is estimated from the totalnumber of children ever born (CEB) and the number of children still living (CS). Since no directinformation concerning migration is available, the rate of internal migration (inter-state/division andrural-urban) during 1973-83 is indirectly estimated from the 1973 and 1983 census population.
Estimation of the Trends and levels of Fertility
For the population projections, the total fertility rates (TFRs) for the five-yearperiods are necessary throughout the projection period. Since the TFRs obtained from the censusinformation was only for the year 1982-83, it is necessary to estimate for the periods 1973-78,1978-83, 1983-88, and so on. In this study, the levels of fertility for the periods 1973-78 and1978-83 are estimated by reverse surviving while estimating migration 2/. As with the fertilityestimation, sex-ratios at birth were also estimated, and these ratios were assumed to be constantthroughout the projection period. The Crude Birth Rates (CBRs) and TFRs obtained from the censusand the estimated TFRs for the periods 1973-78 and 1978-83, and the sex-ratios at birth are givenin Table 4.
2/ In this study, migration was estimated as the one-half of the differences between; (1) the actual 1983 populationby region and the population projected on the basis of the 1973 census(forward surviving); and (2) the actual1973 population and their projected population on the basis of the 1983 census (reverse surviving). In thismethod, an iteration procedure is applied to estimate the migration flows which are consistent with the observedlevel and regional distribution of the 1973 and 1983 populations. The levels of fertility (TFR) and mortality (eo)during 1973-78 and 1978-83 together with the populations are also obtained while estimating migration. Theprocedure for estimating levels of fertility and mortality during 5 to 10 years prior to the census using the censuspopulation structures is known as the "reverse survival method".
9
Table 4Estimated Crude Birth Rates, Total Fertility Rates and Sex-Ratios at Birth: 1973-1983
CBR Total Fertility Rate Sex-RatioRegion (Census*) at birth
Census* 1973-78 1978-83 1973-83
Myanmar 34.4 4.8 5.4 4.2 1.055Rural 36.9 5.3 5.6 4.5 1.054Urban 26.9 3.5 4.6 3.2 1.060
StatesKachin 35.4 4.9 5.7 4.4 1.052Kayah 37.0 5.4 6.1 5.1 1.052Kayin 33.7 4.8 5.2 4.4 1.037Chin 37.7 5.3 5.5 4.6 1.047Mon 35.3 5.2 5.5 4.4 1.054Rakhine 37.8 5.3 5.4 4.5 1.083Shan 28.1 3.8 4.8 3.8 1.054
DivisionsSagaing 36.4 5.2 5.4 4.4 1.050Tanintharyi 32.9 4.8 5.8 4.7 1.050Bago 33.6 4.8 5.1 4.0 1.060Magway 38.1 5.5 5.3 4.5 1.054Mandalay 34.1 4.8 5.3 4.1 1.040Yangon 28.8 3.8 4.7 3.3 1.054Ayeyarwady 38.0 5.3 5.0 4.1 1.055
Source: (Nyan Myint, 1988: 39, 42).Note: * refers to 1982/83 level.
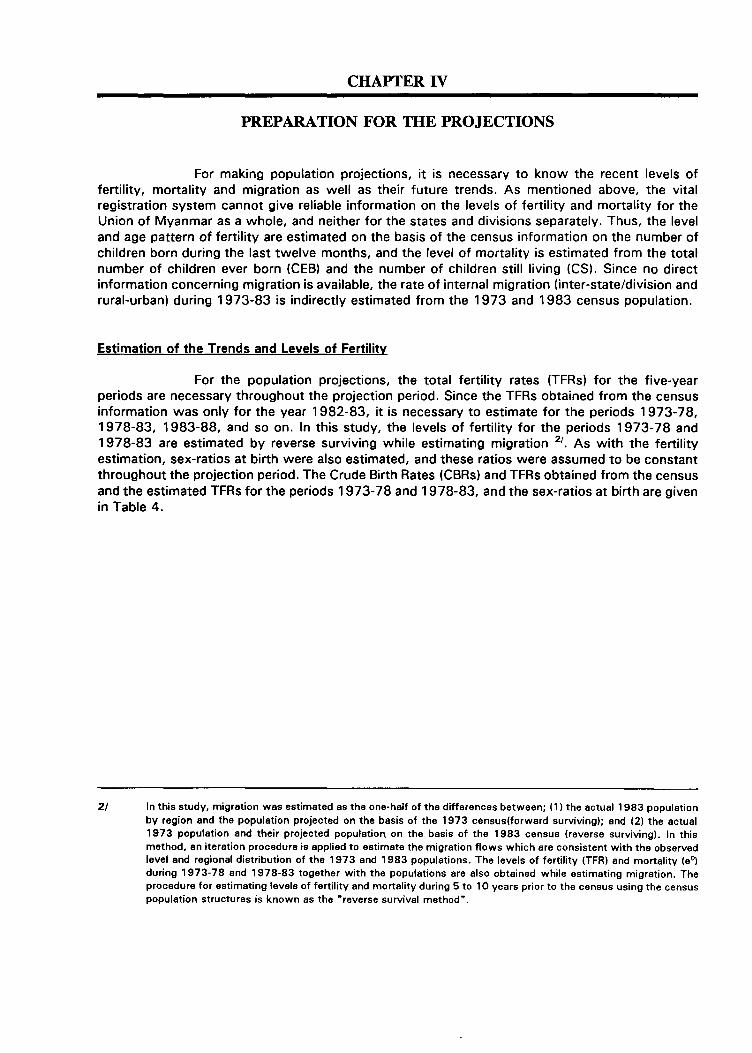
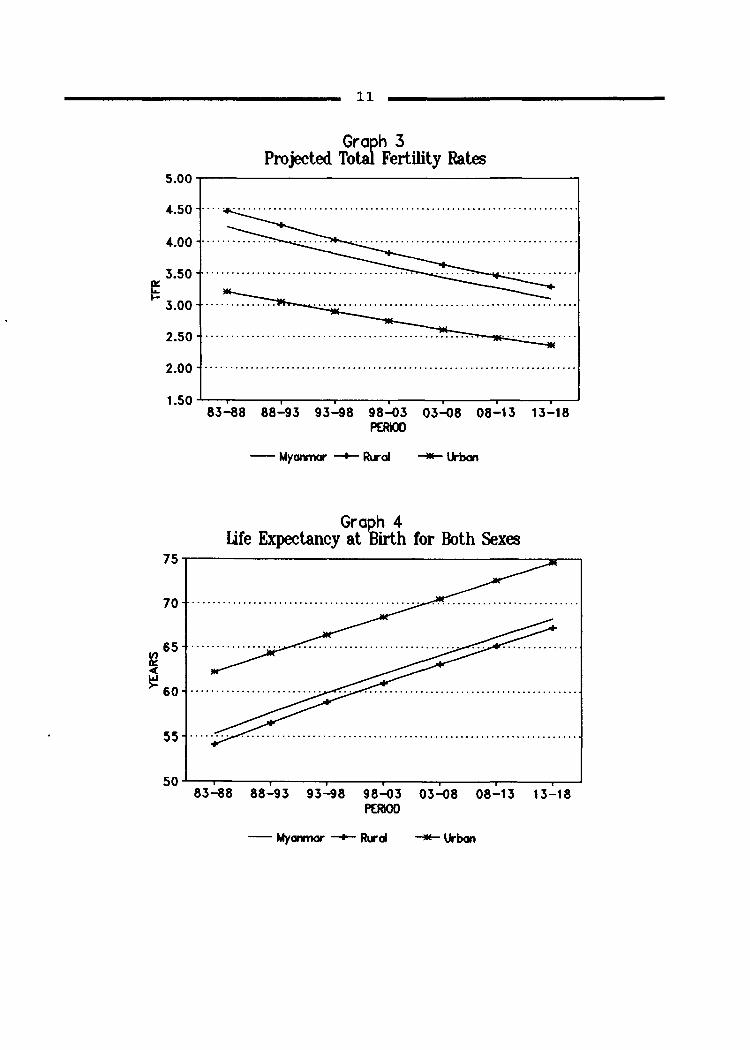
The TFRs for seven five-year periods, from 1983-88 to 2008-13, are derived byusing 5 per cent decline from the previous period's level for every five-year period starting from1983-88 3
/. Since no apparent fertility decline has been observed during 1983-88 (Annex 1), thelevel of fertility for 1983-88 is taken to be the same as 1978-83 level. The base year age-patternof fettility (age-specific fertility rates) is obtained from the 1983 census (Graph 2) and derived forthe future periods by using the base year age-pattern together with the "United Nations Model Age
3/ According to the United Nations working models of fertility decline for the developing countries (UN, 1977: 8).once the decline begins, fertility as measured by the TFR decreases by 5 per cent during the first five-year period,by 10 per cent in each of the next two five-year periods, by 15 per cent In each of the next three five-periods,and after that it declines more slowly until it reaches the replacement level(around 2.11. However, this WorkingModel suits only for those countries with family planning programmes. As official family planning programmesare yet to be established in Myanmar, the flat rate of decline of 5 per cent is assumed in this study. Thisassumption could, however, be inappropriate starting from five or more years after the commencement of familyplanning programmes.
10
Pattern of Fertility in Asia (excluding Japan)" (UN, 1977: 11). The resulting TFRs for 1983-88and 2013-18 are presented in Table 5. The projected TFRs for every 5-year periods are given inAnnex 2 and the age-specific fertility rates, derived from 1983 census, are shown in Annex 3 andGraph 3.
Table 5Projected Total Fertility Rates: (1983-88 and 2013-18)
Region 1983-88 2013-18
Myanmar 4.2 3.1Rural 4.5 3.3Urban 3.2 2.4
StatesKachin 4.4 3.2Kayah 5.1 3.8Kayin 4.4 3.2Chin 4.6 3.4Mon 4.4 3.2Rakhine 4.5 3.3Shan 3.8 2.8
DivisionsSagaing 4.4 3.2Tanintharyi 4.7 3.48ago 4.0 3.0Magway 4.5 3.3Mandalay 4.1 3.0Yangon 3.3 2.5Ayeyarwady 4.1 3.0
Estimation of Recent Trends and Levels of Mortality
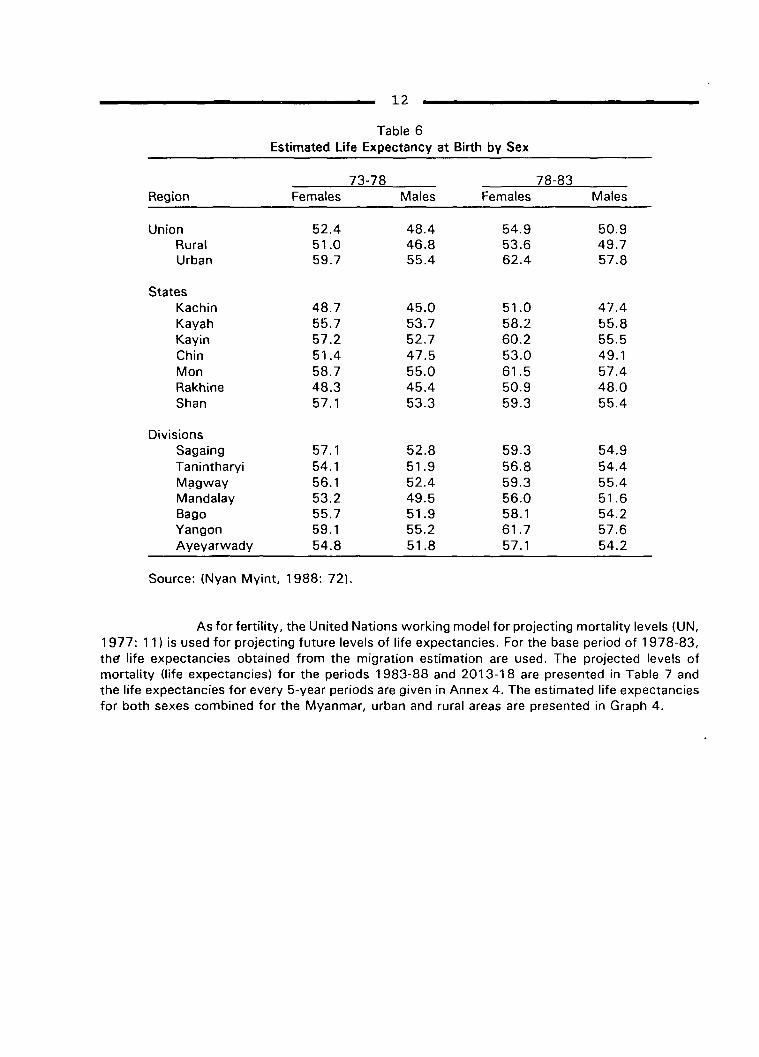
As in the case of fertility, the level of mortality was also estimated on the basis ofcensus reports. Indirect estimates of infant mortality rate (IMR) and child mortality rate werederived from the 1983 census data on the number of children ever born and children surviving.Then the mortality levels of the "West Regional Model Life Tables" were estimated from the infantand child mortality (Coale and Demeny, 1966). The expectation of life at birth (eO) for males andfemales for the periods 1973-78 and 1983-88 were then again derived while estimating migration.The estimated life expectancies by sex and by region are presented in Table 6.
11
Graph 3Projected Total Fertility Rates
5.00...----------------------,
4.50
4.00
3.50e:I-
3.00 ....................................................
2.50 . .
2.00 .
1.50 .L---r---~-~---r---...-------r----r-----J83-88 88-93 93-98 98-03 03-08 08-13 13-18
PERIOD
- Myanmar -+- Rl.ral --- lXbon
Graph 4life Expectancy at Birth for Both Sexes
75~-----------------__--,
70 .
55
50 .L.---,----r----~---,.----r----r---~--J83-88 88-93 93-98 98-03 03-08 08-13 13-18
PERIOD
- Myanmar -+- Rural -lIE- lXbon
12
Table 6Estimated life Expectancy at Birth by Sex
73-78 78-83Region Females Males Females Males
Union 52.4 48.4 54.9 50.9Rural 51.0 46.8 53.6 49.7Urban 59.7 55.4 62.4 57.8
StatesKachin 48.7 45.0 51.0 47.4Kayah 55.7 53.7 58.2 55.8Kayin 57.2 52.7 60.2 55.5Chin 51.4 47.5 53.0 49.1Mon 58.7 55.0 61.5 57.4Rakhine 48.3 45.4 50.9 48.0Shan 57.1 53.3 59.3 55.4
DivisionsSagaing 57.1 52.8 59.3 54.9Tanintharyi 54.1 51.9 56.8 54.4Milgway 56.1 52.4 59.3 55.4Mandalay 53.2 49.5 56.0 51.6Bago 55.7 51.9 58.1 54.2Yangon 59.1 55.2 61.7 57.6Ayeyarwady 54.8 51.8 57.1 54.2
Source: (Nyan Myint, 1988: 72).
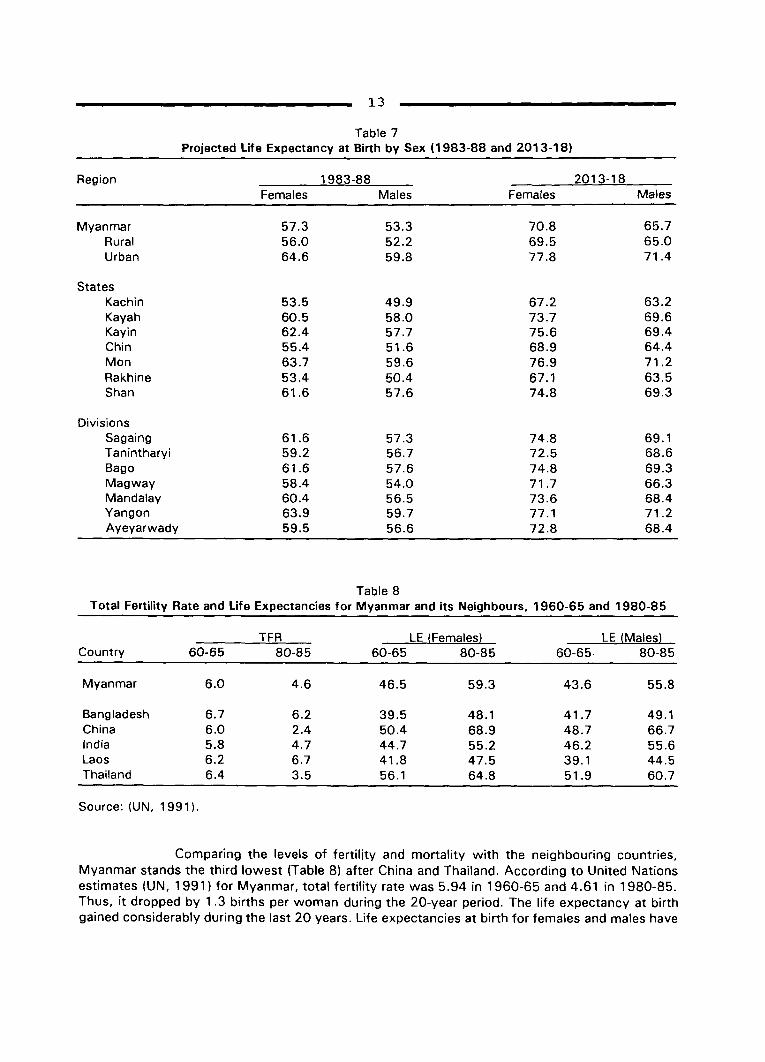
As for fertility, the United Nations working model for projecting mortality levels (UN,1977: 11) is used for projecting future levels of life expectancies. For the base period of 1978-83,the' life expectancies obtained from the migration estimation are used. The projected levels ofmortality (life expectancies) for the periods 1983-88 and 2013-18 are presented in Table 7 andthe life expectancies for every 5-year periods are given in Annex 4. The estimated life expectanciesfor both sexes combined for the Myanmar, urban and rural areas are presented in Graph 4.
13
Table 7Projected life Expectancy at Birth by Sex (1983-88 and 2013-18)
Region 1983-88 2013-18Females Males Females Males
Myanmar 57.3 53.3 70.8 65.7Rural 56.0 52.2 69.5 65.0Urban 64.6 59.8 77.8 71.4
StatesKachin 53.5 49.9 67.2 63.2Kayah 60.5 58.0 73.7 69.6Kayin 62.4 57.7 75.6 69.4Chin 55.4 51.6 68.9 64.4Mon 63.7 59.6 76.9 71.2Rakhine 53.4 50.4 67.1 63.5Shan 61.6 57.6 74.8 69.3
DivisionsSagaing 61.6 57.3 74.8 69.1Tanintharyi 59.2 56.7 72.5 68.6Bago 61.6 57.6 74.8 69.3Magway 58.4 54.0 71.7 66.3Mandalay 60.4 56.5 73.6 68.4Yangon 63.9 59.7 77.1 71.2Ayeyarwady 59.5 56.6 72.8 68.4
Table 8Total Fertility Rate and life Expectancies for Myanmar and its Neighbours. 1960-65 and 1980-85
TFR LE (Females) LE (Males)Country 60-65 80-85 60-65 80-85 60-65· 80-85
Myanmar 6.0 4.6 46.5 59.3 43.6 55.8
Bangladesh 6.7 6.2 39.5 48.1 41.7 49.1China 6.0 2.4 50.4 68.9 48.7 66.7India 5.8 4.7 44.7 55.2 46.2 55.6Laos 6.2 6.7 41.8 47.5 39.1 44.5Thailand 6.4 3.5 56.1 64.8 51.9 60.7
Source: (UN, 1991).
Comparing the levels of fertility and mortality with the neighbouring countries,Myanmar stands the third lowest (Table 8) after China and Thailand. According to United Nationsestimates (UN, 1991) for Myanmar, total fertility rate was 5.94 in 1960-65 and 4.61 in 1980-85.Thus. it dropped by 1.3 births per woman during the 20-year period. The life expectancy at birthgained considerably during the last 20 years. Life expectancies at birth for females and males have
14
increased from 46.5 years to 59.3 years and from 43.6 years to 55.8 years respectively. Theincreases in life expectancies for both males and females are faster than the global average ofhalf-a-year for a calendar year. When these UN estimates are compared with the estimatesobtained in this study, UN estimates of total fertility rate and life expectancies are somewhathigher. The diffidences are marginal and they could mainly be due to the consideration of migrationin this study and partly due to the use of a different method and different source of data.
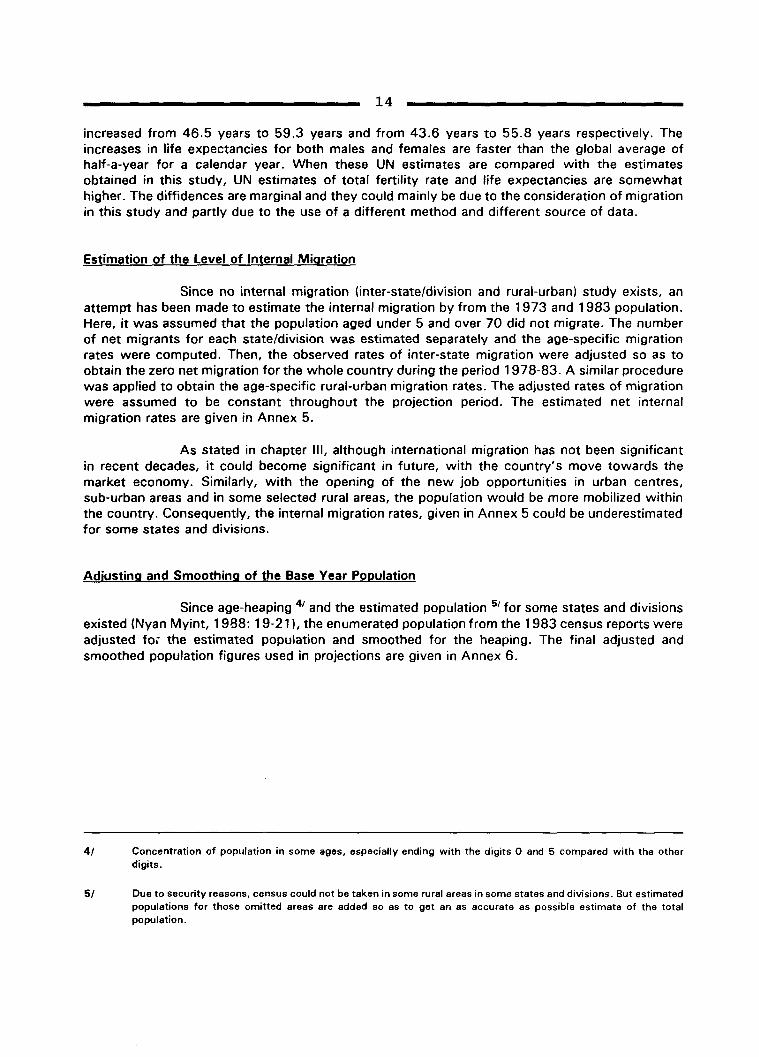
Estimation of the level of Internal Migration
Since no internal migration (inter-state/division and rural-urban) study exists, anattempt has been made to estimate the internal migration by from the 1973 and 1983 population.Here, it was assumed that the population aged under 5 and over 70 did not migrate. The numberof net migrants for each state/division was estimated separately and the age-specific migrationrates were computed. Then, the observed rates of inter-state migration were adjusted so as toobtain the zero net migration for the whole country during the period 1978-83. A similar procedurewas applied to obtain the age-specific rural-urban migration rates. The adjusted rates of migrationwere assumed to be constant throughout the projection period. The estimated net internalmigration rates are given in Annex 5.
As stated in chapter Ill, although international migration has not been significantin recent decades, it could become significant in future, with the country's move towards themarket economy. Similarly, with the opening of the new job opportunities in urban centres,sub-urban areas and in some selected rural areas, the population would be more mobilized withinthe country. ConseQuently, the internal migration rates, given in Annex 5 could be underestimatedfor some states and divisions.
Adjusting and Smoothing of the Base Year Population
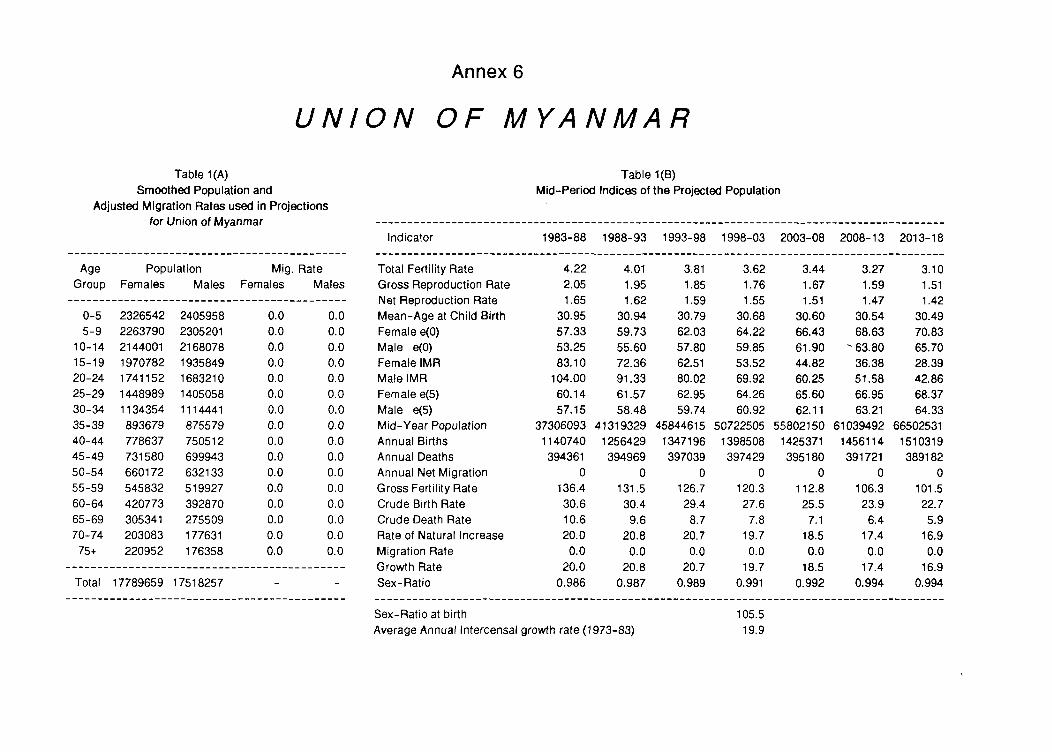
Since age-heaping 41 and the estimated population 51 for some states and divisionsexisted (Nyan Myint, 1988: 19-21), the enumerated population from the 1983 census reports wereadjusted for the estimated population and smoothed for the heaping. The final adjusted andsmoothed population figures used in projections are given in Annex 6.
41 Concentration of population in some ages, especially ending with the digits 0 and 5 compared with the otherdigits.
51 Due to security reasons, census could not be taken in some rural areas in some states and divisions. But estimatedpopulations for those omitted areas are added so as to get an as accurate as possible estimate of the totalpopulation.
CHAPTER V
METHOD AND OUTPUT OF THE PROJECTIONS
The Method
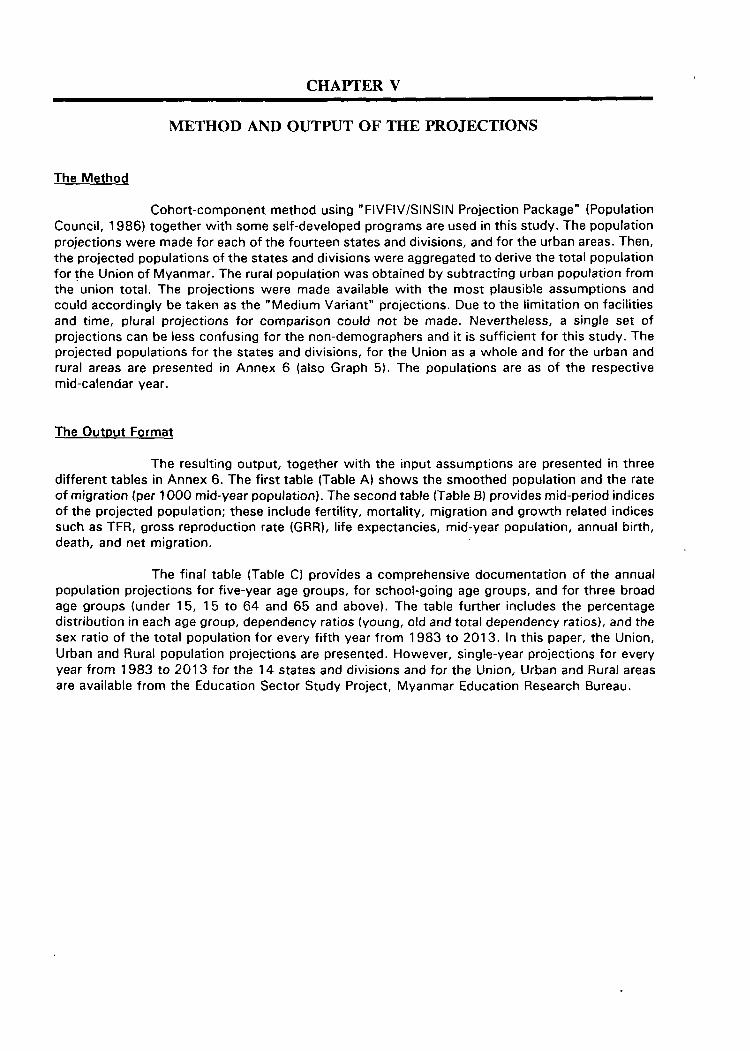
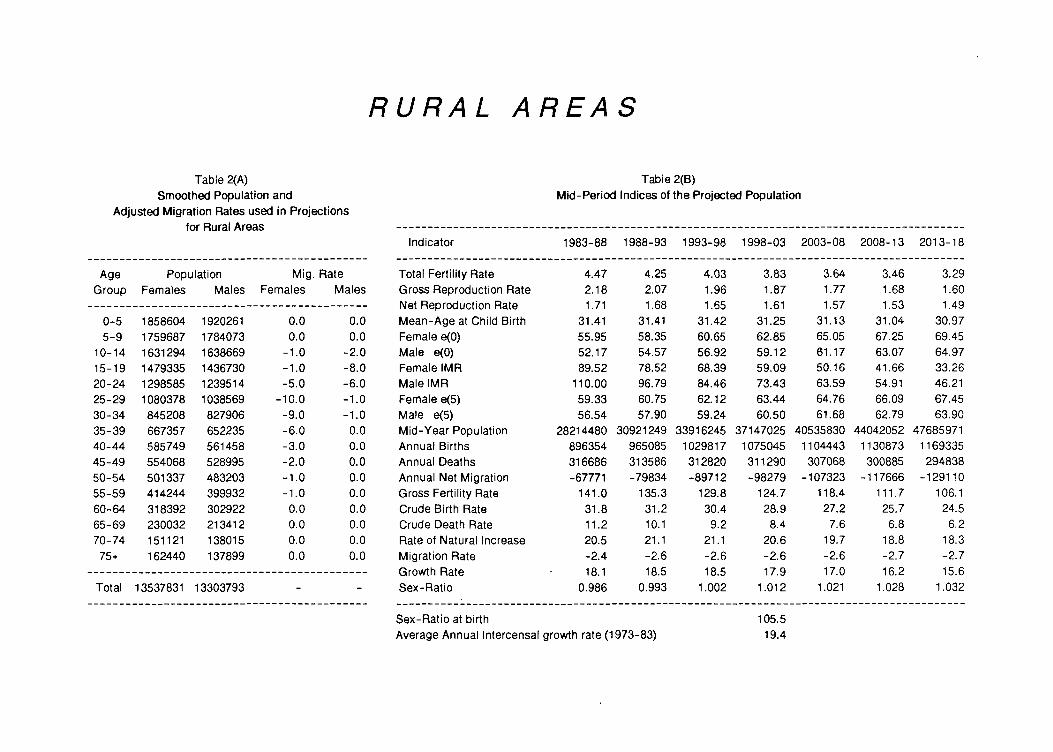
Cohort-component method using" FIVFIV/SINSIN Projection Package" (PopulationCouncil, 1986) together with some self-developed programs are used in this study. The populationprojections were made for each of the fourteen states and divisions, and for the urban areas. Then,the projected populations of the states and divisions were aggregated to derive the total populationfor the Union of Myanmar. The rural population was obtained by subtracting urban population fromthe union total. The projections were made available with the most plausible assumptions andcould accordingly be taken as the "Medium Variant" projections. Due to the limitation on facilitiesand time, plural projections for comparison could not be made. Nevertheless, a single set ofprojections can be less confusing for the non-demographers and it is sufficient for this study. Theprojected populations for the states and divisions, for the Union as a whole and for the urban andrural areas are presented in Annex 6 (also Graph 5). The populations are as of the respectivemid-calendar year.
The Output Format
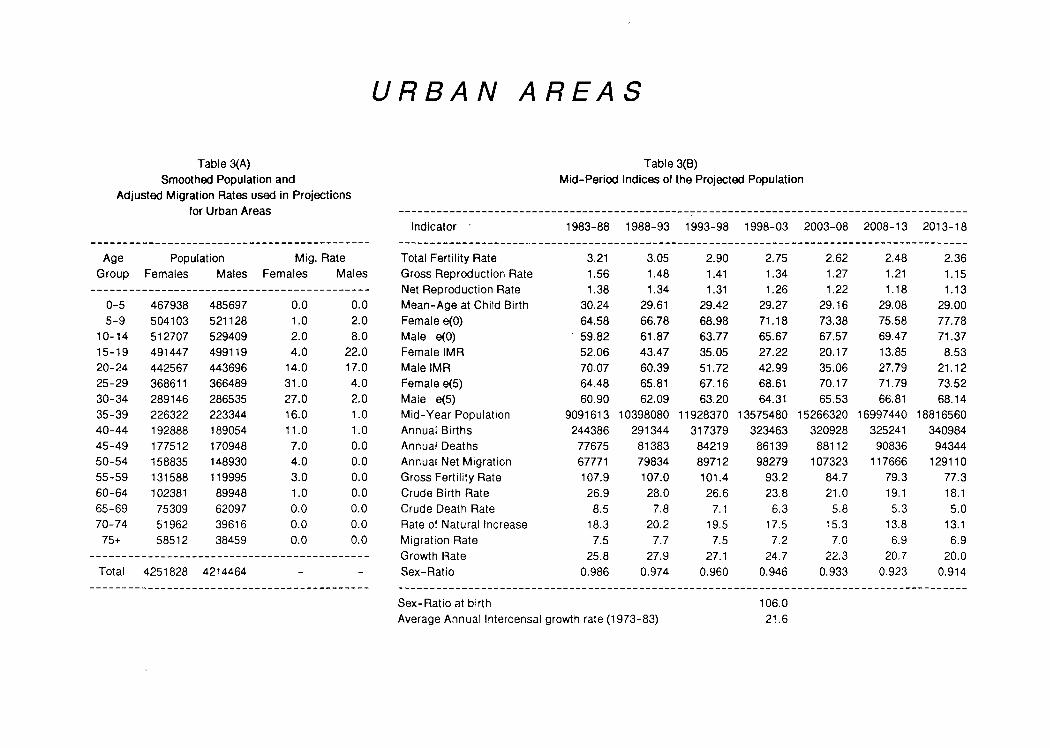
The resulting output, together with the input assumptions are presented in threedifferent tables in Annex 6. The first table (Table A) shows the smoothed population and the rateof migration (per 1000 mid-year population). The second table (Table B) provides mid-period indicesof the projected population; these include fertility, mortality, migration and growth related indicessuch as TFR, gross reproduction rate (GRR), life expectancies, mid-year population, annual birth,death, and net migration.
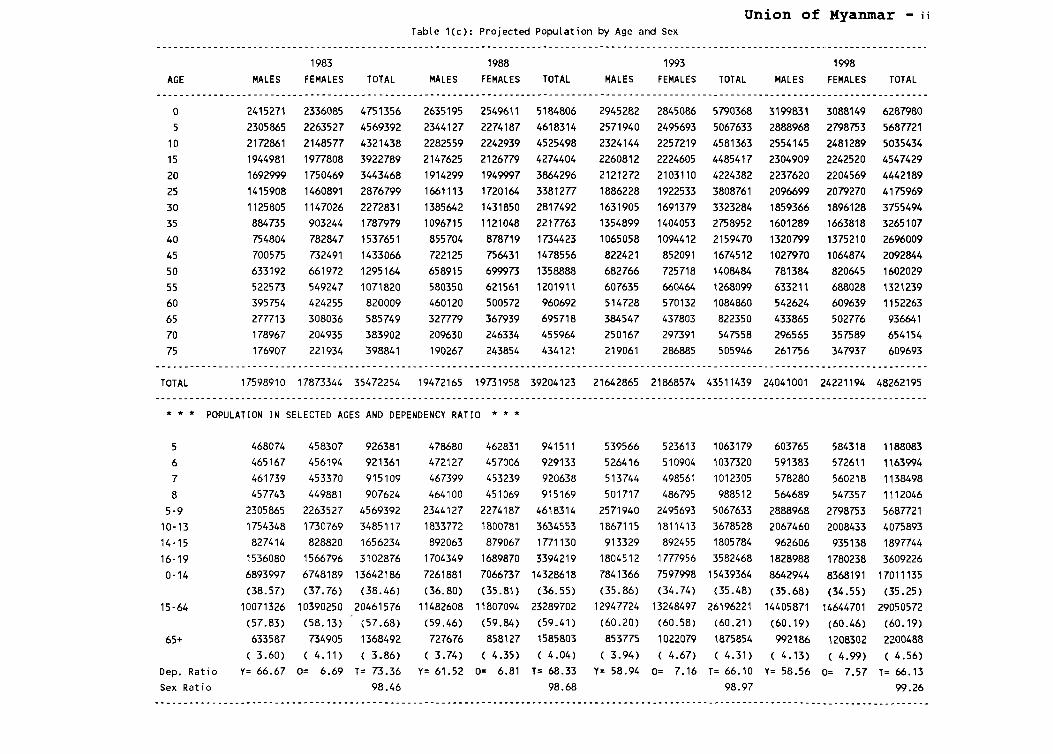
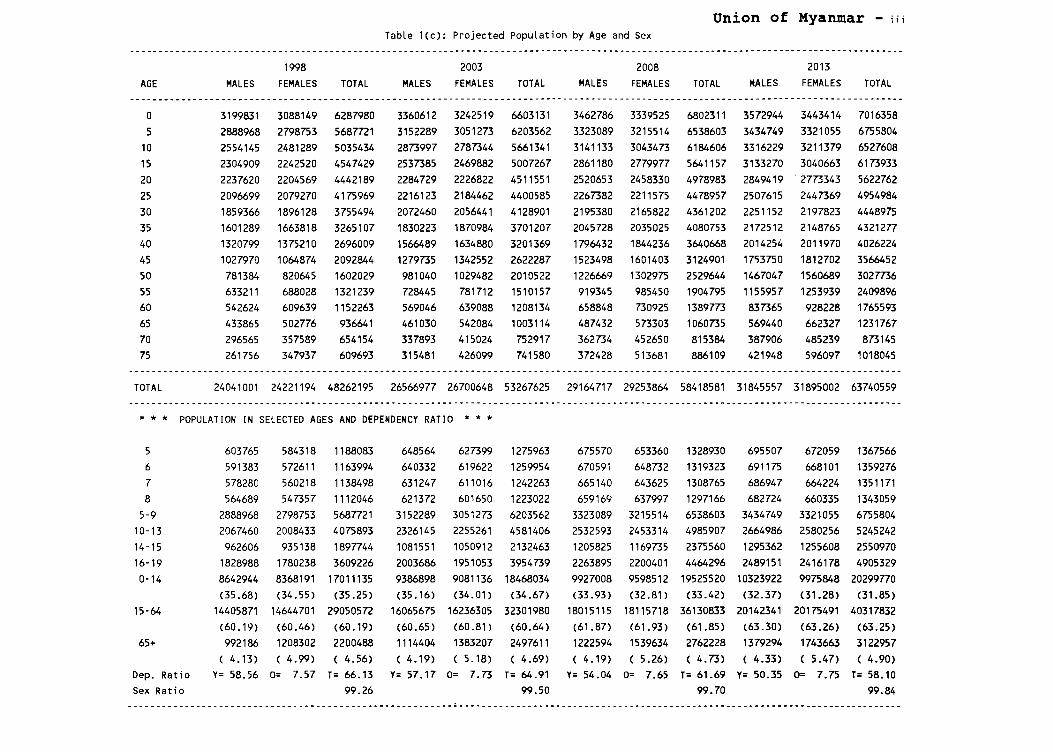
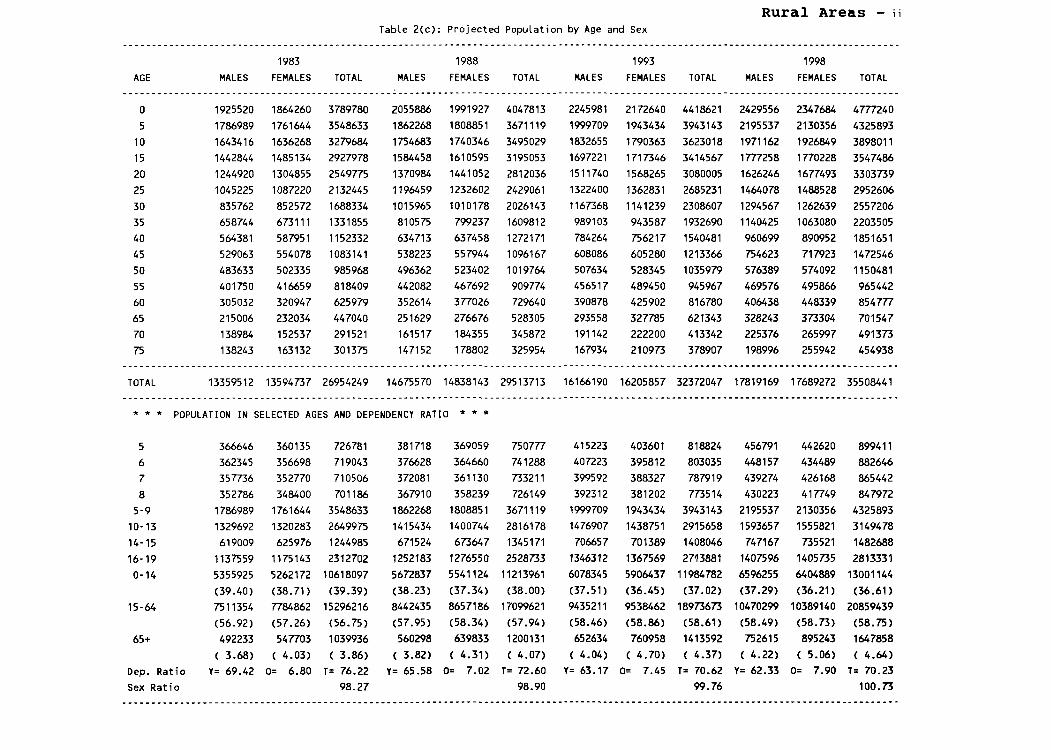
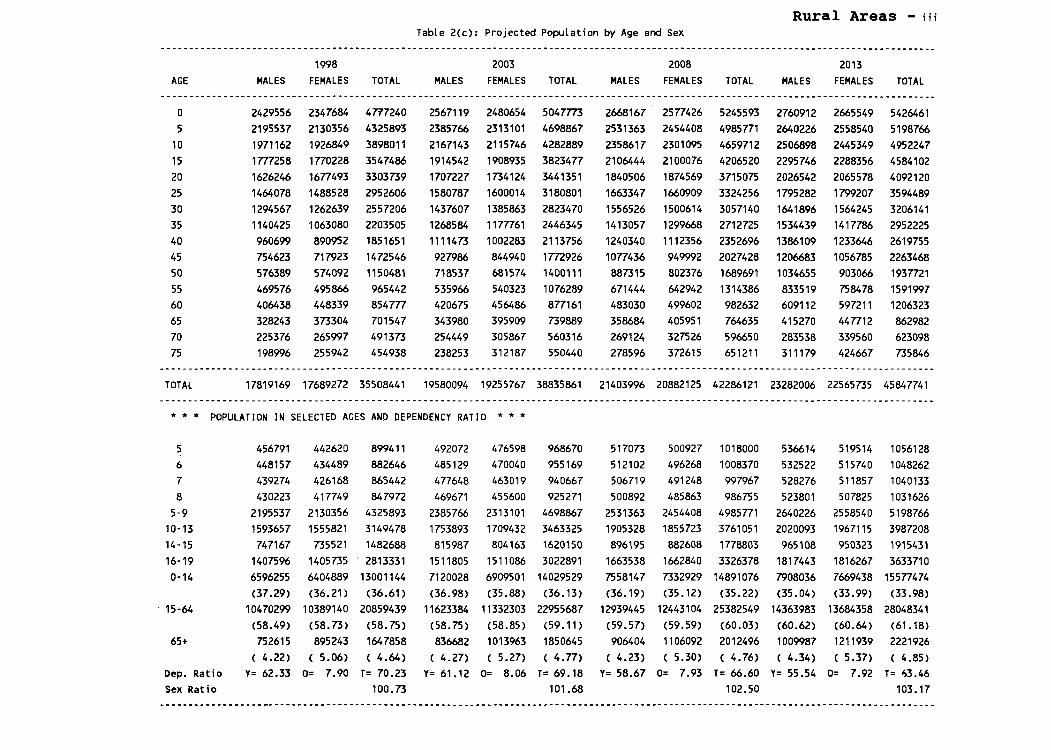
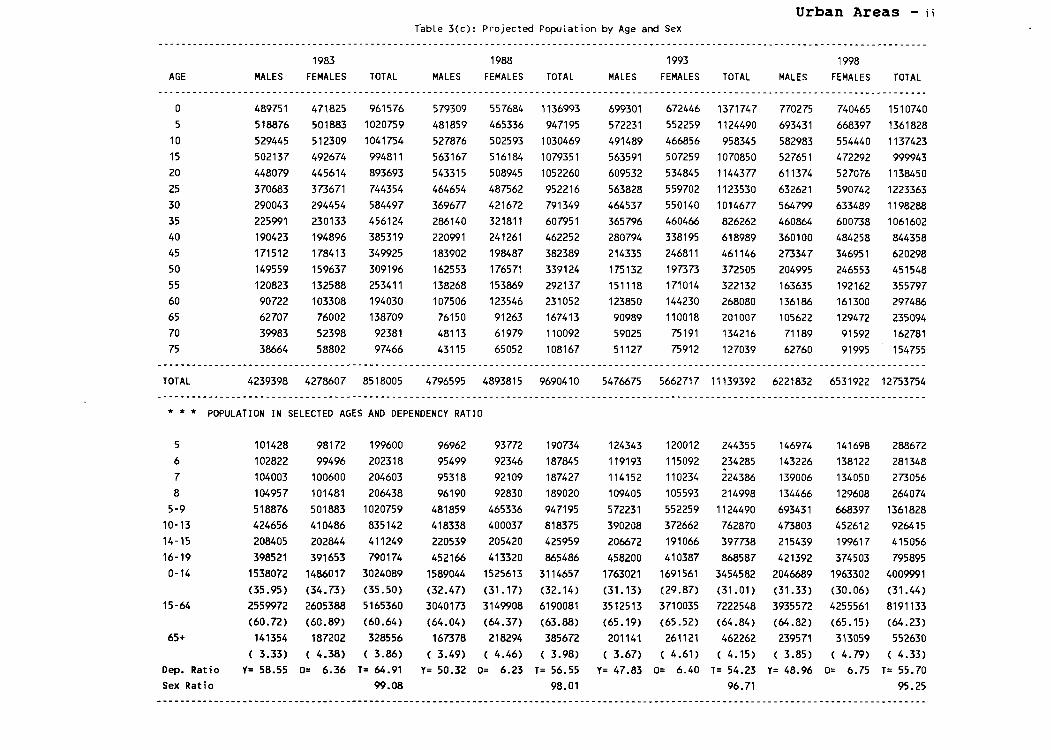
The final table (Table C) provides a comprehensive documentation of the annualpopulation projections for five-year age groups, for school-going age groups, and for three broadage groups (under 15, 15 to 64 and 65 and above). The table further includes the percentagedistribution in each age group, dependency ratios (young, old and total dependency ratios), and thesex ratio of the total population for every fifth year from 1983 to 2013. In this paper, the Union,Urban and Rural population projections are presented. However, single-year projections for everyyear from 1983 to 2013 for the 14 states and divisions and for the Union, Urban and Rural areasare available from the Education Sector Study Project, Myanmar Education Research Bureau.
16
Graph 5Projected Population of Myanmar
70.---------------------.
60 ""1'''''' ·R ..
P11-1t1t1UUl--IVlI-1t1n U50 'lA(;I~H1Jo1 ·R·· ..
lA lA '0111 rm ALHA1AVlI'lrl L
.. ············~···~··~~tlflrqrtf1f.j~~t1l1rlrJf1f.1~t1t~~~~f.jt1t1~
2°El_IB··.... ·~ ..·10 .E!. ...
AN
o1983 1989 1995 2001
YEAR2007 2013
CHAPTER VI
CONCLUSION
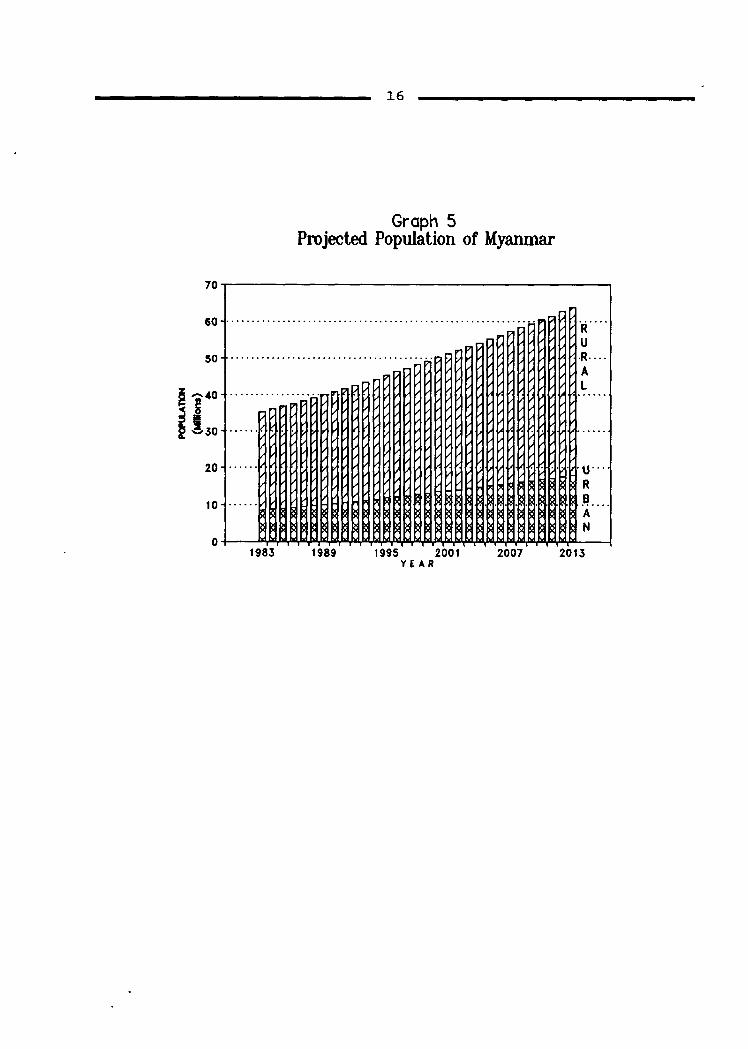
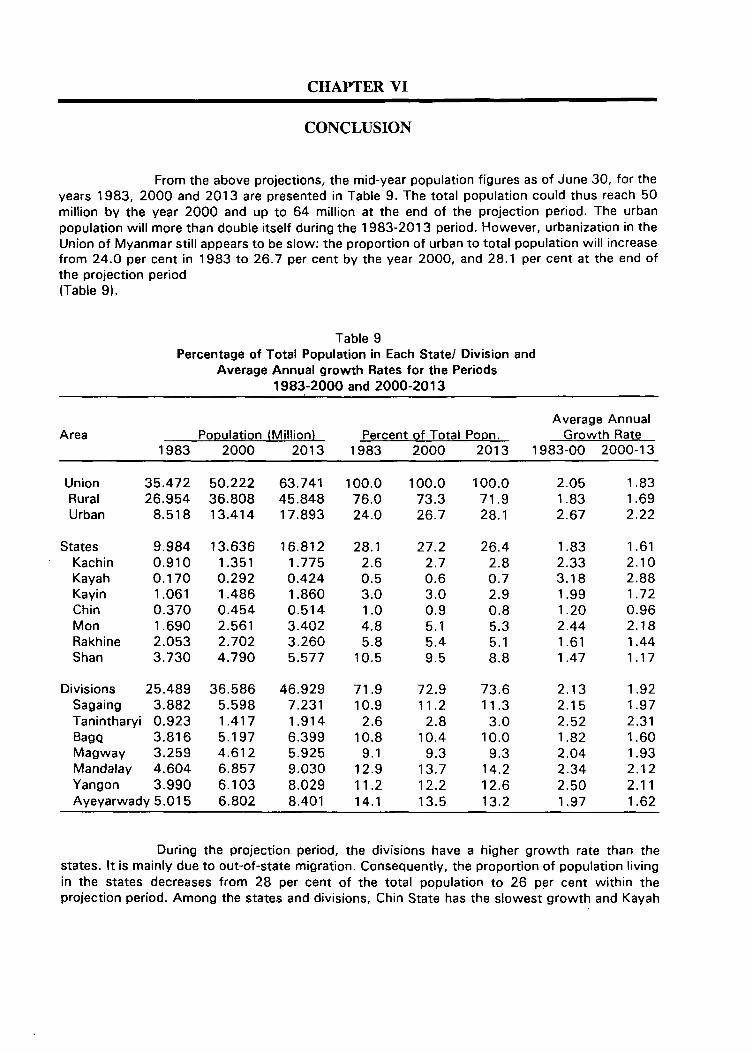
From the above projections, the mid-year population figures as of June 30, for theyears 1983, 2000 and 2013 are presented in Table 9. The total population could thus reach 50million by the year 2000 and up to 64 million at the end of the projection period. The urbanpopulation will more than double itself during the 1983-2013 period. However, urbanization in theUnion of Myanmar still appears to be slow: the proportion of urban to total population will increasefrom 24.0 per cent in 1983 to 26.7 per cent by the year 2000, and 28.1 per cent at the end ofthe projection period(Table 9).
Table 9Percentage of Total Population in Each StateI Division and
Average Annual growth Rates for the Periods1983-2000 and 2000-2013
Average AnnualArea Population (Million) Percent of Total Popn. Growth Rate
1983 2000 2013 1983 2000 2013 1983-00 2000-13
Union 35.472 50.222 63.741 100.0 100.0 100.0 2.05 1.83Rural 26.954 36.808 45.848 76.0 73.3 71.9 1.83 1.69Urban 8.518 13.414 17.893 24.0 26.7 28.1 2.67 2.22
States 9.984 13.636 16.812 28.1 27.2 26.4 1.83 1.61Kachin 0.910 1.351 1.775 2.6 2.7 2.8 2.33 2.10Kayah 0.170 0.292 0.424 0.5 0.6 0.7 3.18 2.88Kayin 1.061 1.486 1.860 3.0 3.0 2.9 1.99 1.72Chin 0.370 0.454 0.514 1.0 0.9 0.8 1.20 0.96Mon 1.690 2.561 3.402 4.8 5.1 5.3 2.44 2.18Rakhine 2.053 2.702 3.260 5.8 5.4 5.1 1.61 1.44Shan 3.730 4.790 5.577 10.5 9.5 8.8 1.47 1.17
Divisions 25.489 36.586 46.929 71.9 72.9 73.6 2.13 1.92Sagaing 3.882 5.598 7.231 10.9 11.2 11.3 2.15 1.97Tanintharyi 0.923 1.417 1.914 2.6 2.8 3.0 2.52 2.31BagQ 3.816 5.197 6.399 10.8 10.4 10.0 1.82 1.60Magway 3.259 4.612 5.925 9.1 9.3 9.3 2.04 1.93Mandalay 4.604 6.857 9.030 12.9 13.7 14.2 2.34 2.12Yangon 3.990 6.103 8.029 11.2 12.2 12.6 2.50 2.11Ayeyarwady 5.01 5 6.802 8.401 14.1 13.5 13.2 1.97 1.62
During the projection period, the divisions have a higher growth rate than thestates. It is mainly due to out-of-state migration. Consequently, the proportion of population livingin the states decreases from 28 per cent of the total population to 26 p~r cent within theprojection period. Among the states and divisions, Chin State has the slowest growth and Kayah
18
State has the fastest. For the whole country, the annual growth rate will be 2.05 per cent duringthe 1983-2000 period and slowing down to 1.83 thereafter, with the urban population growingsomewhat faster than the rural. The growth and proportion of population in each state/division willslightly change throughout the projection period mainly due to internal migration and partly due tothe different levels of fertility and mortality.
Table 10Dependency Ratios and Sex Ratios for the Years 1983, 2000 and 2013
State/Division Dependency Ratio Sex Ratio1983 2000 2013 1983 2000 2013
Union 73.4 65.9 58.1 98.5 99.4 99.8Rural 76.2 70.1 63.5 98.3 101.1 103.2Urban 64.9 55.6 45.8 99.1 94.7 91.8
StatesKachin 73.8 64.9 57.2 99.0 102.4 104.2Kayah 81.6 71.8 64.0 104.2 105.9 106.7Kayin 79.8 69.2 62.2 96.9 98.2 99.0Chin 79.3 72.2 65.7 94.2 89.2 87.1Mon 77.7 68.0 59.7 100.6 103.7 105.3 .Rakhine 77.4 72.0 63.8 98.0 95.3 94.0Shan 71.6 63.8 56.8 100.1 96.3 94.2
DivisionsSagaing 77.0 70.1 63.1 95.3 95.2 94.9Tanintharyi 78.1 68.6 60.8 101.1 103.3 104.4Sago 73.1 66.8 58.1 98.7 99.3 99.6Magway 75.9 69.1 62.7 96.1 97.6 98.4Mandalay 73.0 64.9 57.2 97.2 100.2 101.4Yangon 64.9 55.7 47.6 101.4 106.0 108.1Ayeyarwady 72.0 67.5 58.5 99.4 99.1 99.0
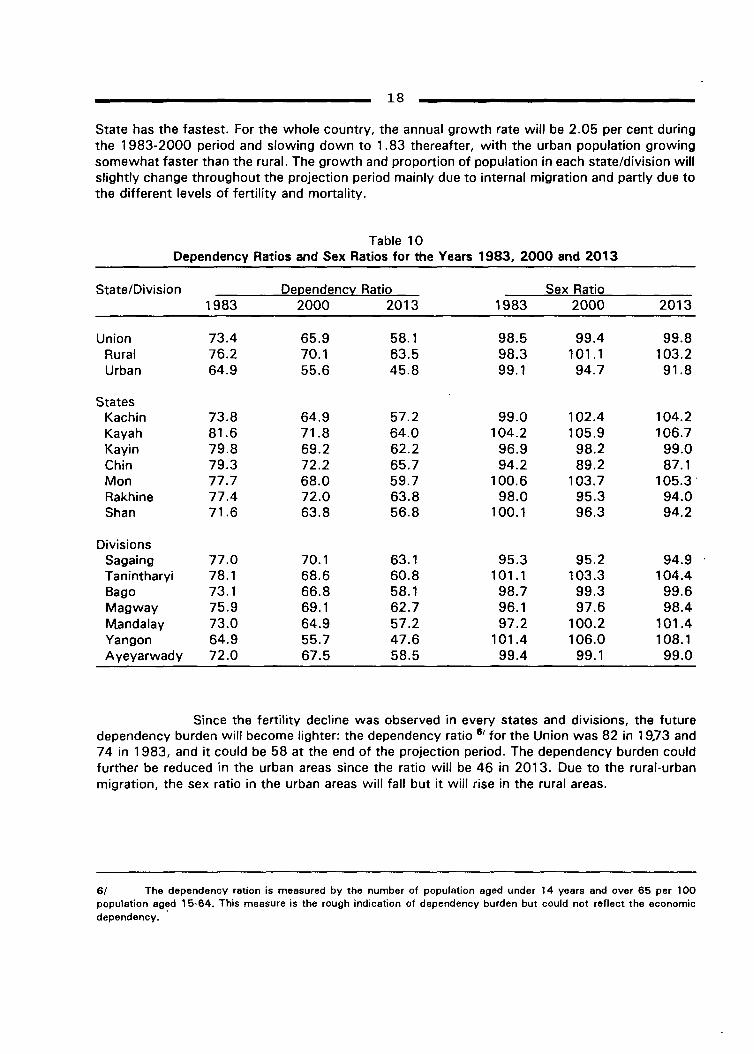
Since the fertility decline was observed in every states and divisions, the futuredependency burden will become lighter: the dependency ratio 6/ for the Union was 82 in 19,73 and74 in 1983, and it could be 58 at the end of the projection period. The dependency burden couldfurther be reduced in the urban areas since the ratio will be 46 in 2013. Due to the rural-urbanmigration, the sex ratio in the urban areas will fall but it will rise in the rural areas.
6/ The dependency ration is measured by the number of population aged under 14 years and over 65 per 100population aged 15-64. This measure is the rough indication of dependency burden but could not reflect the economicdependency..
19
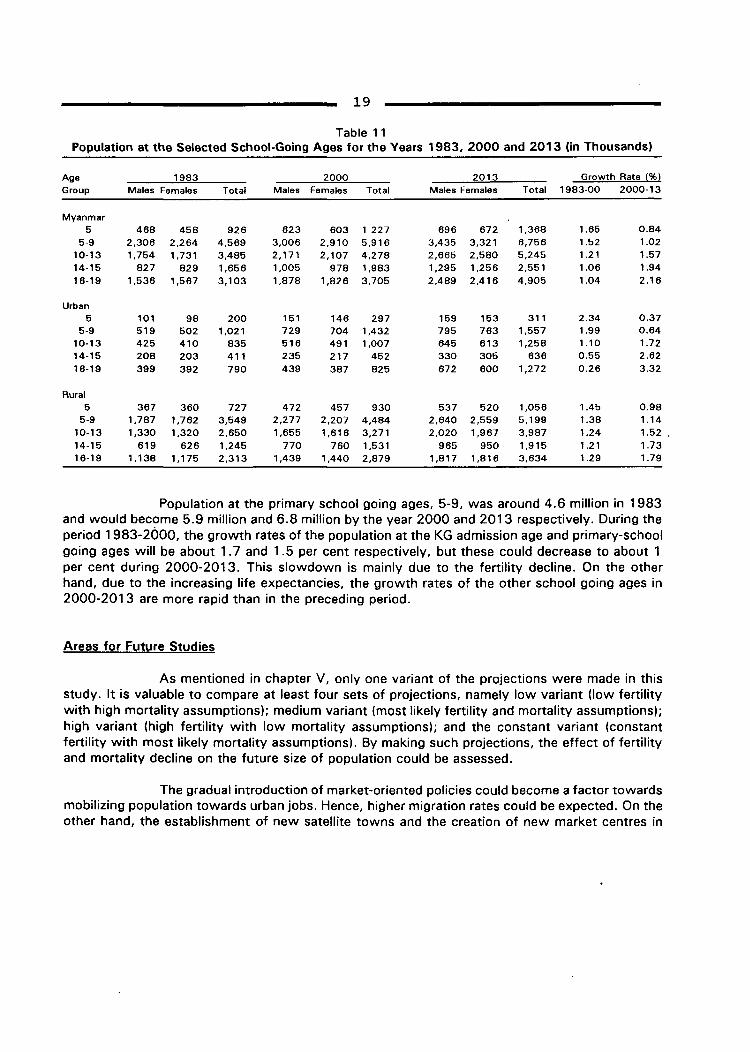
Table 11Population at the Selected School-Going Ages for the Years 1983, 2000 and 2013 (in Thousands)
Age 1983 2000 2013 Growth Rate (%)
Group Males Females Total Males Females Total Males Females Total 1983-00 2000-13
Myanmar5 468 458 926 623 603 1 227 696 672 1,368 1.65 0.84
5-9 2,306 2,264 4,569 3,006 2,910 5,916 3,435 3,321 6,756 1.52 1.0210-13 1,754 1,731 3,485 2,171 2,107 4,278 2,665 2,580 5,245 1.21 1.5714-15 827 829 1,656 1,005 978 1,983 1,295 1,256 2,551 1.06 1.9416-19 1,536 1,567 3,103 1,878 1,826 3,705 2,489 2,416 4,905 1.04 2.16
Urban5 101 98 200 151 146 297 159 153 311 2.34 0.37
5-9 519 502 1,021 729 704 1,432 795 763 1,557 1.99 0.6410-13 425 410 835 516 491 1,007 645 613 1,258 1.10 1.7214-15 208 203 411 235 217 452 330 305 636 0.55 2.6216-19 399 392 790 439 387 825 672 600 1,272 0.26 3.32
Rural5 367 360 727 472 457 930 537 520 1,056 1.45 0.98
5-9 1,787 1,762 3,549 2,277 2,207 4,484 2,640 2,559 5,199 1.38 1.1410-13 1,330 1,320 2,650 1,655 1,616 3,271 2,020 1,967 3,987 1.24 1.52 .14-15 619 626 1,245 770 760 1,531 965 950 1,915 1.21 1.7316-19 1,138 1,175 2,313 1,439 1,440 2,879 1,817 1,816 3,634 1.29 1.79
Population at the primary school going ages, 5-9, was around 4.6 million in 1983and would become 5.9 million and 6.8 million by the year 2000 and 2013 respectively. During theperiod 1983-2000, the growth rates of the population at the KG admission age and primary-schoolgoing ages will be about 1.7 and 1.5 per cent respectively, but these could decrease to about 1per cent during 2000-2013. This slowdown is mainly due to the fertility decline. On the otherhand, due to the increasing life expectancies, the growth rates of the other school going ages in2000-2013 are more rapid than in the preceding period.
Areas for Future Studies
As mentioned in chapter V, only one variant of the projections were made in thisstudy. It is valuable to compare at least four sets of projections, namely low variant (Iow fertilitywith high mortality assumptions); medium variant (most likely fertility and mortality assumptions);high variant (high fertility with low mortality assumptions); and the constant variant (constantfertility with most likely mortality assumptions). By making such projections, the effect of fertilityand mortality decline on the future size of population could be assessed.
The gradual introduction of market-oriented policies could become a factor towardsmobilizing population towards urban jobs. Hence, higher migration rates could be expected. On theother hand, the establishment of new satellite towns and the creation of new market centres in

20
the suburban areas of the cities could create both urban to semi-urban and rural to urban migration.Therefore, if possible, population projections should be made not only with moderate migrationassumptions (as in this study), but also with the high migration assumptions and no migrationassumptions. Without projections making under the high migration assumptions, it is impossibleto render the plausible changes in the regional distribution. Similarly, there is no way to study theeffect of migration unless a set of projections were made using no migration assumption.
BIBLIOGRAPHY
Central Statistical Organization (CSO). Vital Statistics Report 1983. Central StatisticalOrganization and The Department of Health, Yangon, 1989.
Hpu, Hla Myint. Mortality Statistics of Burma. Unpublished MA Thesis, The Australian NationalUniversity, Canberra, 1984.
Immigration and Manpower Department (IMD). Burma: 1973 Population Census (Union Volume).IMD, Yangon, 1976.
Immigration and Manpower Department (IMD). Burma: 1983 Population Census (Union Volume).IMD, Yangon, 1986.
Immigration and Manpower Department (IMD). Population Projections: Burma 1983-2003. SeminarPaper, IMD, Yangon, 1987.
Khin Maung Kywe, Thein Wan, Myat Naing, Khin Than Myint, Win Tint and Nyan Myint.Population and Labour Force Participation in the Union of Myanmar (Study I). Astudy undertaken for UNFPA 1Department of Labour Project: MYAI 88/P06, MERB,Yangon, 1989.
Kyin, U. A Study of the Population of the Union of Burma. Demographic Training and ResearchCentre, Bombay, 1959.
Ministry of Planning and Finance (MPF). Report on the Financial, Economic and Social Conditionsfor 1990/91. Ministry of Planning and Finance, Yangon, 1990.
Nyan Myint. Levels and Trends of Fertility and Mortality in Burma. Unpublished MA Thesis, TheAustralian National University, Canberra, 1988.
Nyan Myint. Recent Levels and Trends of Fertility and Mortality in the Union of Myanmar. SeminarPaper; "Seminar on Population and Development" held in Institute of Economics,Yangon, on 22-23 August, 1990.
Population Council. Computational Methods for Population Projections: FIVFIVISINSIN Release 8.1.Population Council, New York, 1986.
Trussell, T.J. "A Re-estimation of the Multiplying Factors for the Brass Technique for DeterminingChildhood Survival Rates". Population Studies, Vo1.29, No.1, pp.97-108, 1985.
United Nations. The Population of Asia and the Far-East, 1950-1980. United Nations, New York,1959
United Nations. World Population Prospects as Assessed in 1968. Population Studies No.60,United Nations, New York, 1977.
United Nations. Manual X: Indirect Techniques for Demographic Estimation. Population StudiesNo.97, United Nations, New York, 1983.
United Nations. World Population Prospects 1990. Population Studies No.120, United Nations,New York, 1991.
United Nations Fund for Population Activities (UNFPA). Inventory of Population Projects inDeveloping Countries Around the World, 1985/86. UNFPA, New York, 1987.
Win Tint, 1989. Population Projections for Burma, 1983-2013. Unpublished MA Thesis, TheAustralian National University, Canberra.
23456:1 A
6:1 B6:1 C6:2 A
6:2 B6:2 C6:3 A
6:3 B6:3 C
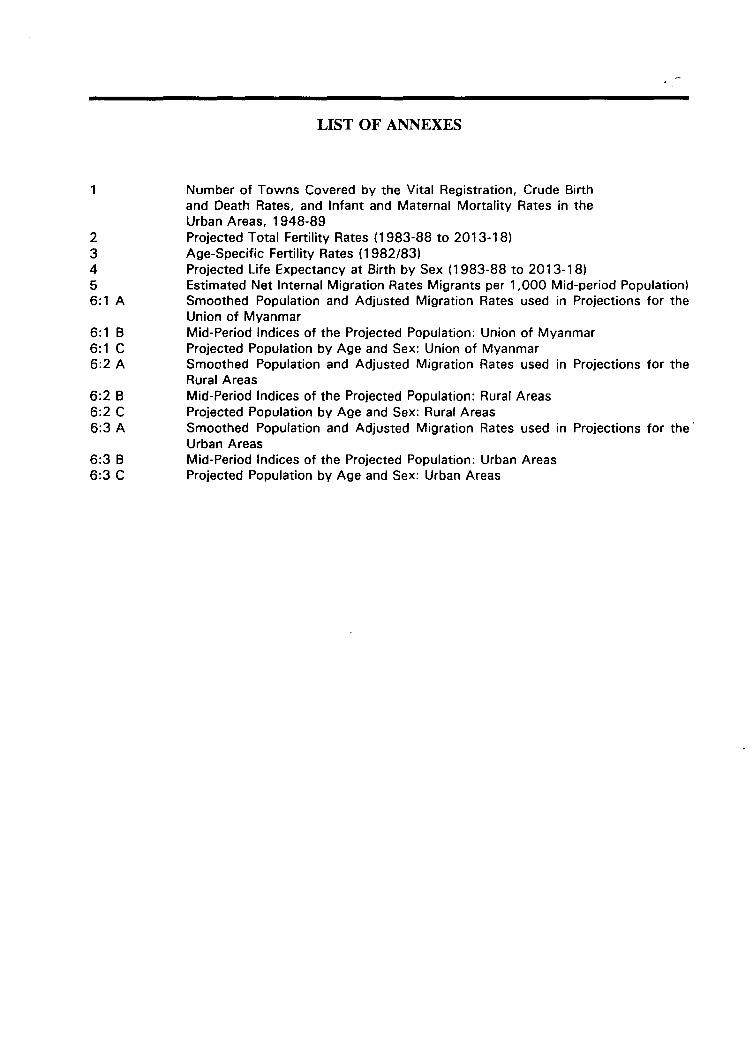
LIST OF ANNEXES
Number of Towns Covered by the Vital Registration, Crude Birthand Death Rates, and Infant and Maternal Mortality Rates in theUrban Areas, 1948-89Projected Total Fertility Rates (1983-88 to 2013-18)Age-Specific Fertility Rates (1982/83)Projected Life Expectancy at Birth by Sex (1983-88 to 2013-18)Estimated Net Internal Migration Rates Migrants per 1,000 Mid-period Population)Smoothed Population and Adjusted Migration Rates used in Projections for theUnion of MyanmarMid-Period Indices of the Projected Population: Union of MyanmarProjected Population by Age and Sex: Union of MyanmarSmoothed Population and Adjusted Migration Rates used in Projections for theRural AreasMid-Period Indices of the Projected Population: Rural AreasProjected Population by Age and Sex: Rural AreasSmoothed Population and Adjusted Migration Rates used in Projections for the'Urban AreasMid-Period Indices of the Projected Population: Urban AreasProjected Population by Age and Sex: Urban Areas
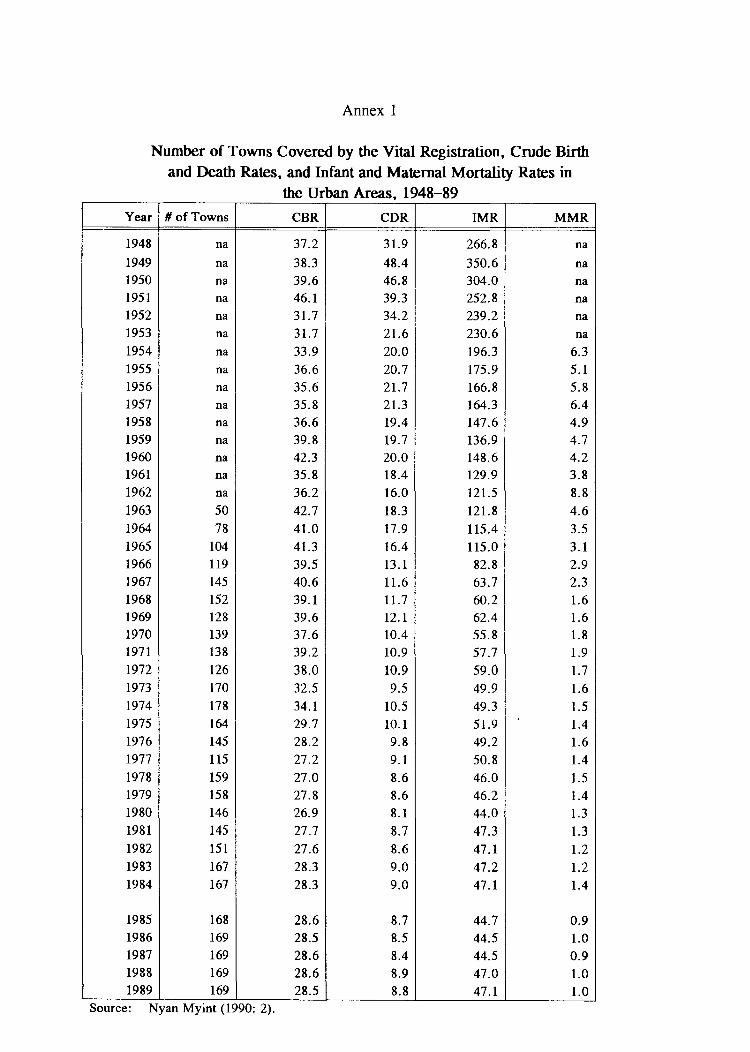
Annex 1
Number of Towns Covered by the Vital Registration, Crude Birthand Death Rates, and Infant and Maternal Mortality Rates in
the Urban Areas, 1948-89
Year # of Towns CBR CDR IMR MMR
1948 na 37.2 31.9 266.8 na
1949 na 38.3 48.4 350.6 na1950 na 39.6 46.8 304.0 na1951 na 46.1 39.3 252.8 na1952 na 31.7 34.2 239.2 na1953 na 31.7 21.6 230.6 na1954 na 33.9 20.0 196.3 6.31955 na 36.6 20.7 175.9 5.11956 na 35.6 21.7 166.8 5.81957 na 35.8 21.3 164.3 6.41958 na 36.6 19.4 147.6 4.91959 na 39.8 19.7 136.9 4.71960 na 42.3 20.0 148.6 4.21961 na 35.8 18.4 129.9 3.81962 na 36.2 16.0 121.5 8.81963 50 42.7 18.3 121.8 4.61964 78 41.0 17.9 115.4 3.51965 104 41.3 16.4 115.0 3.11966 119 39.5 13.1 82.8 2.91967 145 40.6 11.6 63.7 2.31968 152 39.1 11.7 60.2 1.61969 128 39.6 12.1 62.4 1.61970 139 37.6 10.4 55.8 1.81971 138 39.2 10.9 57.7 1.91972 126 38.0 10.9 59.0 1.71973 170 32.5 9.5 49.9 1.61974 178 34.1 10.5 49.3 1.51975 164 29.7 10.1 51.9 1.41976 145 28.2 9.8 49.2 1.61977 115 27.2 9.1 50.8 1.41978 159 27.0 8.6 46.0 1.51979 158 27.8 8.6 46.2 1.41980 146 26.9 8.1 44.0 1.31981 145 27.7 8.7 47.3 1.31982 151 27.6 8.6 47.1 1.21983 167 28.3 9.0 47.2 1.21984 167 28.3 9.0 47.1 1.4
1985 168 28.6 8.7 44.7 0.91986 169 28.5 8.5 44.5 1.01987 169 28.6 8.4 44.5 0.91988 169 28.6 8.9 47.0 1.01989 169 28.5 8.8 47.1 1.0
Source: Nyan Mymt (1990: 2).
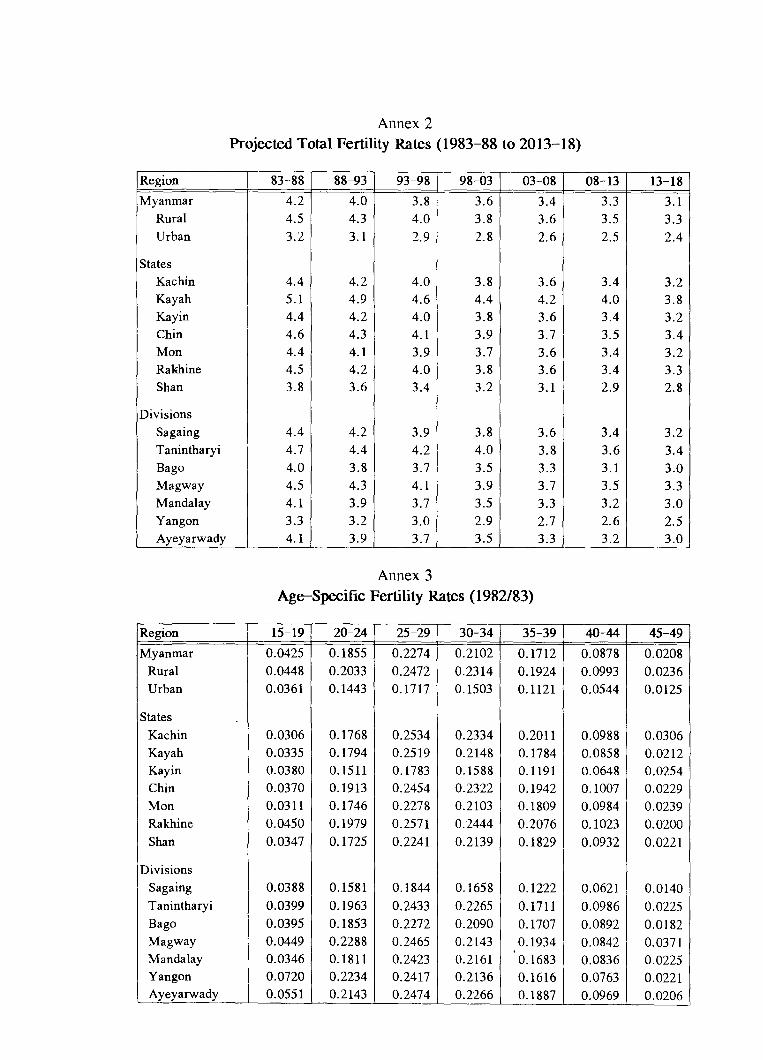
Annex 2Projected Total Fertility Rates (1983-88 to 2013-18)
Region 83-88 88-93 93-98 98-03 03-08 08-13 13-18
Myanmar 4.2 4.0 3.8 3.6 3.4 3.3 3.1Rural 4.5 4.3 4.0 3.8 3.6 3.5 3.3Urban 3.2 3.1 2.9 2.8 2.6 2.5 2.4
StatesKachin 4.4 4.2 4.0 3.8 3.6 3.4 3.2Kayah 5.1 4.9 4.6 4.4 4.2 4.0 3.8Kayin 4.4 4.2 4.0 3.8 3.6 3.4 3.2Chin 4.6 4.3 4.1 3.9 3.7 3.5 3.4Man 4.4 4.1 3.9 3.7 3.6 3.4 3.2Rakhine 4.5 4.2 4.0 3.8 3.6 3.4 3.3Shan 3.8 3.6 3.4 3.2 3.1 2.9 2.8
Divisions
Sagaing 4.4 4.2 3.9 3.8 3.6 3.4 3.2Tanintharyi 4.7 4.4 4.2 4.0 3.8 3.6 3.4Bago 4.0 3.8 3.7 3.5 3.3 3.1 3.0Magway 4.5 4.3 4.1 3.9 3.7 3.5 3.3Mandalay 4.1 3.9 3.7 3.5 3.3 3.2 3.0Yangon 3.3 3.2 3.0 2.9 2.7 2.6 2.5Ayeyarwady 4.1 3.9 3.7 3.5 3.3 3.2 3.0
Annex 3Age-Specific Fertility Rates (1982/83)
Region 15-19 20-24 25-29 30-34 35-39 40-44 45-49
Myanmar 0.0425 0.1855 0.2274 0.2102 0.1712 0.0878 0.0208Rural 0.0448 0.2033 0.2472 0.2314 0.1924 0.0993 0.0236Urban 0.0361 0.1443 0.1717 0.1503 0.1121 0.0544 0.0125
States
Kachin 0.0306 0.1768 0.2534 0.2334 0.2011 0.0988 0.0306Kayah 0.0335 0.1794 0.2519 0.2148 0.1784 0.0858 0.0212Kayin 0.0380 0.1511 0.1783 0.1588 0.1191 0.0648 0.0254Chin 0.0370 0.1913 0.2454 0.2322 0.1942 0.1007 0.0229Man 0.0311 0.1746 0.2278 0.2103 0.1809 0.0984 0.0239Rakhine 0.0450 0.1979 0.2571 0.2444 0.2076 0.1023 0.0200Shan 0.0347 0.1725 0.2241 0.2139 0.1829 0.0932 0.0221
Divisions
Sagaing 0.0388 0.1581 0.1844 0.1658 0.1222 0.0621 0.0140Tanintharyi 0.0399 0.1963 0.2433 0.2265 0.1711 0.0986 0.0225Bago 0.0395 0.1853 0.2272 0.2090 0.1707 0.0892 0.0182Magway 0.0449 0.2288 0.2465 0.2143 0.1934 0.0842 0.0371,Mandalay 0.0346 0.1811 0.2423 0.2161 0.1683 0.0836 0.0225Yangon 0.0720 0.2234 0.2417 0.2136 0.1616 0.0763 0.0221Ayeyarwady 0.0551 0.2143 0.2474 0.2266 0.1887 0.0969 0.0206
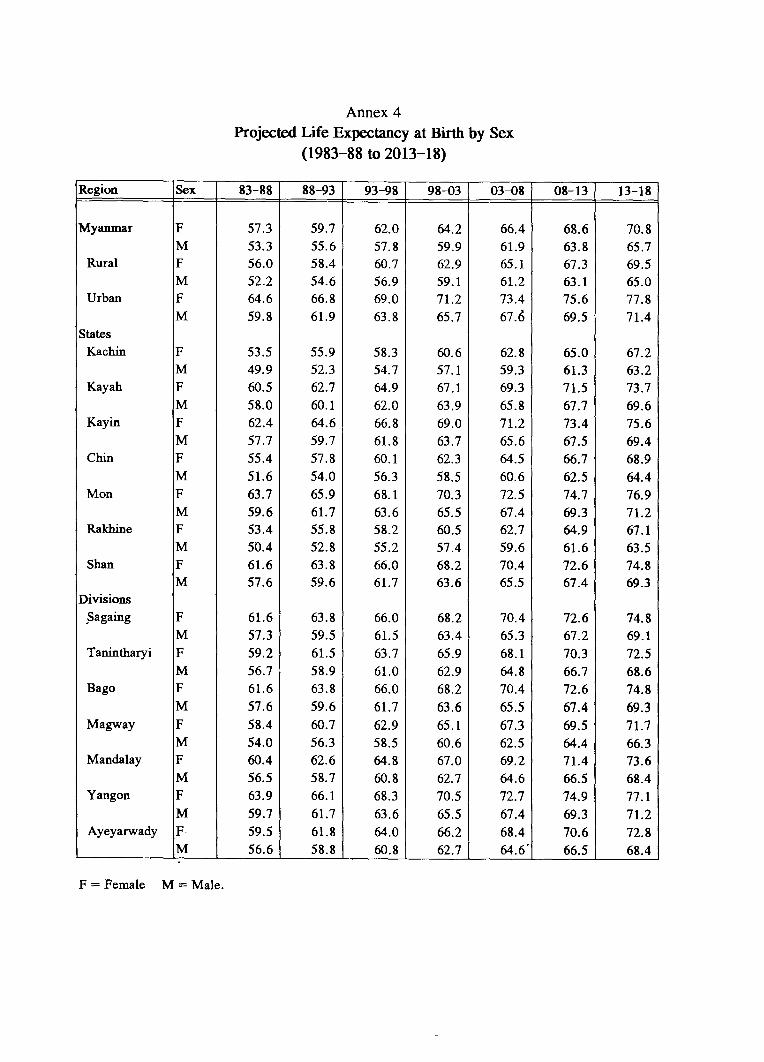
Annex 4Projected Life Expectancy at Birth by Sex
(1983-88 to 2013-18)
Region Sex 83-88 88-93 93-98 98-03 03-08 08-13 13-18
Myanmar F 57.3 59.7 62.0 64.2 66.4 68.6 70.8M 53.3 55.6 57.8 59.9 61.9 63.8 65.7
Rural F 56.0 58.4 60.7 62.9 65.1 67.3 69.5M 52.2 54.6 56.9 59.1 61.2 63.1 65.0
Urban F 64.6 66.8 69.0 71.2 73.4 75.6 77.8M 59.8 61.9 63.8 65.7 67.6 69.5 71.4
StatesKachin F 53.5 55.9 58.3 60.6 62.8 65.0 67.2
M 49.9 52.3 54.7 57.1 59.3 61.3 63.2Kayah F 60.5 62.7 64.9 67.1 69.3 71.5 73.7
M 58.0 60.1 62.0 63.9 65.8 67.7 69.6Kayin F 62.4 64.6 66.8 69.0 71.2 73.4 75.6
M 57.7 59.7 61.8 63.7 65.6 67.5 69.4Chin F 55.4 57.8 60.1 62.3 64.5 66.7 68.9
M 51.6 54.0 56.3 58.5 60.6 62.5 64.4Mon F 63.7 65.9 68.1 70.3 72.5 74.7 76.9
M 59.6 61.7 63.6 65.5 67.4 69.3 71.2Rakhine F 53.4 55.8 58.2 60.5 62.7 64.9 67.1
M 50.4 52.8 55.2 57.4 59.6 61.6 63.5Shan F 61.6 63.8 66.0 68.2 70.4 72.6 74.8
M 57.6 59.6 61.7 63.6 65.5 67.4 69.3Divisions
,Sagaing F 61.6 63.8 66.0 68.2 70.4 72.6 74.8M 57.3 59.5 61.5 63.4 65.3 67.2 69.1
Tanintharyi F 59.2 61.5 63.7 65.9 68.1 70.3 72.5M 56.7 58.9 61.0 62.9 64.8 66.7 68.6
Bago F 61.6 63.8 66.0 68.2 70.4 72.6 74.8M 57.6 59.6 61.7 63.6 65.5 67.4 69.3
Magway F 58.4 60.7 62.9 65.1 67.3 69.5 71.7M 54.0 56.3 58.5 60.6 62.5 64.4 66.3
Mandalay F 60.4 62.6 64.8 67.0 69.2 71.4 73.6M 56.5 58.7 60.8 62.7 64.6 66.5 68.4
Yangon F 63.9 66.1 68.3 70.5 72.7 74.9 77.1M 59.7 61.7 63.6 65.5 67.4 69.3 71.2
Ayeyarwady F 59.5 61.8 64.0 66.2 68.4 70.6 72.8M 56.6 58.8 60.8 62.7 64.6' 66.5 68.4
F = Female M = Male.
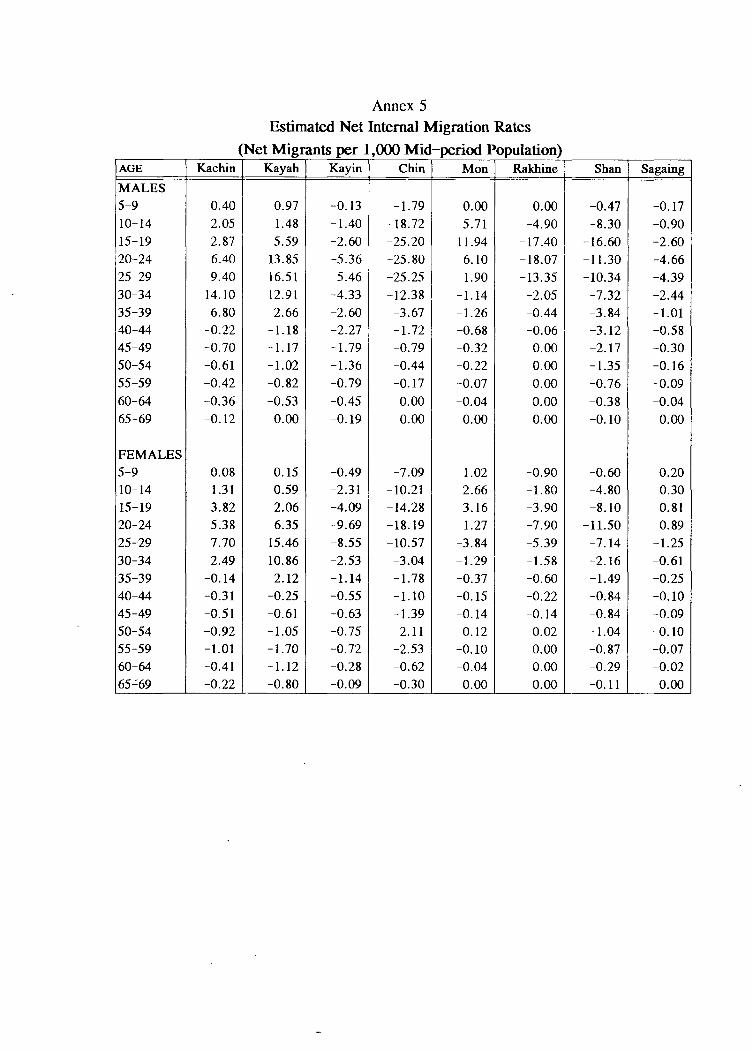
Annex 5Estimated Net Internal Migration Rates
(Net Migrants per 1,000 Mid-period Population)AGE Kachin Kayah Kayin Chin Man Rakhine Shan Sagaing
MALES5-9 0.40 0.97 -0.13 -1.79 0.00 0.00 -0.47 -0.1710-14 2.05 1.48 -1.40 -18.72 5.71 -4.90 -8.30 -0.9015-19 2.87 5.59 -2.60 -25.20 11.94 -17.40 -16.60 -2.6020-24 6.40 13.85 -5.36 -25.80 6.10 -18.07 -11.30 -4.6625-29 9.40 16.51 -5.46 -25.25 1.90 -13.35 -10.34 -4.3930-34 14.10 12.91 -4.33 -12.38 I -1.14 -2.05 -7.32 -2.4435-39 6.80 2.66 -2.60 -3.67 -1.26 -0.44 -3.84 -1.0140-44 -0.22 -1.18 -2.27 -1.72 -0.68 -0.06 -3.12 -0.5845-49 -0.70 -1.17 -1.79 -0.79 -0.32 0.00 -2.17 -0.3050-54 -0.61 -1.02 -1.36 -0.44 -0.22 0.00 -1.35 -0.1655-59 -0.42 -0.82 -0.79 -0.17 -0.07 0.00 -0.76 -0.0960-64 -0.36 -0.53 -0.45 0.00 -0.04 0.00 -0.38 -0.0465-69 -0.12 0.00 -0.19 0.00 0.00 0.00 -0.10 0.00
FEMALES5-9 0.08 0.15 -0.49 -7.09 1.02 -0.90 -0.60 0.2010-14 1.31 0.59 -2.31 -10.21 2.66 -1.80 -4.80 0.3015-19 3.82 2.06 -4.09 -14.28 3.16 -3.90 -8.10 0.8120-24 5.38 6.35 -9.69 -18.19 1.27 -7.90 -11.50 0.8925-29 7.70 15.46 -8.55 -10.57 -3.84 -5.39 -7.14 -1.2530-34 2.49 10.86 -2.53 -3.04 -1.29 -1.58 -2.16 -0.6135-39 -0.14 2.12 -1.14 -1.78 -0.37 -0.60 -1.49 -0.2540-44 -0.31 -0.25 -0.55 -1.10 -0.15 -0.22 -0.84 -0.1045-49 -0.51 -0.61 -0.63 -1.39 -0.14 -0.14 -0.84 -0.0950-54 -0.92 -1.05 -0.75 -2.11 -0.12 -0.02 -1.04 -0.1055-59 -1.01 -1.70 -0.72 -2.53 -0.10 0.00 -0.87 -0.0760-64 -0.41 -1.12 -0.28 -0.62 -0.04 0.00 -0.29 -0.0265-=69 -0.22 -0.80 -0.09 -0.30 0.00 0.00 -0.11 0.00
Annex 6
UNION OF MYANMAR
Table 1(A) Table 1(B)Smoothed Population and Mid-Period Indices of the Projected Population
Adjusted Migration Rates used in Projectionstor Union ot Myanmar ------------------------------------------------------------------------------------------
Indica!or 1983-88 1988-93 1993-98 1998-03 2003-08 2008-13 2013-18-------------------------------------------- ------------------------------------------------------------------------------------------
Age Population Mig. Rate Total Fertility Rate 4.22 4.01 3.81 3.62 3.44 3.27 3.10Group Females Males Females Males Gross Reproduction Rate 2.05 1.95 1.85 1.76 1.67 1.59 1.51
-------------------------------------------- Net Reproduction Rate 1.65 1.62 1.59 1.55 1.51 1.47 1.420-5 2326542 2405958 0.0 0.0 Mean-Age at Child Birth 30.95 30.94 30.79 30.68 30.60 30.54 30.495-9 2263790 2305201 0.0 0.0 Female e(O) 57.33 59.73 62.03 64.22 66.43 68.63 70.83
10-14 2144001 2168078 0.0 0.0 Male e(O) 53.25 55.60 57.80 59.85 61.90 ' 63.80 65.7015-19 1970782 1935849 0.0 0.0 Female IMR 83.10 72.36 62.51 53.52 44.82 36.38 28.3920-24 1741152 1683210 0.0 0.0 Male IMR 104.00 91.33 80.02 69.92 60.25 51.58 42.8625-29 1448989 1405058 0.0 0.0 Female e(5) 60.14 61.57 62.95 64.26 65.60 66.95 68.3730-34 1134354 1114441 0.0 0.0 Male e(5) 57.15 58.48 59.74 60.92 62.11 63.21 64.3335-39 893679 875579 0.0 0.0 Mid-Year Population 37306093 41319329 45844615 50722505 55802150 61039492 6650253140-44 778637 750512 0.0 0.0 Annual Births 1140740 1256429 1347196 1398508 1425371 1456114 151031945-49 731580 699943 0.0 0.0 Annual Deaths 394361 394969 397039 397429 395180 391721 38918250-54 660172 632133 0.0 0.0 Annual Net Migration 0 0 0 0 0 0 055-59 545832 519927 0.0 0.0 Gross Fertility Rate 136.4 131.5 126.7 120.3 112.8 106.3 101.560-64 420773 392870 0.0 0.0 Crude Birth Rate 30.6 30.4 29.4 27.6 25.5 23.9 22.765-69 305341 275509 0.0 0.0 Crude Death Rate 10.6 9.6 8.7 7.8 7.1 6.4 5.970-74 203083 177631 0.0 0.0 Rate of Natural Increase 20.0 20.8 20.7 19.7 18.5 17.4 16.9
75+ 220952 176358 0.0 0.0 Migration Rate 0.0 0.0 0.0 0.0 0.0 0.0 0.0-------------------------------------------- Growth Rate 20.0 20.8 20.7 19.7 18.5 17.4 16.9
Total 17789659 17518257 - - Sex-Ratio 0.986 0.987 0.989 0.991 0.992 0.994 0.994-------------------------------------------- ------------------------------------------------------------------------------------------
Sex-Ratio at birth 105.5Average Annual Intercensal growth rate (1973-83) 19.9
Union of Myanmar - iiTable 1(c): Projected Population by Age and Sex
----------------------------------------------------------------------------------------------------------------------------------------1983 1988 1993 1998
AGE MALES FEMALES TOTAL MALES FEMALES TOTAL MALES FEMALES TOTAL MALES FEMALES TOTAL.......................... -_ ...... --- .. -_ .. _.......... -_ .. -_ ............................ -_ ........ -_ .......... -- -- --_ .. -_ ............ -_ ................ -_ ...... -_ ........ -_ .. -_ .... -_ ...... _.......... -- -- -- -_ .... -- -- ----
0 2415271 2336085 4751356 2635195 2549611 5184806 2945282 2845086 5790368 3199831 3088149 62879805 2305865 2263527 4569392 2344127 2274187 4618314 2571940 2495693 5067633 2888968 2798753 5687721
10 2172861 2148577 4321438 2282559 2242939 4525498 2324144 2257219 4581363 2554145 2481289 503543415 1944981 1977808 3922789 2147625 2126779 4274404 2260812 2224605 4485417 2304909 2242520 4547429
20 1692999 1750469 3443468 1914299 1949997 3864296 2121272 2103110 4224382 2237620 2204569 444218925 1415908 1460891 2876799 1661113 1720164 3381277 1886228 1922533 3808761 2096699 2079270 417596930 1125805 1147026 2272831 1385642 1431850 2817492 1631905 1691379 3323284 1859366 1896128 375549435 884735 903244 1787979 1096715 1121048 2217763 1354899 1404053 2758952 1601289 1663818 326510740 754804 782847 1537651 855704 878719 1734423 1065058 1094412 2159470 1320799 1375210 269600945 700575 732491 1433066 722125 756431 1478556 822421 852091 1674512 1027970 1064874 209284450 633192 661972 1295164 658915 699973 1358888 682766 725718 1408484 781384 820645 160202955 522573 549247 1071820 580350 621561 1201911 607635 660464 1268099 633211 688028 132123960 395754 424255 820009 460120 500572 960692 514728 570132 1084860 542624 609639 115226365 277713 308036 585749 327779 367939 695718 384547 437803 822350 433865 502776 93664170 178967 204935 383902 209630 246334 455964 250167 297391 547558 296565 357589 65415475 176907 221934 398841 190267 243854 434121 219061 286885 505946 261756 347937 609693
.... -_ ...................................................................................................................... -_ .................................................................................... -_ ............ -- ......................................
TOTAL 17598910 17873344 35472254 19472165 19731958 39204123 21642865 21868574 43511439 24041001 24221194 48262195----------------------------------------------.--------------------.-------------------------------_ .. _._-------------------------------
* * * POPULATION IN SELECTED AGES AND DEPENDENCY RATIO * * *
5 468074 458307 926381 478680 462831 941511 539566 523613 1063179 603765 584318 11880836 465167 456194 921361 472127 457006 929133 526416 510904 1037320 591383 572611 11639947 461739 453370 915109 467399 453239 920638 513744 498561 1012305 578280 560218 11384988 457743 449881 907624 464100 451069 915169 501717 486795 988512 564689 547357 1112046
5-9 2305865 2263527 4569392 2344127 2274187 4618314 2571940 2495693 5067633 2888968 2798753 568772110-13 1754348 1730769 3485117 1833772 1800781 3634553 1867115 1811413 3678528 2067460 2008433 407589314-15 827414 828820 1656234 892063 879067 1771130 913329 892455 1805784 962606 935138 189774416-19 1536080 1566796 3102876 1704349 1689870 3394219 1804512 1777956 3582468 1828988 1780238 36092260-14 6893997 6748189 13642186 7261881 7066737 14328618 7841366 7597998 15439364 8642944 8368191 17011135
(38.57) (37.76) (38.46) (36.80) (35.81) (36.55) (35.86) (34.74) (35.48) (35.68) (34.55) (35.25)15-64 10071326 10390250 20461576 11482608 11807094 23289702 12947724 13248497 26196221 14405871 14644701 29050572
(57.83) (58.13) (57.68) (59.46) (59.84) (59.41) (60.20) (60.58) (60.21) (60.19) (60.46) (60.19)65+ 633587 734905 1368492 727676 858127 1585803 853775 1022079 1875854 992186 1208302 2200488
( 3.60) ( 4.11) ( 3.86) ( 3.74) ( 4.35) ( 4.04) ( 3.94) ( 4.67) ( 4.31) ( 4.13) ( 4.99) ( 4.56)Dep. Rati 0 y= 66.67 0= 6.69 T= 73.36 y= 61.52 0= 6.81 T= 68.33 y= 58.94 0= 7.16 T= 66.10 y= 58.56 0= 7.57 T= 66.13Sex Ratio 98.46 98.68 98.97 99.26
------------------- -- - - - - - -- - ------_ .. ------- - - - - --- ----------- -- -- -- - -- -- - - - - - - - - - - _.. - - -- - -- - - - - - - - - - - _. - - - - - - - - - - - - - - - - -- - - -- _. - - -- - - --
union of Myanmar - i i iTable 1(c): Projected Population by Age and Sex
_.... -_ ........................................................................ -- -_ ...... -_ .............. -_ ........ -_ ............. - .. -- .... -_ .................... -_ ........ -_ .. -- -_ .... --_ ...... -- -- -_ .... -_ .... --- .. -- -_ ..........
1998 2003 2008 2013
AGE MALES FEMALES TOTAL MALES FEMALES TOTAL MALES FEMALES TOTAL MALES FEMALES TOTAL----------------------------------------------------------------------------------------------------------------------------------------
0 3199831 3088149 6287980 3360612 3242519 6603131 3462786 3339525 6802311 3572944 3443414 7016358
5 2888968 2798753 5687721 3152289 3051273 6203562 3323089 3215514 6538603 3434749 3321055 6755804
10 2554145 2481289 5035434 2873997 2787344 5661341 3141133 3043473 6184606 3316229 3211379 6527608
15 2304909 2242520 4547429 2537385 2469882 5007267 2861180 2779977 5641157 3133270 3040663 6173933
20 2237620 2204569 4442189 2284729 2226822 4511551 2520653 2458330 4978983 2849419 ·2773343 5622762
25 2096699 2079270 4175969 2216123 2184462 4400585 2267382 2211575 4478957 2507615 2447369 4954984
30 1859366 1896128 3755494 2072460 2056441 4128901 2195380 2165822 4361202 2251152 2197823 444897535 1601289 1663818 3265107 1830223 1870984 3701207 2045728 2035025 4080753 2172512 2148765 432127740 1320799 1375210 2696009 1566489 1634880 3201369 1796432 1844236 3640668 2014254 2011970 402622445 1027970 1064874 2092844 1279735 1342552 2622287 1523498 1601403 3124901 17<;3750 1812702 356645250 781384 820645 1602029 981040 1029482 2010522 1226669 1302975 2529644 1467047 1560689 302773655 633211 688028 1321239 728445 781712 1510157 919345 985450 1904795 1155957 1253939 240989660 542624 609639 1152263 569046 639088 1208134 658848 730925 1389773 837365 928228 176559365 433865 502776 936641 461030 542084 1003114 487432 573303 1060735 569440 662327 123176770 296565 357589 654154 337893 415024 752917 362734 452650 815384 387906 485239 87314575 261756 347937 609693 315481 426099 741580 372428 513681 886109 421948 596097 1018045
................................................................ -_ .................. -_ ........................ -_ .................... -_ .......................................... -_ .... -_ .. -- .-_ .. -_ ......................................... - ........ -_ ..
TOTAL 24041001 24221194 48262195 26566977 26700648 53267625 29164717 29253864 58418581 31845557 31895002 63740559.. __ ................................ _ .. _ ........ _ ............ a .............. ____ .... __ ........................ __ .................................. _ ............................... _ .......... __ .. __ .. __ .... _______________________
* * * POPULATION IN SELECTED AGES AND DEPENDENCY RATIO * * *
5 603765 584318 1188083 648564 627399 1275963 675570 653360 1328930 695507 672059 13675666 591383 572611 1163994 640332 619622 1259954 670591 648732 1319323 691175 668101 13592767 578280 560218 1138498 631247 611016 1242263 665140 643625 1308765 686947 664224 13511718 564689 547357 1112046 621372 601650 1223022 659169 637997 1297166 682724 660335 1343059
5-9 2888968 2798753 5687721 3152289 3051273 6203562 3323089 3215514 6538603 3434749 3321055 675580410-13 2067460 2008433 4075893 2326145 2255261 4581406 2532593 2453314 4985907 2664986 2580256 524524214-15 962606 935138 1897744 1081551 1050912 2132463 1205825 1169735 2375560 1295362 1255608 255097016-19 1828988 1780238 3609226 2003686 1951053 3954739 2263895 2200401 4464296 2489151 2416178 49053290-14 8642944 8368191 17011135 9386898 9081136 18468034 9927008 9598512 19525520 10323922 9975848 20299770
(35.68) (34.55) (35.25) (35.16) (34.01) (34.67) (33.93) (32.81) (33.42) (32.37) (31.28) (31.85)15-64 14405871 14644701 29050572 16065675 16236305 32301980 18015115 18115718 36130833 20142341 20175491 40317832
(60.19) (60.46) (60.19) (60.65) (60.81) (60.64) (61.87) (61.93) (61.85 ) (63.30) (63.26) (63.25)65+ 992186 1208302 2200488 1114404 1383207 2497611 1222594 1539634 2762228 1379294 1743663 3122957
( 4.13) ( 4.99) ( 4.56) ( 4.19) ( 5.18) ( 4.69) ( 4.19) ( 5.26) ( 4.73) ( 4.33) ( 5.47) ( 4.90)Dep. Ratio y= 58.56 0= 7.57 T= 66.13 y= 57.17 0= 7.73 T= 64.91 y= 54.04 0= 7.65 T= 61.69 y= 50.35 0= 7.75 T= 58.10Sex Ratio 99.26 99.50 99.70 99.84
----------------------------------------------------------------------------------------------------------------------------------------
RURAL AREAS
Table 2(A) Table 2(B)Smoothed Population and Mid-Period Indices of the Projected Population
Adjusted Migration Rates used in Projectionsfor Rural Areas ------------------------------------------------------------------------------------------
Indicator 1983-88 1988-93 1993-98 1998-03 2003-08 2008-13 2013-18
-------------------------------------------- ------------------------------------------------------------------------------------------Age Population Mlg. Rate Total Fertility Rate 4.47 4.25 4.03 3.83 3.64 3.46 3.29
Group Females Males Females Males Gross Reproduction Rate 2.18 2.07 1.96 1.87 1.77 1.68 1.60
-------------------------------------------- Net Reproduction Rate 1.71 1.68 1.65 1.61 1.57 1.53 1.49
0-5 1858604 1920261 0.0 0.0 Mean-Age at Child Birth 31.41 31.41 31.42 31.25 31.13 31.04 30.975-9 1759687 1784073 0.0 0.0 Female e(0) 55.95 58.35 60.65 62.85 65.05 67.25 69.45
10-14 1631294 1638669 -1.0 -2.0 Male e(O) 52.17 54.57 56.92 59.12 61.17 63.07 64.9715-19 1479335 1436730 -1.0 -8.0 Female IMR 89.52 78.52 68.39 59.09 50.16 41.66 33.2620-24 1298585 1239514 -5.0 -6.0 Male IMR 110.00 96.79 84.46 73.43 63.59 54.91 46.21
25-29 1080378 1038569 -10.0 -1.0 Female e(5) 59.33 60.75 62.12 63.44 64.76 66.09 67.4530-34 845208 827906 -9.0 -1.0 Male e(5) 56.54 57.90 59.24 60.50 61.68 62.79 63.9035-39 667357 652235 -6.0 0.0 Mid-Year Population 28214480 30921249 33916245 37147025 40535830 44042052 4768597140-44 585749 561458 -3.0 0.0 Annual Births 896354 965085 1029817 1075045 1104443 1130873 1169335
45-49 554068 528995 -2.0 0.0 Annual Deaths 316686 313586 312820 311290 307068 300885 29483850-54 501337 483203 -1.0 0.0 Annual Net Migration -67771 -79834 -89712 -98279 -107323 -117666 -12911055-59 414244 399932 -1.0 0.0 Gross Fertility Rate 141.0 135.3 129.8 124.7 118.4 111.7 106.160-64 318392 302922 0.0 0.0 Crude Birth Rate 31.8 31.2 30.4 28.9 27.2 25.7 24.565-69 230032 213412 0.0 0.0 Crude Death Rate 11.2 10.1 9.2 8.4 7.6 6.8 6.270-74 151121 138015 0.0 0.0 Rate of Natural Increase 20.5 21.1 21.1 20.6 19.7 18.8 18.3
75+ 162440 137899 0.0 0.0 Migration Rate -2.4 -2.6 -2.6 -2.6 -2.6 -2.7 -2.7
-------------------------------------------- Growth Rate 18.1 18.5 18.5 17.9 17.0 16.2 15.6Total 13537831 13303793 - - Sex-Ratio 0.986 0.993 1.002 1.012 1.021 1.028 1.032
-------------------------------------------- ------------------------------------------------------------------------------------------Sex-Ratio at birth 105.5Average Annuallntercensal growth rate (1973-83) 19.4
Rural Areas - iiTable 2(c): Projected Population by Age and Sex
- ----- ----_ .. - - - - - - _.. --_.. - -- - - _.................................... -_ .. -_ ............................................................................ -_ .... -_ ........ -- -_ .. --_ .. -_ .................... -_ .. --_ ........ -_ ....
1983 1988 1993 1998AGE MALES FEMALES TOTAL MALES FEMALES TOTAL MALES FEMALES TOTAL MALES FEMALES TOTAL
----------------------------------------------------------------------------------------------------------------------------------------0 1925520 1864260 3789780 2055886 1991927 4047813 2245981 2172640 4418621 2429556 2347684 47772405 1786989 1761644 3548633 1862268 1808851 3671119 1999709 1943434 3943143 2195537 2130356 4325893
10 1643416 1636268 3279684 1754683 1740346 3495029 1832655 1790363 3623018 1971162 1926849 389801115 1442844 1485134 2927978 1584458 1610595 3195053 1697221 1717346 3414567 1777258 1770228 354748620 1244920 1304855 2549775 1370984 1441052 2812036 1511740 1568265 3080005 1626246 1677493 330373925 1045225 1087220 2132445 1196459 1232602 2429061 1322400 1362831 2685231 1464078 1488528 295260630 835762 852572 1688334 1015965 1010178 2026143 1167368 1141239 2308607 1294567 1262639 255720635 658744 673111 1331855 810575 799237 1609812 989103 943587 1932690 1140425 1063080 220350540 564381 587951 1152332 634713 637458 1272171 784264 756217 1540481 960699 890952 185165145 529063 554078 1083141 538223 557944 1096167 608086 605280 1213366 754623 717923 147254650 483633 502335 985968 496362 523402 1019764 507634 528345 1035979 576389 574092 115048155 401750 416659 818409 442082 467692 909774 456517 489450 945967 469576 495866 96544260 305032 320947 625979 352614 377026 729640 390878 425902 816780 406438 448339 85477765 215006 232034 447040 251629 276676 528305 293558 327785 621343 328243 373304 70154770 138984 152537 291521 161517 184355 345872 191142 222200 413342 225376 265997 49137375 138243 163132 301375 147152 178802 325954 167934 210973 378907 198996 255942 454938
.............................................................................. -- ............................................................................ -_ .... -_ ...... -_ ............ --_ .. -_ ...... --- -_ .... --_ ............ --_ .... -_ ........ -_ ....
TOTAL 13359512 13594737 26954249 14675570 14838143 29513713 16166190 16205857 32372047 17819169 17689272 35508441----------------------------------------------------------------------------------------------------------------------------------------
* * * POPULATION IN SELECTED AGES AND DEPENDENCY RATIO * * *
5 366646 360135 726781 381718 369059 750777 415223 403601 818824 456791 442620 8994116 362345 356698 719043 376628 364660 741288 407223 395812 803035 448157 434489 882646
7 357736 352770 710506 372081 361130 733211 399592 388327 787919 439274 426168 865442
8 352786 348400 701186 367910 358239 726149 392312 381202 773514 430223 417749 8479725-9 1786989 1761644 3548633 1862268 1808851 3671119 1999709 1943434 3943143 2195537 2130356 4325893
10-13 1329692 1320283 2649975 1415434 1400744 2816178 1476907 1438751 2915658 1593657 1555821 314947814-15 619009 625976 1244985 671524 673647 1345171 706657 701389 1408046 747167 735521 148268816-19 1137559 1175143 2312702 1252183 1276550 2528733 1346312 1367569 2713881 1407596 1405735 28133310-14 5355925 5262172 10618097 5672837 5541124 11213961 6078345 5906437 11984782 6596255 6404889 13001144
(39.40) (38.71) (39.39) (38.23) (37.34) (38.00) (37.51) (36.45) (37.02) (37.29) (36.21) (36.61)15-64 7511354 7784862 15296216 8442435 8657186 17099621 9435211 9538462 18973673 10470299 10389140 20859439
(56.92) (57.26) (56.75) (57.95) (58.34) (57.94) (58.46) (58.86) (58.61) (58.49) (58.73) (58.75)65+ 492233 547703 1039936 560298 639833 1200131 652634 760958 1413592 752615 895243 1647858
( 3.68) ( 4.03) ( 3.86) ( 3.82) ( 4.31) ( 4.07) ( 4.04) ( 4.70) ( 4.37) ( 4.22) ( 5.06) ( 4.64)Dep. Ratio Y= 69.42 0= 6.80 T= 76.22 y= 65.58 0= 7.02 T= 72.60 Y= 63.17 0= 7.45 T= 70.62 Y= 62.33 0= 7.90 T= 70.23Sex Ratio 98.27 98.90 99.76 100.73
------------------------------------------------------------------------------------------------------------------------------._--------
Rural Areas - iiiTable 2(c): Projected Population by Age and Sex
----------------------------------------------------------------------------------------------------------------------------------------1998 2003 2008 2013
AGE MALES FEMALES TOTAL MALES FEMALES TOTAL MALES FEMALES TOTAL MALES FEMALES TOTAL------------------------------------------------------.---------------------------------------------------------------------------------
0 2429556 2347684 471'7240 2567119 2480654 5047773 2668167 2577426 5245593 2760912 2665549 54264615 2195537 2130356 4325893 2385766 2313101 4698867 2531363 2454408 4985771 2640226 2558540 5198766
10 1971162 1926849 3898011 2167143 2115746 4282889 2358617 2301095 4659712 2506898 2445349 495224715 1777258 1770228 3547486 1914542 1908935 3823477 2106444 2100076 4206520 2295746 2288356 458410220 1626246 1677493 3303739 1707227 1734124 3441351 1840506 1874569 3715075 2026542 2065578 409212025 1464078 1488528 2952606 1580787 1600014 3180801 1663347 1660909 3324256 1795282 1799207 359448930 1294567 1262639 2557206 1437607 1385863 2823470 1556526 1500614 3057140 1641896 1564245 320614135 1140425 1063080 2203505 1268584 1177761 2446345 1413057 1299668 2712725 1534439 1417786 295222540 960699 890952 1851651 1111473 1002283 2113756 1240340 1112356 2352696 1386109 1233646 261975545 754623 717923 1472546 927986 844940 1772926 1077436 949992 2027428 1206683 1056785 226346850 576389 574092 1150481 718537 681574 1400111 887315 802376 1689691 1034655 903066 193772155 469576 495866 965442 535966 540323 1076289 671444 642942 1314386 833519 758478 159199760 406438 448339 854777 420675 456486 877161 483030 499602 982632 609112 597211 120632365 328243 373304 701547 343980 395909 739889 358684 405951 764635 415270 447712 86298270 225376 265997 491373 254449 305867 560316 269124 327526 596650 283538 339560 62309875 198996 255942 454938 238253 312187 550440 278596 372615 651211 311179 424667 735846
----------------------------------------------------------------------------------------------------------------------------------------TOTAL 17819169 17689272 35508441 19580094 19255767 38835861 21403996 20882125 42286121 23282006 22565735 45847741
----------------------------------------------------------------------------------------------------------------------------------------* * * POPULATION IN SELECTED AGES AND DEPENDENCY RATIO * * *
5 456791 442620 899411 492072 476598 968670 517073 500927 1018000 536614 519514 10561286 448157 434489 882646 485129 470040 955169 512102 496268 1008370 532522 515740 10482627 439274 426168 865442 477648 463019 940667 506719 491248 997967 528276 511857 10401338 430223 417749 847972 469671 455600 925271 500892 485863 986755 523801 507825 1031626
5-9 2195537 2130356 4325893 2385766 2313101 4698867 2531363 2454408 4985771 2640226 2558540 519876610-13 1593657 1555821 3149478 1753893 1709432 3463325 1905328 1855723 3761051 2020093 1967115 398720814-15 747167 735521 1482688 815987 804163 1620150 896195 882608 1778803 965108 950323 191543116-19 1407596 1405735 2813331 1511805 1511086 3022891 1663538 1662840 3326378 1817443 1816267 36337100-14 6596255 6404889 13001144 7120028 6909501 14029529 7558147 7332929 14891076 7908036 7669438 15577474
(37.29) (36.21) (36.61) (36.98) (35.88) (36.13) (36.19) (35.12) (35.22) (35.04) (33.99) (33.98). 15-64 10470299 10389140 20859439 11623384 11332303 22955687 12939445 12443104 25382549 14363983 13684358 28048341
(58.49) (58.73) (58.75) (58.75) (58.85) (59.11) (59.57) (59.59) (60.03) (60.62) (60.64) (61.18)65+ 752615 895243 1647858 836682 1013963 1850645 906404 1106092 2012496 1009987 1211939 2221926
( 4.22) ( 5.06) ( 4.64) ( 4.27) ( 5.27) ( 4.77) ( 4.23) ( 5.30) ( 4.76) ( 4.34) ( 5.37) ( 4.85)Dep. Ratio y= 62.33 0= 7.90 T= 70.23 y= 61.12 0= 8.06 T= 69.18 y= 58.67 0= 7.93 T= 66.60 y= 55.54 0= 7.92 T= ~3.46
Sex Ratio 100.73 101.68 102.50 103.17~---------~~-------------------~-----------~--------------------------------------------------------------------------------------------
URBAN AREAS
Table 3(A) Table 3(8)Smoothed Population and Mid-Period Indices of the Projected Population
Adjusted Migration Rates used in Projectionsfor Urban Areas ------------------------------------------------------------------------------------------
Indicator 1983-88 1988-93 1993-98 1998-03 2003-08 2008-13 2013-18
-------------------------------------------- ------------------------------------------------------------------------------------------Age Population Mig. Rate Total Fertility Rate 3.21 3.05 2.90 2.75 2.62 2.48 2.36
Group Females Males Females Males Gross Reproduction Rate 1.56 1.48 1.41 1.34 1.27 1.21 1.15-------------------------------------------- Net Reproduction Rate 1.38 1.34 1.31 1.26 1.22 1.18 1.13
0-5 467938 485697 0.0 0.0 Mean-Age at Child Birth 30.24 29.61 29.42 29.27 29.16 29.08 29.005-9 504103 521128 1.0 2.0 Female e(O) 64.58 66.78 68.98 71.18 73.38 75.58 77.78
10-14 512707 529409 2.0 8.0 Male e(O) . 59.82 61.87 63.77 65.67 67.57 69.47 71.3715-19 491447 499119 4.0 22.0 Female IMR 52.06 43.47 35.05 27.22 20.17 13.85 8.5320-24 442567 443696 14.0 17.0 Male IMR 70.07 60.39 51.72 42.99 35.06 27.79 21.1225-29 368611 366489 31.0 4.0 Female e(5) 64.48 65.81 67.16 68.61 70.17 71.79 73.5230-34 289146 286535 27.0 2.0 Male e(5) 60.90 62.09 63.20 64.31 65.53 66.81 68.1435-39 226322 223344 16.0 1.0 Mid-Year Population 9091613 10398080 11928370 13575480 15266320 16997440 1881656040-44 192888 189054 11.0 1.0 Annual Births 244386 291344 317379 323463 320928 325241 34098445-49 177512 170948 7.0 0.0 Annual Deaths 77675 81383 84219 86139 88112 90836 9434450-54 158835 148930 4.0 0.0 Annual Net Migration 67771 79834 89712 98279 107323 117666 12911055-59 131588 119995 3.0 0.0 Gross Fertility Rate 107.9 107.0 101.4 93.2 84.7 79.3 77.360-64 102381 89948 1.0 0.0 Crude Birth Rate 26.9 28.0 26.6 23.8 21.0 19.1 18.165-69 75309 62097 0.0 0.0 Crude Death Rate 8.5 7.8 7.1 6.3 5.8 5.3 5.070-74 51962 39616 0.0 0.0 Rate of Natural Increase 18.3 20.2 19.5 17.5 15.3 13.8 13.1
75+ 58512 38459 0.0 0.0 Migration Rate 7.5 7.7 7.5 7.2 7.0 6.9 6.9
-------------------------------------------- Growth Rate 25.8 27.9 27.1 24.7 22.3 20.7 20.0Total 4251828 4214464 - - Sex-Ratio 0.986 0.974 0.960 0.946 0.933 0.923 0.914
-------------------------------------------- ------------------------------------------------------------------------------------------Sex-Ratio at birth 106.0Average Annuallntercensal growth rate (1973-83) 21 .6
Urban Areas - iiTable 3(c): Projected Population by Age and Sex
- ----- - --- - - ----- -- - - - - - ------ -- - - - - ------ - - - - - ------ - - - --- - - - - - - ---- - - - - - - ----- - - - -- - - - - - - - - - - - - - ---- -- - - - - - - - - - - - - - - - - - - - - -- - -- - - - ---
1983 1988 1993 1998AGE MALES FEMALES TOTAL MALES FEMALES TOTAL MALES FEMALES TOTAL MALES FEMALES TOTAL
.------------------------------------------------------------------------------------------------------------------.-------------------
0 489751 471825 961576 579309 557684 1136993 699301 672446 1371747 770275 740465 15107405 518876 501883 1020759 481859 465336 947195 572231 552259 1124490 693431 668397 1361828
10 529445 512309 1041754 527876 502593 1030469 491489 466856 958345 582983 554440 113742315 502137 492674 994811 563167 516184 1079351 563591 507259 1070850 527651 472292 99994320 448079 445614 893693 543315 508945 1052260 609532 534845 1144377 611374 527076 113845025 370683 373671 744354 464654 487562 952216 563828 559702 1123530 632621 590742 122336330 290043 294454 584497 369677 421672 791349 464537 550140 1014677 564799 633489 119828835 225991 230133 456124 286140 321811 607951 365796 460466 826262 460864 600738 106160240 190423 194896 385319 220991 241261 462252 280794 338195 618989 360100 484258 84435845 171512 178413 349925 183902 198487 382389 214335 246811 461146 273347 346951 62029850 149559 159637 309196 162553 176571 339124 175132 197373 372505 204995 246553 45154855 120823 132588 253411 138268 153869 292137 151118 171014 322132 163635 192162 35579760 90722 103308 194030 107506 123546 231052 123850 144230 268080 136186 161300 29748665 62707 76002 138709 76150 91263 167413 90989 110018 201007 105622 129472 23509470 39983 52398 92381 48113 61979 110092 59025 75191 134216 71189 91592 16278175 38664 58802 97466 43115 65052 108167 51127 75912 127039 62760 91995 154755
-------- - -. --- - - - - - - - -- -- - - - _.- - - -- ----- - - - ------- - - - - ---- - - - - ------ - - - - ----- -- - - - - -- - - - - - - -- - - - - -- - - - ---- - - -- - ---- - - - - - ---- - - - - - - - - ---
TOTAL 4239398 4278607 8518005 4796595 4893815 9690410 5476675 5662717 11139392 6221832 6531922 12753754- - - - -- - -- --- - -- - - --- - - - - -- - - - - - - - - - -. - - - - - - - - - -- -- - _.- - - - - - - -- - - - - - - -- - - - - -- --- - -- - - - -- - ----- - - - - - -- - - - ------- - - - ----- - - -. ----- - -- -- - --
* * * POPULATION IN SELECTED AGES AND DEPENDENCY RATIO
5 101428 98172 199600 96962 93772 190734 124343 120012 244355 146974 141698 2886726 102822 99496 202318 95499 92346 187845 119193 115092 234285 143226 138122 2813487 104003 100600 204603 95318 92109 187427 114152 110234 224386 139006 134050 2730568 104957 101481 206438 96190 92830 189020 109405 105593 214998 134466 129608 264074
5-9 518876 501883 1020759 481859 465336 947195 572231 552259 1124490 693431 668397 136182810-13 424656 410486 835142 418338 400037 818375 390208 372662 762870 473803 452612 92641514-15 208405 202844 411249 220539 205420 425959 206672 191066 397738 215439 199617 41505616-19 398521 391653 790174 452166 413320 865486 458200 410387 868587 421392 374503 7958950-14 1538072 1486017 3024089 1589044 1525613 3114657 1763021 1691561 3454582 2046689 1963302 4009991
(35.95) (34.73) (35.50) (32.47) (31.17) (32.14) (31.13) (29.87) (31.01) (31.33) (30.06) (31.44)15-64 2559972 2605388 5165360 3040173 3149908 6190081 3512513 3710035 7222548 3935572 4255561 8191133
(60.72) (60.89) (60.64) (64.04) (64.37) (63.88) (65.19) (65.52) (64.84) (64.82) (65.15 ) (64.23)65+ 141354 187202 328556 167378 218294 385672 201141 261121 462262 239571 313059 552630
( 3.33) ( 4.38) ( 3.86) ( 3.49) ( 4.46) ( 3.98) ( 3.67) ( 4.61) ( 4.15) ( 3.85) ( 4.79) ( 4.33)Dep. Ratio y= 58.55 0= 6.36 T= 64.91 y= 50.32 0= 6.23 T= 56.55 y= 47.83 0= 6.40 T= 54.23 y= 48.96 0= 6.75 T= 55.70Sex Ratio 99.08 98.01 96.71 95.25
----------------------------_.---------------------------------------------------------------------------------------------------------
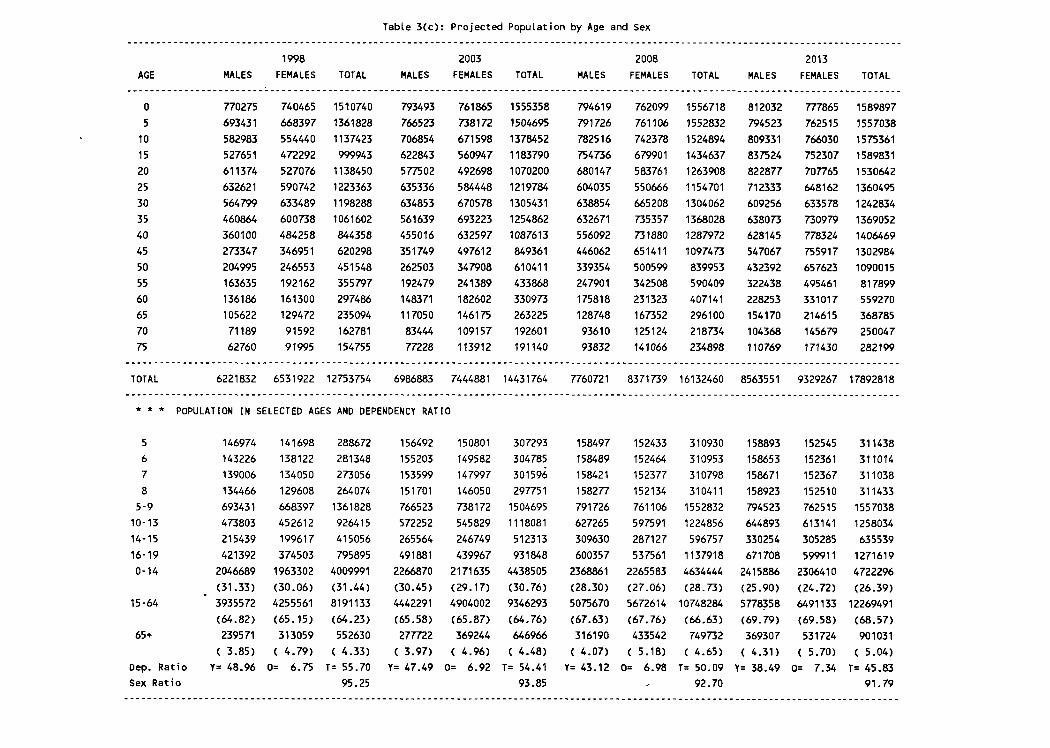
Table 3(c): Projected Population by Age and Sex--------------------------------------------------------------------.--------------------------------------.---------.------------------
1998 2003 2008 2013AGE MALES FEMALES TOTAL MALES FEMALES TOTAL MALES FEMALES TOTAL MALES FEMALES TOTAL
----------------------------------------------------------------------------------------------------------------------------------------0 770275 740465 1510740 793493 761865 1555358 794619 762099 1556718 812032 777865 15898975 693431 668397 1361828 766523 738172 1504695 791726 761106 1552832 794523 762515 1557038
10 582983 554440 1137423 706854 671598 1378452 782516 742378 1524894 809331 766030 157536115 527651 472292 999943 622843 560947 1183790 754736 679901 1434637 837524 752307 158983120 611374 527076 1138450 577502 492698 1070200 680147 583761 1263908 822877 707765 153064225 632621 590742 1223363 635336 584448 1219784 604035 550666 1154701 712333 648162 136049530 564799 633489 1198288 634853 670578 1305431 638854 665208 1304062 609256 633578 124283435 460864 600738 1061602 561639 693223 1254862 632671 735357 1368028 638073 730979 136905240 360100 484258 844358 455016 632597 1087613 556092 731880 1287972 628145 778324 140646945 273347 346951 620298 351749 497612 849361 446062 651411 1097473 547067 755917 130298450 204995 246553 451548 262503 347908 610411 339354 500599 839953 432392 657623 109001555 163635 192162 355797 192479 241389 433868 247901 342508 590409 322438 495461 81789960 136186 161300 297486 148371 182602 330973 175818 231323 407141 228253 331017 55927065 105622 129472 235094 117050 146175 263225 128748 167352 296100 154170 214615 36878570 71189 91592 162781 83444 109157 192601 93610 125124 218734 104368 145679 25004775 62760 91995 154755 77228 113912 191140 93832 141066 234898 110769 171430 282199
-----------------------------------------------------------------------------------------------------------.----------------------------TOTAL 6221832 6531922 12753754 6986883 7444881 14431764 7760721 8371739 16132460 8563551 9329267 17892818
------------------------------------------------------------------------------._---------------------------.--------------------_._-----* * * POPULATION IN SELECTED AGES AND DEPENDENCY RATIO
5 146974 141698 288672 156492 150801 307293 158497 152433 310930 158893 152545 3114386 143226 138122 281348 155203 149582 304785 158489 152464 310953 158653 152361 3110147 139006 134050 273056 153599 147997 301596 158421 152377 310798 158671 152367 3110388 134466 129608 264074 151701 146050 297751 158277 152134 310411 158923 152510 311433
5-9 693431 668397 1361828 766523 738172 1504695 791726 761106 1552832 794523 762515 155703810-13 473803 452612 926415 572252 545829 1118081 627265 597591 1224856 644893 613141 125803414-15 215439 199617 415056 265564 246749 512313 309630 287127 596757 330254 305285 63553916-19 421392 374503 795895 491881 439967 931848 600357 537561 1137918 671708 599911 12716190-14 2046689 1963302 4009991 2266870 2171635 4438505 2368861 2265583 4634444 2415886 2306410 4722296
(31.33) (30.06) (31.44) (30.45) (29.17) (30.76) (28.30) (27.06) (28.73) (25.90) (24.72) (26.39).15-64 3935572 4255561 8191133 4442291 4904002 9346293 5075670 5672614 10748284 5778358 6491133 12269491
(64.82) (65.15) (64.23) (65.58) (65.87) (64.76) (67.63) (67.76) (66.63) (69.79) (69.58) (68.57)65+ 239571 313059 552630 277722 369244 646966 316190 433542 749732 369307 531724 901031
( 3.85) ( 4.79) ( 4.33) ( 3.97> ( 4.96) ( 4.48) ( 4.07> ( 5.18) ( 4.65) ( 4.31) ( 5.70) ( 5.04)Dep. Ratio y= 48.96 0= 6.75 T= 55.70 y= 47.49 0= 6.92 T= 54.41 y= 43.12 0= 6.98 T= 50.09 y= 38.49 0= 7.34 T= 45.83Sex Ratio 95.25 93.85 ~ 92.70 91.79
----------------------------------------------------------------------------------------------------------------------------------------

LIST OF WORKING PAPER SERIES
1. Education Data Review and Analysis
1.1
1.2
1.3
1.4
1.5
Performance Indicators in Basic Educationby U Saw Win (Institute of Economics).
Performanc~ Indicators in Higher Educationby U Thein Htay (DHE).
Performance Indicators in Technical, Agricultural and Vocational Educationby U Myat Naing (MERB) and U Nyunt Maung (DTAVE).
Quantitative Review of Education Staffby U Tun Hla and U Myint Thein (DBE).
Population Projections (1983-2013) by U Nyan Myint (Institute of Economics).
L. The Quality of Education
2.1
2.2
2.3
2.4
2.5
Teacher Quality by Daw 00 Khin Hla (Institute of Education).
Pedagogy by l1aw Nu Nu Win (Institute of Education).
Curriculum by U Myint Han (MERB).
Student Evaluation by Dr. Khin Saw Naing (Institute of Medicine 2).
Student Characteristics by U Maung Maung Myint (DBE).
3. Education and Employment
3.1
3.2
3.3
3.4
3.5
3.6
Manpower Demand and Employment Patterns in a Changing Economyby Dr. Thet Lwin (Institute of Economics).
A Tracer Study of Recent Graduates: Implications for Education and ManpowerPlanning by U Kyaw Kyaw (Department of Labour).
Linkages between Training Institutions and Employersby U Tun Aye (Ministry of No.1 Industry), Daw Myint Myint Vi (Institute ofEconomics) and U Van Naing (DBE).
Education and Work Performance (A Survey of Employers' Perceptions) by DawHla Myint (Institute of Economics),
Non-Formal Education in Myanmar by Daw Win Win Myint (Institute ofEconomics) and Daw Lai Lai Vu (MERB).
Labour Market Institutions in Myanmar by U Kyaw Kyaw (Department of Labour).
4. Costs and Financing of Education
4.1
4.2
4.3
Management and Administration of the Education Budget by Dr. Khin Ohn Thant(Ministry of Planning and Finance).
Government Expenditure on Education by Oaw Soe Soe Aung (Institute ofEconomics) .
Non-Government Expenditure on Education by U Saw Gibson (Yangon University).
5. Education Infrastructure
5.1
5.2
5.3
5.4
The Construction Sector by U Tet Tun (Ministry of Construction), U Nyi Hla Nge(Yangon Institute of Technology), Oaw Naw Joy Loo (Institute of Medicine 1) andOaw Win Win Maw (Institute of Medicine 1).
A Comprehensive Survey of Education Facilities by U Sein Myint (OBE), U NyiHla Nge (Yangon Institute of Technology), Oaw Win Win Myint (Institute ofEconomics), Oaw Naw Joy Loo (Institute of Medicine 1), U Saw Wynn (OBE) andOaw Win Win Maw (Institute of Medicine 1).
The Provision of Infrastructure by U Nyi Hla Nge (Yangon Institute ofTechnology), U Nyunt Hlaing (Ministry of No.l Industry), U Tet Tun (Ministry ofConstruction) and U Sein Myint (OBE).
Norms and Standards for Education Facilities by U Nyi Hla Nge (Yangon Instituteof Technology), Oaw Win Win Maw (Institute of Medicine 1), and U Tet Tun(Ministry of Construction).
6. Organization and Management of the Education System
6.1
6.2
6.3
Organization and Management of Basic Education by Oaw Hla Kyu (OBE) and UMyint Thein (OBE).
The Cluster System for Primary Schools by U Myint Han (MERB).
Organization and Management of Universities and Colleges by U Saw Gibson(Yangon University) and U Thein Htay (OHE).
7. Special Studies
7.1
7.2
7.3
7.4
Economics and Business Education by Oaw Cho Cho Thein (OBE).
The Teaching of Science and Technology by U Khin Maung Kyi (OBE).
The Teaching of English by Dr. Myo Myint (Yangon University).
Higher Education by U Myo Nyunt (Institute of Education)