
Employment Outlook: 2000-2010 National employment projections State projections .
66
Employment Outlook: 2000-2010 National employment projections http://www.bls.gov/emp State projections http://almis.dws.state.ut.us/ occ/projhome.asp
-
Upload
norman-henry -
Category
Documents
-
view
217 -
download
1
Transcript of Employment Outlook: 2000-2010 National employment projections State projections .

Employment Outlook: 2000-2010
National employment projections
http://www.bls.gov/emp
State projections
http://almis.dws.state.ut.us/occ/projhome.asp

Employment Outlook: 2000-2010
Labor force
• Economic growth
• Industry employment
• Occupational employment
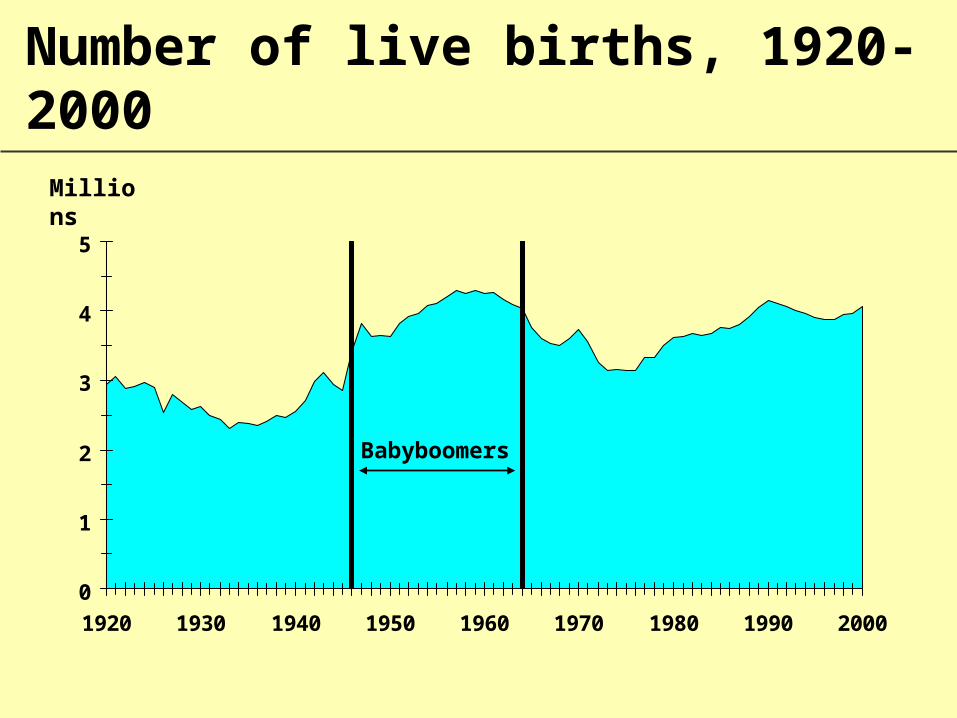
Number of live births, 1920-2000
0
1
2
3
4
5
1920 1930 1940 1950 1960 1970 1980 1990 2000
Babyboomers
Millions
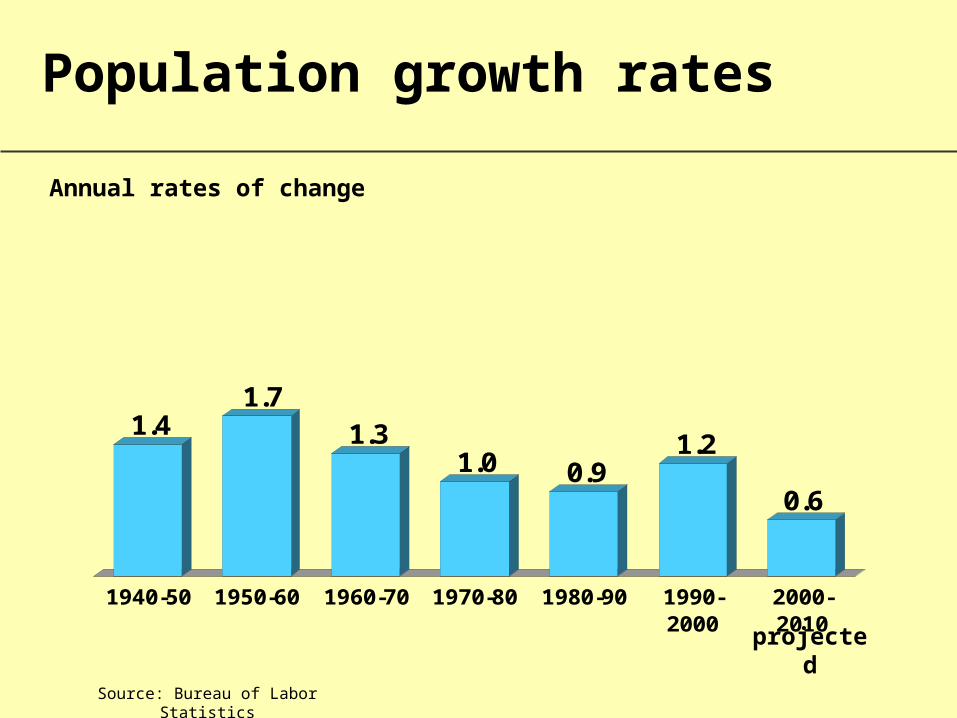
Population growth rates
1.41.7
1.31.0 0.9
1.2
0.6
1940-50 1950-60 1960-70 1970-80 1980-90 1990-2000
2000-2010
Annual rates of change
Source: Bureau of Labor Statistics
projected
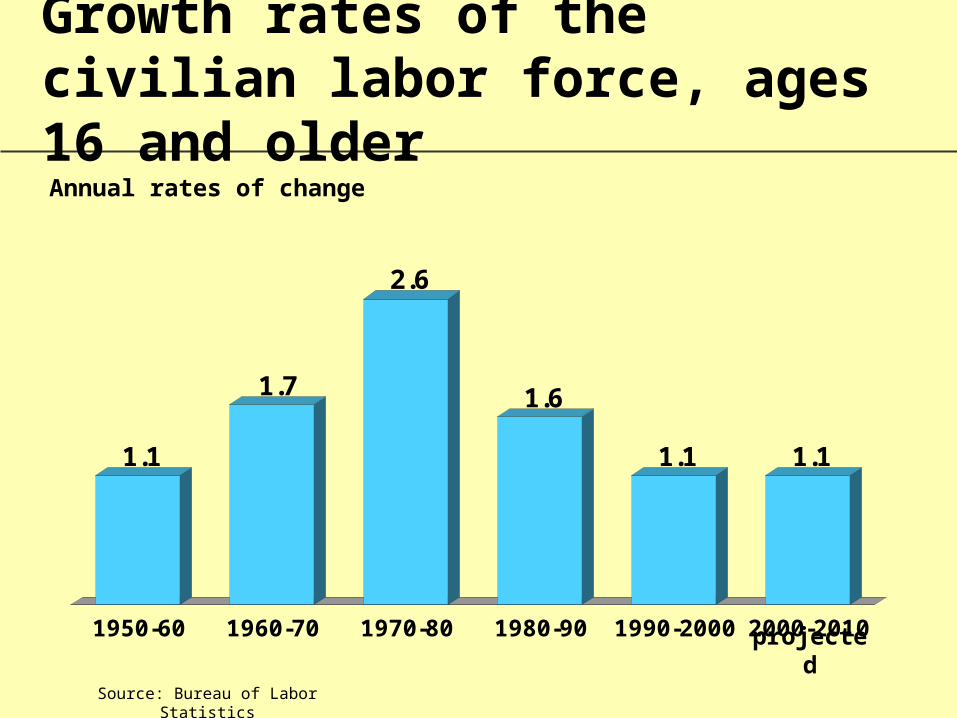
Growth rates of the civilian labor force, ages 16 and older
1.1
1.7
2.6
1.6
1.1 1.1
1950-60 1960-70 1970-80 1980-90 1990-2000 2000-2010
Annual rates of change
Source: Bureau of Labor Statistics
projected
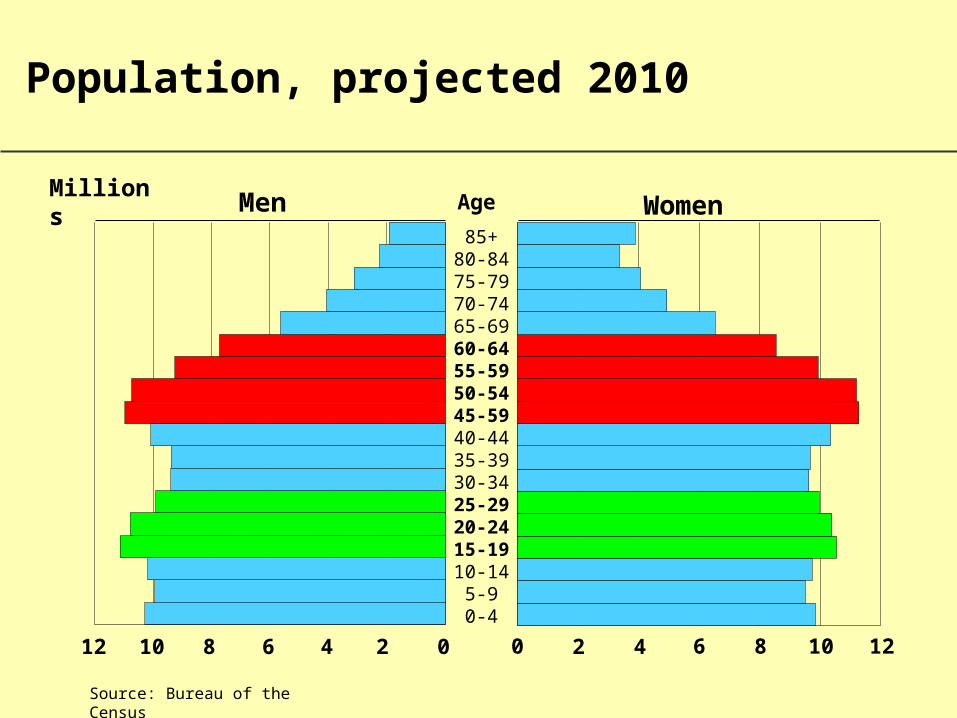
Population, projected 2010
MillionsMen Women
12 121010 868 6 44 22 0 0
85+80-8475-7970-7465-6960-6455-5950-5445-5940-4435-3930-3425-2920-2415-1910-14
5-90-4
Age
Source: Bureau of the Census
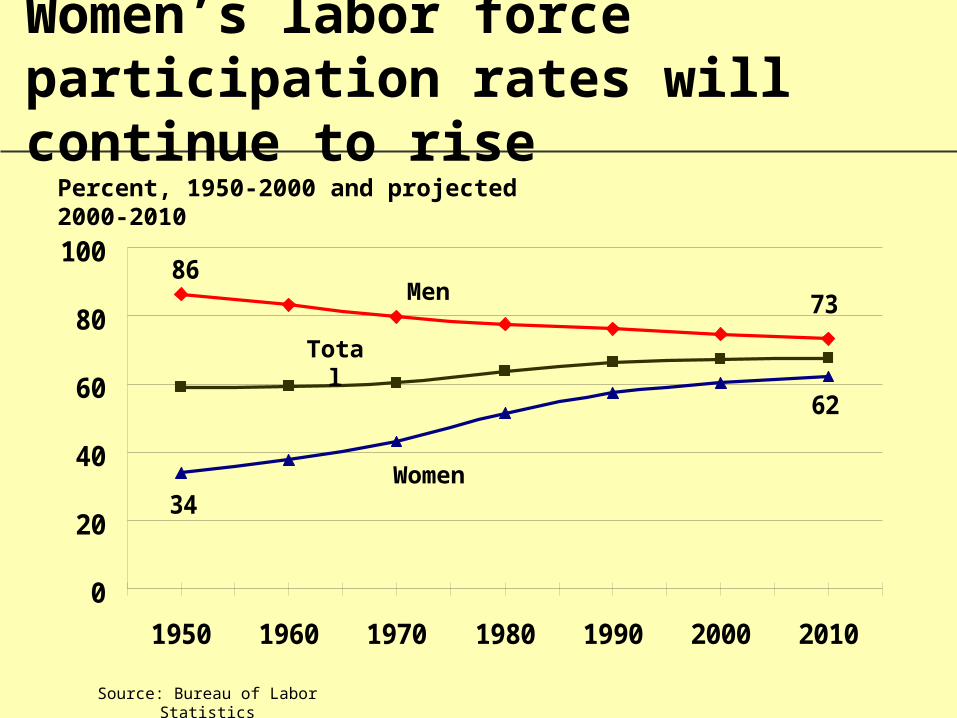
Women’s labor force participation rates will continue to rise
Source: Bureau of Labor Statistics
Percent, 1950-2000 and projected 2000-2010
8673
34
62
0
20
40
60
80
100
1950 1960 1970 1980 1990 2000 2010
Total
Men
Women
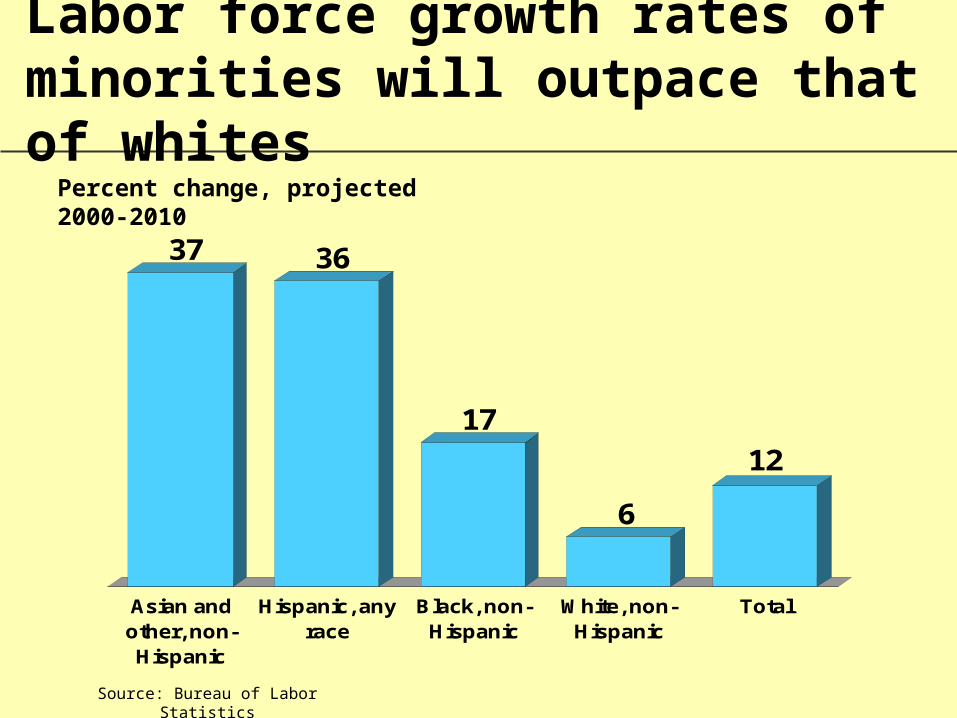
Labor force growth rates of minorities will outpace that of whites
37 36
17
6
12
Asian andother, non-Hispanic
Hispanic, anyrace
Black, non-Hispanic
White, non-Hispanic
Total
Percent change, projected 2000-2010
Source: Bureau of Labor Statistics

Employment Outlook: 2000-2010
• Labor forceEconomic growth
• Industry employment
• Occupational employment

The 2000-2010 projections assume a 3.4 percent real GDP growth rate
Source: Bureau of Labor Statistics
Percent
4.04.4
3.23.0
3.4 3.4
1949-59 1959-69 1969-79 1979-89 1989-2000 2000-2010projected
Source: Bureau of Labor Statistics
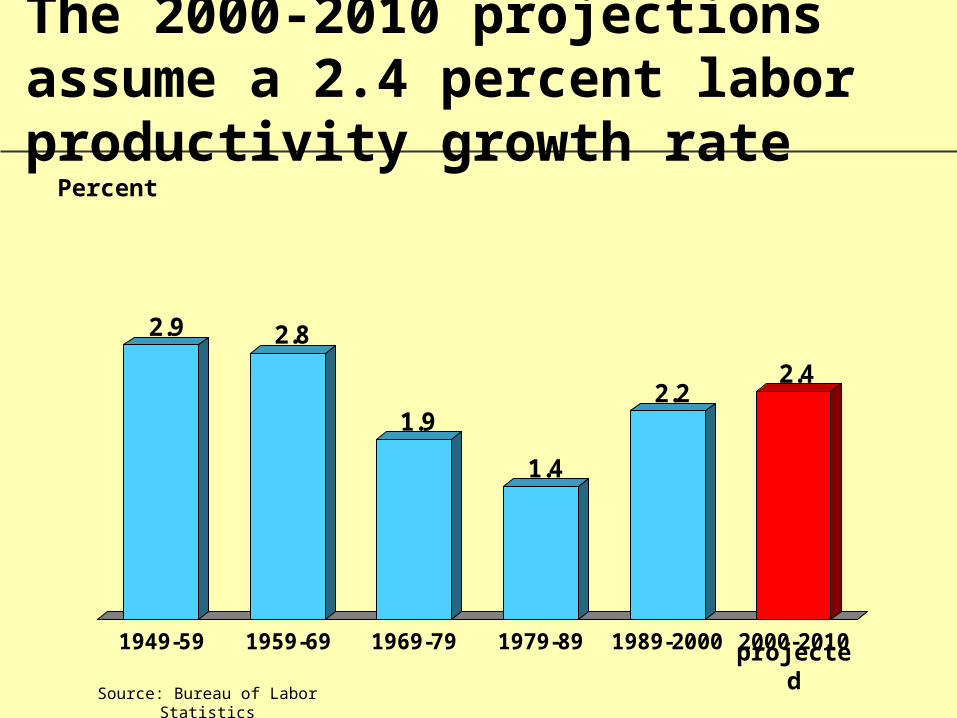
Percent
2.9 2.8
1.9
1.4
2.22.4
1949-59 1959-69 1969-79 1979-89 1989-2000 2000-2010
The 2000-2010 projections assume a 2.4 percent labor productivity growth rate
projected
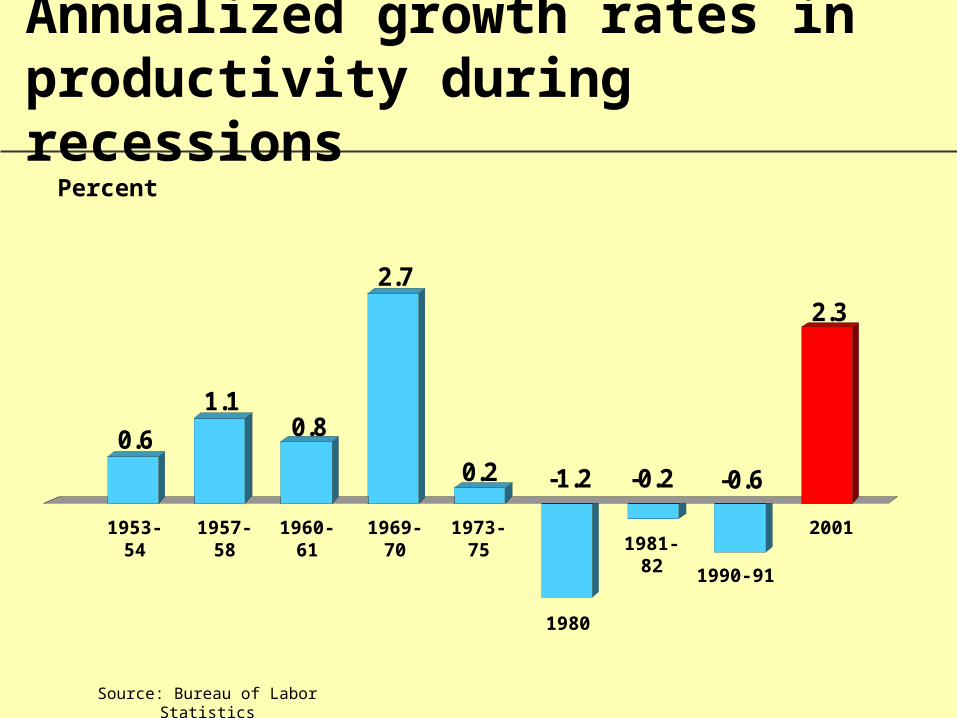
Annualized growth rates in productivity during recessions
Source: Bureau of Labor Statistics
Percent
0.6
1.10.8
2.7
0.2 -1.2 -0.2 -0.6
2.3
1953-54 1957-58 1960-61 1969-70 1973-75
1980
1981-82
1990-91
2001
Source: Bureau of Labor Statistics
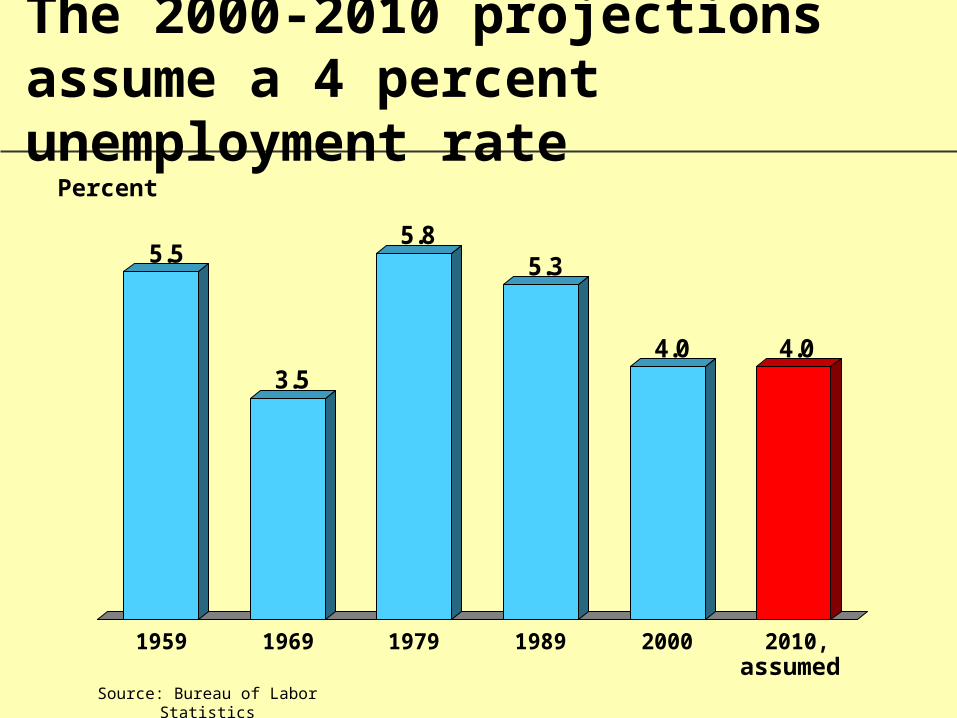
Percent
5.5
3.5
5.85.3
4.0 4.0
1959 1969 1979 1989 2000 2010,
The 2000-2010 projections assume a 4 percent unemployment rate
assumed
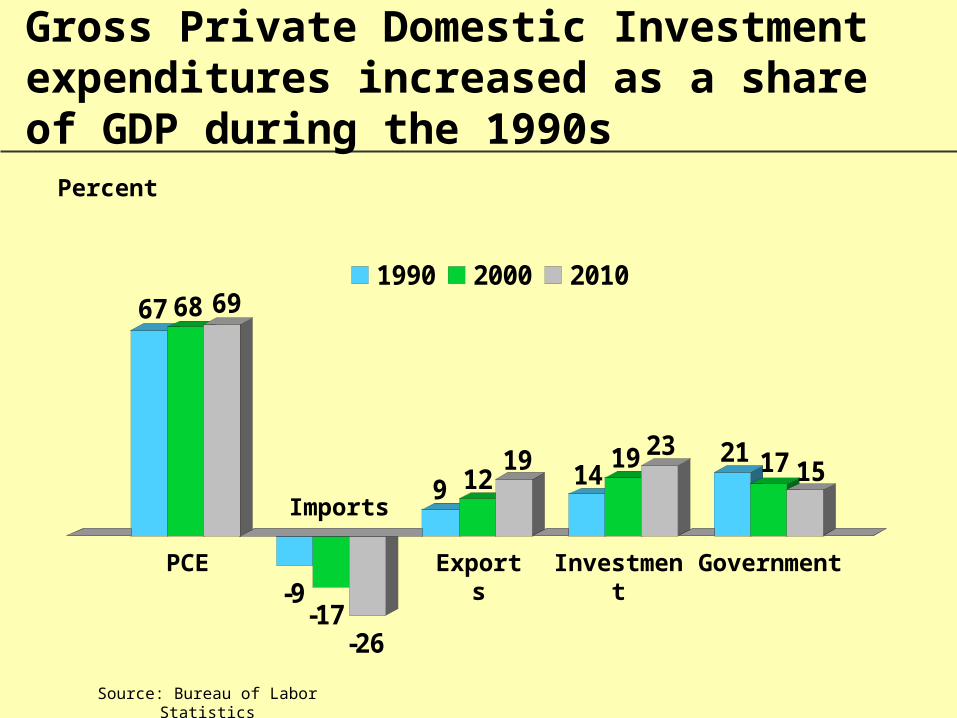
67 68 69
-9-17
-26
9 1219 14
19 23 21 17 15
1990 2000 2010
Gross Private Domestic Investment expenditures increased as a share of GDP during the 1990s
PCE
Imports
Exports Investment Government
Source: Bureau of Labor Statistics
Percent
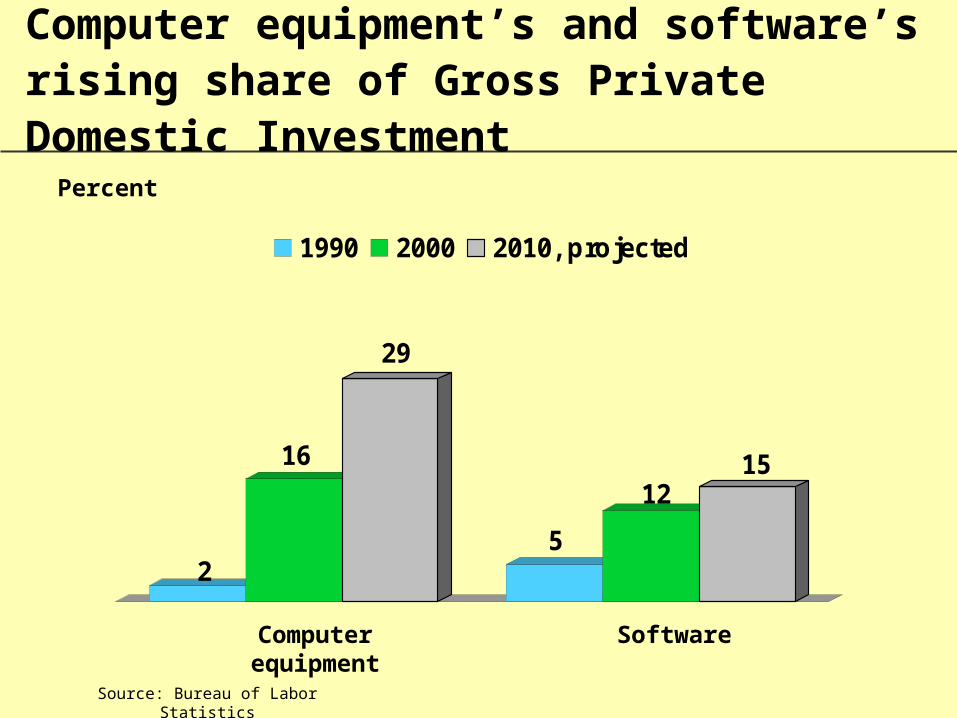
2
16
29
5
1215
1990 2000 2010, projected
Computer equipment’s and software’s rising share of Gross Private Domestic Investment
Computer equipment Software
Source: Bureau of Labor Statistics
Percent

Employment Outlook: 2000-2010
• Labor force
• Economic growthIndustry employment
• Occupational employment
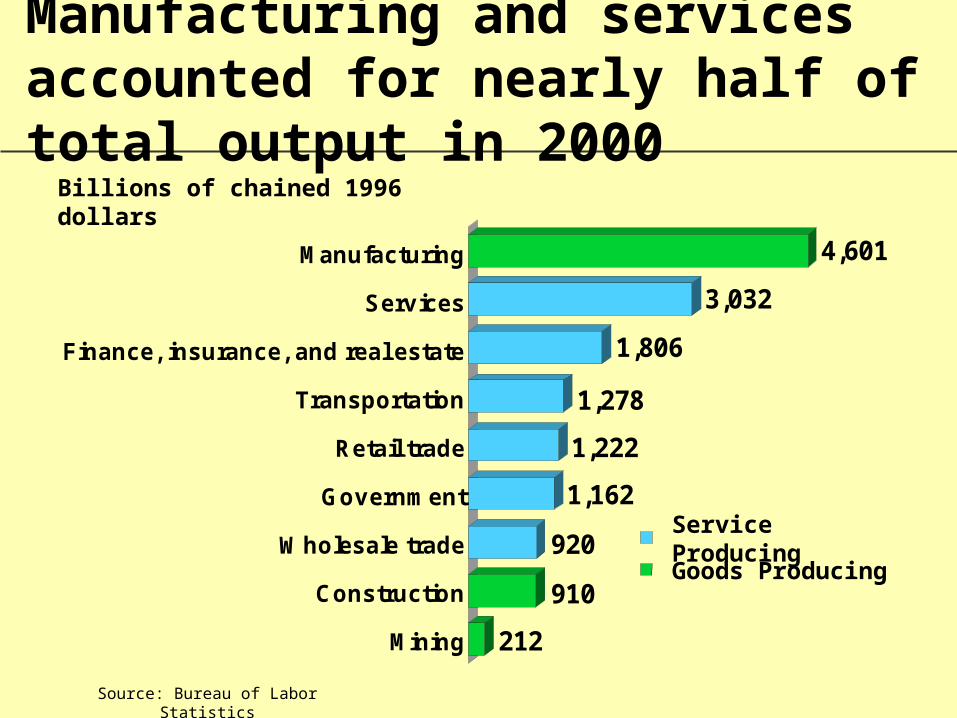
Source: Bureau of Labor Statistics
212
910
920
1,162
1,222
1,278
1,806
3,032
4,601
Mining
Construction
Wholesale trade
Government
Retail trade
Transportation
Finance, insurance, and real estate
Services
Manufacturing
Manufacturing and services accounted for nearly half of total output in 2000
Billions of chained 1996 dollars
Service ProducingGoods Producing
Source: Bureau of Labor Statistics
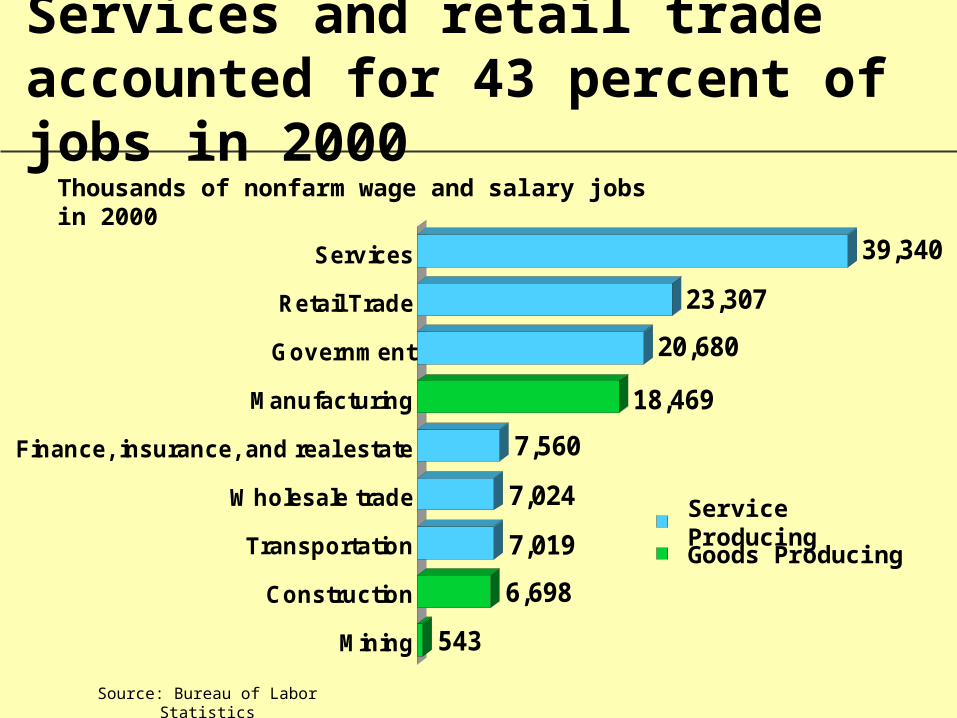
543
6,698
7,019
7,024
7,560
18,469
20,680
23,307
39,340
Mining
Construction
Transportation
Wholesale trade
Finance, insurance, and real estate
Manufacturing
Government
Retail Trade
Services
Service ProducingGoods Producing
Services and retail trade accounted for 43 percent of jobs in 2000
Thousands of nonfarm wage and salary jobs in 2000
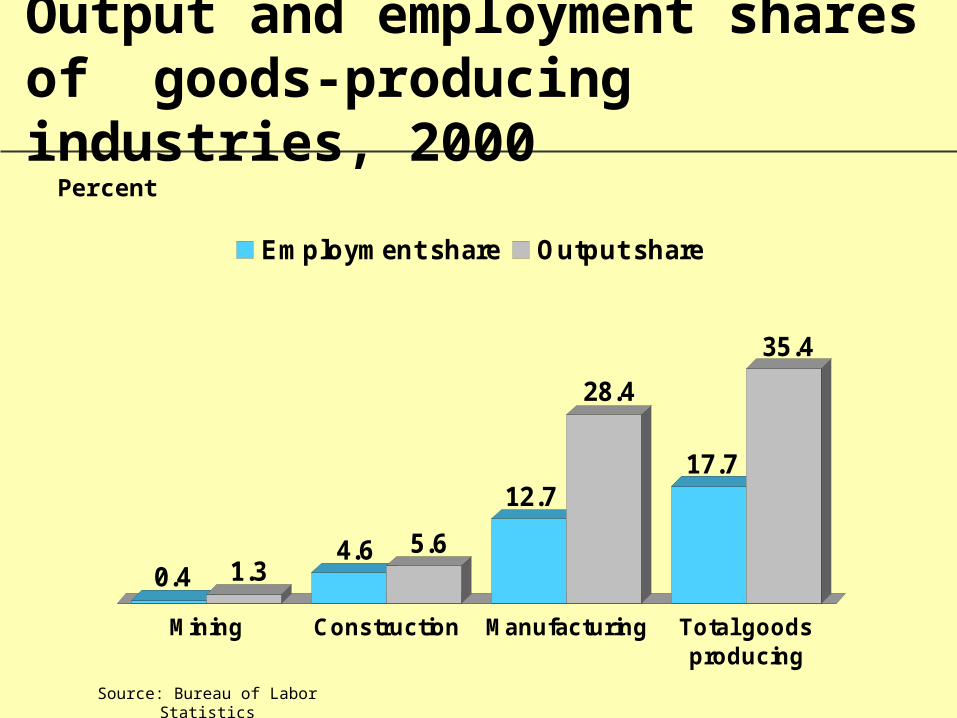
Output and employment shares of goods-producing industries, 2000
0.4 1.34.6 5.6
12.7
28.4
17.7
35.4
Mining Construction Manufacturing Total goodsproducing
Employment share Output share
Percent
Source: Bureau of Labor Statistics
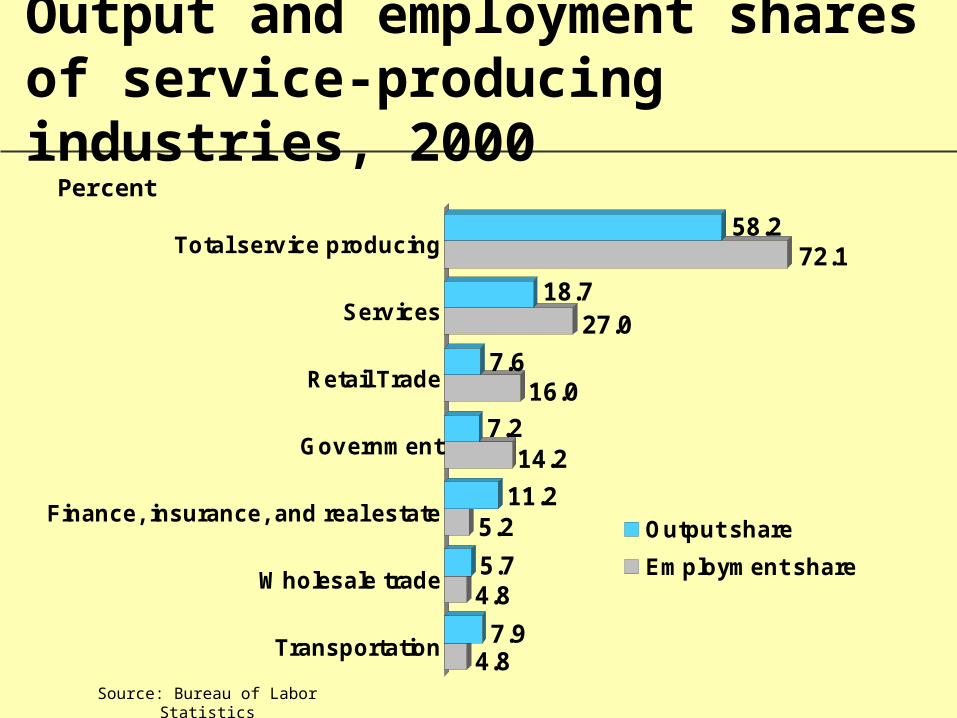
Output and employment shares of service-producing industries, 2000
4.87.9
4.85.7
5.211.2
14.27.2
16.07.6
27.018.7
72.158.2
Transportation
Wholesale trade
Finance, insurance, and real estate
Government
Retail Trade
Services
Total service producing
Output share
Employment share
Source: Bureau of Labor Statistics
Percent
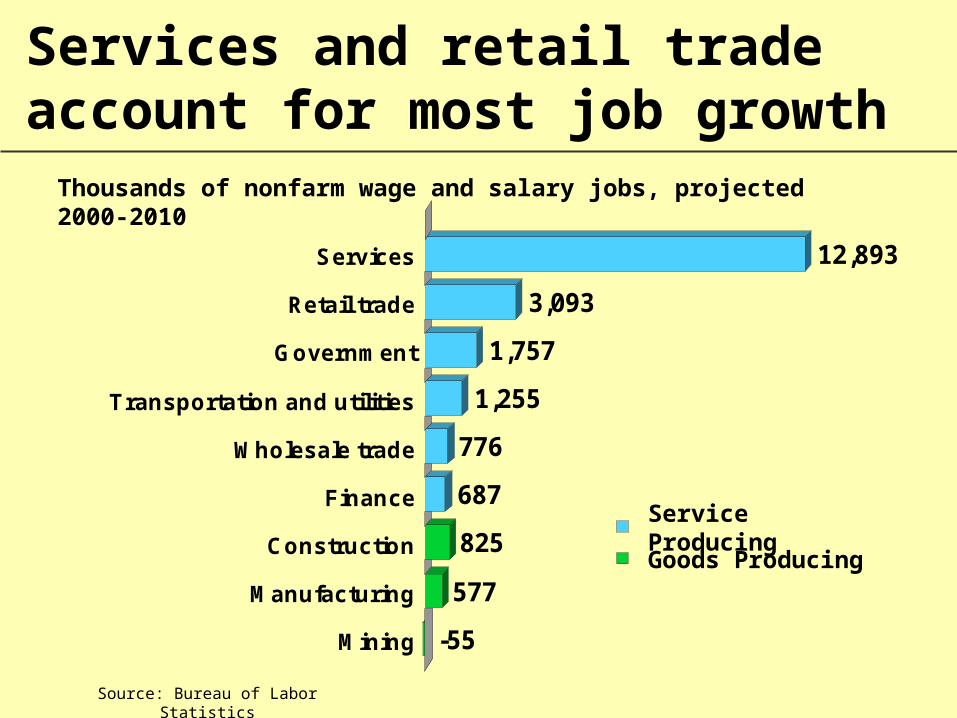
-55
577
825
687
776
1,255
1,757
3,093
12,893
Mining
Manufacturing
Construction
Finance
Wholesale trade
Transportation and utilities
Government
Retail trade
Services
Services and retail trade account for most job growth
Source: Bureau of Labor Statistics
Thousands of nonfarm wage and salary jobs, projected 2000-2010
Service ProducingGoods Producing
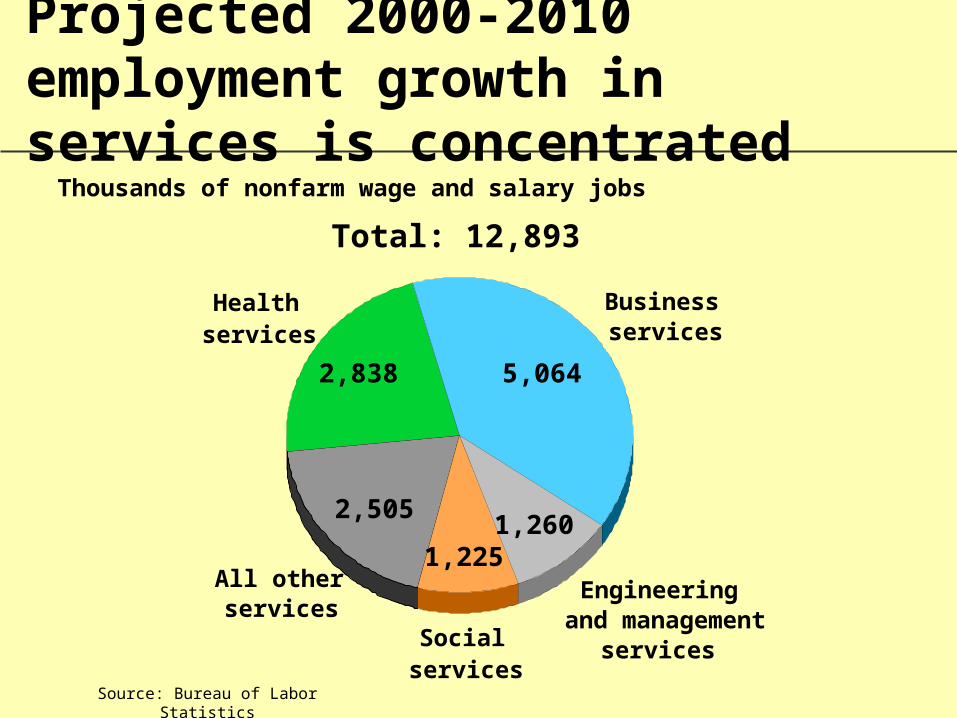
Projected 2000-2010 employment growth in services is concentrated
Source: Bureau of Labor Statistics
Thousands of nonfarm wage and salary jobs
Engineering and management
services
Total: 12,893
Social services
All other services
Health services
Business services
5,064
1,2601,225
2,505
2,838

Employment Outlook: 2000-2010
• Labor force
• Economic growth
• Industry employmentOccupational employment
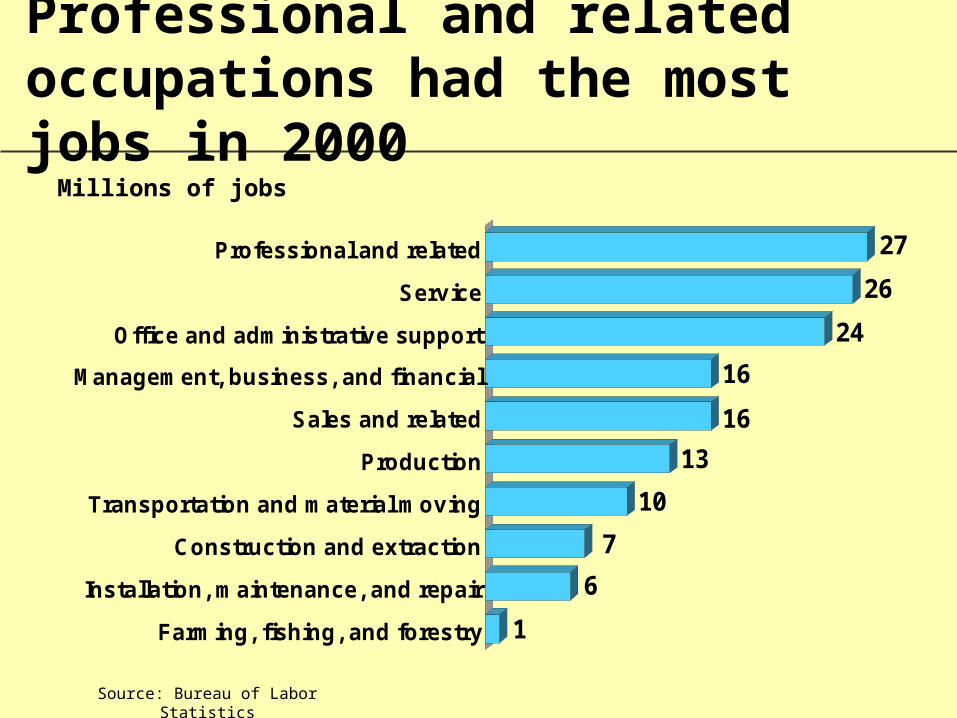
Professional and related occupations had the most jobs in 2000
Source: Bureau of Labor Statistics
Millions of jobs
1
6
7
10
13
16
16
24
26
27
Farming, fishing, and forestry
Installation, maintenance, and repair
Construction and extraction
Transportation and material moving
Production
Sales and related
Management, business, and financial
Office and administrative support
Service
Professional and related
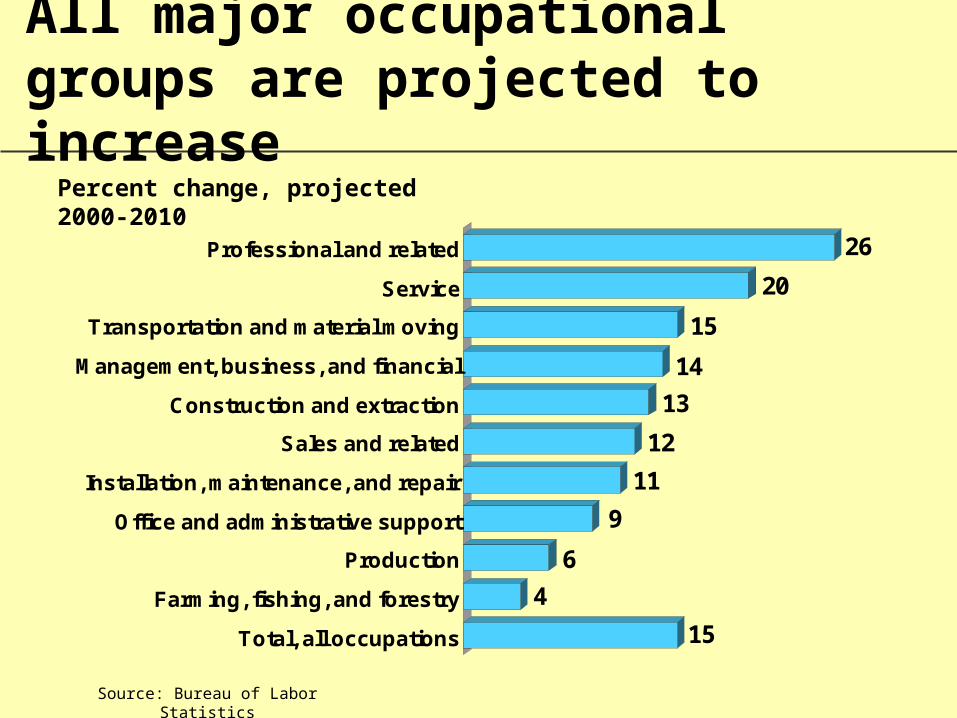
All major occupational groups are projected to increase
15
4
6
9
11
12
13
14
15
20
26
Total, all occupations
Farming, fishing, and forestry
Production
Office and administrative support
Installation, maintenance, and repair
Sales and related
Construction and extraction
Management, business, and financial
Transportation and material moving
Service
Professional and related
Percent change, projected 2000-2010
Source: Bureau of Labor Statistics
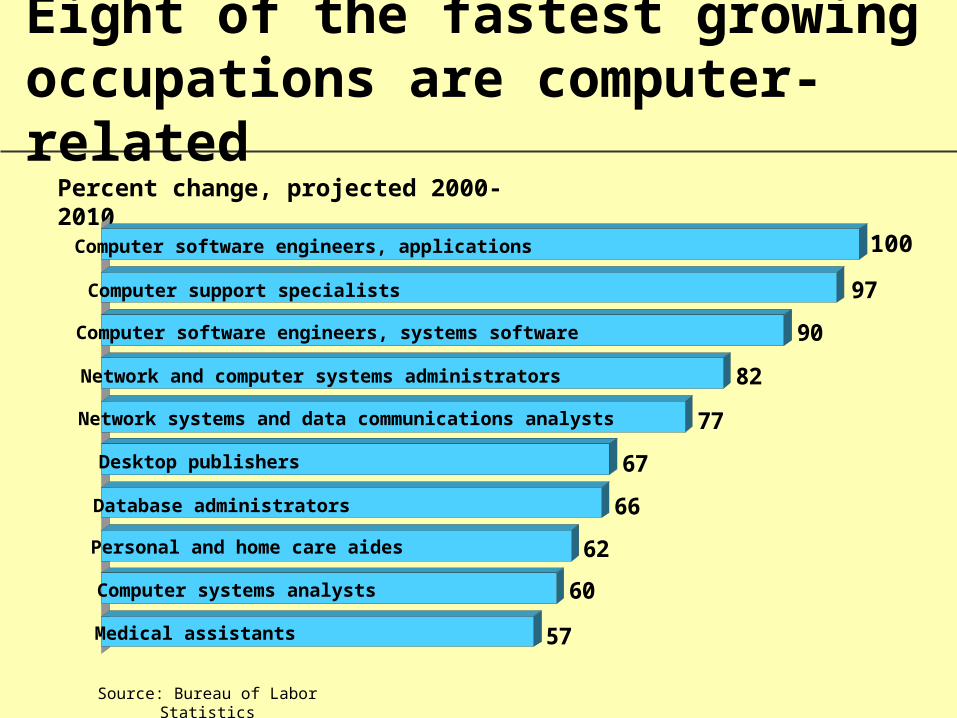
Eight of the fastest growing occupations are computer-related
Source: Bureau of Labor Statistics
Percent change, projected 2000-2010
57
60
62
66
67
77
82
90
97
Computer software engineers, applications
Computer support specialists
Computer software engineers, systems software
Network and computer systems administrators
Network systems and data communications analysts
Desktop publishers
Database administrators
Personal and home care aides
Computer systems analysts
Medical assistants
100
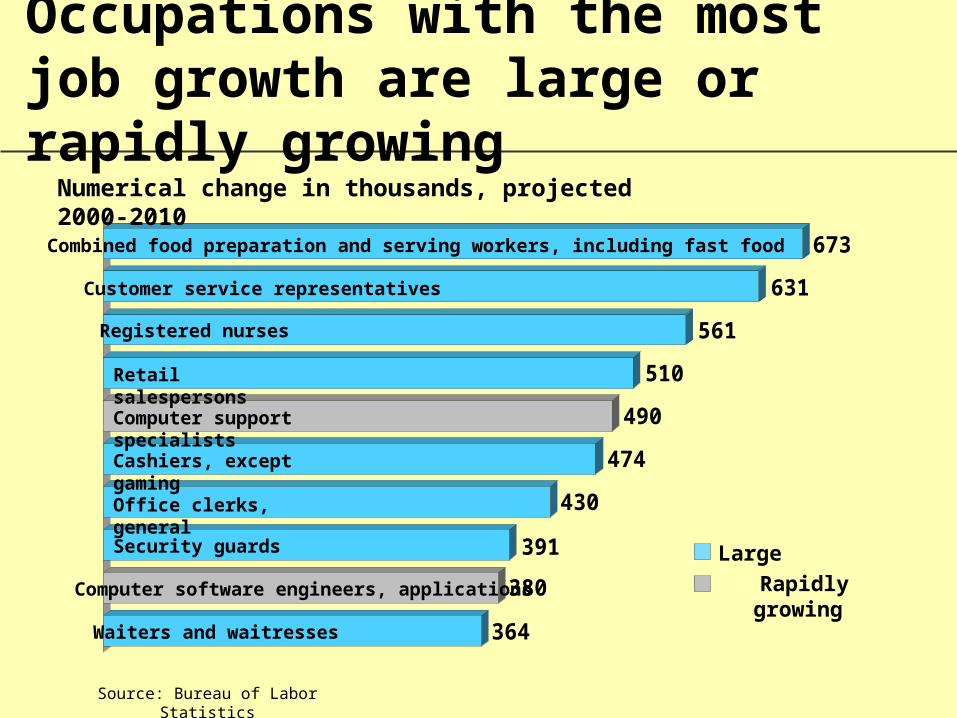
Occupations with the most job growth are large or rapidly growing
364
380
391
430
474
490
510
561
631
673Combined food preparation and serving workers, including fast food
Security guards
Computer software engineers, applications
Customer service representatives
Registered nurses
Retail salespersons
Computer support specialists
Cashiers, except gaming
Office clerks, general
Waiters and waitresses
Source: Bureau of Labor Statistics
Numerical change in thousands, projected 2000-2010
Large
Rapidly growing

A focus on IT workers and high-tech industries
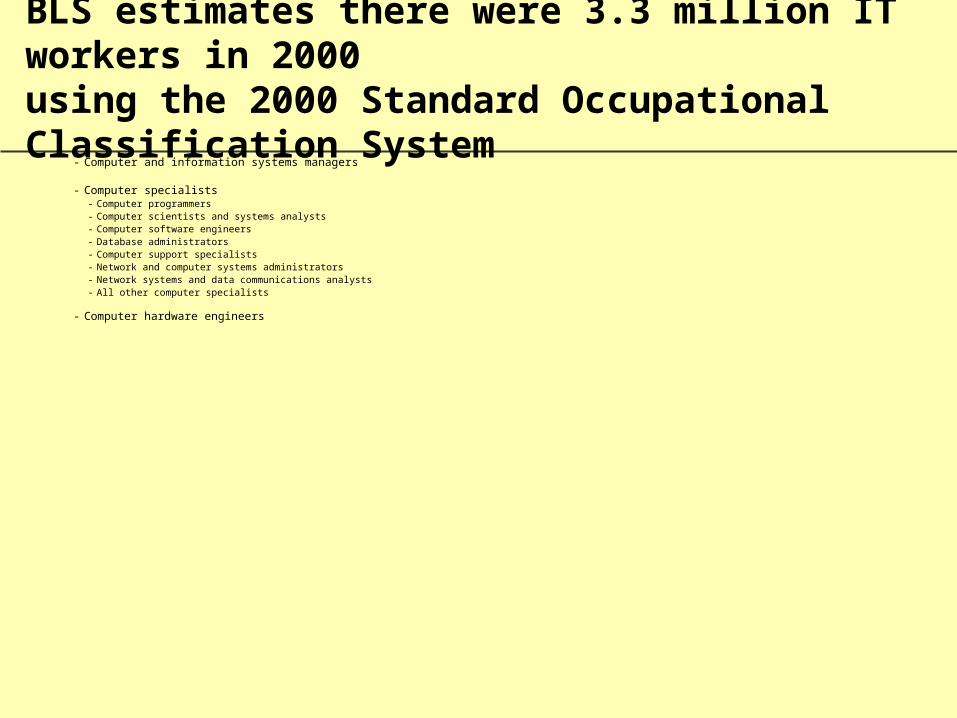
BLS estimates there were 3.3 million IT workers in 2000 using the 2000 Standard Occupational Classification System
- Computer and information systems managers
- Computer specialists- Computer programmers- Computer scientists and systems analysts- Computer software engineers- Database administrators- Computer support specialists- Network and computer systems administrators- Network systems and data communications analysts- All other computer specialists
- Computer hardware engineers
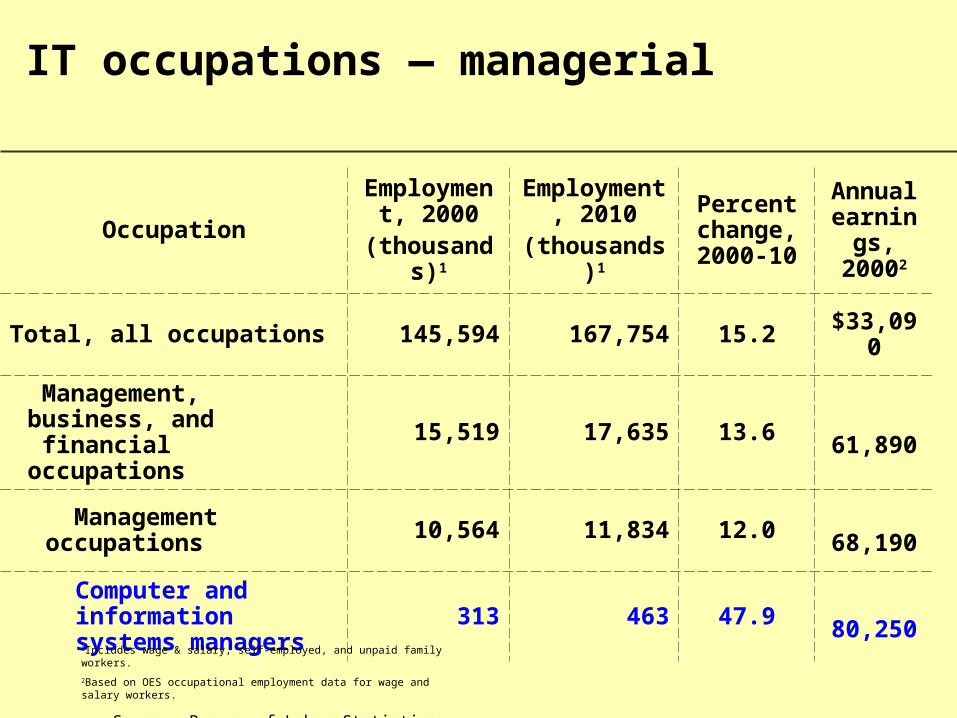
IT occupations — managerial
OccupationEmployment,
2000(thousands)1
Employment, 2010
(thousands)1
Percent change, 2000-10
Annual earnings,
20002
Total, all occupations 145,594 167,754 15.2 $33,090
Management, business, and financial occupations 15,519 17,635 13.6 61,890
Management occupations 10,564 11,834 12.0 68,190
Computer andinformationsystems managers
313 463 47.9 80,250
1Includes wage & salary, self-employed, and unpaid family workers.
2Based on OES occupational employment data for wage and salary workers.
Source: Bureau of Labor Statistics
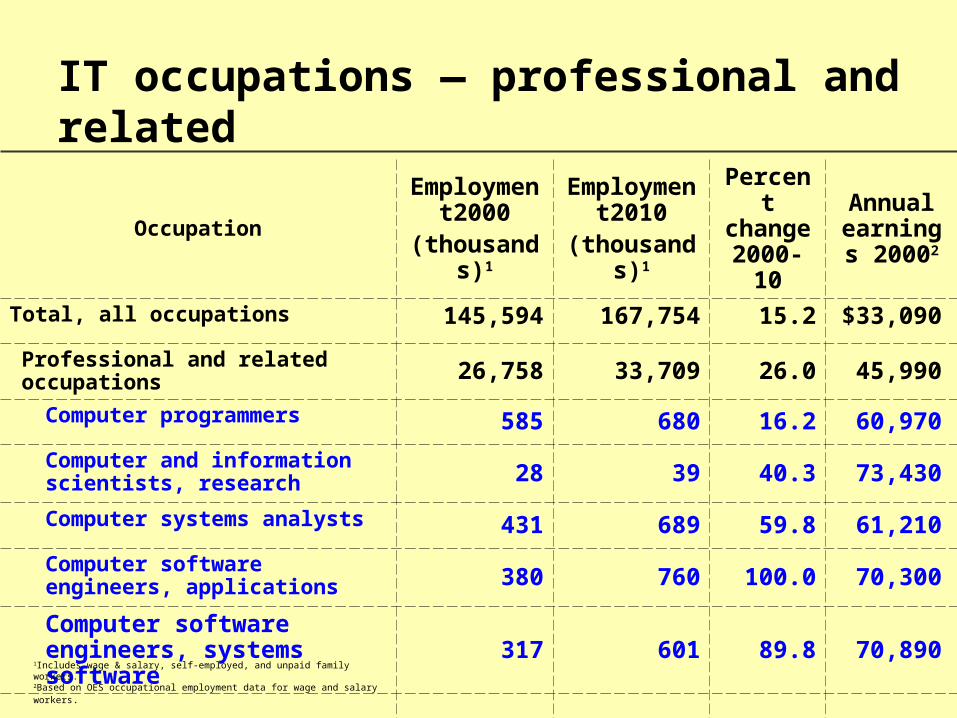
IT occupations — professional and related
OccupationEmployment
2000(thousands)1
Employment2010
(thousands)1
Percent change 2000-10
Annual earnings
20002
Total, all occupations 145,594 167,754 15.2 $33,090
Professional and related occupations 26,758 33,709 26.0 45,990
Computer programmers 585 680 16.2 60,970
Computer and information scientists, research 28 39 40.3 73,430
Computer systems analysts 431 689 59.8 61,210
Computer software engineers, applications 380 760 100.0 70,300
Computer software engineers, systems software 317 601 89.8 70,890
1Includes wage & salary, self-employed, and unpaid family workers.2Based on OES occupational employment data for wage and salary workers.
Source: Bureau of Labor Statistics
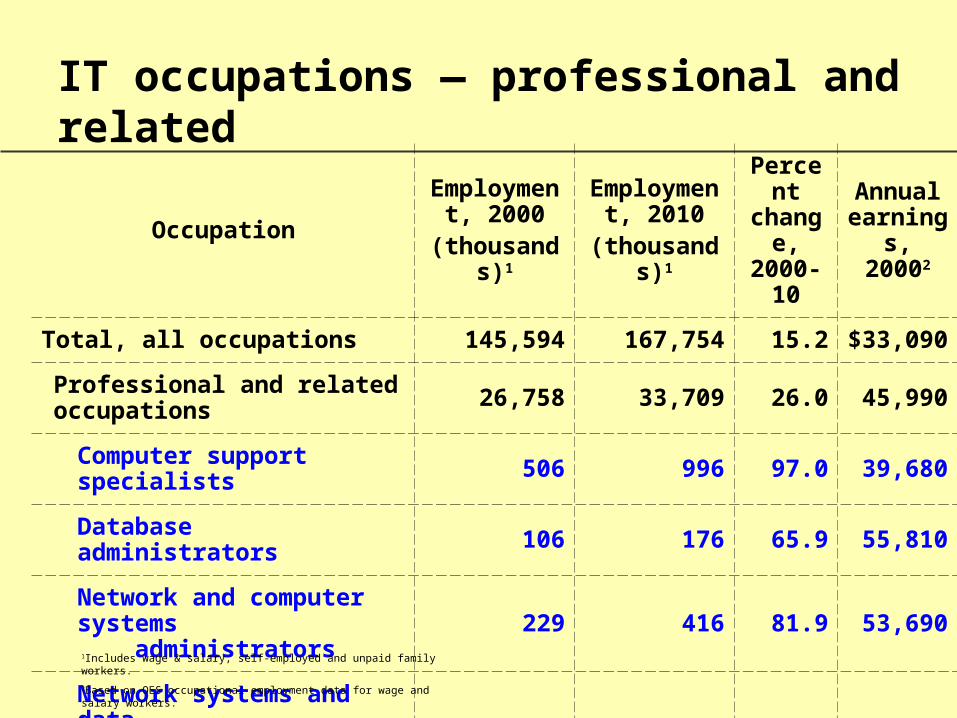
IT occupations — professional and related
OccupationEmployment,
2000(thousands)1
Employment, 2010
(thousands)1
Percent change, 2000-10
Annual earnings,
20002
Total, all occupations 145,594 167,754 15.2 $33,090
Professional and related occupations 26,758 33,709 26.0 45,990
Computer support specialists 506 996 97.0 39,680
Database administrators 106 176 65.9 55,810
Network and computer systems administrators 229 416 81.9 53,690
Network systems and datacommunications analysts 119 211 77.5 57,890
All other computer specialists 203 326 60.7 ─ ─
1Includes wage & salary, self-employed and unpaid family workers.
2Based on OES occupational employment data for wage and salary workers.
Source: Bureau of Labor Statistics
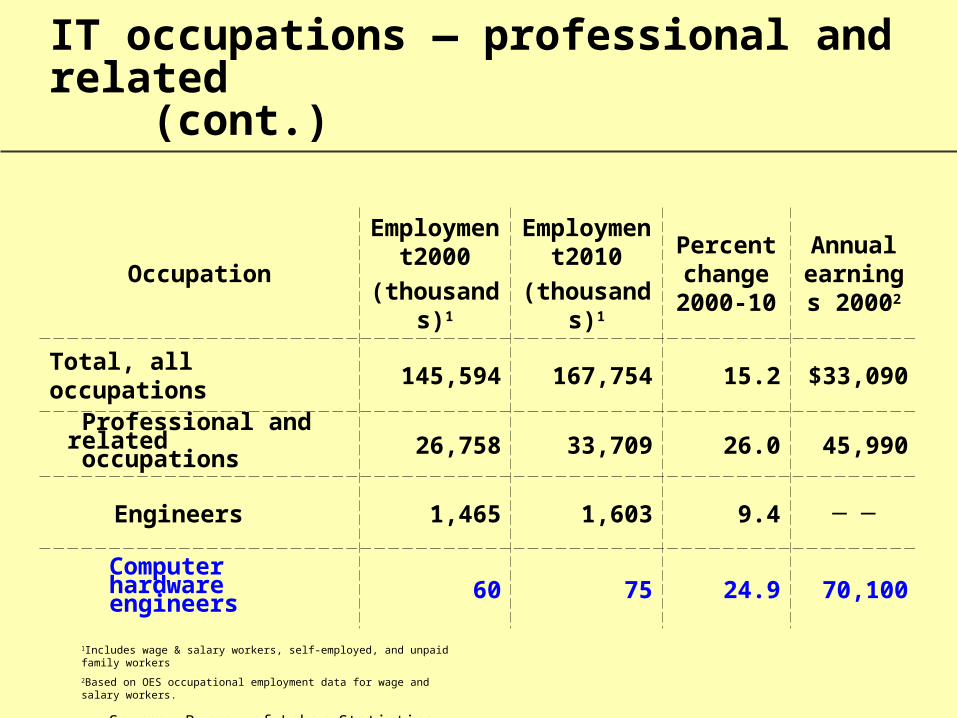
IT occupations — professional and related (cont.)
OccupationEmployment
2000
(thousands)1
Employment2010
(thousands)1
Percent change 2000-10
Annual earnings
20002
Total, all occupations 145,594 167,754 15.2 $33,090
Professional and related occupations 26,758 33,709 26.0 45,990
Engineers 1,465 1,603 9.4 ─ ─
Computer hardware engineers 60 75 24.9 70,100
1Includes wage & salary workers, self-employed, and unpaid family workers
2Based on OES occupational employment data for wage and salary workers.
Source: Bureau of Labor Statistics
IT employment estimates differ substantially across different studies
• Information Technology Association of American (ITAA)
• U.S. Department of Commerce
Economics and Statistics Administration (ESA) Office of Technology Policy (OTP)
• Current Population Survey (CPS)
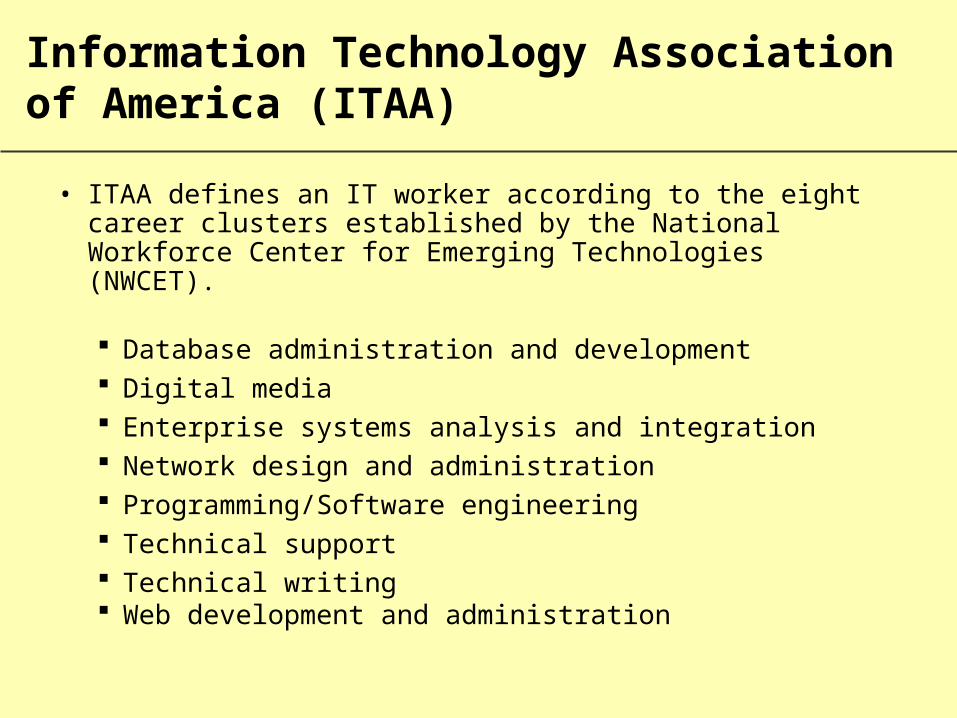
Information Technology Association of America (ITAA)
• ITAA defines an IT worker according to the eight career clusters established by the National Workforce Center for Emerging Technologies (NWCET).
Database administration and development Digital media Enterprise systems analysis and integration Network design and administration Programming/Software engineering Technical support Technical writing Web development and administration
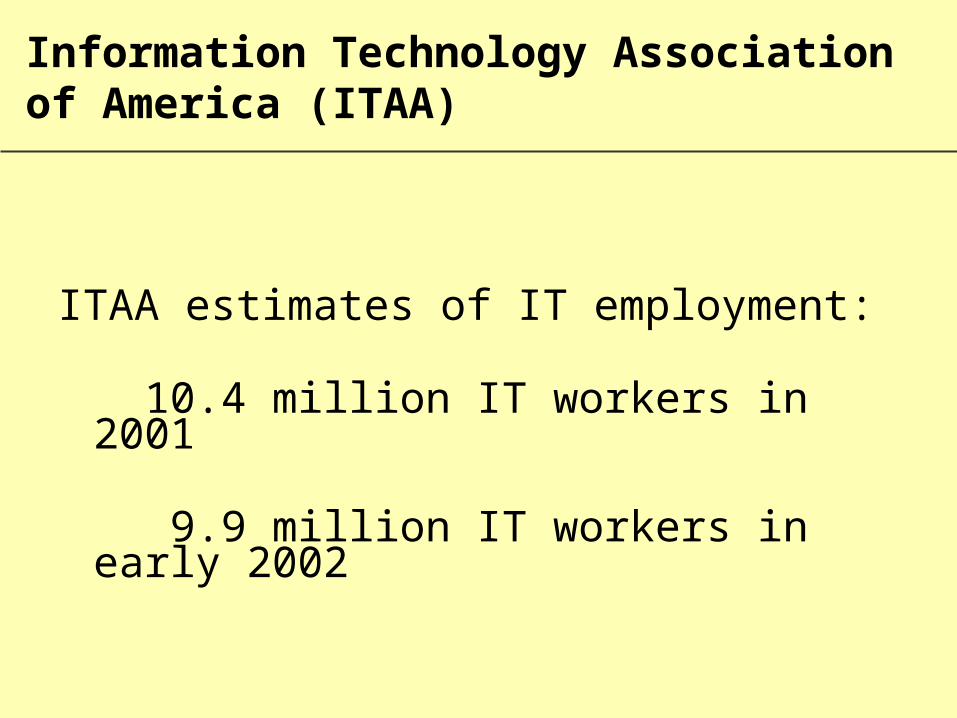
Information Technology Association of America (ITAA)
ITAA estimates of IT employment:
10.4 million IT workers in 2001
9.9 million IT workers in early 2002
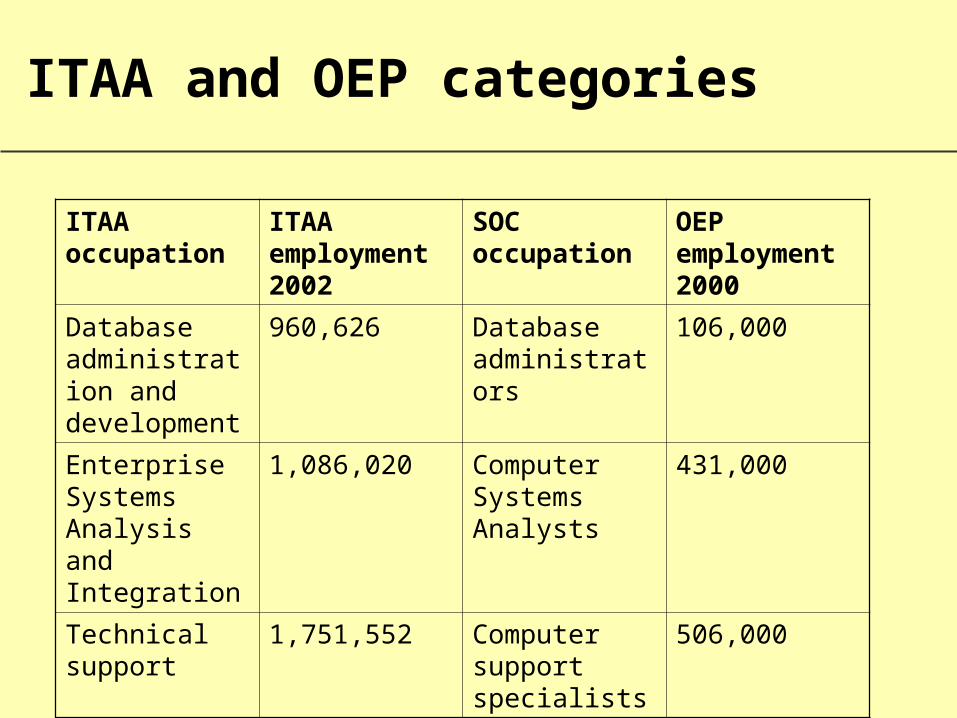
ITAA and OEP categories
ITAA occupation
ITAA employment 2002
SOC occupation
OEP employment 2000
Database administration and development
960,626 Database administrators
106,000
Enterprise Systems Analysis and Integration
1,086,020 Computer Systems Analysts
431,000
Technical support
1,751,552 Computer support specialists
506,000
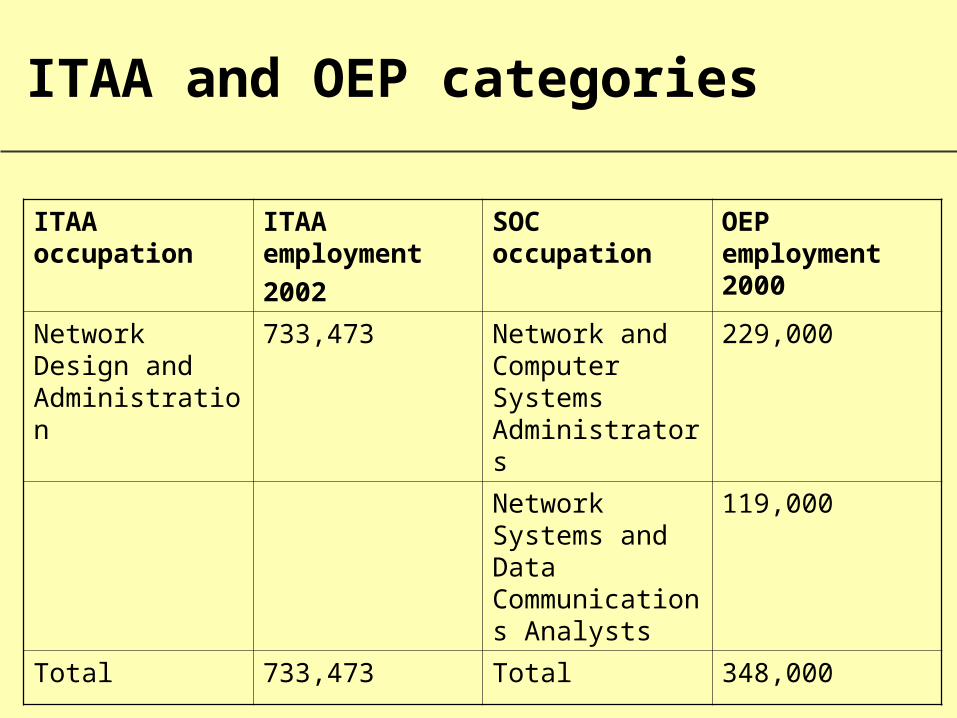
ITAA and OEP categories
ITAA occupation ITAA employment
2002
SOC occupation OEP employment 2000
Network Design and Administration
733,473 Network and Computer Systems Administrators
229,000
Network Systems and Data Communications Analysts
119,000
Total 733,473 Total 348,000
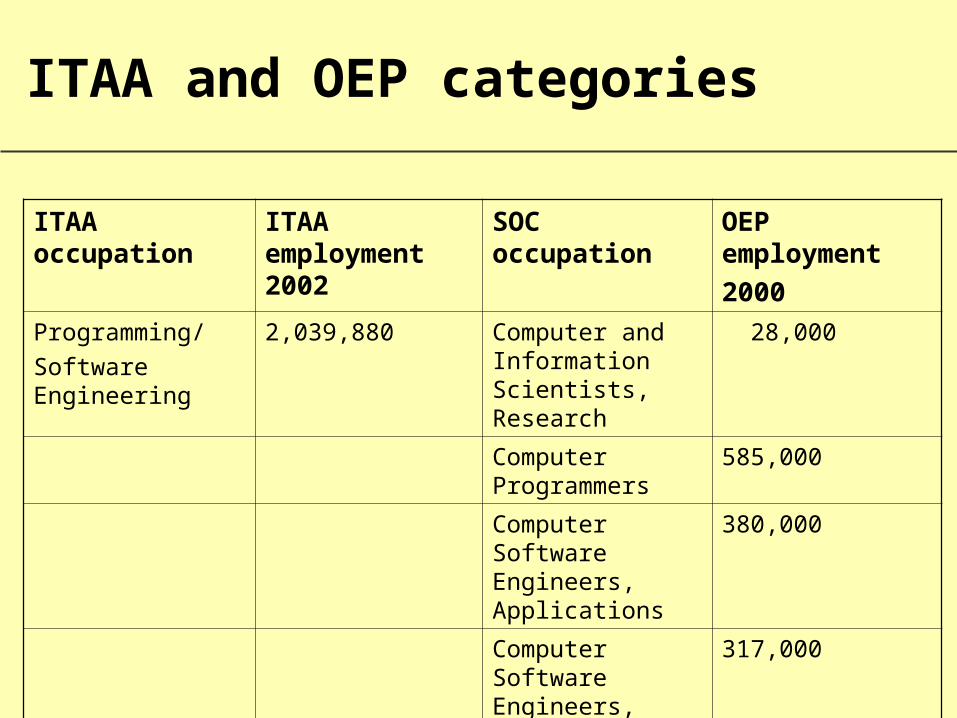
ITAA and OEP categories
ITAA occupation ITAA employment 2002
SOC occupation OEP employment
2000
Programming/
Software Engineering
2,039,880 Computer and Information Scientists, Research
28,000
Computer Programmers
585,000
Computer Software Engineers, Applications
380,000
Computer Software Engineers, Systems Software
317,000
Total 2,039,880 Total 1,310,000
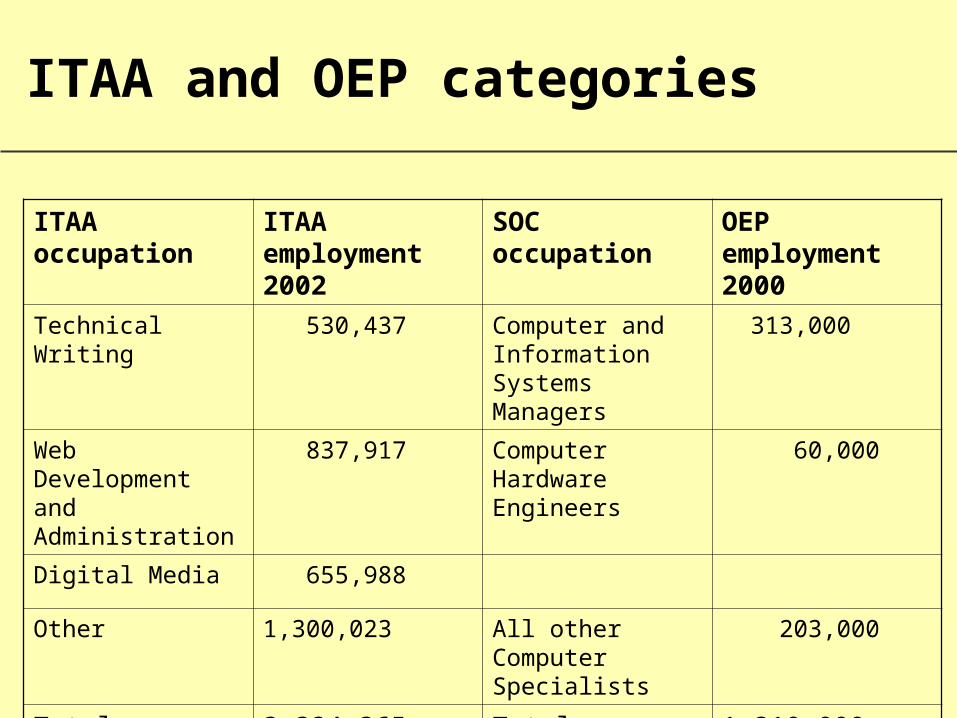
ITAA and OEP categories
ITAA occupation ITAA employment 2002
SOC occupation OEP employment 2000
Technical Writing 530,437 Computer and Information Systems Managers
313,000
Web Development and Administration
837,917 Computer Hardware Engineers
60,000
Digital Media 655,988
Other 1,300,023 All other Computer Specialists
203,000
Total 3,324,365 Total 1,310,000
U.S. Department of Commerce (Economics and Statistics Administration)
• ESA defines IT workers as those who design, manufacture, operate, repair, and maintain the IT infrastructure that facilitates e-commerce and other Internet or network-related activities.
• The ESA divided the IT workforce into two partially overlapping groups—
workers in IT-producing industries workers in IT occupations.
U.S. Department of Commerce (Economics and Statistics Administration)
• Workers in IT-producing industries include all occupations, (i.e. sales, marketing, and financial services), in addition to workers in IT occupations.
• IT-producing industries consist of four major segments: hardware, software and related computer services, communications equipment, and communications services.
U.S. Department of Commerce (Economics and Statistics Administration)
• Workers in IT occupations design, manufacture, operate, maintain, and repair IT products and provide related services across all industries, not just in IT producing industries.
• The Economics and Statistics Administration selected 30 IT-related jobs from Bureau of Labor Statistics/OES job classification.
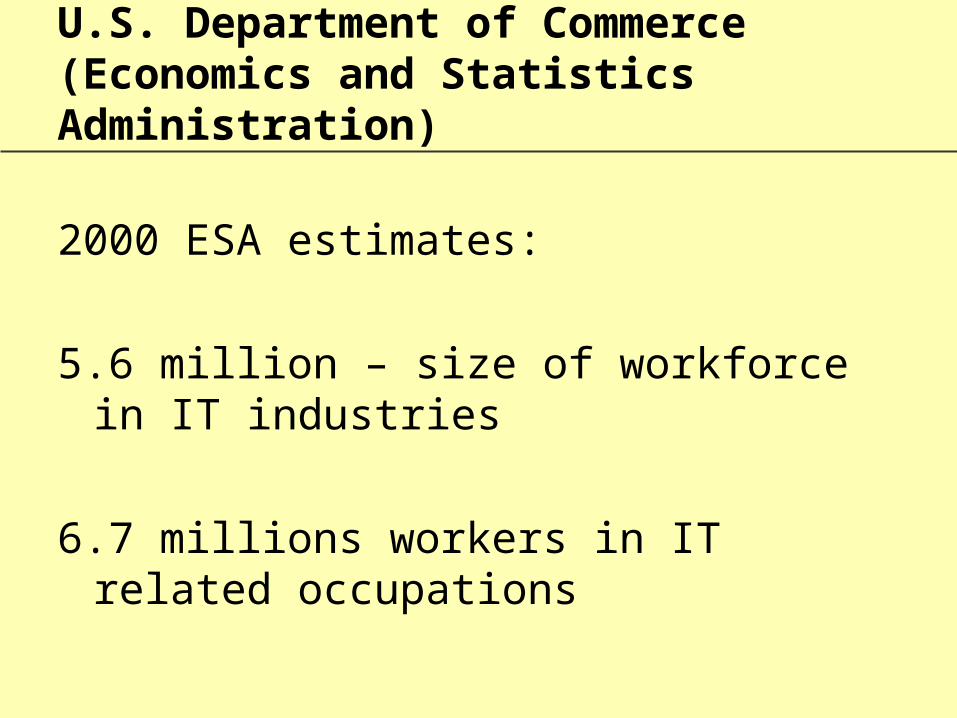
U.S. Department of Commerce (Economics and Statistics Administration)
2000 ESA estimates:
5.6 million – size of workforce in IT industries
6.7 millions workers in IT related occupations
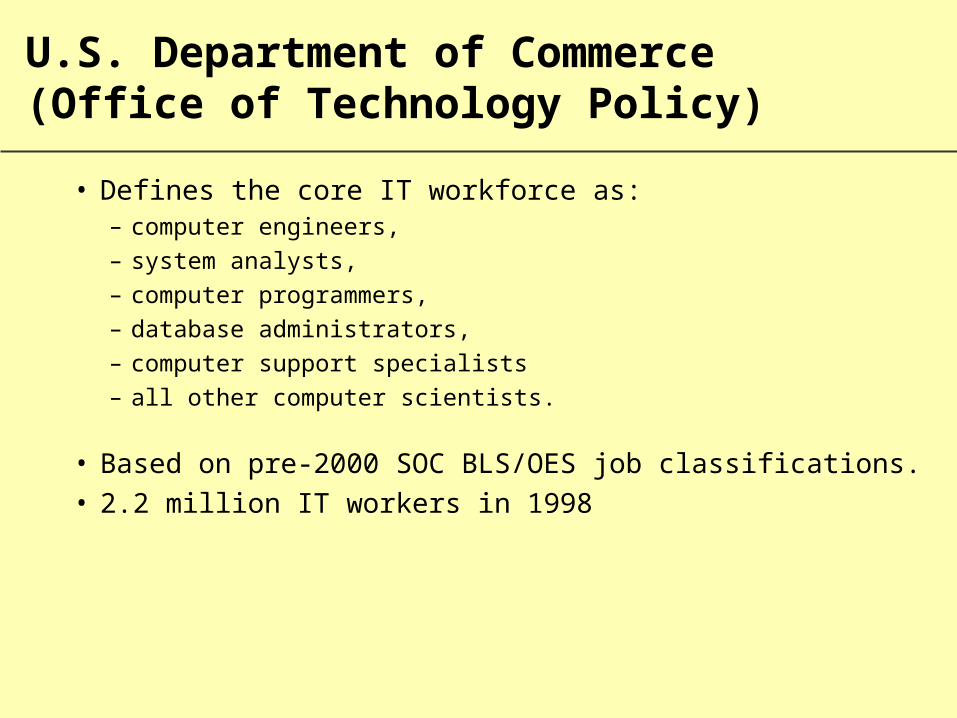
U.S. Department of Commerce (Office of Technology Policy)
• Defines the core IT workforce as:– computer engineers, – system analysts, – computer programmers, – database administrators, – computer support specialists– all other computer scientists.
• Based on pre-2000 SOC BLS/OES job classifications.• 2.2 million IT workers in 1998
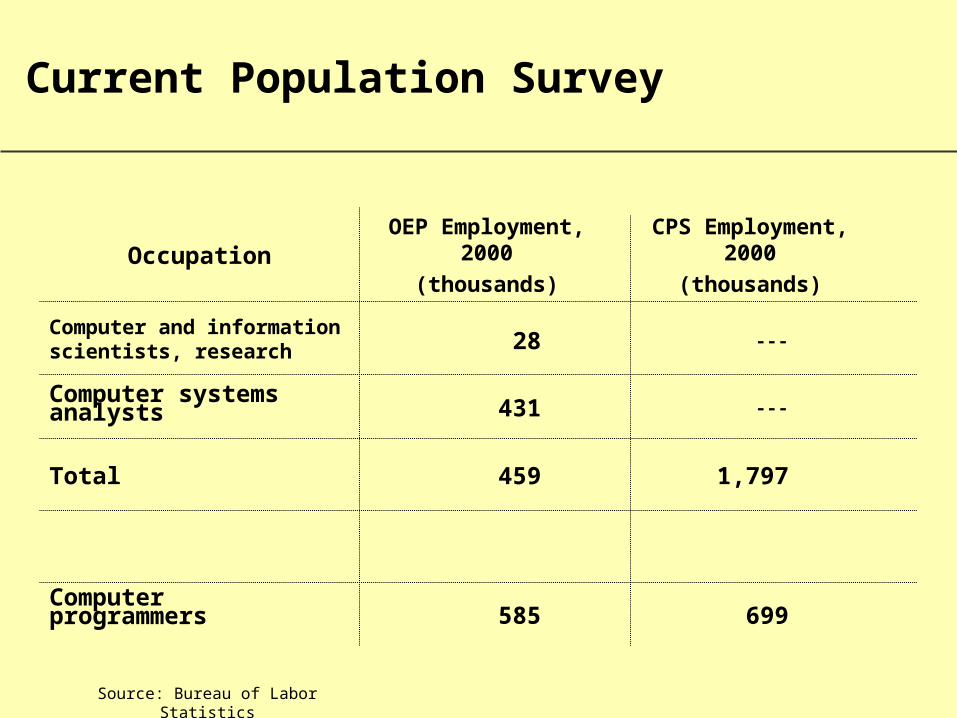
699585Computer programmers
1,797459Total
---431Computer systems analysts
---28Computer and information scientists, research
CPS Employment, 2000
(thousands)
OEP Employment, 2000
(thousands)Occupation
Source: Bureau of Labor Statistics
Current Population Survey
High technology defined
• Industries are considered high tech if employment in R&D and in all technology-oriented occupations accounted for a proportion of employment that was at least twice the average for all industries in the Bureau’s Occupational Employment Statistics survey.
High technology defined (cont.)
• Twenty-nine industries, 25 in manufacturing and 4 in the services division, met both criteria. These industries have at least 6 R&D and 76 total technology-oriented workers per thousand workers.
• A subset of 10 high-tech industries, those with both ratios at least 5 times the average, is referred to as high-tech intensive industries. These industries have at least 15 R&D and 190 total technology-oriented workers per thousand workers.
High technology defined (cont.)
• High tech intensive industries include computers and other electronics-based industries, aerospace, research laboratories, and drug manufacturing.
• Other high-tech industries are machinery and motor vehicle manufacturing, chemicals, engineering services, and management consulting.
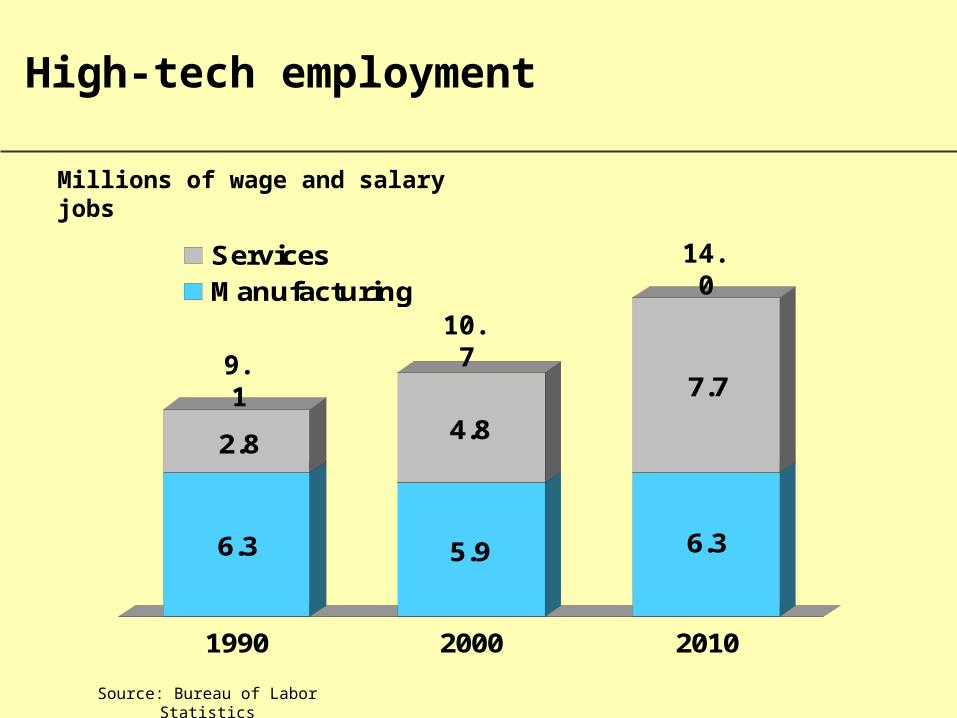
High-tech employment
6.3
2.8
5.9
4.8
6.3
7.7
1990 2000 2010
ServicesManufacturing
Millions of wage and salary jobs
Source: Bureau of Labor Statistics
9.1
10.7
14.0
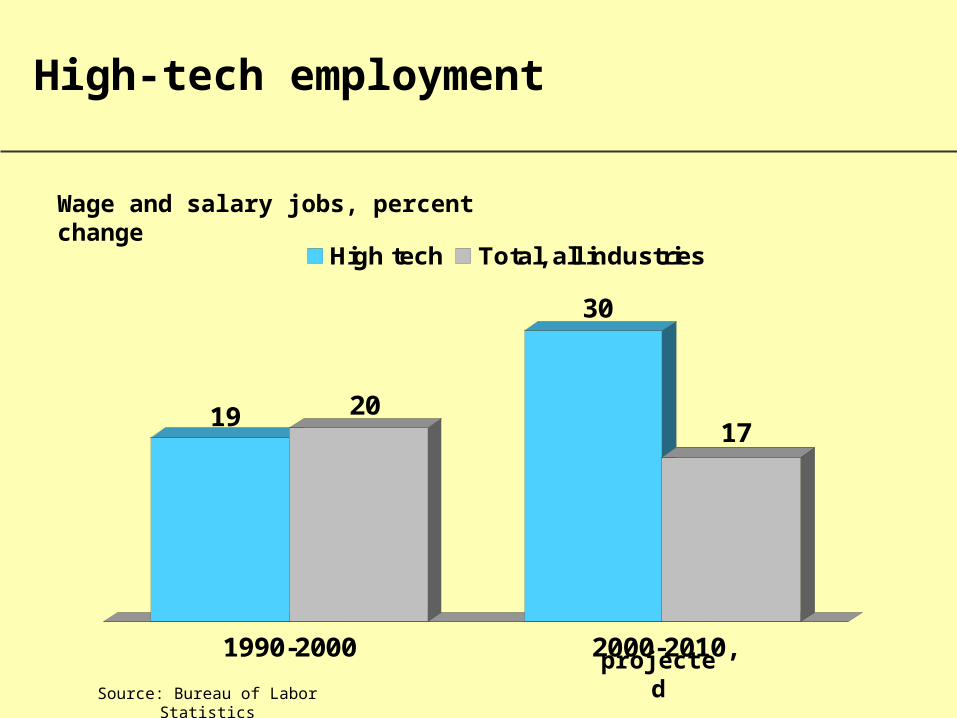
High-tech employment
19 20
30
17
1990-2000 2000-2010,
High tech Total, all industries
Source: Bureau of Labor Statistics
Wage and salary jobs, percent change
projected
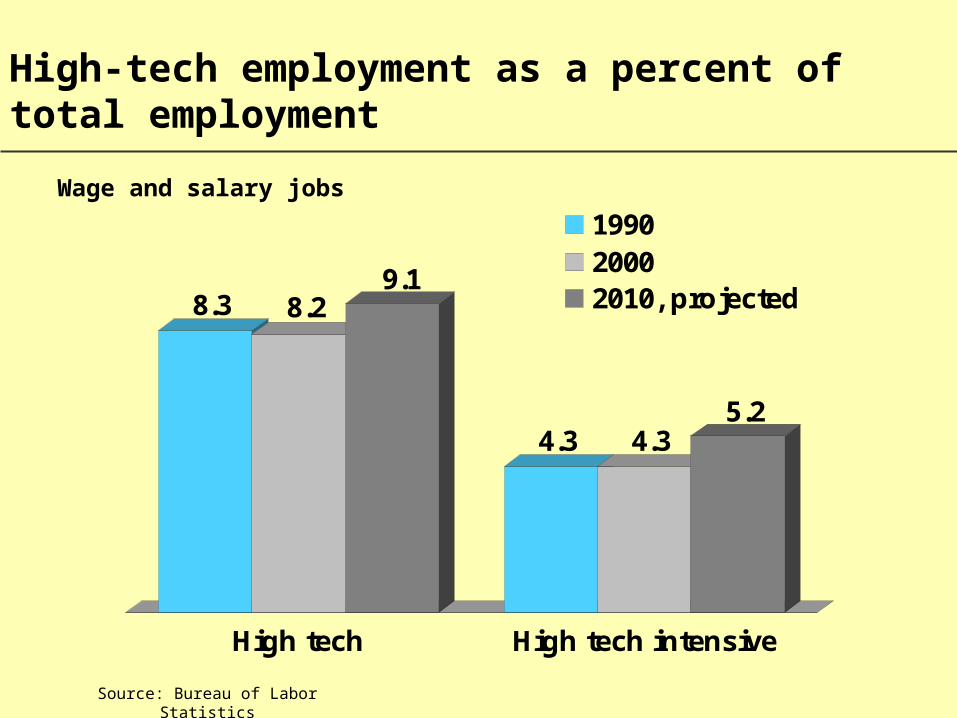
High-tech employment as a percent of total employment
8.3 8.29.1
4.3 4.35.2
High tech High tech intensive
199020002010, projected
Wage and salary jobs
Source: Bureau of Labor Statistics
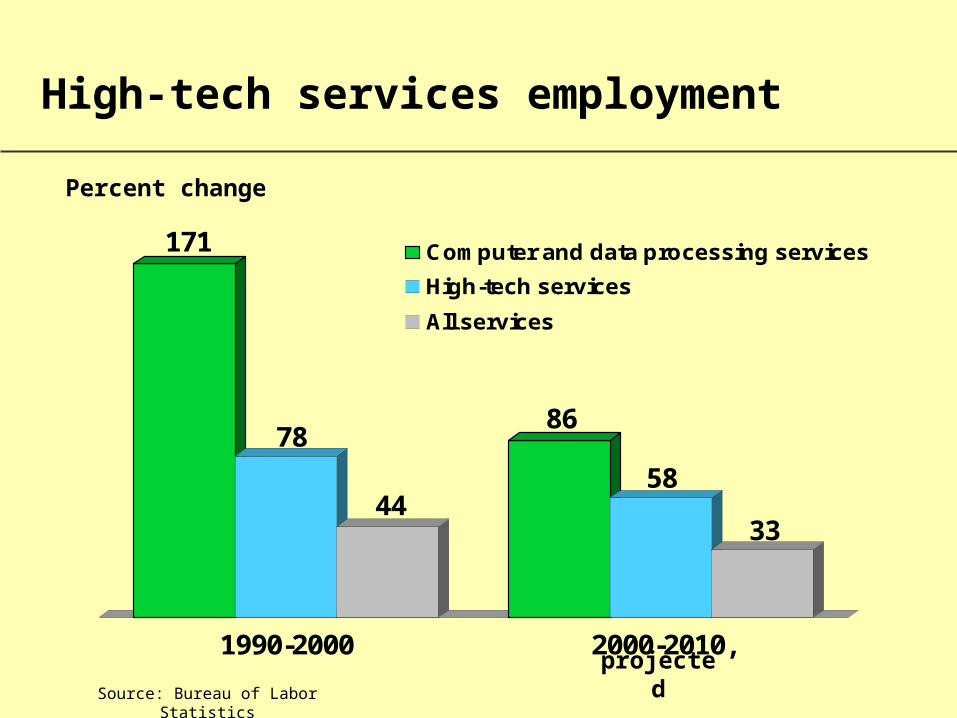
High-tech services employment
171
78
44
86
58
33
1990-2000 2000-2010,
Computer and data processing services
High-tech services
All services
Source: Bureau of Labor Statistics
Percent change
projected
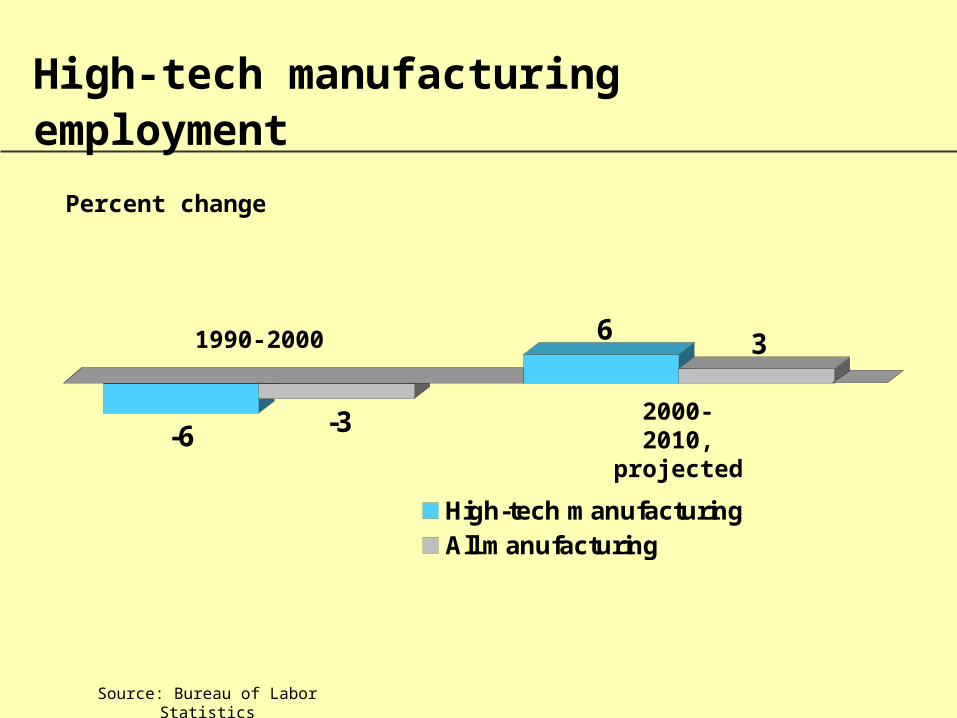
-6 -3
6 3
High-tech manufacturingAll manufacturing
High-tech manufacturing employment
Source: Bureau of Labor Statistics
Percent change
1990-2000
2000-2010, projected
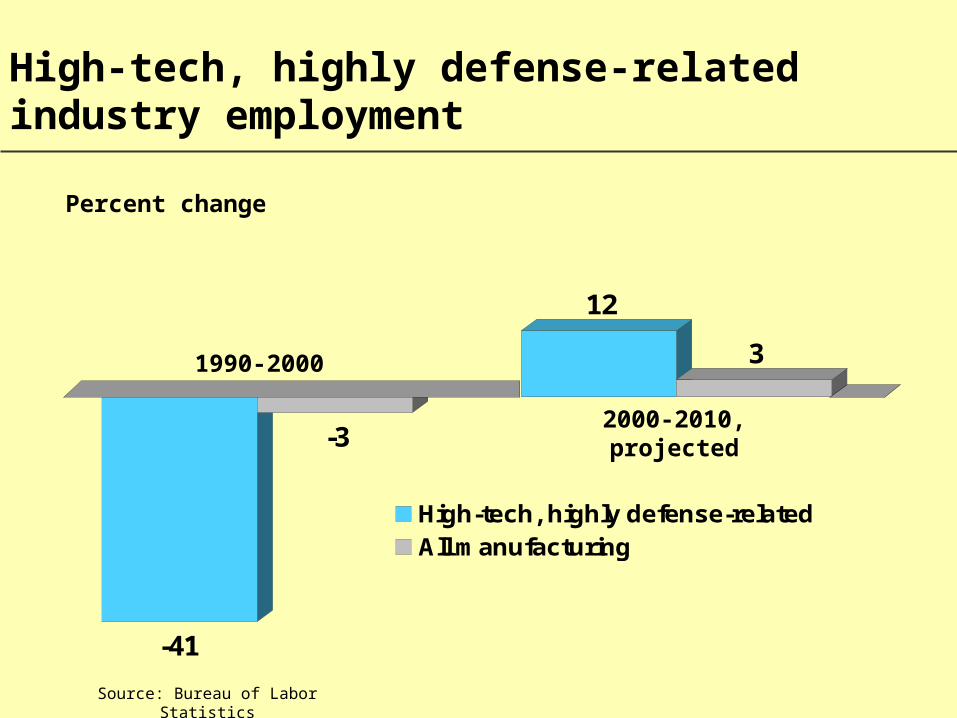
-41
-3
12
3
High-tech, highly defense-relatedAll manufacturing
High-tech, highly defense-related industry employment
Source: Bureau of Labor Statistics
Percent change
1990-2000
2000-2010, projected
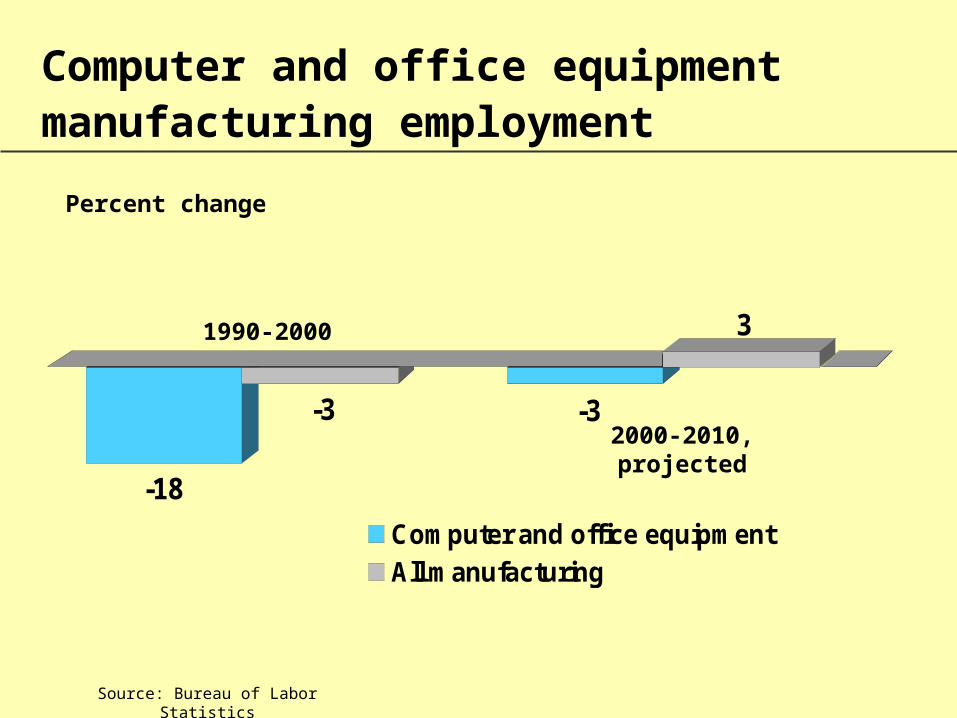
-18
-3 -3
3
Computer and office equipmentAll manufacturing
Computer and office equipment manufacturing employment
Source: Bureau of Labor Statistics
Percent change
1990-2000
2000-2010, projected
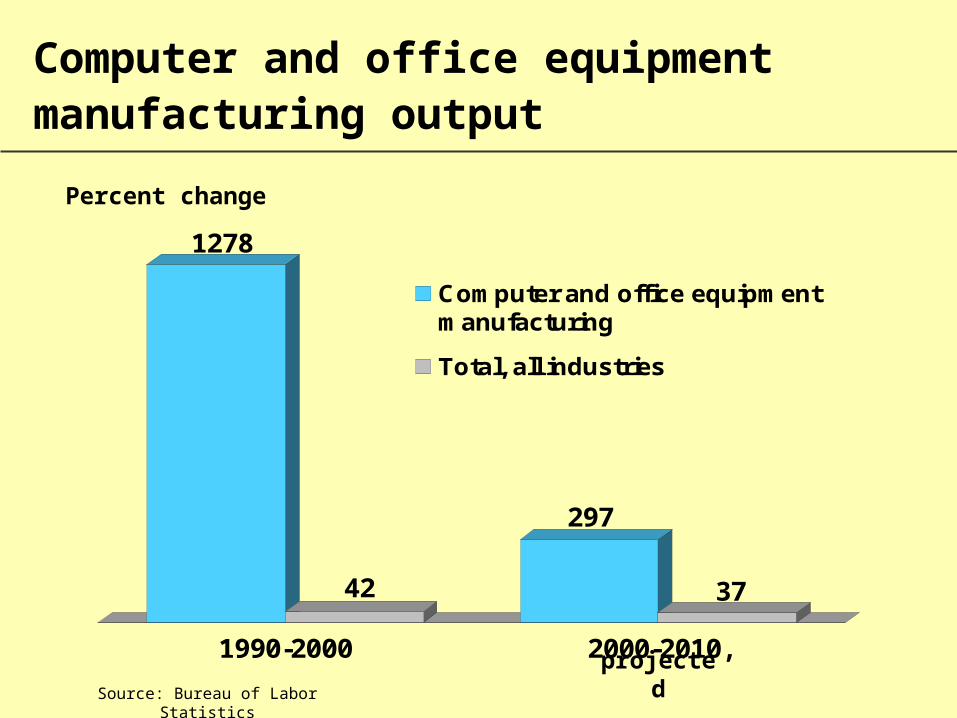
Computer and office equipment manufacturing output
1278
42
297
37
1990-2000 2000-2010,
Computer and office equipmentmanufacturing
Total, all industries
Source: Bureau of Labor Statistics
Percent change
projected
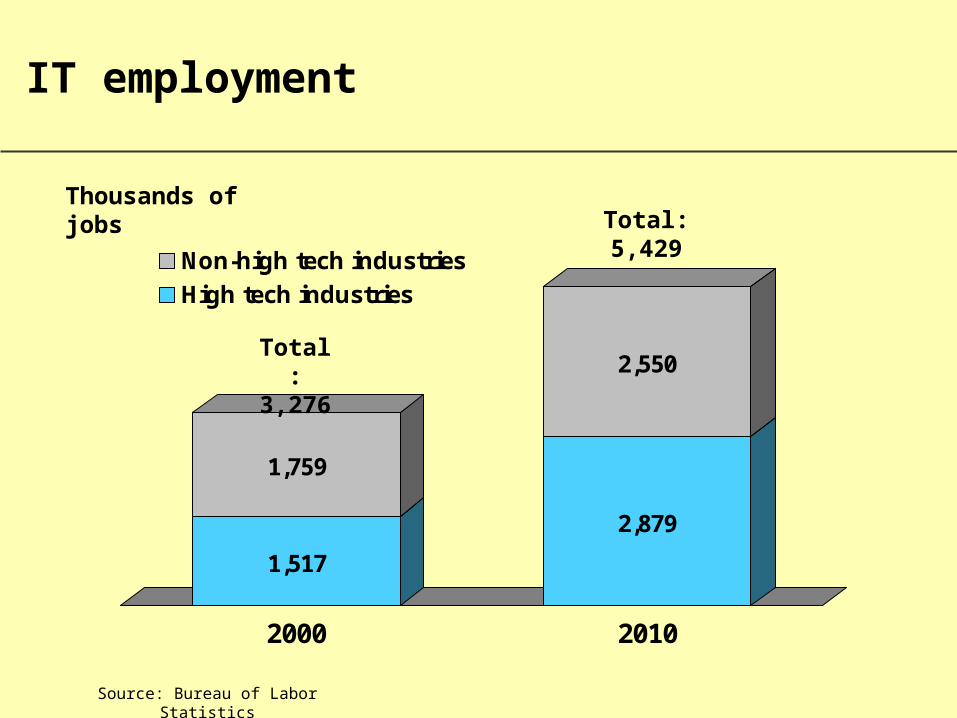
IT employment
1,517
1,759
2,879
2,550
2000 2010
Non-high tech industries
High tech industries
Total: 3,276
Total: 5,429
Thousands of jobs
Source: Bureau of Labor Statistics
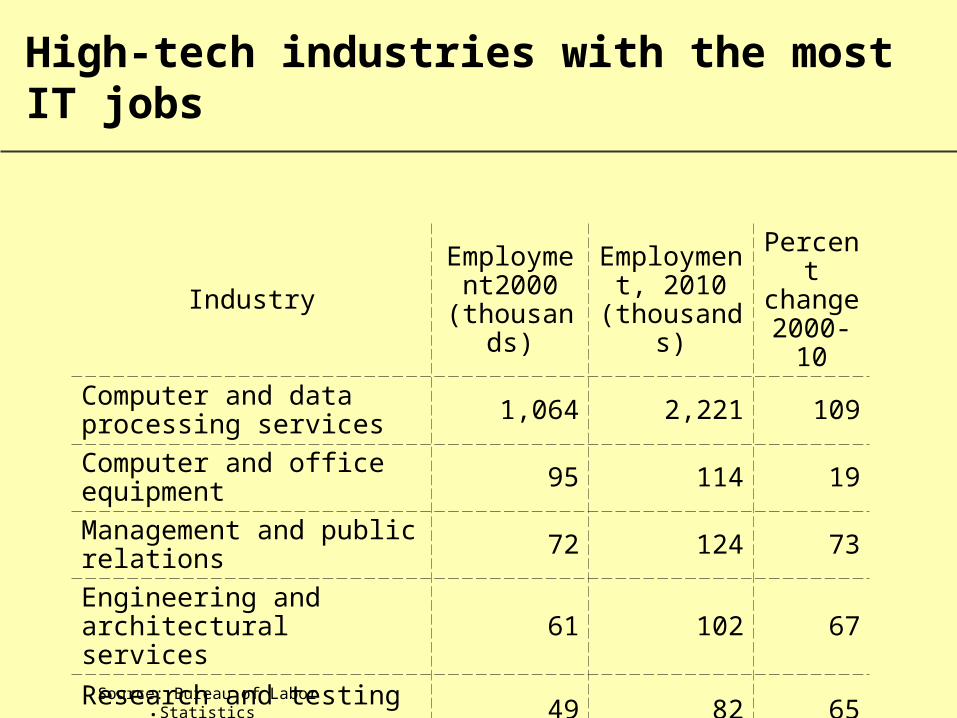
High-tech industries with the most IT jobs
IndustryEmployment
2000(thousands)
Employment, 2010
(thousands)
Percent change
2000-10
Computer and data processing services 1,064 2,221 109
Computer and office equipment 95 114 19
Management and public relations 72 124 73
Engineering and architectural services 61 102 67
Research and testing services 49 82 65
Source: Bureau of Labor Statistics
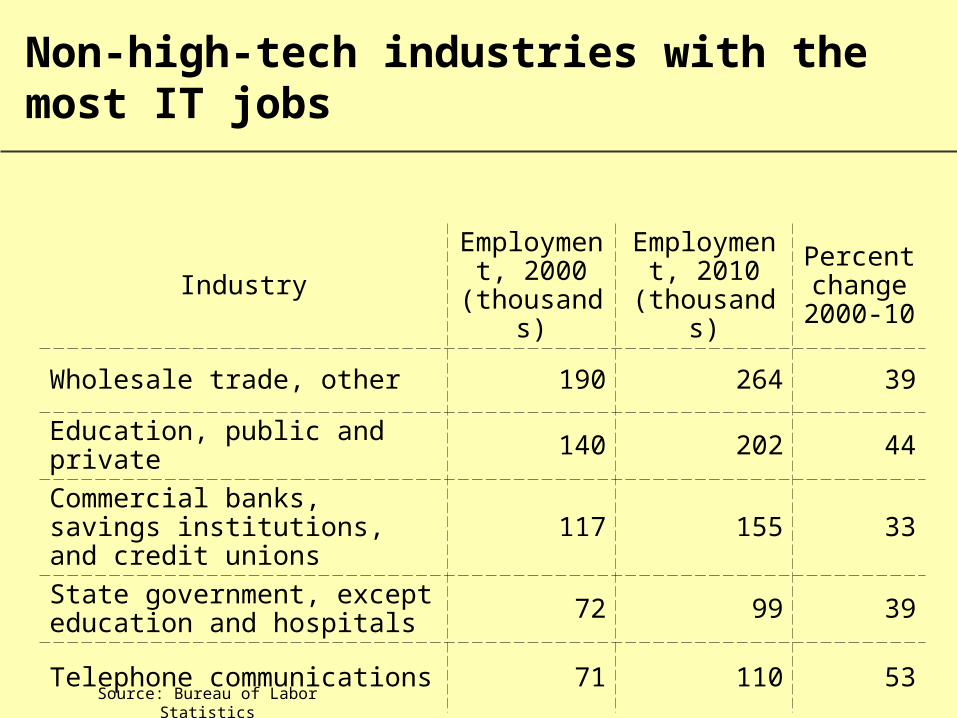
Non-high-tech industries with the most IT jobs
Source: Bureau of Labor Statistics
IndustryEmployment,
2000(thousands)
Employment, 2010
(thousands)
Percent change
2000-10
Wholesale trade, other 190 264 39
Education, public and private 140 202 44
Commercial banks, savings institutions, and credit unions 117 155 33
State government, except education and hospitals 72 99 39
Telephone communications 71 110 53

Employment Outlook: 2000-2010
One critical aspect of the analysis of occupational employment trends are the education and training requirements of jobs.
The context for any discussion of education is the remarkable trend since the late 1970s in the growing gap between those with more and those with less education
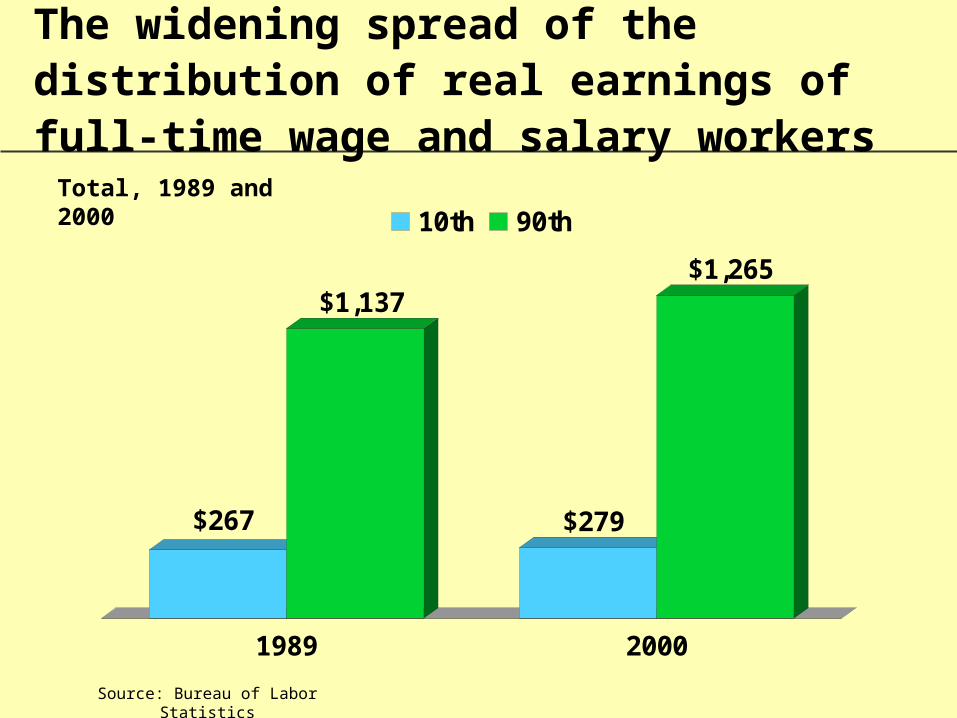
The widening spread of the distribution of real earnings of full-time wage and salary workers
$267
$1,137
$279
$1,265
1989 2000
10th 90th
Source: Bureau of Labor Statistics
Total, 1989 and 2000
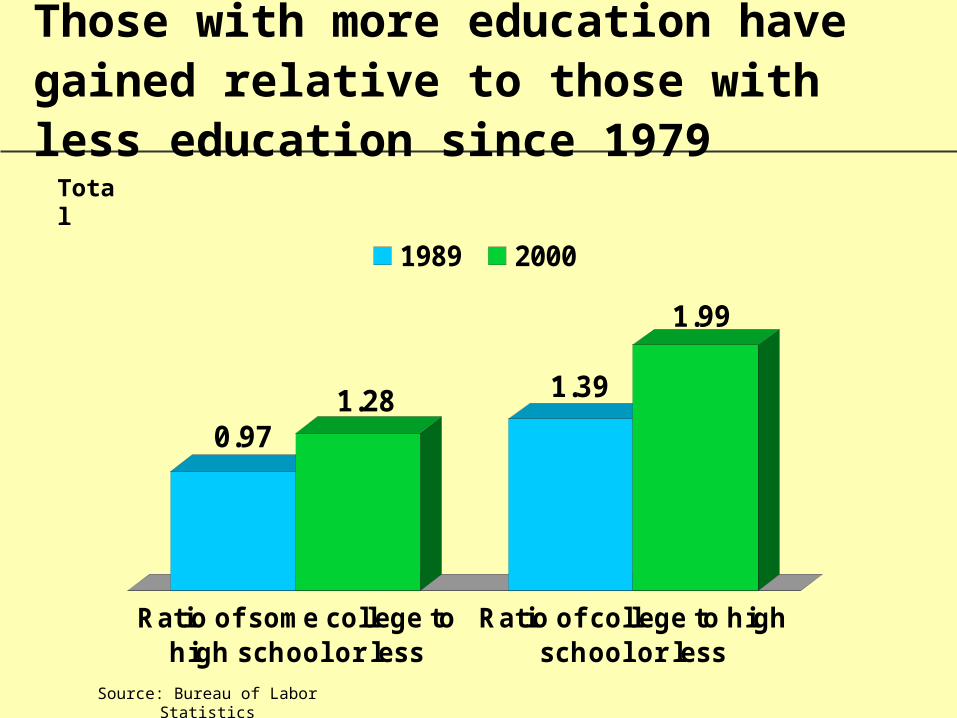
Those with more education have gained relative to those with less education since 1979
0.971.28 1.39
1.99
Ratio of some college tohigh school or less
Ratio of college to highschool or less
1989 2000
Source: Bureau of Labor Statistics
Total
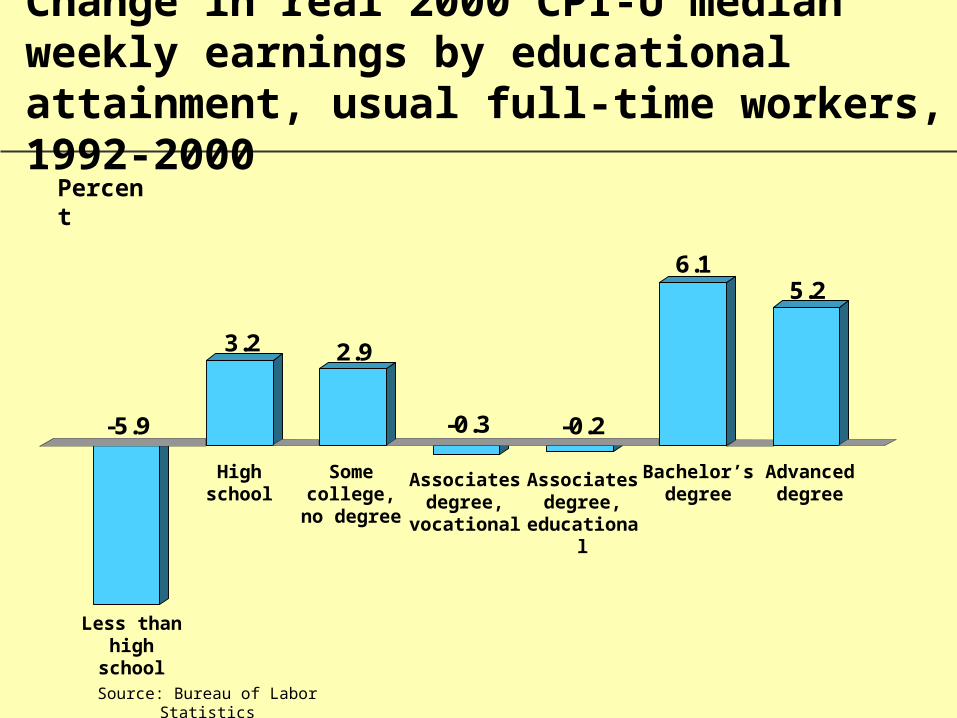
Change in real 2000 CPI-U median weekly earnings by educational attainment, usual full-time workers, 1992-2000
Percent
-5.9
3.2 2.9
-0.3 -0.2
6.15.2
Source: Bureau of Labor Statistics
Less than high school
High school
Some college, no
degree
Associates degree,
vocational
Associates degree,
educational
Bachelor’s degree
Advanced degree
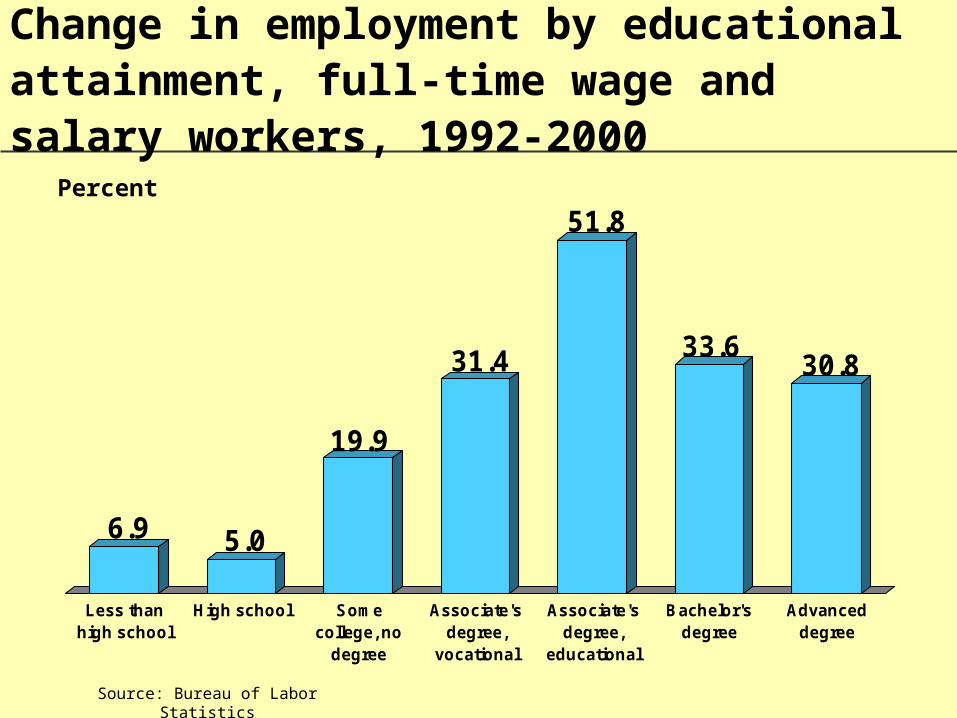
Change in employment by educational attainment, full-time wage and salary workers, 1992-2000
6.9 5.0
19.9
31.4
51.8
33.630.8
Less thanhigh school
High school Somecollege, no
degree
Associate'sdegree,
vocational
Associate'sdegree,
educational
Bachelor'sdegree
Advanceddegree
Percent
Source: Bureau of Labor Statistics

Web sites
• Occupational Outlook Handbook http://www.bls.gov/oco/
• Career Guide to Industrieshttp://www.bls.gov/oco/cg/
• Occupational Outlook Quarterlyhttp://www.bls.gov/opub/ooq/ooqhome.htm