Pitchbook US template - JPMorgan Chase · PDF fileGlobal Wealth Management (GWM) Global...
30
February 23, 2016 A S S E T M A N A G E M E N T Mary Erdoes, Chief Executive Officer Asset Management
-
Upload
vuongkhanh -
Category
Documents
-
view
227 -
download
1
Transcript of Pitchbook US template - JPMorgan Chase · PDF fileGlobal Wealth Management (GWM) Global...

February 23, 2016
A S S E T M A N A G E M E N T
Mary Erdoes, Chief Executive Officer Asset Management

A S
S E
T
M A
N A
G E
M E
N T
Consistent growth across a world-class franchise
Consistency – high margin, high ROE, predictable growth
Breadth – diversified earnings from multiple products, channels, and regions
Depth – strong global client-centric franchises, each with significant room to grow
Growth engine
within JPMC
Difficult to
replicate
Fiduciary mindset ingrained since mid-1800s
Countless learnings with client relationships spanning centuries
Invaluable benefit of being part of JPMC
Strong
investment
culture
Client-focused, fiduciary culture
84% of 10-year long-term mutual fund AUM in top 2 quartiles1
Positive client asset flows every year since 2004
World’s best
clients
Serving institutional and individual clients in over 130 countries
World’s most sophisticated clients, including large pensions, sovereigns, central banks
J.P. Morgan Private Bank unmatched in serving the world’s wealthiest
Our strategic
priorities
Continue to deliver top-tier, long-term investment performance
Continue to drive efficiencies while reinforcing infrastructure and control environment
Continue to innovate, and invest in people, products, and processes
AM
GIM
GWM
For important footnoted information, please refer to notes appendix 1

A S
S E
T
M A
N A
G E
M E
N T
Leads with investment
performance
■ Mutual funds with a 4/5 star rating (#)1 157 231 +74
■ Assets under management ($T) $1.3 $1.7 6%
■ Client assets ($T) $1.8 $2.4 5%
Record growth
and results
■ Revenue ($B) $9.0 $12.1 6%
■ Deposits ($B) $92 $147 10%
■ Loans (ex-mortgages) ($B) $44 $84 14%
■ Mortgages ($B) $11 $29 22%
World-class
salesforce
■ PB client advisors (#) 2,247 2,328 1%
■ PB revenue / client advisor ($mm) $1.7 $2.2 6%
■ Institutional salespeople 112 121 2%
■ Institutional revenue / salesperson ($mm) $9.7 $13.4 7%
■ Funds senior salespeople 218 283 5%
■ Funds revenue / senior salesperson ($mm) $7.3 $9.3 5%
2015 highlights – Continued growth of revenue, credit balances, and top-rated
funds, and increasing productivity
Record
GWM
2010 2015 5-yr CAGR
GIM
Inst’l
GIM
Retail
AM
GIM
GWM
For important footnoted information, please refer to notes appendix 2
A S
S E
T
M A
N A
G E
M E
N T
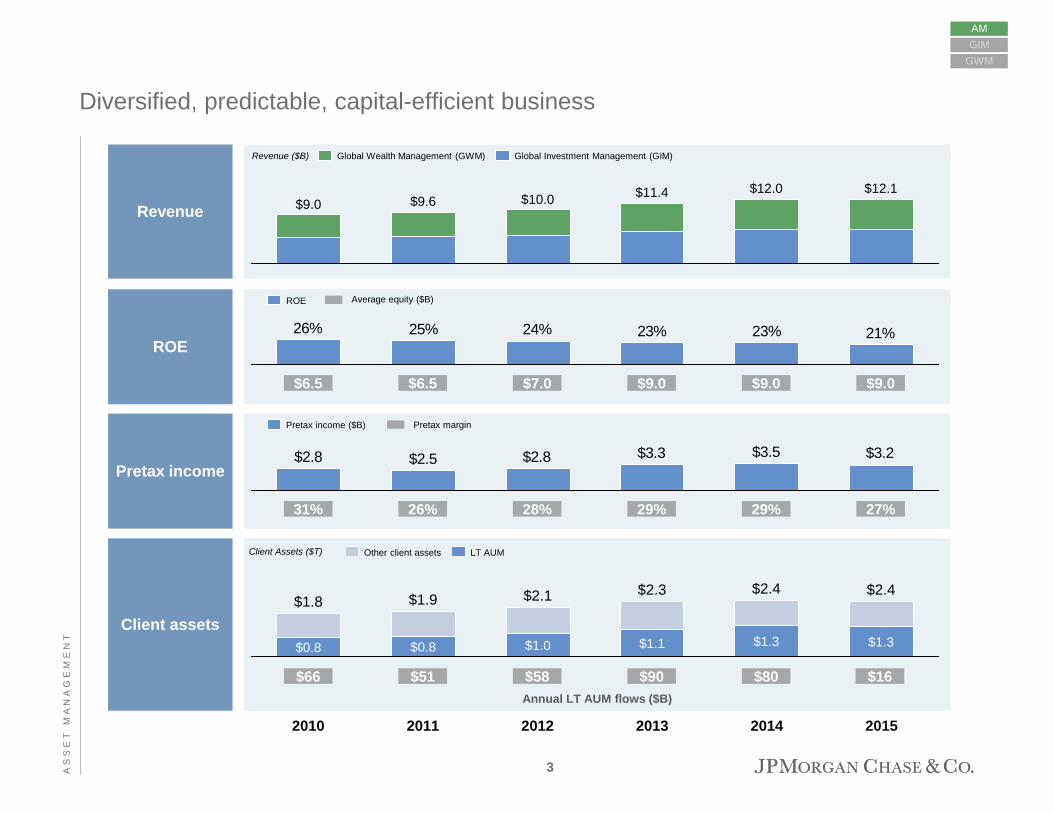
$12.1 $12.0 $11.4 $10.0 $9.6 $9.0
Global Investment Management (GIM) Global Wealth Management (GWM)
Diversified, predictable, capital-efficient business
21%23%23%24%25%26%
ROE
Revenue ($B)
2010 2011 2012 2013 2014 2015
Pretax income ($B)
AM
GIM
GWM
$3.2$3.5$3.3$2.8$2.5$2.8
Revenue
Pretax income
Client assets
ROE
Pretax margin
Average equity ($B)
31%
$6.5
26%
$6.5
28%
$7.0
29%
$9.0
29%
$9.0
27%
$9.0
Annual LT AUM flows ($B)
Client Assets ($T)
$2.4
$1.3
$2.4
$1.3
$2.3
$1.1
$2.1
$1.0
$1.9
$0.8
$1.8
$0.8
LT AUM Other client assets
$66 $51 $58 $90 $80 $16
3

A S
S E
T
M A
N A
G E
M E
N T
Source: Company filings, Strategic Insight Simfund 1 Industry represents open-end long-term registered products; excludes Fund of Funds 2 Revenue based on management fees only
2015 flows positive but below historical levels
$22$13
$36
$58
$44
$22
$80
2013
$90
2012
$58
2011
$51
2010
$66
2015
$16
2014
$11$7
1Q15
$16
4Q15
$1
3Q15
-$9
$2
-$4
2Q15
$13
JPM LT AUM flows
by quarter, 2015, $B
4% nm 7% 12% 10% 12%
LT active MF flows
#4 #5 #2 #1 #1 #2
LT MF flows Other LT AUM flows
3% 10% 4% 7% 5% 3%
#5 #8 #5 #3 #3 #5
LT active + passive MF / ETF flows
% of total:
Rank:
% of total:
Rank:
Cumulative
9%
#1
5%
#3
~75%
Revenue2 AUM
~90%
Passive Active
Global LT fund
industry1
JPM LT AUM flows, $B
AM
GIM
GWM
4

A S
S E
T
M A
N A
G E
M E
N T
Fixed Income Equity Multi-Asset Alternatives Other
GWM
U.S.
EMEA
Asia
LatAm
███ < $(100mm) ███ Flat ███ > $100mm
GIM
U.S.
EMEA
Asia
LatAm
GIM
U.S.
EMEA
Asia
LatAm
Fixed Income Equity Multi-Asset Alternatives Other
GWM
U.S.
EMEA
Asia
LatAm
Flows across diverse channels, regions, and products
Channel Region LT AUM Flows
Fixed Income Equity Multi-Asset Alternatives Other
GWM
U.S.
EMEA
Asia
LatAm
GIM
U.S.
EMEA
Asia
LatAm
2015
2014
2013
$28B
$84B
$100B
AM
GIM
GWM
LT flows by channel, region, and product ($B)
$16B
$90B
$80B
LT client asset flows
5

A S
S E
T
M A
N A
G E
M E
N T
2011 2012 2013 2014 2015
JPM Peer 3 Peer 5 Peer 5 Peer 5 Peer 5
Peer 1 JPM Peer 1 JPM Peer 11 JPM
Peer 2 Peer 1 JPM Peer 11 Peer 6 Peer 1
Peer 3 Peer 4 Peer 4 Peer 4 Peer 12 Peer 4
Peer 4 Peer 7 Peer 2 Peer 2 Peer 4 Peer 2
Peer 5 Peer 2 Peer 7 Peer 12 Peer 7 Peer 11
Peer 6 Peer 11 Peer 11 Peer 7 Peer 2 Peer 7
Peer 7 Peer 10 Peer 6 Peer 1 JPM Peer 6
Peer 8 Peer 9 Peer 9 Peer 6 Peer 8 Peer 8
Peer 9 Peer 8 Peer 8 Peer 8 Peer 10 Peer 10
Peer 10 Peer 6 Peer 10 Peer 10 Peer 1 Peer 12
Peer 11 Peer 5 Peer 12 Peer 9 Peer 9 Peer 9
Peer 12 Peer 12 Peer 3 Peer 3 Peer 3 Peer 3
$541
$464
$316,7
$503
$151
$371
$36
$58
$(4)1
$832
$385
$103
$101
$84
$100
Overall LT client asset flows of publicly traded companies
AM
GIM
GWM
Source: Company filings, J.P. Morgan estimates
Note: Includes competitors in peer group with publicly reported financials and 2015 client assets of at least $500B: Allianz, BAC, BEN, BK, BLK, CS, DB, GS, IVZ, MS, TROW, UBS
For important footnoted information, please refer to notes appendix
$971
$(55)9
2011-2015 avg. flows ($B)
Ranking of LT client asset flows ($B) for key peers
2011-2015 avg. flows ($B)
$28
6

A S
S E
T
M A
N A
G E
M E
N T
Continuing to invest in people and technology through temporary headwinds
AM
GIM
GWM
27%31%
2018 2015
30%+
2010
Expenses
leveling off
Continued
investment in
growth
Controls uplift
Account remediation
Low rates
Temporary headwinds
Pretax margin
Flat
Flat
+ ~250 people
+ ~70%
+ ~500 people
+ ~30%
Front office
headcount
Tech
initiatives
Controls
Operations
+ ~130%
+ ~30%
Down Tech
production + ~10%
7
A S
S E
T
M A
N A
G E
M E
N T
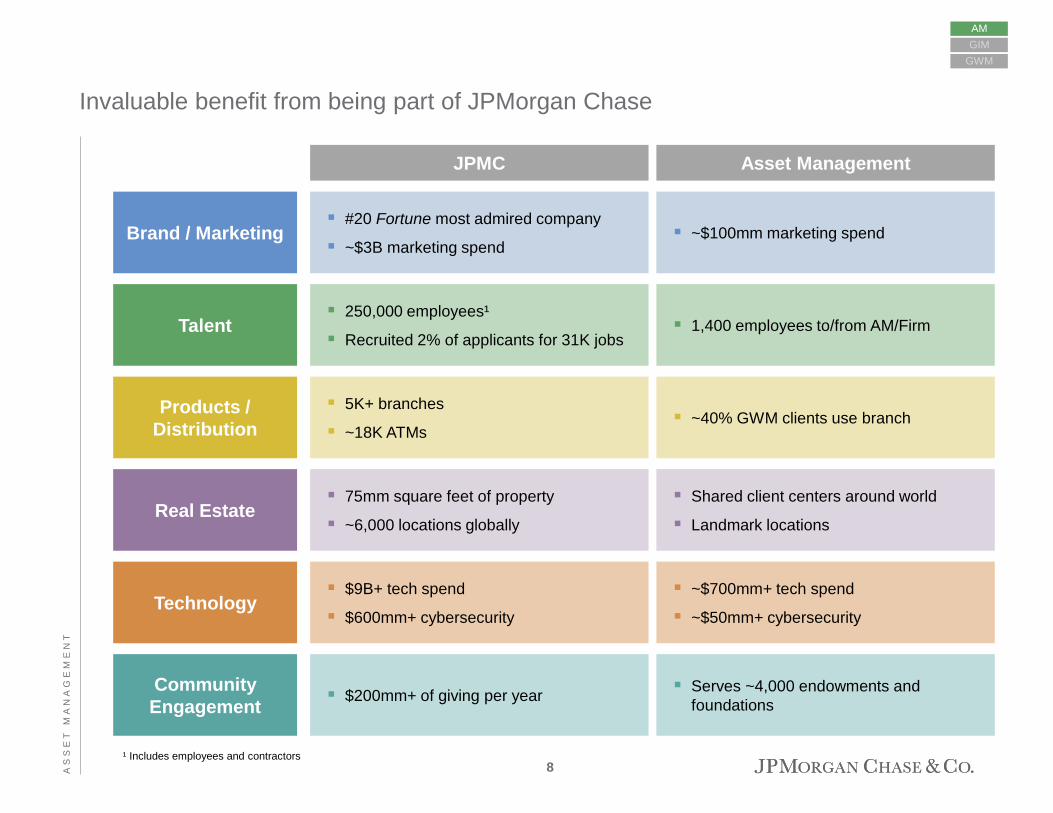
Invaluable benefit from being part of JPMorgan Chase
AM
GIM
GWM
Brand / Marketing
Products /
Distribution
Real Estate
Technology
Community
Engagement
Talent
#20 Fortune most admired company
~$3B marketing spend
5K+ branches
~18K ATMs
75mm square feet of property
~6,000 locations globally
$9B+ tech spend
$600mm+ cybersecurity
$200mm+ of giving per year
250,000 employees¹
Recruited 2% of applicants for 31K jobs
~$100mm marketing spend
~40% GWM clients use branch
Shared client centers around world
Landmark locations
~$700mm+ tech spend
~$50mm+ cybersecurity
Serves ~4,000 endowments and
foundations
1,400 employees to/from AM/Firm
JPMC Asset Management
8 ¹ Includes employees and contractors
A S
S E
T
M A
N A
G E
M E
N T
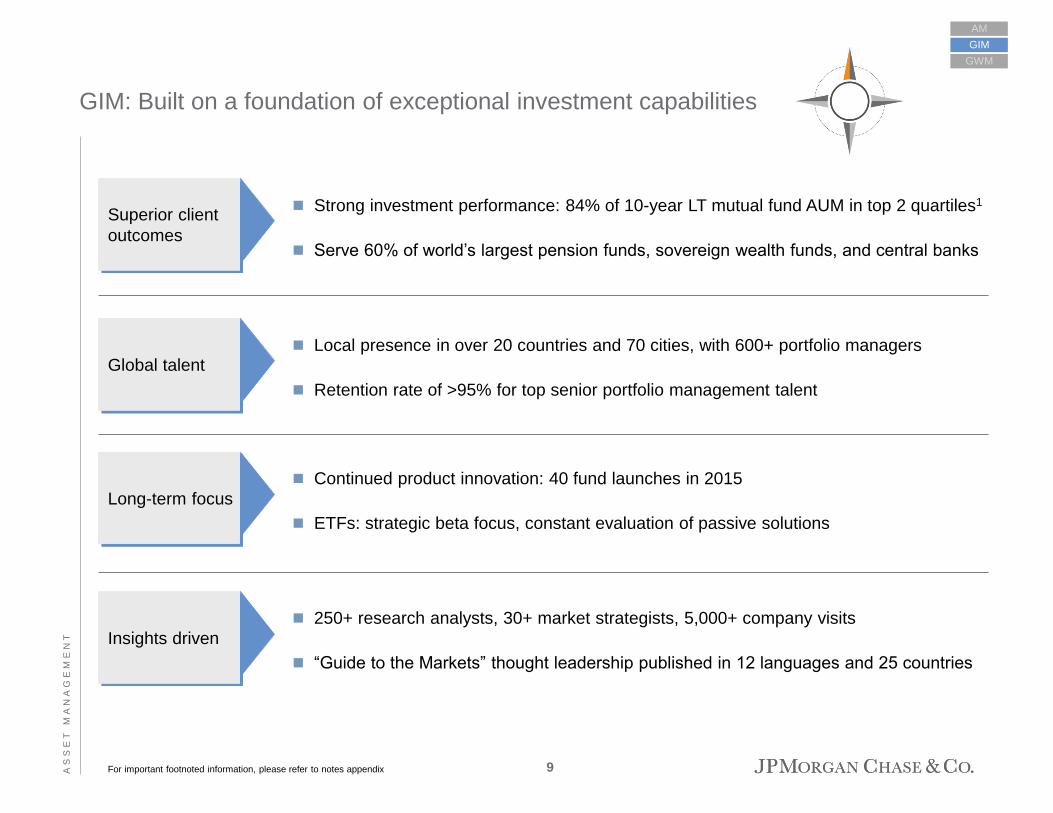
GIM: Built on a foundation of exceptional investment capabilities
Superior client
outcomes
Strong investment performance: 84% of 10-year LT mutual fund AUM in top 2 quartiles1
Serve 60% of world’s largest pension funds, sovereign wealth funds, and central banks
Global talent Local presence in over 20 countries and 70 cities, with 600+ portfolio managers
Retention rate of >95% for top senior portfolio management talent
Continued product innovation: 40 fund launches in 2015
ETFs: strategic beta focus, constant evaluation of passive solutions
Long-term focus
AM
GIM
GWM
250+ research analysts, 30+ market strategists, 5,000+ company visits
“Guide to the Markets” thought leadership published in 12 languages and 25 countries
Insights driven
For important footnoted information, please refer to notes appendix 9

A S
S E
T
M A
N A
G E
M E
N T
Total8
% of 2015 MF AUM over peer median1
(net of fees)
3-year 5-year
Equity
Fixed Income
Leading mutual fund performance across asset classes globally
10-year
Multi-Asset
Solutions
78% 68% 77%
78% 80% 84%
For important footnoted information, please refer to notes appendix 1 Represents the proportion of retail open-ended mutual fund assets that are ranked above peer category median. See notes appendix for additional details
82% 81% 87%
72% 94% 84%
Example funds
(3-yr performance percentile)2
Global active
LT MF AUM rank3
Growth Advantage (3%)4
Europe Equity Plus (3%)5
2010
Core Plus Bond (9%)6
Global Bond Opps (8%)4
SmartRetirement 2030 (13%)7
Global Allocation (7%)4
2015
#7 #5
#6 #5
#17 (US)
#6 (US)
#8 #6
AM
GIM
GWM
#9 #7
LT active MFs
LT active + passive MFs / ETFs
10

A S
S E
T
M A
N A
G E
M E
N T
Systematic Valuation Information Advantage Portfolio Construction
30-year proven process in US Core equities
Starts with analyst DDR rankings
9 portfolio managers, 11 traders
Shorting stocks since early 90’s
27 U.S. career analysts
17 years average experience
Leverage team of 225 int’l analysts
AM
GIM
GWM
US Large Cap Core Plus Fund US Equity Fund Disciplined Equity Fund
Investment process has led to strong results vs. benchmark and peers
-4%
-2%
0%
2%
4%
Quintile1
Quintile2
Quintile3
Quintile4
Quintile5
Perc
ent
Initial
opportunity set
Extended
opportunity set
+
DDR* quintile performance (vs. S&P 500) since 1986 inception
Source: J.P. Morgan Asset Management, Morningstar. Data are as of 12/31/15.
For important footnoted information, please refer to notes appendix
2010-2015 rolling 5Y periods
10Y avg. alpha 40bps (11th %ile) 10Y avg. alpha 153bps (4th %ile) 10Y avg. alpha 231bps (2nd %ile)
Outperformed benchmark 72% of time1 Outperformed benchmark 93% of time1 Outperformed benchmark 97% of time1
2010-2015 rolling 5Y periods 2010-2015 rolling 5Y periods
11
A S
S E
T
M A
N A
G E
M E
N T
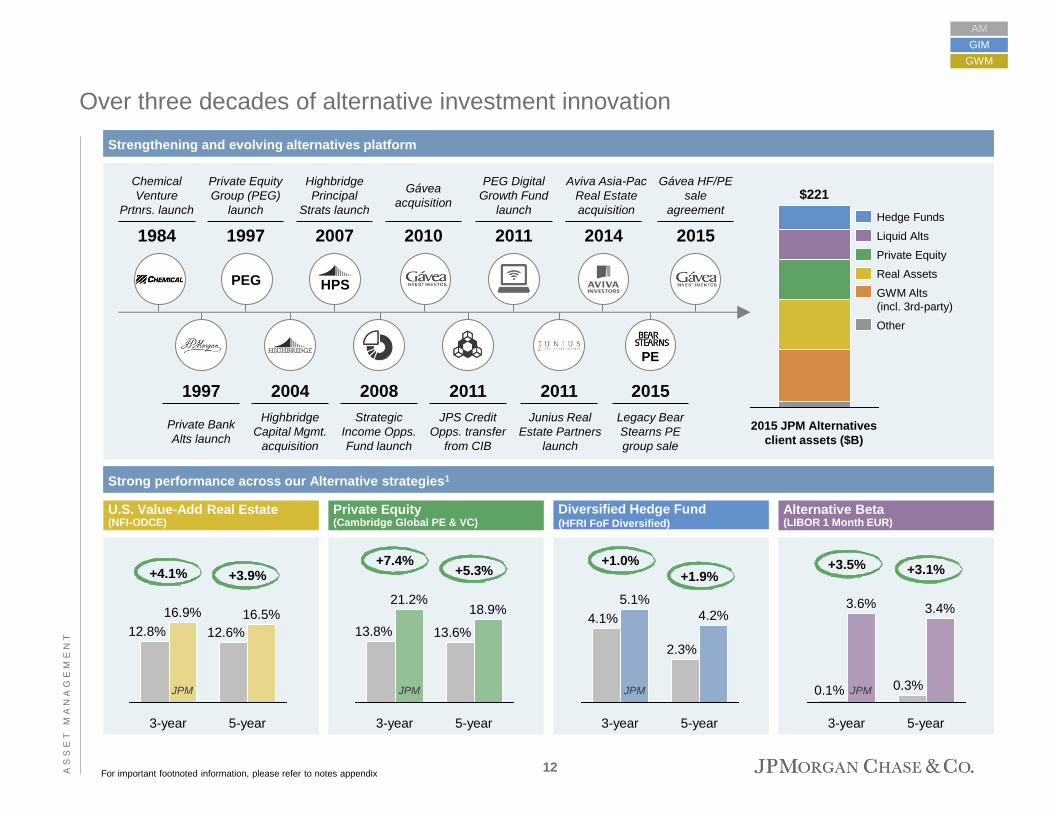
Over three decades of alternative investment innovation
Alternative Beta (LIBOR 1 Month EUR)
U.S. Value-Add Real Estate (NFI-ODCE)
Private Equity (Cambridge Global PE & VC)
AM
GIM
GWM
2015 JPM Alternatives
client assets ($B)
$221
Liquid Alts
Other
GWM Alts
(incl. 3rd-party)
Real Assets
Private Equity
Hedge Funds
Strong performance across our Alternative strategies1
Strengthening and evolving alternatives platform
+3.9% +4.1%
5-year
16.5%
12.6%
3-year
16.9%
12.8%
+5.3%
+7.4%
5-year
18.9%
13.6%
3-year
21.2%
13.8%
+3.1% +3.5%
5-year
3.4%
0.3%
3-year
3.6%
0.1%
4.2%
+1.9%
+1.0%
5-year
2.3%
3-year
5.1%
4.1%
Diversified Hedge Fund (HFRI FoF Diversified)
For important footnoted information, please refer to notes appendix
JPM JPM JPM JPM
1984
Chemical
Venture
Prtnrs. launch
1997
Private Equity
Group (PEG)
launch
2007
Highbridge
Principal
Strats launch
2010
Gávea
acquisition
2011
PEG Digital
Growth Fund
launch
2014
Aviva Asia-Pac
Real Estate
acquisition
2015
Gávea HF/PE
sale
agreement
1997
Private Bank
Alts launch
2004
Highbridge
Capital Mgmt.
acquisition
2008
Strategic
Income Opps.
Fund launch
2011
JPS Credit
Opps. transfer
from CIB
2011
Junius Real
Estate Partners
launch
2015
Legacy Bear
Stearns PE
group sale
PE
HPS PEG
12

A S
S E
T
M A
N A
G E
M E
N T
Strong Solutions business leveraging underlying product platforms
GIM
GWM
2014 2015 2010
AM
Industry: 13% CAGR2
JPM: 27% CAGR
GIM Global Solutions AUM1
Source: Morningstar, Strategic Insight Simfund, eVestment
For important footnoted information, please refer to notes appendix
World Allocation3 Target Date Fund5
5%
14%
Flows AUM
Performance 13th percentile
in category (5-yr)7
19%
32%
AUM 2015 Flows
Performance 22nd percentile
in category (5-yr)
0%
11%
Flows AUM
Performance 7th percentile
in category (3-yr)6
#3 #4 #16 #3
JPM Target Date suite
X
JPM Global Allocation
EUR Moderate Allocation – Global4
19%
32%
AUM Flows
Performance 22nd percentile
in category (5-yr)
JPM Global Income
#1 #2
2015 share % 2015 share % 2015 share %
13
A S
S E
T
M A
N A
G E
M E
N T
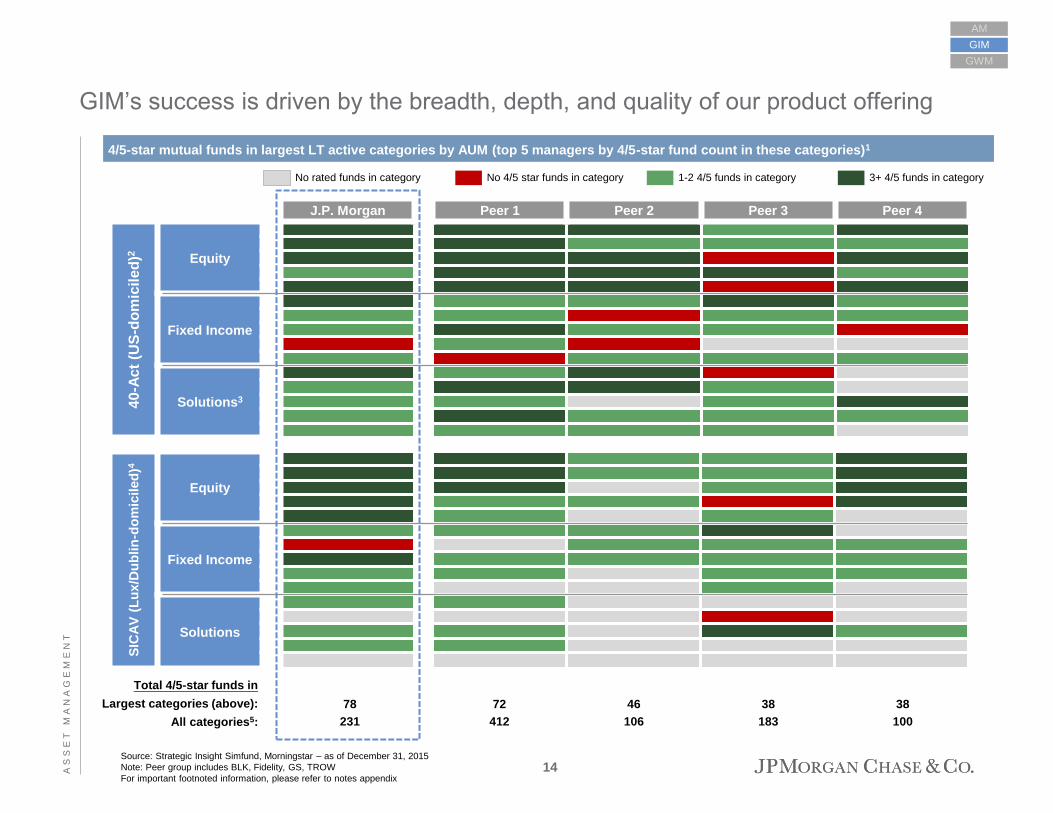
GIM’s success is driven by the breadth, depth, and quality of our product offering
GIM
GWM
AM
J.P. Morgan Peer 1 Peer 2 Peer 3 Peer 4
40
-Ac
t (U
S-d
om
icil
ed
)2
Equity
Fixed Income
Solutions3
4/5-star mutual funds in largest LT active categories by AUM (top 5 managers by 4/5-star fund count in these categories)1
No 4/5 star funds in category 1-2 4/5 funds in category 3+ 4/5 funds in category No rated funds in category
Source: Strategic Insight Simfund, Morningstar – as of December 31, 2015
Note: Peer group includes BLK, Fidelity, GS, TROW
For important footnoted information, please refer to notes appendix
SIC
AV
(L
ux/D
ub
lin
-do
mic
iled
)4
Equity
Fixed Income
Solutions
78 72 46 38 38
Total 4/5-star funds in
Largest categories (above):
All categories5: 231 412 106 183 100
14

A S
S E
T
M A
N A
G E
M E
N T
Market leading Liquidity platform
Global Money Market asset growth (USD and EUR) Consistent global MMF rankings
Growing revenue and PTI
Source: iMoneyNet
Impact of rate environment
2006 Firm AUM ($B) 2015 Firm AUM ($B)
1 Fidelity $271 1 Fidelity $458
2 J.P. Morgan 246 2 J.P. Morgan 384
3 BlackRock 183 3 BlackRock 328
4 Federated 155 4 Goldman Sachs 262
5 Vanguard 147 5 Federated 221
6 BofA Global Capital 138 6 Dreyfus/BK 189
7 Schwab 136 7 Vanguard 180
8 Goldman Sachs 120 8 Schwab 166
9 Legg Mason 108 9 State Street 154
10 Dreyfus/BK 106 10 Morgan Stanley 153
-20
0
20
40
60
80
100
120
140
160
12/10 12/11 12/12 12/13 12/14 12/15 12/08 12/09 12/06 12/07
JPM
Industry ex. JPM
Asse
t G
row
th
0 25 50 75
Additional 25 bps rate
increase will eliminate
most MMF fee waivers
% o
f 2
01
5 fe
e w
aiv
ers
Increase in interest rates (bps)
+16%
2015 2014
AM
GIM
GWM
+25%
+66%
+27%
Exp:
PTI:
15

A S
S E
T
M A
N A
G E
M E
N T
Global, multi-currency deposit institution: ~$150B balances
Leading lender to world’s major families: ~$110B balances
Holistic balance
sheet approach
Advice-driven wealth management based on unique integrated team model
Experienced talent across functions and regions: average MD tenure of 15+ years
Leading with
advice
AM
GIM
GWM
Expanding product breadth & depth: >20 new alts offerings, 6 thematic strategies in 2015
Enhancing digital client experience, including delivery of intellectual capital
Innovation
Trusted advisor to clients across the wealth spectrum, including integration with CWM
Continued investment in global footprint, serving clients in ~100 countries, even as
competitors retrench
Client reach
GWM: Superior global franchise across wealth segments
16
A S
S E
T
M A
N A
G E
M E
N T
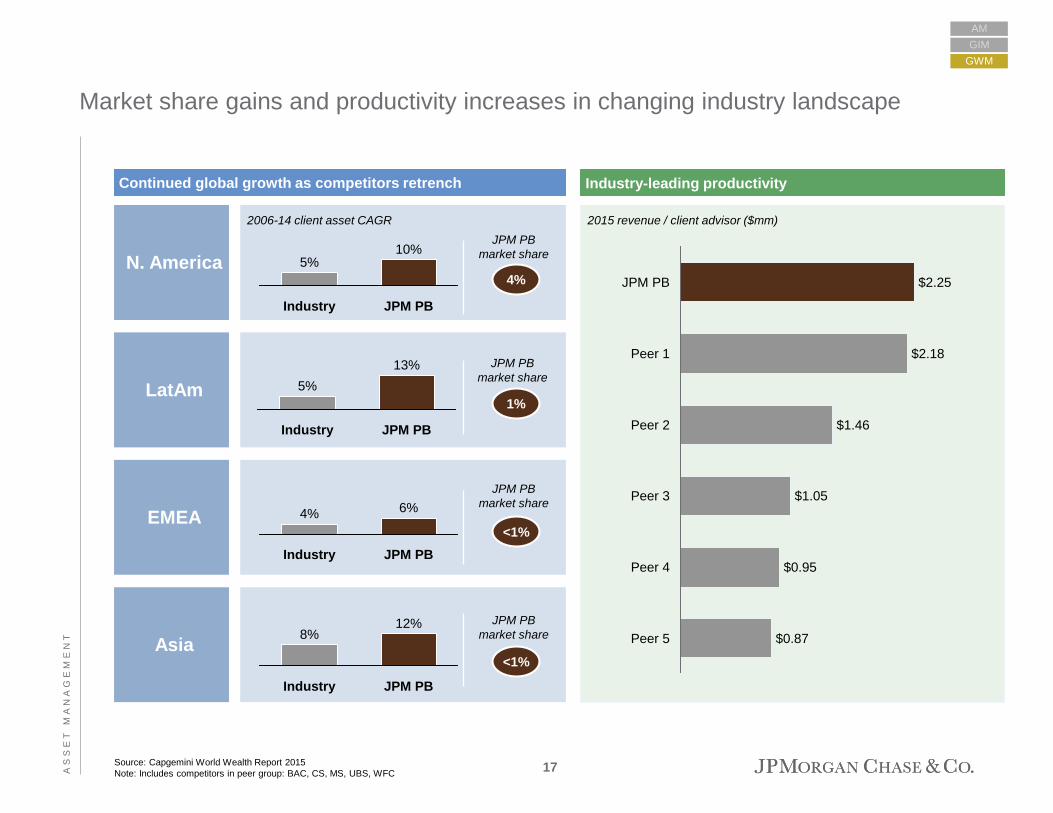
N. America
LatAm
EMEA
Asia
Market share gains and productivity increases in changing industry landscape
Source: Capgemini World Wealth Report 2015
Note: Includes competitors in peer group: BAC, CS, MS, UBS, WFC
Continued global growth as competitors retrench
JPM PB
10%
Industry
5%
JPM PB
13%
Industry
5%
JPM PB
6%
Industry
4%
12%
Industry JPM PB
8%
4%
JPM PB
market share
1%
<1%
<1%
JPM PB
market share
JPM PB
market share
JPM PB
market share
AM
GIM
GWM
Industry-leading productivity
2015 revenue / client advisor ($mm)
Peer 2
$0.95
JPM PB
Peer 1 $2.18
$1.05
$2.25
Peer 5 $0.87
Peer 3
$1.46
Peer 4
2006-14 client asset CAGR
17

A S
S E
T
M A
N A
G E
M E
N T
Uniquely positioned with UHNW clients and continuing to innovate
Source: BCG Global Wealth Report 2015, company filings
Note: Includes competitors in peer group who publicly report statistic: BAC, MS, UBS
JPM PB uniquely positioned among UHNW clients
~30%
Peer 2
~40%
Peer 1
~50%
JPM
PB
~90%
Peer 3
>50% of JPM PB client assets
from clients with $100mm+
AM
GIM
GWM
UHNW segments growing fastest
4%
7%
10%
12%
$1-$20mm $100mm+ $20-$100mm <$1mm
% client assets from clients with $10mm+ Projected 2014-2019 CAGR of industry private wealth
Delivering continuous innovation to the world’s most sophisticated clients
JPM capabilities Client Needs
Customized investments and
trading
Access to direct investments
and M&A opportunities
Advice on family governance,
wealth planning, and
philanthropy
Institutional discretionary coverage
Institutional markets access and execution
Direct investments
Investment banking services
Family and capital advisory services
Philanthropic advisory
JPM AM
Other LOBs
18

A S
S E
T
M A
N A
G E
M E
N T
Asia growth Changing interest rate environment
Innovative managed solutions extend our thematic conversations with clients
AM
GIM
GWM
Thematic managed investment solutions
$37$34$28
$13$6
$2
2015 2014 2013 2012 2011 2010
Thematic managed solutions AUM ($B)
= >$500mm raised
Global Healthcare
Dynamic Yield
Housing Recovery
2010 2011 2012
Focused Tactical Equity
2013 2014
US Tech Leaders
Global Opportunistic
Equity
2015
Absolute Return Fixed
Income
Emerging Asia
Digital Evolution
Japan Active Growth
Consumer Recovery
Multi Asset Real Return
US Energy & Industrial
Global Bank Opportunity
Eq
uit
y
inco
me
Cyc
lic
al
sec
tors
O
ther
them
es
European recovery
Focused Euro Multinational
European Opps.
Alternatives
Managed Alternatives
MLPs
Focused Equity Income
Focused Global
Dividends
International High Dividend
MLP & Energy
US SMID Cap Dividend Growth
Select Equity Opps.
Small Cap Dividend Growth
Preferred Securities
Dividend Leaders Strategy
Focused Dividend Growth
Emerging Market Growth
& Income
Index Oriented Equity
19

A S
S E
T
M A
N A
G E
M E
N T
Strong growth in credit book…
…with consistently low charge-off rates
2014
29
84
2015
107
+16% CAGR
82
113
25
2013
99
11
44 69
87
15
23
2011
70
55
2010
56
2012
77
18
Year-end spot balance ($B)
CAGR
22%
14%
Continuing to advise clients on both sides of their balance sheet
Optimizing deposits business…
2949
146145
127
92118
107
2011 2012 2013 2010 2014
155
+10% CAGR
2015
147
…and benefiting from expanding spreads as rates rise
Year-end spot balance ($B)
Net charge offs (%)
2009 2010 2011 2012 2013 2014 2015
0.01
0.05 0.00
0.18
0.14
0.00 0.03
0.06
0.08
0.10
0.17
0.33
0.20
0.07
Mortgages Loans (ex-mortgages)
~95% with
secured collateral
Loans (ex-mortgages)
Mortgages1
AM
GIM
GWM
1 Includes $2.1B of CIO portfolio prime mortgage loans
14-15
growth
Operating
deposits
+10%
Non-op
deposits
(40)%
Impact on deposit spread compression as interest rates increase
Increase in interest rates (bps)
Reduced
non-op
deposits
by $20B
as part of
firmwide
effort
0 50 100 150 200 250
80%
100%
20%
40%
60%
0% % o
f sp
rea
d c
om
pre
ssio
n
Expect spread compression
to decrease by >50% after
one more rate rise of 25bps
20
A S
S E
T
M A
N A
G E
M E
N T
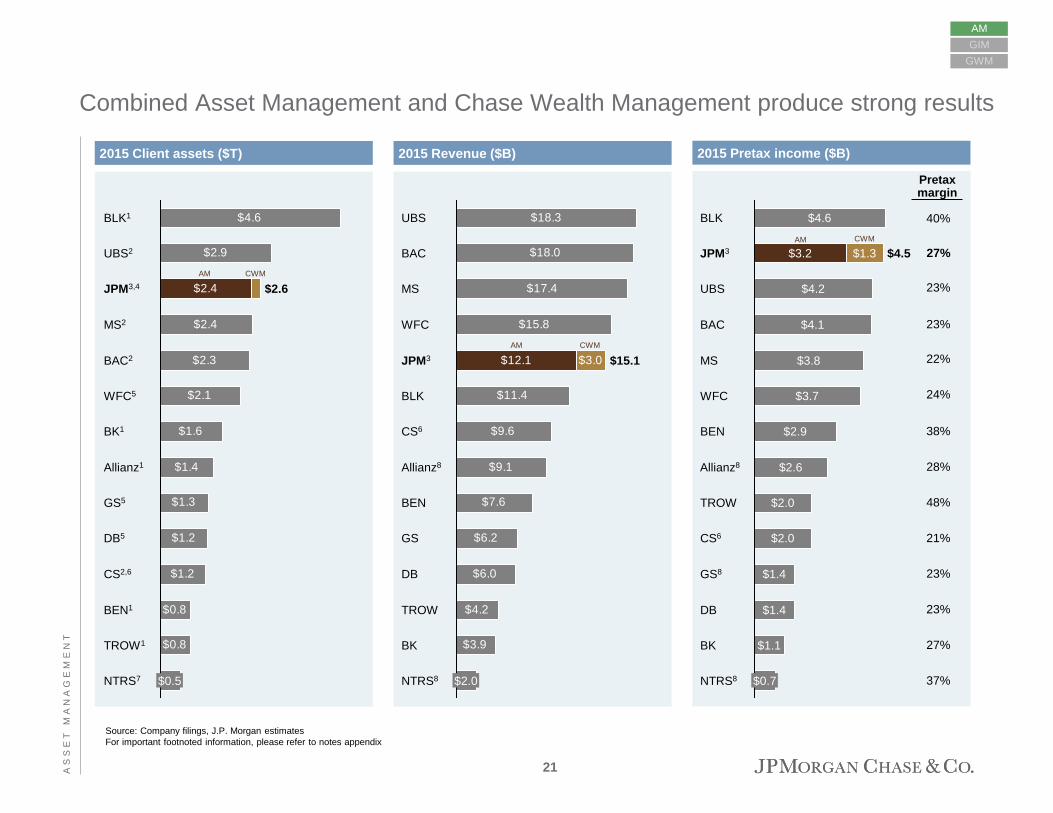
2015 Revenue ($B) 2015 Pretax income ($B)
Combined Asset Management and Chase Wealth Management produce strong results
Pretax margin
27%
40%
23%
23%
24%
22%
38%
28%
48%
21%
37%
23%
27%
2015 Client assets ($T)
AM
GIM
GWM
23%
Source: Company filings, J.P. Morgan estimates
For important footnoted information, please refer to notes appendix
$4.6
$2.9
$2.4
$2.4
$2.3
$2.1
$1.6
$1.4
$1.3
$1.2
$1.2
$0.8
$0.8
BK1
WFC5
BAC2
JPM3,4 $2.6
UBS2
MS2
BLK1
GS5
Allianz1
DB5
CS2,6
NTRS7 $0.5
TROW1
BEN1
$18.3
$18.0
$11.4
$9.6
$9.1
$7.6
$6.2
$6.0
$4.2
$3.9
$12.1
$15.8
$17.4
$3.0 $15.1
NTRS8 $2.0
BK
TROW
BLK
JPM3
WFC
MS
BAC
UBS
DB
GS
BEN
Allianz8
CS6
$3.2 JPM3 $4.5 $1.3
UBS
MS $3.8
BAC $4.1
$4.2
$4.6 BLK
BK
NTRS8 $0.7
DB $1.4
GS8 $1.4
CS6 $2.0
TROW $2.0
Allianz8 $2.6
BEN $2.9
WFC $3.7
$1.1
AM CWM
AM CWM
AM CWM
21

A S
S E
T
M A
N A
G E
M E
N T
Growth
targets
Breadth and depth of offering Top investment performance
Diverse global client base JPMC franchise
We are uniquely positioned in the industry and poised for continued growth
AM
GIM
GWM
Uniquely diverse presence across asset classes and
client channels around the world
Continually evolving offering, including 40 new MF
products and >20 new GWM alts offerings
Unmatched number of 4/5-star funds in largest US
and international categories
>95% retention rate for senior PM talent
60% of world’s largest pension funds, sovereign
wealth funds, and central banks
Serve entire wealth spectrum, from retail investors
to multi-billionaires
Premier brand and deep talent bench
Revenue and expense synergies with Corporate and
other LOBs
Pretax margin
30%+
Revenue
+5-10% p.a
Pretax income
+10-15% p.a.
ROE
25%+
LT AUM flows
+4-6%
Client assets $2T $3T Revenue $12B $15B Pretax income $3B $5B
Medium-term guidance
22

A S
S E
T
M A
N A
G E
M E
N T
Notes appendix
Page 1
1. The “% of 10-year LT mutual fund AUM in top 2 quartiles” analysis represents the proportion of assets in mutual funds that are ranked in the
top 2 quartiles of their respective peer category on a 10-year basis as of December 31, 2015. The sources of these percentile rankings, peer
category definitions for each fund and the asset values used in the calculations are: Lipper (U.S. and Taiwan-domiciled funds), Morningstar
(UK, Luxembourg and Hong Kong-domiciled funds), Nomura (Japan-domiciled funds), and FundDoctor (South Korea-domiciled funds). The
analysis includes only Global Investment Management retail open-ended mutual funds that are ranked by the aforementioned sources. The
analysis is based on percentile rankings at the share class level for U.S. domiciled funds, at the ‘primary share class’ level for Luxembourg,
UK, and Hong Kong-domiciled funds and at the aggregate fund level for all other funds. The ‘primary share class’ is defined by Morningstar
and denotes the share class considered the best proxy for the fund. Where peer group rankings given for a fund are in more than one 'primary
share class' territory both rankings are included to reflect local market competitiveness (applies to ‘Offshore Territories’ and ‘HK SFC
Authorized’ funds only). The analysis excludes money market funds, Undiscovered Managers Fund, and Brazil and India-domiciled
funds. The asset values were redenominated into U.S. dollars using exchange rates from the aforementioned sources. The analysis pertains
to percentage of assets under management, not percentage of funds. The performance data could have been different if all funds/accounts
would have been included. Past performance is not indicative of future performance, which may vary
Page 2
1. The “mutual funds with a 4/5 star rating” analysis is sourced from Morningstar for all funds with the exception of Japan-domiciled funds;
Nomura was used for Japan-domiciled funds. The analysis includes both Global Investment Management and Global Wealth Management
open-ended funds that are rated by the aforementioned sources. The share class with the highest Morningstar star rating represents its
respective fund. The Nomura star rating represents the aggregate fund. Other share classes may have different performance characteristics
and may have different ratings; the highest rated share class may not be available to all investors. All star ratings sourced from Morningstar
reflect the Morningstar Overall RatingTM. For Japan-domiciled funds, the star rating is based on the Nomura 3-year star rating. Funds with
fewer than three years of history are not rated by Morningstar nor Nomura and hence excluded from this analysis. Other funds which do not
have a rating are also excluded from this analysis. Ratings are based on past performance and are not indicative of future results
23

A S
S E
T
M A
N A
G E
M E
N T
Notes appendix
Page 6
Source: Company filings, J.P. Morgan estimates
Note: Allianz, CS, DB, and UBS figures converted at average exchange rate.
1. Long-term AUM
2. Long-term AUM, administration, brokerage, custody, and deposit
3. Long-term AUM, brokerage, and deposit
4. Long-term AUM, fee-generating brokerage, and deposits in fee-generating brokerage accounts
5. Long-term AUM and brokerage
6. Total AUM, Brokerage, and Deposit
7. Includes client asset flows attributable to wealth and asset management units
8. Total AUM
9. Includes 3rd party AUM flows only. 2015 figures exclude re-invested dividends (including capital gains) from existing clients
Page 9
1. The “% of 10-year LT mutual fund AUM in top 2 quartiles” analysis represents the proportion of assets in mutual funds that are ranked in the
top 2 quartiles of their respective peer category on a 10-year basis as of December 31, 2015. The sources of these percentile rankings, peer
category definitions for each fund and the asset values used in the calculations are: Lipper (U.S. and Taiwan-domiciled funds), Morningstar
(UK, Luxembourg and Hong Kong-domiciled funds), Nomura (Japan-domiciled funds), and FundDoctor (South Korea-domiciled funds). The
analysis includes only Global Investment Management retail open-ended mutual funds that are ranked by the aforementioned sources. The
analysis is based on percentile rankings at the share class level for U.S. domiciled funds, at the ‘primary share class’ level for Luxembourg,
UK, and Hong Kong-domiciled funds and at the aggregate fund level for all other funds. The ‘primary share class’ is defined by Morningstar
and denotes the share class considered the best proxy for the fund. Where peer group rankings given for a fund are in more than one 'primary
share class' territory both rankings are included to reflect local market competitiveness (applies to ‘Offshore Territories’ and ‘HK SFC
Authorized’ funds only). The analysis excludes money market funds, Undiscovered Managers Fund, and Brazil and India-domiciled
funds. The asset values were redenominated into U.S. dollars using exchange rates from the aforementioned sources. The analysis pertains
to percentage of assets under management, not percentage of funds. The performance data could have been different if all funds/accounts
would have been included. Past performance is not indicative of future performance, which may vary
24

A S
S E
T
M A
N A
G E
M E
N T
Notes appendix
Page 10
1. The “% of AUM over peer median” analysis represents the proportion of assets in mutual funds that are ranked above their respective peer
category median on 3, 5, and 10 year basis as of December 31, 2015. The sources of these percentile rankings, peer category definitions for
each fund and the asset values used in the calculations are: Lipper (U.S. and Taiwan-domiciled funds), Morningstar (UK, Luxembourg and
Hong Kong-domiciled funds), Nomura (Japan-domiciled funds), and FundDoctor (South Korea-domiciled funds). The analysis includes only
Global Investment Management retail open-ended mutual funds that are ranked by the aforementioned sources. The analysis is based on
percentile rankings at the share class level for U.S. domiciled funds, at the ‘primary share class’ level for Luxembourg, UK, and Hong Kong-
domiciled funds and at the aggregate fund level for all other funds. The ‘primary share class’ is defined by Morningstar and denotes the share
class considered the best proxy for the fund. Where peer group rankings given for a fund are in more than one 'primary share class' territory
both rankings are included to reflect local market competitiveness (applies to ‘Offshore Territories’ and ‘HK SFC Authorized’ funds only). The
equity, fixed income and multi-asset solutions and all other classifications used in the illustration are based on J.P. Morgan’s own
categorization. The analysis excludes money market funds, Undiscovered Managers Fund, and Brazil and India-domiciled funds. The asset
values were redenominated into U.S. dollars using exchange rates from the aforementioned sources. The analysis pertains to percentage of
assets under management, not percentage of funds. The performance data could have been different if all funds/accounts would have been
included. Past performance is not indicative of future performance, which may vary
2. Fund performance vs each fund’s respective Morningstar Category as of 12/31/15. Fund performance is net of fees. Past performance is not
indicative of future performance, which may vary
3. Source: Strategic Insight Simfund
4. Select share class (40-Act fund)
5. A share class (SICAV)
6. Institutional share class (40-Act fund)
7. SmartRetirement 2030 Institutional class (40-Act fund)
8. Includes the 3 ranked Alternatives retail open-ended mutual fund assets not included in above asset class split (Highbridge US STEEP,
Highbridge Europe STEEP, and Security Capital US Real Estate Securities)
25

A S
S E
T
M A
N A
G E
M E
N T
Notes appendix
Page 11
(Top Middle) Chart shows performance of quintiles (as determined by J.P. Morgan Investment Management U.S. Equity research universe)
versus the S&P 500 Index, with quintiles rebalanced monthly. Quintile performance represents the annualized returns of quintiles vs. the
annualized return of the S&P 500 over the full time period. Quintile performance results have certain inherent limitations. Unlike an actual
performance record, quintile results do not represent actual trading, liquidity constraints, fee schedules and transaction costs. No representation is
being made that any portfolio will or is likely to achieve profits or losses similar to those shown. Past performance is not indicative of future results.
(Bottom) * As of December 31, 2015, the Large Cap Core Plus Fund (S-share) was ranked in the Morningstar Large Blend category for the
following time periods: 761 out of 1,644 funds for the trailing one year period, 102 out of 1,521 funds for the three year period, 331 out of 1,414
funds for the five year period and 20 out of 1,233 funds for the ten year period for returns. As of December 31, 2015, the US Equity Fund (I
Shares) was ranked 509 out of 1,644 funds for the trailing one-year period, 118 out of 1,521 funds for the trailing three-year period, 184 out of
1,414 funds for the trailing five-year period, and 50 out of 1,223 funds for the trailing ten-year period for fund returns in the Morningstar Large Cap
Blend category. As of December 31, 2015, the Disciplined Equity (I Shares) was ranked 1,104 out of 1,644 funds for the trailing one-year period,
324 out of 1,521 funds for the trailing three-year period, 196 out of 1,414 funds for the trailing five-year period, and 137 out of 1,223 funds for the
trailing ten-year period for fund returns in the Morningstar Large Cap Blend category. Different share classes will have different rankings. Past
performance is not indicative of future returns.
1. Based on five-year rolling excess performance (one month shifts) versus the S&P 500 TR USD over the trailing ten year period.. Fund and
index performance as of 12/31/15. Fund performance is net of fees. Past performance is not indicative of future performance, which may vary
Page 12
1. US Value-add Real Estate and benchmark returns are net, as of December 31, 2015; Private Equity performance represents IRR (Internal
Rate of Return) over the time periods shown and includes all investments for all funds, separate accounts and employee account, as of
September 30, 2015, net of underlying investment fees and expenses, gross of advisor fees. Diversified Hedge Fund and benchmark returns
are net, as of December 31, 2015. Alternative Beta and benchmark returns are net (in EUR), as of December 31, 2015; fund run in seed
starting July 2009 and opened for investment in 2011
26

A S
S E
T
M A
N A
G E
M E
N T
Notes appendix
Page 13
1. Excludes Advisory
2. Data for industry CAGR available for 2010-2014 only
3. Active only; excludes Fund of Funds; AUM / flows grouped at Portfolio Level (inclusive of all share classes); excludes Global Macro Opps
fund, as it is considered internally as Liquid Alternative and not applicable in broader category
4. International / Offshore only; UCITS only; active only; excludes Fund of Funds; AUM / flows group at Portfolio Level (inclusive of all share
classes)
5. US only; target date asset allocation active only; underlying holdings can be passive; AUM / flows group at Manager Level (inclusive of all
funds and share classes)
6. JPM Global Allocation Fund does not have a 5-year track record, so 3-year performance percentile rank shown
7. Percentile reflects performance of SmartRetirement 2030 Institutional class fund
Page 14
1. Only includes categories that have Morningstar star ratings
2. Represents United States-domiciled long-term open-end mutual funds. Excludes index mutual funds, exchange traded funds, closed-end
funds and money market funds. Funds without tickers are not included.
3. Top US Solutions category (Target Date) is amalgamation of all Target Date year categories
4. Represents funds long-term open-end funds domiciled in Luxembourg or Ireland, which comprise approximately 96 percent of total fund
assets in international/offshore domiciles (per Strategic Insight as of 12/31/15) and generally can be cross-border marketed in the EU under
the UCITS directive. Excludes index mutual funds, exchange traded funds, closed-end funds and money markets funds.
5. Fund count includes non-40-Act/SICAV vehicles. This analysis is sourced from Morningstar for all funds with the exception of Japan-domiciled
funds; Nomura was used for Japan-domiciled funds. For JPM, the analysis includes both Global Investment Management and Global Wealth
Management open-ended funds that are rated by the aforementioned sources. The share class with the highest Morningstar star rating
represents its respective fund. The Nomura star rating represents the aggregate fund. Other share classes may have different performance
characteristics and may have different ratings; the highest rated share class may not be available to all investors. All star ratings sourced from
Morningstar reflect the Morningstar Overall RatingTM. For Japan-domiciled funds, the star rating is based on the Nomura 3-year star rating.
Funds with fewer than three years of history are not rated by Morningstar nor Nomura and hence excluded from this analysis. Other funds
which do not have a rating are also excluded from this analysis. Ratings are based on past performance and are not indicative of future results
27
A S
S E
T
M A
N A
G E
M E
N T
Notes appendix
Page 21
Note: Allianz, CS, DB, and UBS figures converted at average exchange rate. Balances presented at end of period exchange rate.
1. Total AUM; for Allianz reflects total AUM from third-parties
2. Total AUM, brokerage, custody, and deposit; for CS as of 09/30/15 as FY2015 disclosure not yet available
3. Includes GIM and GWM with CWM reflecting extended segment (includes CPC and CIS clients)
4. Total AUM, administration, brokerage, custody, and deposit
5. Total AUM, brokerage, and deposit
6. Excludes revenue, pretax income, and client assets attributable to Corporate and Institutional Banking
7. Wealth Management Assets under Custody
8. Reflects LTM through 3Q15 as 2015 full disclosure not yet available; Allianz (includes PIMCO) revenue is presented gross of fee and
commission expenses to ensure comparability with peers
28
Forward-looking statements
This presentation contains forward-looking statements within the meaning of the Private Securities
Litigation Reform Act of 1995. These statements are based on the current beliefs and expectations
of JPMorgan Chase & Co.’s management and are subject to significant risks and uncertainties.
Actual results may differ from those set forth in the forward-looking statements. Factors that could
cause JPMorgan Chase & Co.’s actual results to differ materially from those described in the
forward-looking statements can be found in JPMorgan Chase & Co.’s Annual Report on Form 10-K
for the year ended December 31, 2015, filed with the Securities and Exchange Commission and
available on JPMorgan Chase & Co.’s website https://www.jpmorganchase.com/corporate/investor-
relations/investor-relations and on the Securities and Exchange Commission’s website
(www.sec.gov). JPMorgan Chase & Co. does not undertake to update the forward-looking
statements to reflect the impact of circumstances or events that may arise after the date of the
forward-looking statements.