
CYH Pitchbook
32
1 Community Health Systems, Inc. Strategic Discussion Materials | April 17, 2015
-
Upload
richard-cao -
Category
Business
-
view
71 -
download
4
Transcript of CYH Pitchbook
1
Community Health Systems, Inc.
Strategic Discussion Materials | April 17, 2015

2
Keith Radzik is Co-Global Head of Healthcare Investment Banking at Rightview
Partners. Before joining Rightview, Keith majored in Finance and Entrepreneurship at
Indiana University – Kelley School of Business. Prior work experience includes an internship at Granite Creek Partners, LLP in
Chicago, IL. Keith plans to study abroad at the London School of Economics
while enrolling in two banking and valuation classes.
Clayton Stoker is Co-Global Head of Healthcare Investment Banking at Rightview
Partners. Before joining Rightview, Clayton majored in Finance and Accounting at Indiana
University – Kelley School of Business. Prior work experiences include internships at, Smith Moore, The Audit Group and
Tobin & Company Investment Banking Group. This summer he will be joining
Janes Capital Partners in Irvine, California doing Aerospace and Defense M&A.
Rightview Partners
Richard Cao is a Managing Director in Healthcare Investment Banking at
Rightview Partners. Before joining Rightview, Richard majored in Finance and Accounting at Indiana
University – Kelley School of Business. Prior work experience includes an internship at Systemax, Inc. in Port
Washington, NY. Richard plans to return to work at Systemax this summer in
their Industrials group.
Nathan Upchurch is a Managing Director in Mergers and Acquisitions at
Rightview Partners. Before joining Rightview, Nathan majored in Finance and Entrepreneurship at
Indiana University – Kelley School of Business. Prior work experience includes Project Manager at MEU Holding, LLC in Appleton,
WI. Nathan will be joining Trilliant Solutions this summer as an intern.
3
Table of Contents
I. Executive Summary
4
II. Overview of the Hospital Industry
6
III. Community Health Systems Overview
9
IV. Valuation Summary 12
V. Strategic Recommendation
15
VI. Merger Model
19
VII. Appendix 24
4
I. Executive Summary
5
Executive Summary
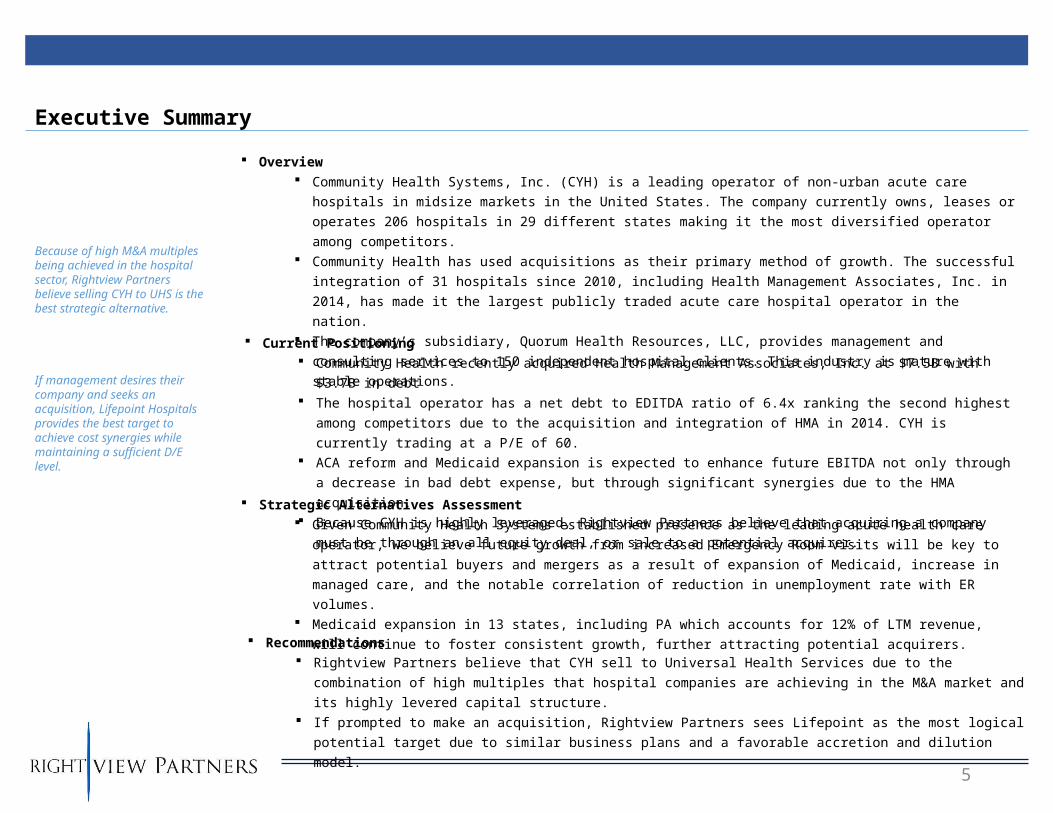
Because of high M&A multiples being achieved in the hospital sector, Rightview Partners believe selling CYH to UHS is the best strategic alternative.
If management desires their company and seeks an acquisition, Lifepoint Hospitals provides the best target to achieve cost synergies while maintaining a sufficient D/E level.
Overview Community Health Systems, Inc. (CYH) is a leading operator of non-urban acute care hospitals in midsize
markets in the United States. The company currently owns, leases or operates 206 hospitals in 29
different states making it the most diversified operator among competitors. Community Health has used acquisitions as their primary method of growth. The successful integration of
31 hospitals since 2010, including Health Management Associates, Inc. in 2014, has made it the largest
publicly traded acute care hospital operator in the nation. The company’s subsidiary, Quorum Health Resources, LLC, provides management and consulting services
to 150 independent hospital clients. This industry is mature with stable operations.
Current Positioning Community Health recently acquired Health Management Associates, Inc. at $7.5B with $3.7B in debt The hospital operator has a net debt to EDITDA ratio of 6.4x ranking the second highest among
competitors due to the acquisition and integration of HMA in 2014. CYH is currently trading at a P/E of 60. ACA reform and Medicaid expansion is expected to enhance future EBITDA not only through a decrease in
bad debt expense, but through significant synergies due to the HMA acquisition. Because CYH is highly leveraged, Rightview Partners believe that acquiring a company must be through
an all equity deal, or sale to a potential acquirer.
Strategic Alternatives Assessment Given Community Health Systems established presence as the leading acute health care operator, we
believe future growth from increased Emergency Room visits will be key to attract potential buyers and
mergers as a result of expansion of Medicaid, increase in managed care, and the notable correlation of
reduction in unemployment rate with ER volumes. Medicaid expansion in 13 states, including PA which accounts for 12% of LTM revenue, will continue to
foster consistent growth, further attracting potential acquirers. Recommendations
Rightview Partners believe that CYH sell to Universal Health Services due to the combination of high
multiples that hospital companies are achieving in the M&A market and its highly levered capital
structure. If prompted to make an acquisition, Rightview Partners sees Lifepoint as the most logical potential target
due to similar business plans and a favorable accretion and dilution model.
6
II. Hospital Services Industry
7
Macroeconomic Landscape
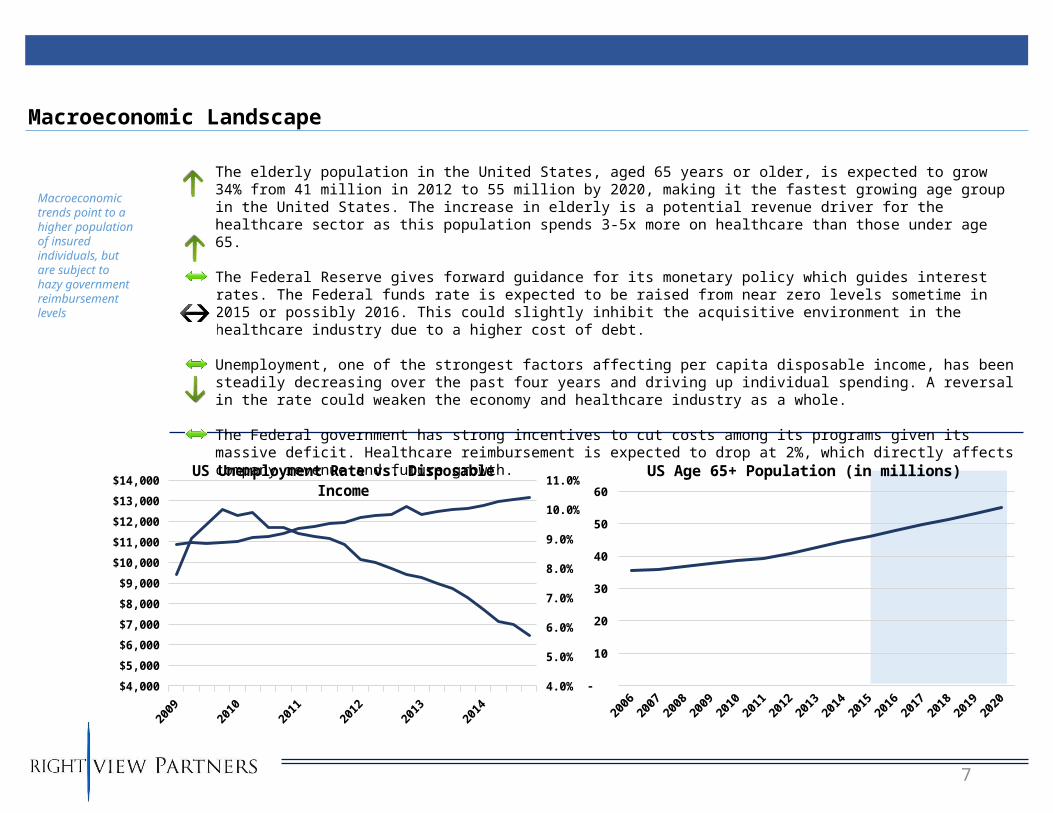
Macroeconomic trends point to a higher population of insured individuals, but are subject to hazy government reimbursement levels
2006
2007
2008
2009
2010
2011
2012
2013
2014
2015
2016
2017
2018
2019
2020
-
10
20
30
40
50
60
US Age 65+ Population (in millions)
$4,000
$5,000
$6,000
$7,000
$8,000
$9,000
$10,000
$11,000
$12,000
$13,000
$14,000
4.0%
5.0%
6.0%
7.0%
8.0%
9.0%
10.0%
11.0%US Unemployment Rate vs. Disposable
Income
The elderly population in the United States, aged 65 years or older, is expected to grow 34% from 41 million in 2012 to 55 million by 2020, making it the fastest growing age group in the United States. The increase in elderly is a potential revenue driver for the healthcare sector as this population spends 3-5x more on healthcare than those under age 65.
The Federal Reserve gives forward guidance for its monetary policy which guides interest rates. The Federal funds rate is expected to be raised from near zero levels sometime in 2015 or possibly 2016. This could slightly inhibit the acquisitive environment in the healthcare industry due to a higher cost of debt.
Unemployment, one of the strongest factors affecting per capita disposable income, has been steadily decreasing over the past four years and driving up individual spending. A reversal in the rate could weaken the economy and healthcare industry as a whole.
The Federal government has strong incentives to cut costs among its programs given its massive deficit. Healthcare reimbursement is expected to drop at 2%, which directly affects company revenue and future growth.
8
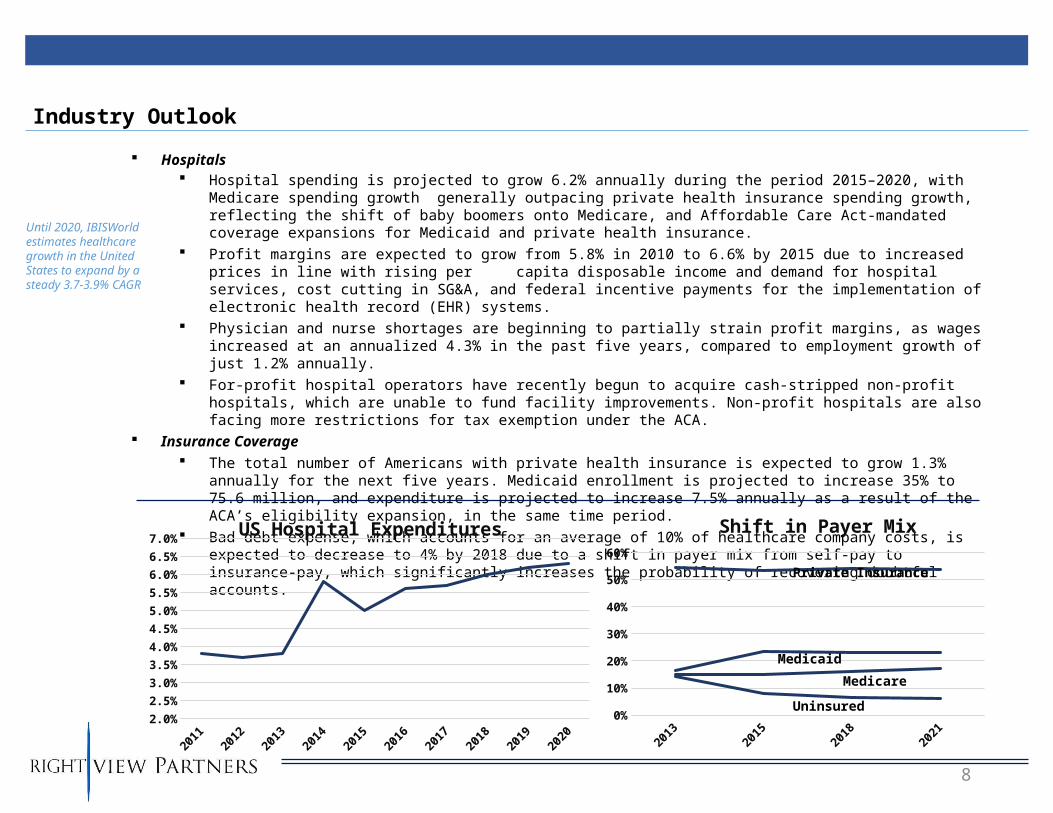
Hospitals Hospital spending is projected to grow 6.2% annually during the period 2015–2020, with Medicare
spending growth generally outpacing private health insurance spending growth, reflecting the shift of baby boomers onto Medicare, and Affordable Care Act-mandated coverage expansions for Medicaid and private health insurance.
Profit margins are expected to grow from 5.8% in 2010 to 6.6% by 2015 due to increased prices in line with rising per capita disposable income and demand for hospital services, cost cutting in SG&A, and federal incentive payments for the implementation of electronic health record (EHR) systems.
Physician and nurse shortages are beginning to partially strain profit margins, as wages increased at an annualized 4.3% in the past five years, compared to employment growth of just 1.2% annually.
For-profit hospital operators have recently begun to acquire cash-stripped non-profit hospitals, which are unable to fund facility improvements. Non-profit hospitals are also facing more restrictions for tax exemption under the ACA.
Insurance Coverage The total number of Americans with private health insurance is expected to grow 1.3% annually for the
next five years. Medicaid enrollment is projected to increase 35% to 75.6 million, and expenditure is projected to increase 7.5% annually as a result of the ACA’s eligibility expansion, in the same time period.
Bad debt expense, which accounts for an average of 10% of healthcare company costs, is expected to decrease to 4% by 2018 due to a shift in payer mix from self-pay to insurance-pay, which significantly increases the probability of recovering doubtful accounts.
Until 2020, IBISWorld estimates healthcare growth in the United States to expand by a steady 3.7-3.9% CAGR
Industry Outlook
2011
2012
2013
2014
2015
2016
2017
2018
2019
2020
2.0%
2.5%
3.0%
3.5%
4.0%
4.5%
5.0%
5.5%
6.0%
6.5%
7.0%US Hospital Expenditures
2013
2015
2018
2021
0%
10%
20%
30%
40%
50%
60%
Shift in Payer Mix
Private Insurance
Medicaid
Medicare
Uninsured
9
III. Community Health Systems Overview
10
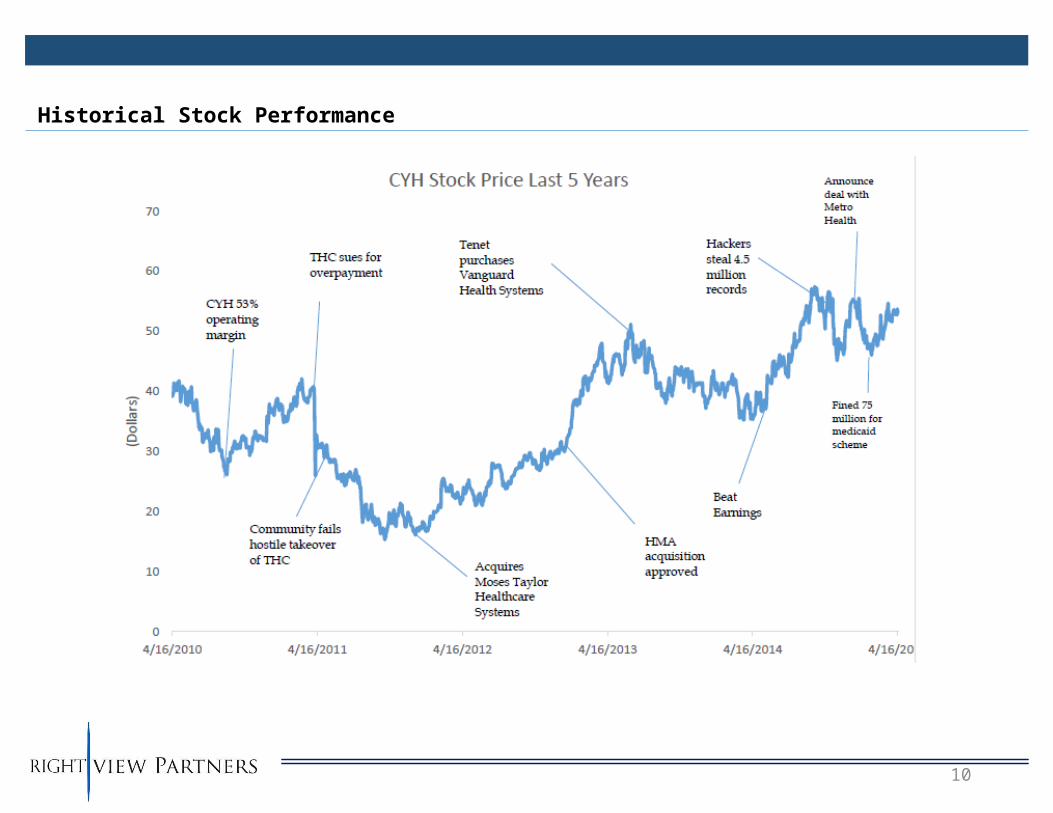
Historical Stock Performance
11
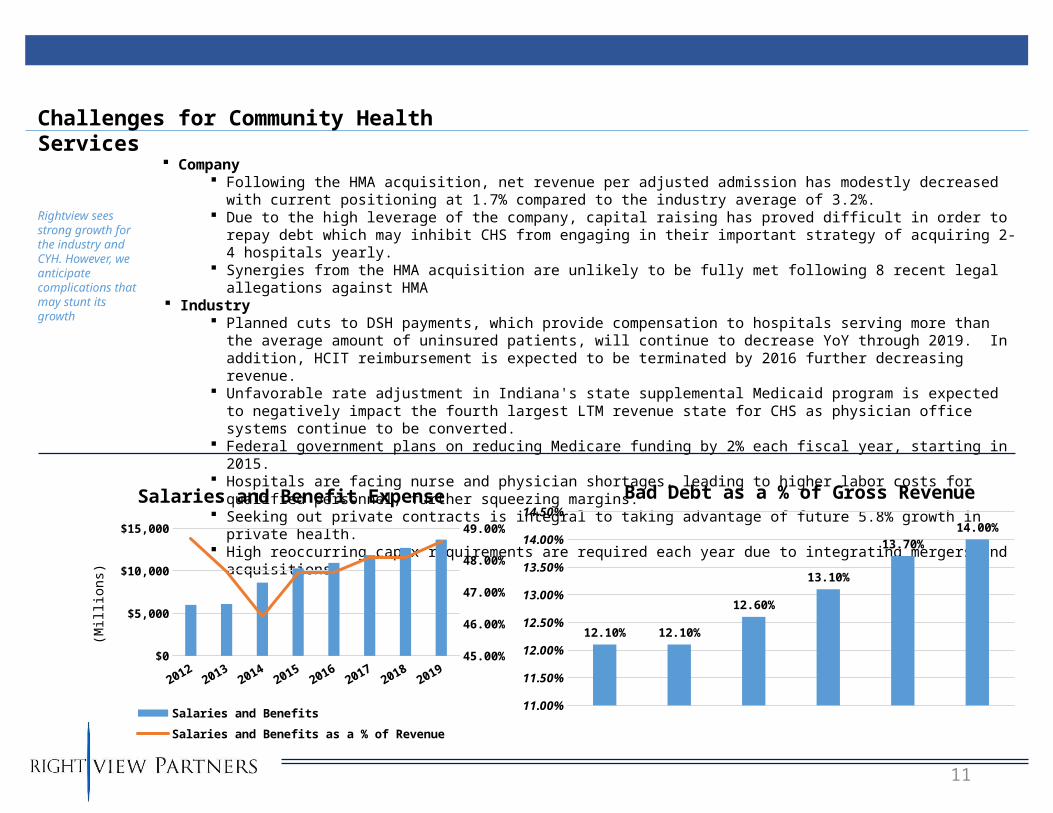
Rightview sees strong growth for the industry and CYH. However, we anticipate complications that may stunt its growth
Company Following the HMA acquisition, net revenue per adjusted admission has modestly decreased with current
positioning at 1.7% compared to the industry average of 3.2%. Due to the high leverage of the company, capital raising has proved difficult in order to repay debt which
may inhibit CHS from engaging in their important strategy of acquiring 2-4 hospitals yearly. Synergies from the HMA acquisition are unlikely to be fully met following 8 recent legal allegations against
HMA Industry
Planned cuts to DSH payments, which provide compensation to hospitals serving more than the average amount of uninsured patients, will continue to decrease YoY through 2019. In addition, HCIT reimbursement is expected to be terminated by 2016 further decreasing revenue.
Unfavorable rate adjustment in Indiana's state supplemental Medicaid program is expected to negatively impact the fourth largest LTM revenue state for CHS as physician office systems continue to be converted.
Federal government plans on reducing Medicare funding by 2% each fiscal year, starting in 2015. Hospitals are facing nurse and physician shortages, leading to higher labor costs for qualified personnel,
further squeezing margins. Seeking out private contracts is integral to taking advantage of future 5.8% growth in private health. High reoccurring capex requirements are required each year due to integrating mergers and acquisitions.
Challenges for Community Health Services
11.00%
11.50%
12.00%
12.50%
13.00%
13.50%
14.00%
14.50%
12.10% 12.10%
12.60%
13.10%
13.70%14.00%
Bad Debt as a % of Gross Revenue
20122013
20142015
20162017
20182019
$0
$2,000
$4,000
$6,000
$8,000
$10,000
$12,000
$14,000
$16,000
45.00%
45.50%
46.00%
46.50%
47.00%
47.50%
48.00%
48.50%49.00%
Salaries and Benefit Expense
Salaries and Benefits
Salaries and Benefits as a % of Revenue
(Millions)
12
IV. Valuation Summary
13
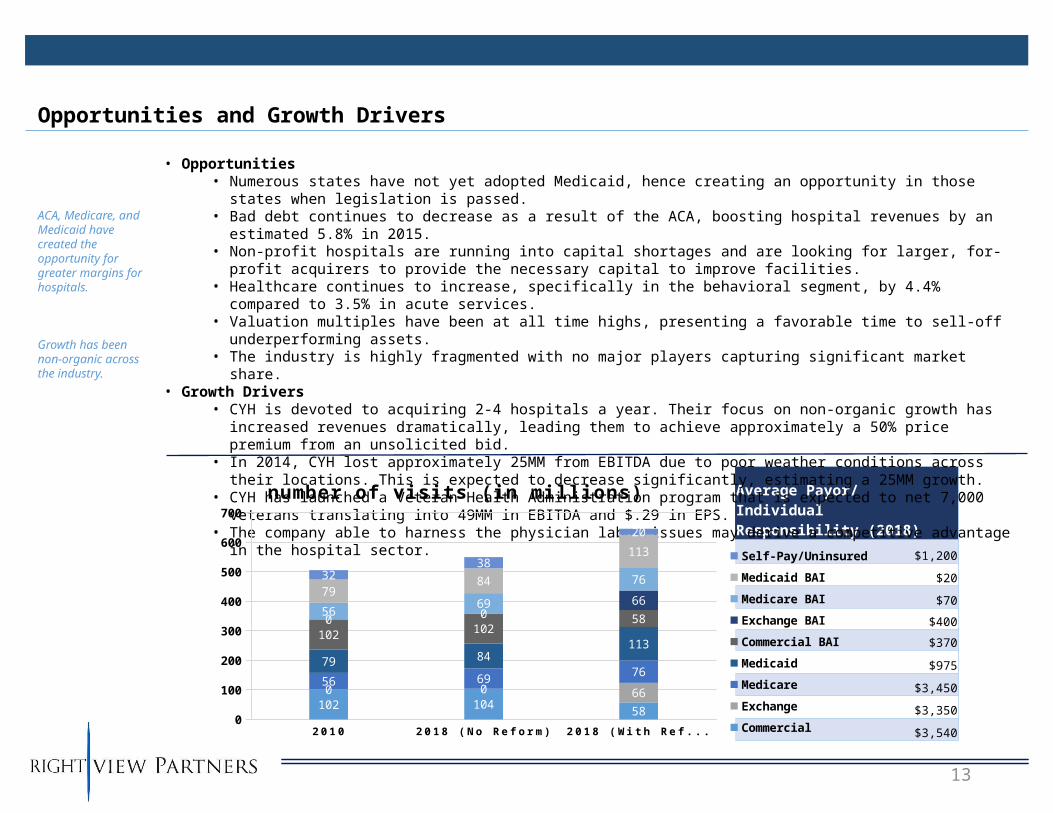
Average Payor/Individual Responsibility (2018)
$1,200
$20
$70
$400
$370
$975
$3,450
$3,350
$3,540
• Opportunities• Numerous states have not yet adopted Medicaid, hence creating an opportunity in those states when
legislation is passed.• Bad debt continues to decrease as a result of the ACA, boosting hospital revenues by an estimated 5.8% in
2015.• Non-profit hospitals are running into capital shortages and are looking for larger, for-profit acquirers to
provide the necessary capital to improve facilities.• Healthcare continues to increase, specifically in the behavioral segment, by 4.4% compared to 3.5% in
acute services.• Valuation multiples have been at all time highs, presenting a favorable time to sell-off underperforming
assets.• The industry is highly fragmented with no major players capturing significant market share.
• Growth Drivers• CYH is devoted to acquiring 2-4 hospitals a year. Their focus on non-organic growth has increased
revenues dramatically, leading them to achieve approximately a 50% price premium from an unsolicited bid.
• In 2014, CYH lost approximately 25MM from EBITDA due to poor weather conditions across their locations. This is expected to decrease significantly, estimating a 25MM growth.
• CYH has launched a Veteran Health Administration program that is expected to net 7,000 veterans translating into 49MM in EBITDA and $.29 in EPS.
• The company able to harness the physician labor issues may derive a competitive advantage in the hospital sector.
ACA, Medicare, and Medicaid have created the opportunity for greater margins for hospitals.
Growth has been non-organic across the industry.
Opportunities and Growth Drivers
2 0 1 0 2 0 1 8 (No Ref o rm) 2 0 1 8 (W i th Ref o rm)
0
100
200
300
400
500
600
700
102 104 58
0 0 6656 69 7679 84
113102 102
580 066
5669
7679
84
113
3238
20
number of visits (in mill ions)
Self-Pay/Uninsured
Medicaid BAI
Medicare BAI
Exchange BAI
Commercial BAI
Medicaid
Medicare
Exchange
Commercial
14
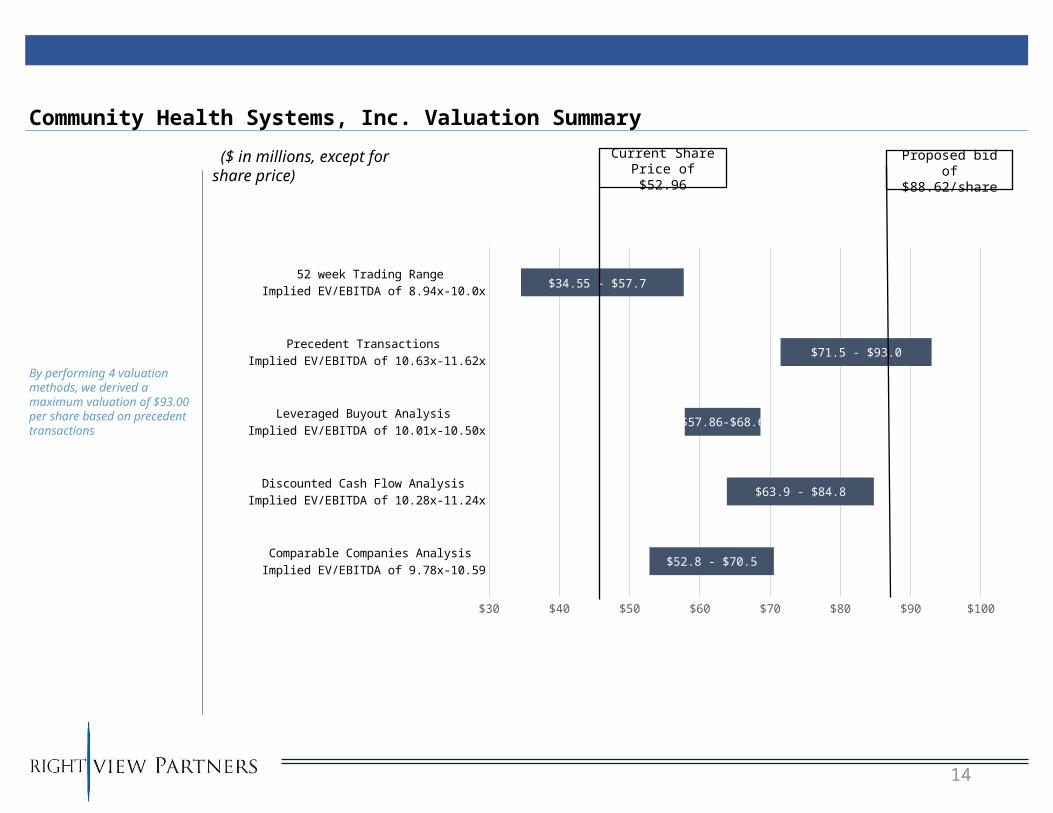
Community Health Systems, Inc. Valuation Summary
By performing 4 valuation methods, we derived a maximum valuation of $93.00 per share based on precedent transactions
($ in millions, except for share price)
Comparable Companies Analysis Implied EV/EBITDA of 9.78x-10.59
Discounted Cash Flow Analysis Implied EV/EBITDA of 10.28x-11.24x
Leveraged Buyout Analysis Implied EV/EBITDA of 10.01x-10.50x
Precedent Transactions Implied EV/EBITDA of 10.63x-11.62x
52 week Trading Range Implied EV/EBITDA of 8.94x-10.0x
$30 $40 $50 $60 $70 $80 $90 $100
$52.8 - $70.5
$63.9 - $84.8
$57.86-$68.6
$71.5 - $93.0
$34.55 - $57.7
Current Share Price of $52.96
Proposed bid of $88.62/share
15
V. Strategic Recommendation
1616
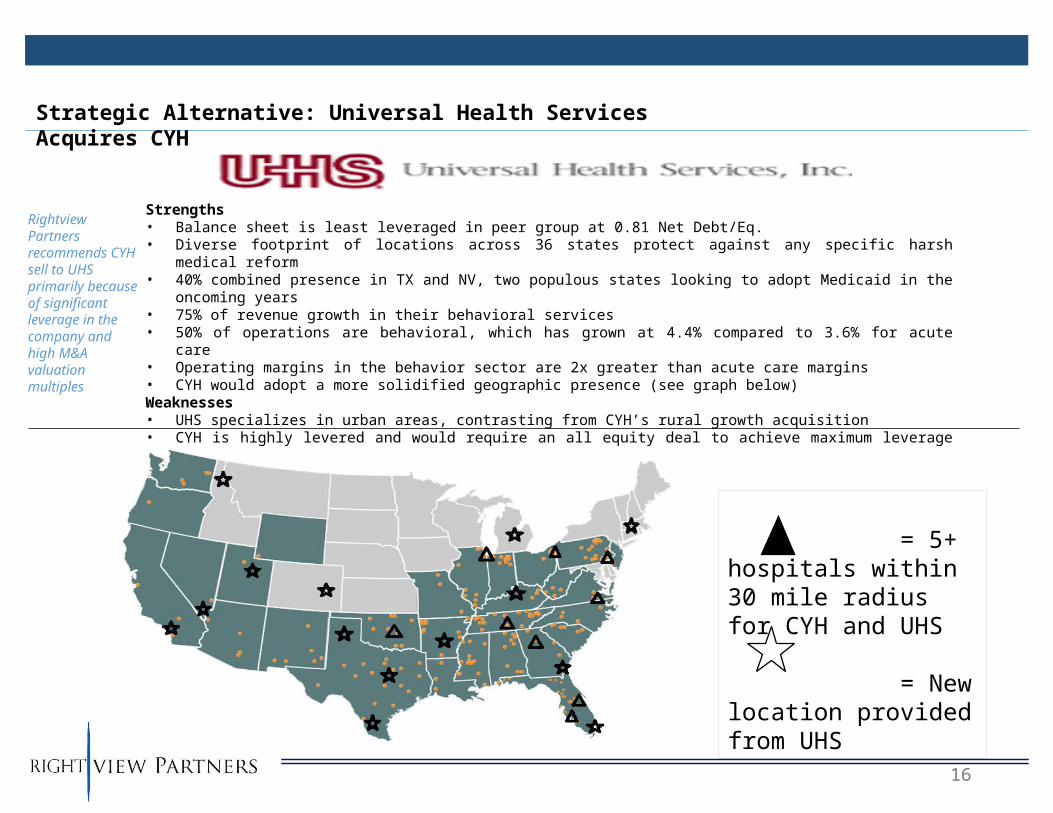
Strengths• Balance sheet is least leveraged in peer group at 0.81 Net Debt/Eq.• Diverse footprint of locations across 36 states protect against any specific harsh medical reform• 40% combined presence in TX and NV, two populous states looking to adopt Medicaid in the oncoming
years• 75% of revenue growth in their behavioral services• 50% of operations are behavioral, which has grown at 4.4% compared to 3.6% for acute care• Operating margins in the behavior sector are 2x greater than acute care margins• CYH would adopt a more solidified geographic presence (see graph below)Weaknesses• UHS specializes in urban areas, contrasting from CYH’s rural growth acquisition • CYH is highly levered and would require an all equity deal to achieve maximum leverage at 6.5x from the
current 6.41x
Strategic Alternative: Universal Health Services Acquires CYH
= 5+ hospitals within 30 mile radius for CYH and UHS
= New location provided from UHS
Rightview Partners recommends CYH sell to UHS primarily because of significant leverage in the company and high M&A valuation multiples
1717
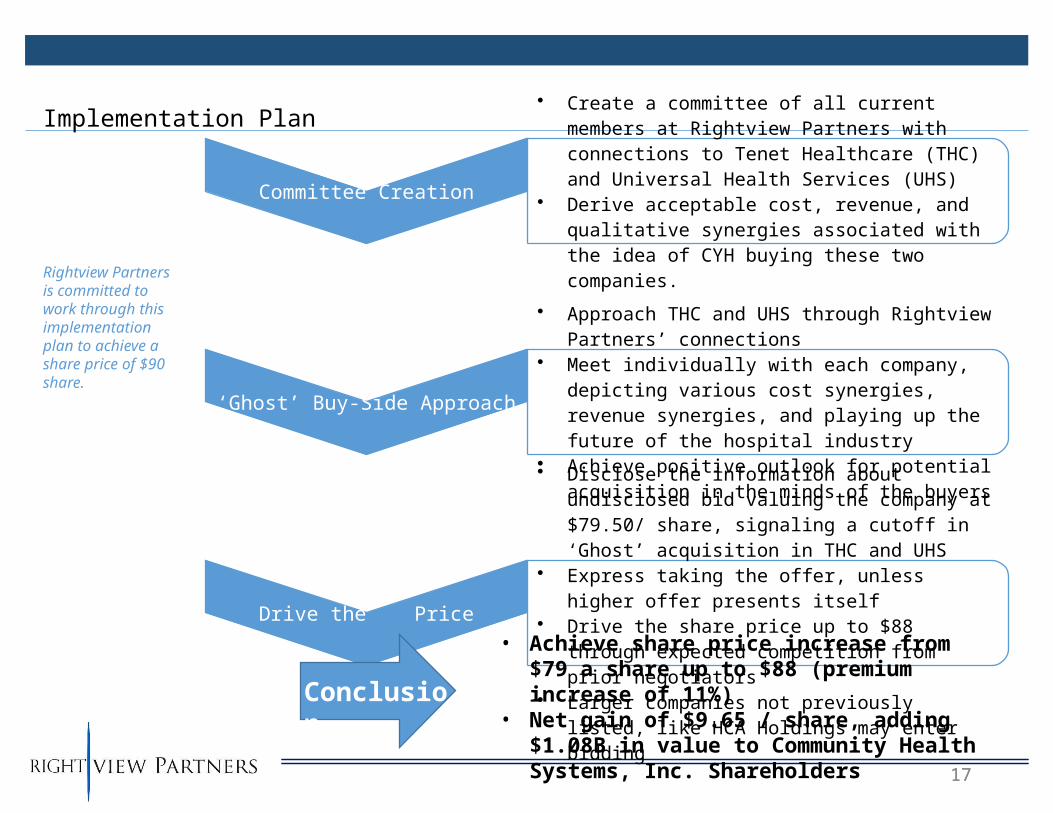
Implementation Plan
Committee Creation
• Create a committee of all current members at Rightview Partners with connections to Tenet Healthcare (THC) and Universal Health Services (UHS)
• Derive acceptable cost, revenue, and qualitative synergies associated with the idea of CYH buying these two companies.
‘Ghost’ Buy-Side Approach
• Approach THC and UHS through Rightview Partners’ connections
• Meet individually with each company, depicting various cost synergies, revenue synergies, and playing up the future of the hospital industry
• Achieve positive outlook for potential acquisition in the minds of the buyers
Drive the Price
• Disclose the information about undisclosed bid valuing the company at $79.50/ share, signaling a cutoff in ‘Ghost’ acquisition in THC and UHS
• Express taking the offer, unless higher offer presents itself
• Drive the share price up to $88 through expected competition from prior negotiators
• Larger companies not previously listed, like HCA Holdings may enter bidding
Rightview Partners is committed to work through this implementation plan to achieve a share price of $90 share.
Conclusion
• Achieve share price increase from $79 a share up to $88 (premium increase of 11%)
• Net gain of $9.65 / share, adding $1.08B in value to Community Health Systems, Inc. Shareholders
18
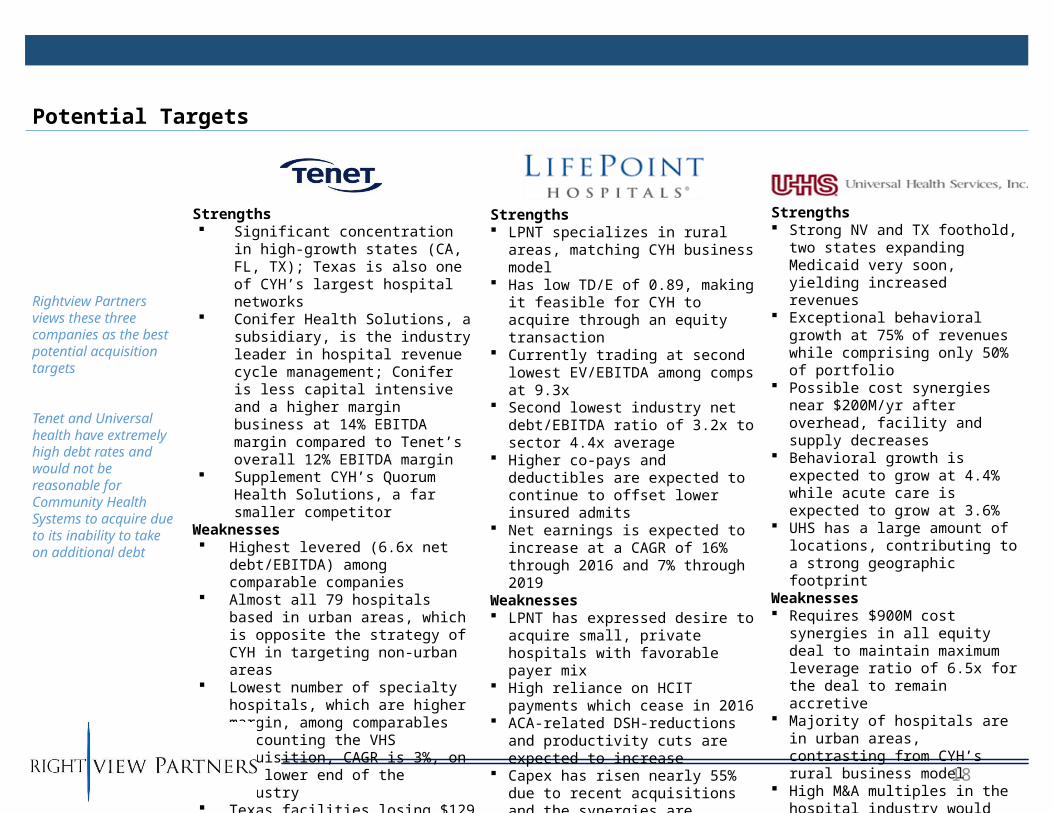
Strengths Significant concentration in
high-growth states (CA, FL, TX); Texas is also one of CYH’s largest hospital networks
Conifer Health Solutions, a subsidiary, is the industry leader in hospital revenue cycle management; Conifer is less capital intensive and a higher margin business at 14% EBITDA margin compared to Tenet’s overall 12% EBITDA margin
Supplement CYH’s Quorum Health Solutions, a far smaller competitor
Weaknesses Highest levered (6.6x net
debt/EBITDA) among comparable companies
Almost all 79 hospitals based in urban areas, which is opposite the strategy of CYH in targeting non-urban areas
Lowest number of specialty hospitals, which are higher margin, among comparables
Discounting the VHS acquisition, CAGR is 3%, on the lower end of the industry
Texas facilities losing $129 million a year since 2013
Rightview Partners views these three companies as the best potential acquisition targets
Tenet and Universal health have extremely high debt rates and would not be reasonable for Community Health Systems to acquire due to its inability to take on additional debt
Potential Targets
Strengths LPNT specializes in rural areas,
matching CYH business model Has low TD/E of 0.89, making it
feasible for CYH to acquire through an equity transaction
Currently trading at second lowest EV/EBITDA among comps at 9.3x
Second lowest industry net debt/EBITDA ratio of 3.2x to sector 4.4x average
Higher co-pays and deductibles are expected to continue to offset lower insured admits
Net earnings is expected to increase at a CAGR of 16% through 2016 and 7% through 2019
Weaknesses LPNT has expressed desire to
acquire small, private hospitals with favorable payer mix
High reliance on HCIT payments which cease in 2016
ACA-related DSH-reductions and productivity cuts are expected to increase
Capex has risen nearly 55% due to recent acquisitions and the synergies are expected to be realized later than anticipated
Strengths Strong NV and TX foothold,
two states expanding Medicaid very soon, yielding increased revenues
Exceptional behavioral growth at 75% of revenues while comprising only 50% of portfolio
Possible cost synergies near $200M/yr after overhead, facility and supply decreases
Behavioral growth is expected to grow at 4.4% while acute care is expected to grow at 3.6%
UHS has a large amount of locations, contributing to a strong geographic footprint
Weaknesses Requires $900M cost synergies
in all equity deal to maintain maximum leverage ratio of 6.5x for the deal to remain accretive
Majority of hospitals are in urban areas, contrasting from CYH’s rural business model
High M&A multiples in the hospital industry would require an expensive multiple
19
VI. Merger Model
20
Merger Assumptions
Assumptions
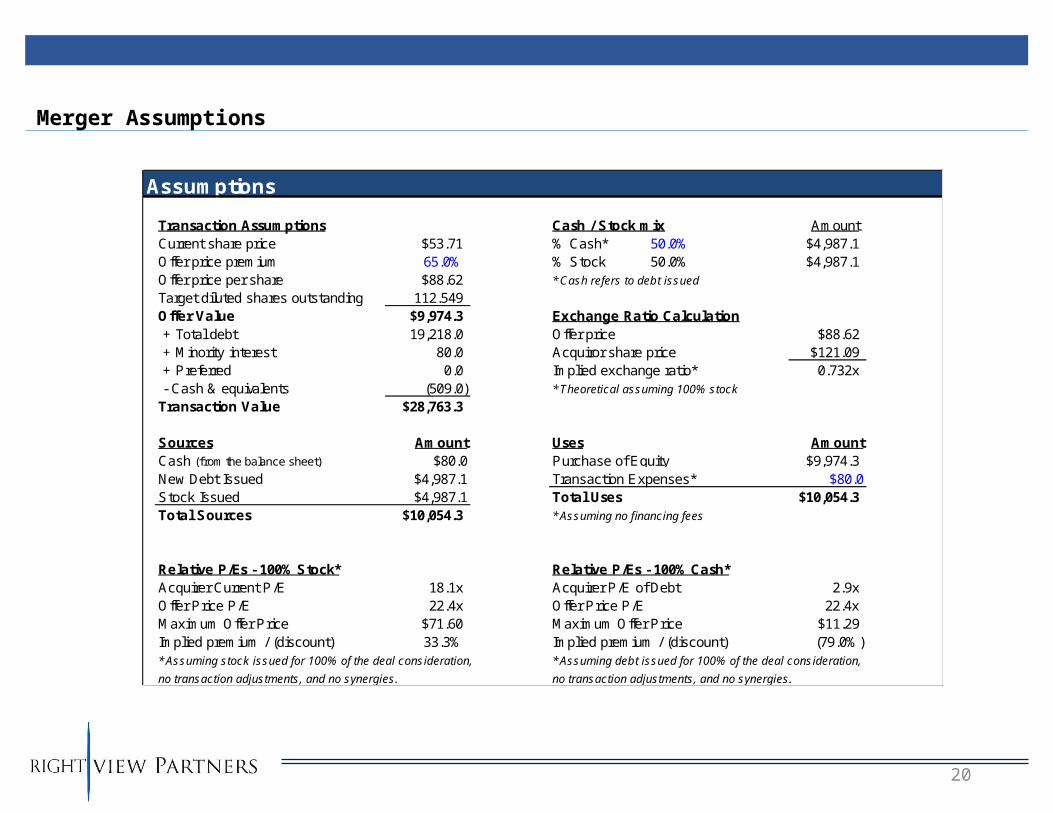
Transaction Assumptions Cash / Stock mix AmountCurrent share price $53.71 % Cash* 50.0% $4,987.1Offer price premium 65.0% % Stock 50.0% $4,987.1Offer price per share $88.62 * Cash refers to debt issued
Target diluted shares outstanding 112.549Offer Value $9,974.3 Exchange Ratio Calculation + Total debt 19,218.0 Offer price $88.62 + Minority interest 80.0 Acquiror share price $121.09 + Preferred 0.0 Implied exchange ratio* 0.732x - Cash & equivalents (509.0) * Theoretical assuming 100% stock
Transaction Value $28,763.3
Sources Amount Uses AmountCash (from the balance sheet) $80.0 Purchase of Equity $9,974.3New Debt Issued $4,987.1 Transaction Expenses* $80.0Stock Issued $4,987.1 Total Uses $10,054.3Total Sources $10,054.3 * Assuming no financing fees
Relative P/Es - 100% Stock* Relative P/Es - 100% Cash*Acquirer Current P/E 18.1x Acquirer P/E of Debt 2.9xOffer Price P/E 22.4x Offer Price P/E 22.4xMaximum Offer Price $71.60 Maximum Offer Price $11.29Implied premium / (discount) 33.3% Implied premium / (discount) (79.0%)* Assuming stock issued for 100% of the deal consideration, * Assuming debt issued for 100% of the deal consideration,
no transaction adjustments, and no synergies. no transaction adjustments, and no synergies.
21
Earnings Impact
Earnings Impact
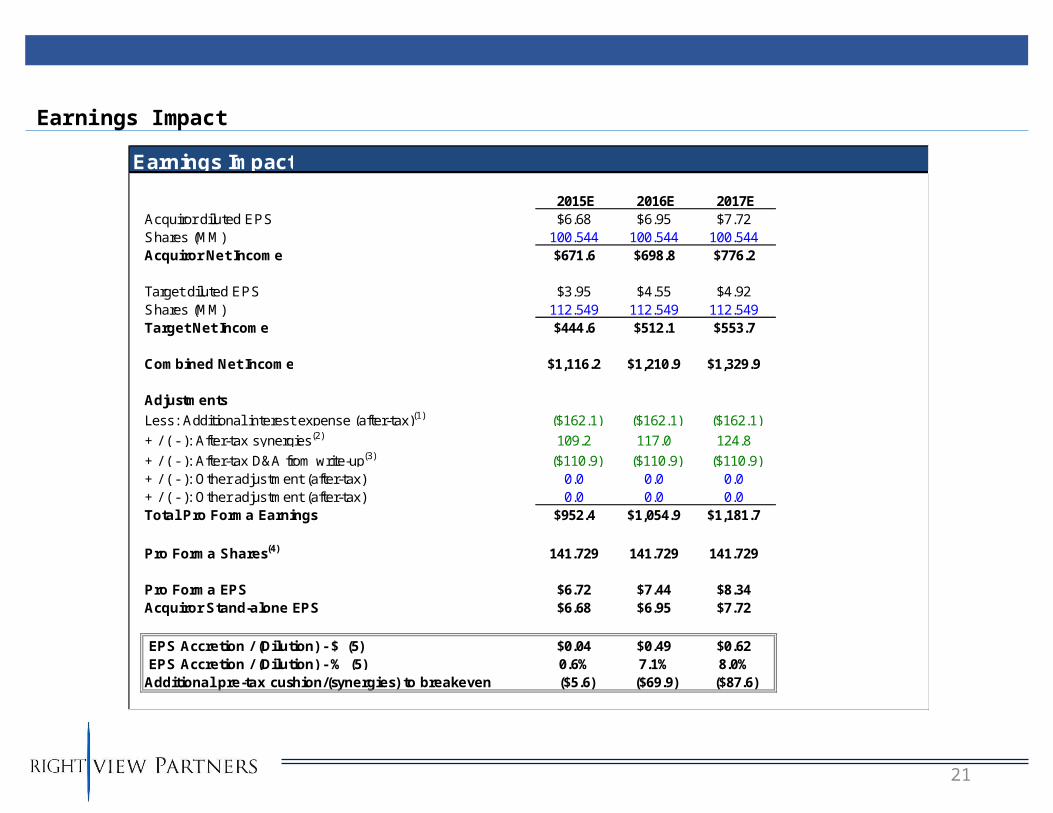
2015E 2016E 2017EAcquiror diluted EPS $6.68 $6.95 $7.72Shares (MM) 100.544 100.544 100.544Acquiror Net Income $671.6 $698.8 $776.2
Target diluted EPS $3.95 $4.55 $4.92Shares (MM) 112.549 112.549 112.549Target Net Income $444.6 $512.1 $553.7
Combined Net Income $1,116.2 $1,210.9 $1,329.9
Adjustments
Less: Additional interest expense (after-tax)(1) ($162.1) ($162.1) ($162.1)
+ / ( - ): After-tax synergies(2) 109.2 117.0 124.8
+ / ( - ): After-tax D&A from write-up(3) ($110.9) ($110.9) ($110.9)+ / ( - ): Other adjustment (after-tax) 0.0 0.0 0.0+ / ( - ): Other adjustment (after-tax) 0.0 0.0 0.0Total Pro Forma Earnings $952.4 $1,054.9 $1,181.7
Pro Forma Shares(4) 141.729 141.729 141.729
Pro Forma EPS $6.72 $7.44 $8.34Acquiror Stand-alone EPS $6.68 $6.95 $7.72
EPS Accretion / (Dilution) - $ (5) $0.04 $0.49 $0.62EPS Accretion / (Dilution) - % (5) 0.6% 7.1% 8.0%
Additional pre-tax cushion/(synergies) to breakeven ($5.6) ($69.9) ($87.6)
22
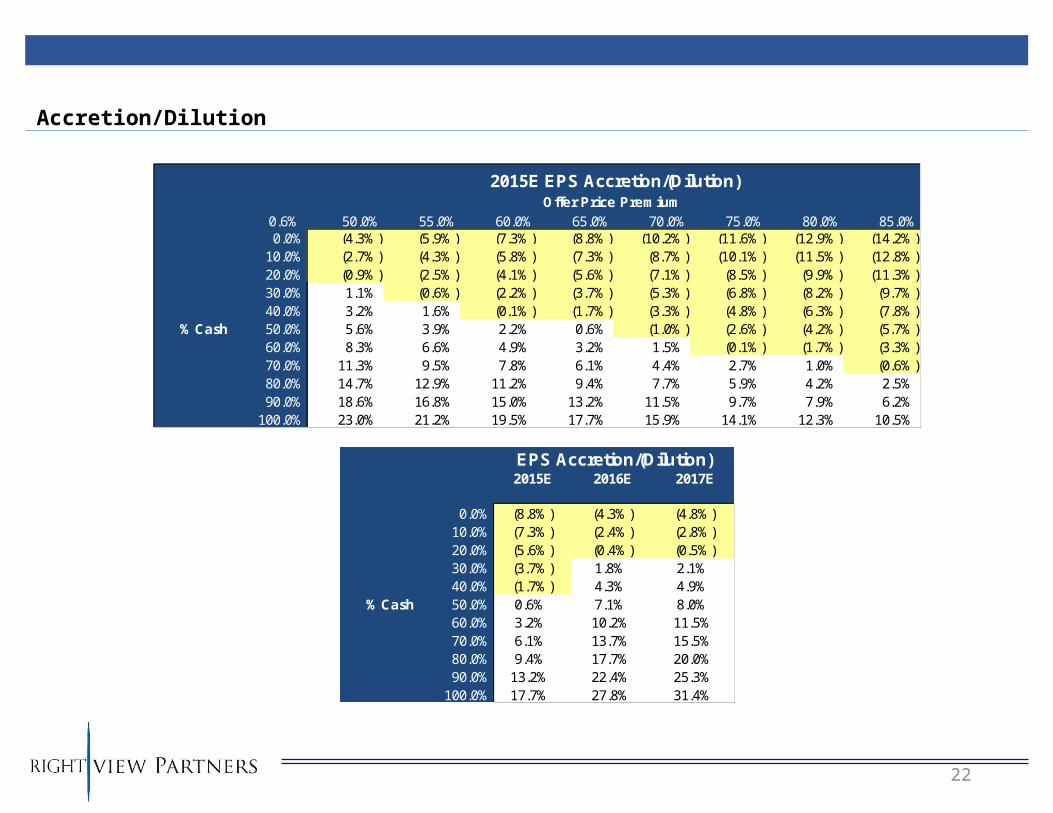
Accretion/Dilution
2015E EPS Accretion/(Dilution)Offer Price Premium
0.6% 50.0% 55.0% 60.0% 65.0% 70.0% 75.0% 80.0% 85.0%0.0% (4.3%) (5.9%) (7.3%) (8.8%) (10.2%) (11.6%) (12.9%) (14.2%)
10.0% (2.7%) (4.3%) (5.8%) (7.3%) (8.7%) (10.1%) (11.5%) (12.8%)20.0% (0.9%) (2.5%) (4.1%) (5.6%) (7.1%) (8.5%) (9.9%) (11.3%)30.0% 1.1% (0.6%) (2.2%) (3.7%) (5.3%) (6.8%) (8.2%) (9.7%)40.0% 3.2% 1.6% (0.1%) (1.7%) (3.3%) (4.8%) (6.3%) (7.8%)
% Cash 50.0% 5.6% 3.9% 2.2% 0.6% (1.0%) (2.6%) (4.2%) (5.7%)60.0% 8.3% 6.6% 4.9% 3.2% 1.5% (0.1%) (1.7%) (3.3%)70.0% 11.3% 9.5% 7.8% 6.1% 4.4% 2.7% 1.0% (0.6%)80.0% 14.7% 12.9% 11.2% 9.4% 7.7% 5.9% 4.2% 2.5%90.0% 18.6% 16.8% 15.0% 13.2% 11.5% 9.7% 7.9% 6.2%
100.0% 23.0% 21.2% 19.5% 17.7% 15.9% 14.1% 12.3% 10.5%
EPS Accretion/(Dilution) Offer Price Premium 2015E 2016E 2017E
0.6% 7.1% 8.0%0.0% (8.8%) (4.3%) (4.8%)
10.0% (7.3%) (2.4%) (2.8%)20.0% (5.6%) (0.4%) (0.5%)30.0% (3.7%) 1.8% 2.1%40.0% (1.7%) 4.3% 4.9%
% Cash 50.0% 0.6% 7.1% 8.0%60.0% 3.2% 10.2% 11.5%70.0% 6.1% 13.7% 15.5%80.0% 9.4% 17.7% 20.0%90.0% 13.2% 22.4% 25.3%
100.0% 17.7% 27.8% 31.4%
23
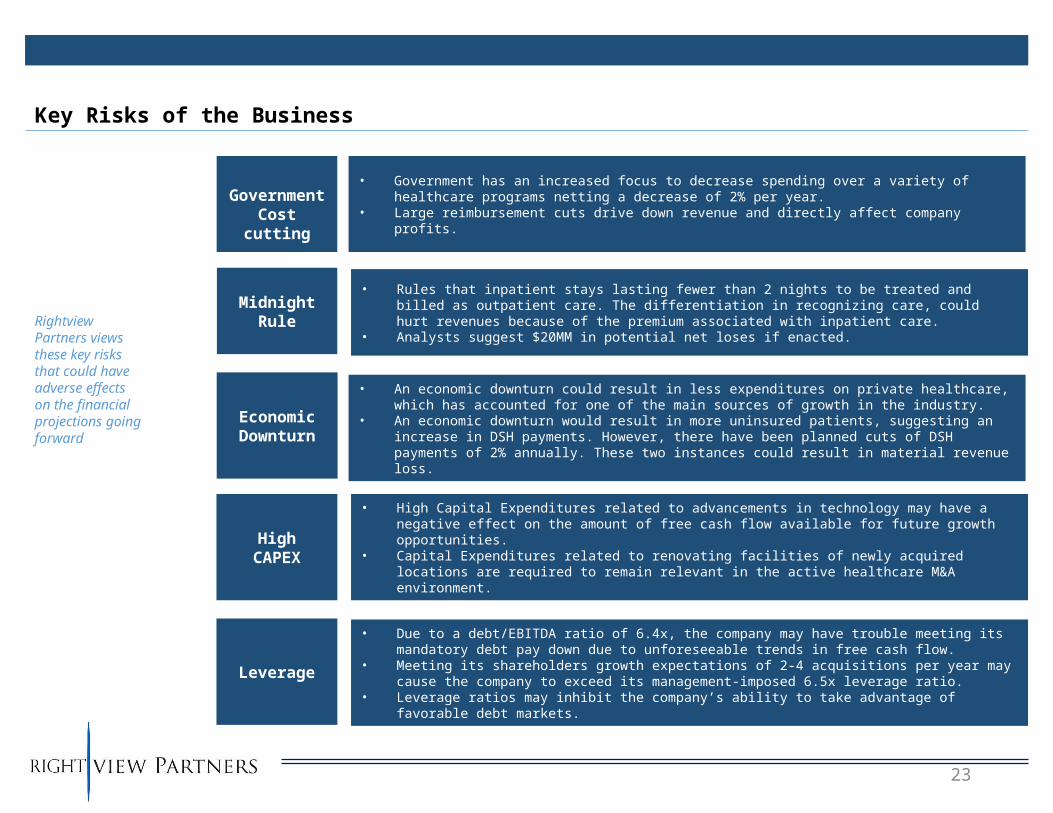
Governme
nt Cost cutting
Midnight Rule
Economic Downturn
• Government has an increased focus to decrease spending over a variety of healthcare programs netting a decrease of 2% per year.
• Large reimbursement cuts drive down revenue and directly affect company profits.
• Rules that inpatient stays lasting fewer than 2 nights to be treated and billed as outpatient care. The differentiation in recognizing care, could hurt revenues because of the premium associated with inpatient care.
• Analysts suggest $20MM in potential net loses if enacted.
• An economic downturn could result in less expenditures on private healthcare, which has accounted for one of the main sources of growth in the industry.
• An economic downturn would result in more uninsured patients, suggesting an increase in DSH payments. However, there have been planned cuts of DSH payments of 2% annually. These two instances could result in material revenue loss.
Key Risks of the Business
Rightview Partners views these key risks that could have adverse effects on the financial projections going forward
HighCAPEX
• High Capital Expenditures related to advancements in technology may have a negative effect on the amount of free cash flow available for future growth opportunities.
• Capital Expenditures related to renovating facilities of newly acquired locations are required to remain relevant in the active healthcare M&A environment.
Leverage
• Due to a debt/EBITDA ratio of 6.4x, the company may have trouble meeting its mandatory debt pay down due to unforeseeable trends in free cash flow.
• Meeting its shareholders growth expectations of 2-4 acquisitions per year may cause the company to exceed its management-imposed 6.5x leverage ratio.
• Leverage ratios may inhibit the company’s ability to take advantage of favorable debt markets.
24
VII. Appendix
25
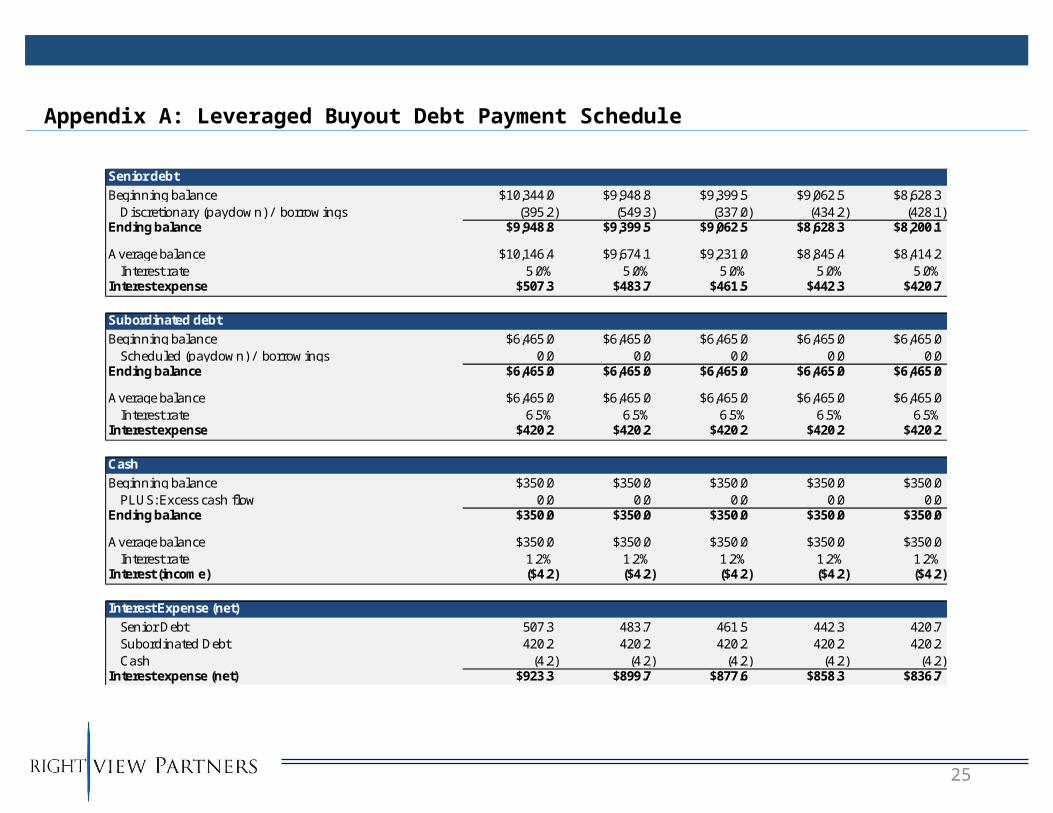
Appendix A: Leveraged Buyout Debt Payment Schedule
Senior debt
Beginning balance $10,344.0 $9,948.8 $9,399.5 $9,062.5 $8,628.3Discretionary (paydown) / borrowings (395.2) (549.3) (337.0) (434.2) (428.1)
Ending balance $9,948.8 $9,399.5 $9,062.5 $8,628.3 $8,200.1
Average balance $10,146.4 $9,674.1 $9,231.0 $8,845.4 $8,414.2Interest rate 5.0% 5.0% 5.0% 5.0% 5.0%
Interest expense $507.3 $483.7 $461.5 $442.3 $420.7
Subordinated debt
Beginning balance $6,465.0 $6,465.0 $6,465.0 $6,465.0 $6,465.0Scheduled (paydown) / borrowings 0.0 0.0 0.0 0.0 0.0
Ending balance $6,465.0 $6,465.0 $6,465.0 $6,465.0 $6,465.0
Average balance $6,465.0 $6,465.0 $6,465.0 $6,465.0 $6,465.0Interest rate 6.5% 6.5% 6.5% 6.5% 6.5%
Interest expense $420.2 $420.2 $420.2 $420.2 $420.2
Cash
Beginning balance $350.0 $350.0 $350.0 $350.0 $350.0PLUS: Excess cash flow 0.0 0.0 0.0 0.0 0.0
Ending balance $350.0 $350.0 $350.0 $350.0 $350.0
Average balance $350.0 $350.0 $350.0 $350.0 $350.0Interest rate 1.2% 1.2% 1.2% 1.2% 1.2%
Interest (income) ($4.2) ($4.2) ($4.2) ($4.2) ($4.2)
Interest Expense (net)
Senior Debt 507.3 483.7 461.5 442.3 420.7Subordinated Debt 420.2 420.2 420.2 420.2 420.2Cash (4.2) (4.2) (4.2) (4.2) (4.2)
Interest expense (net) $923.3 $899.7 $877.6 $858.3 $836.7
26
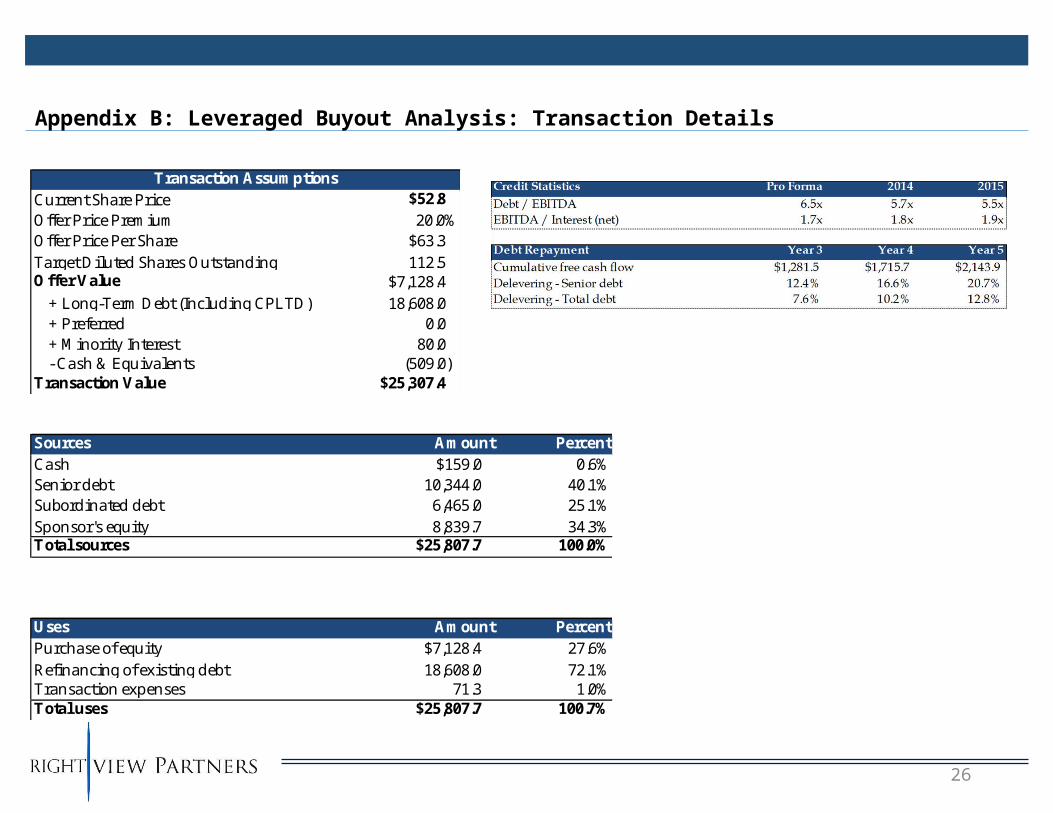
Appendix B: Leveraged Buyout Analysis: Transaction Details
Sources Amount PercentCash $159.0 0.6%Senior debt 10,344.0 40.1%Subordinated debt 6,465.0 25.1%Sponsor's equity 8,839.7 34.3%Total sources $25,807.7 100.0%
Uses Amount PercentPurchase of equity $7,128.4 27.6%Refinancing of existing debt 18,608.0 72.1%Transaction expenses 71.3 1.0%Total uses $25,807.7 100.7%
Transaction AssumptionsCurrent Share Price $52.8 Offer Price Premium 20.0%Offer Price Per Share $63.3 Target Diluted Shares Outstanding 112.5 Offer Value $7,128.4
+ Long-Term Debt (Including CPLTD) 18,608.0 + Preferred 0.0 + Minority Interest 80.0 - Cash & Equivalents (509.0)
Transaction Value $25,307.4
27
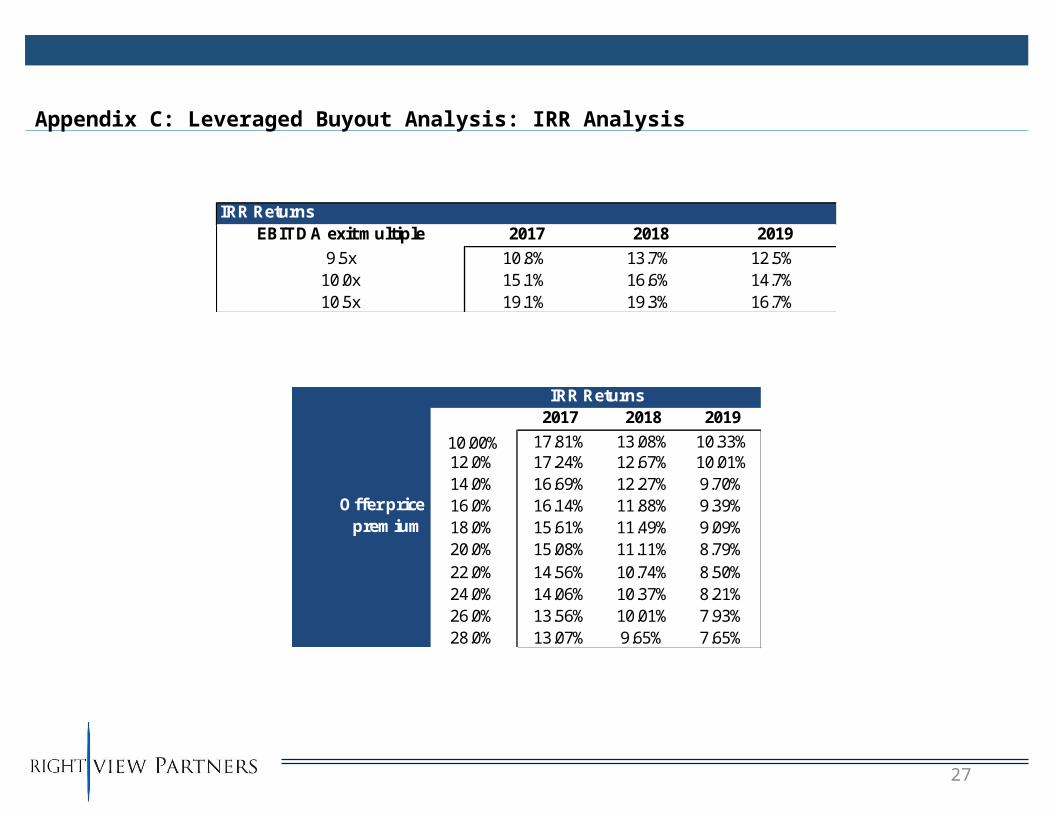
Appendix C: Leveraged Buyout Analysis: IRR Analysis
IRR Returns15.1% 2017 2018 2019
10.00% 17.81% 13.08% 10.33%12.0% 17.24% 12.67% 10.01%14.0% 16.69% 12.27% 9.70%
Offer price 16.0% 16.14% 11.88% 9.39%premium 18.0% 15.61% 11.49% 9.09%
20.0% 15.08% 11.11% 8.79%22.0% 14.56% 10.74% 8.50%24.0% 14.06% 10.37% 8.21%26.0% 13.56% 10.01% 7.93%28.0% 13.07% 9.65% 7.65%
IRR ReturnsEBITDA exit multiple 2017 2018 2019
9.5x 10.8% 13.7% 12.5%10.0x 15.1% 16.6% 14.7%10.5x 19.1% 19.3% 16.7%
28
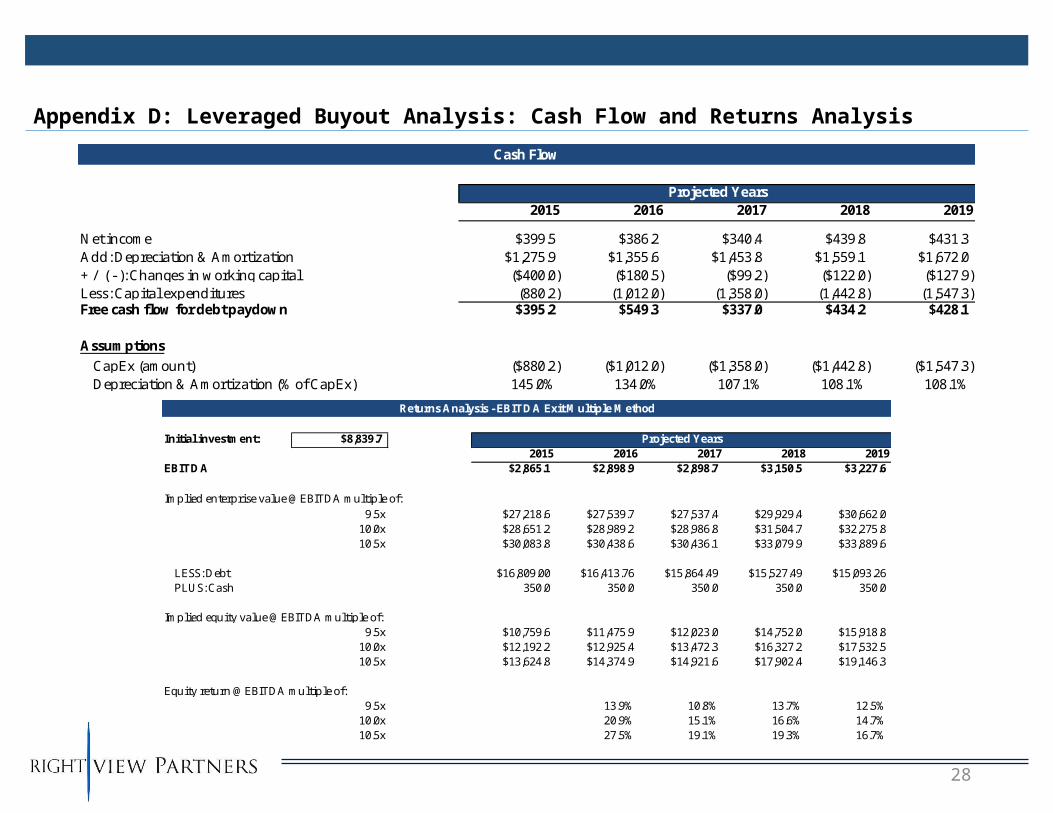
Appendix D: Leveraged Buyout Analysis: Cash Flow and Returns Analysis
Cash Flow
Projected Years2015 2016 2017 2018 2019
Net income $399.5 $386.2 $340.4 $439.8 $431.3Add: Depreciation & Amortization $1,275.9 $1,355.6 $1,453.8 $1,559.1 $1,672.0+ / ( - ): Changes in working capital ($400.0) ($180.5) ($99.2) ($122.0) ($127.9)Less: Capital expenditures (880.2) (1,012.0) (1,358.0) (1,442.8) (1,547.3)Free cash flow for debt paydown $395.2 $549.3 $337.0 $434.2 $428.1
AssumptionsCapEx (amount) ($880.2) ($1,012.0) ($1,358.0) ($1,442.8) ($1,547.3)Depreciation & Amortization (% of CapEx) 145.0% 134.0% 107.1% 108.1% 108.1%
Returns Analysis - EBITDA Exit Multiple Method
Initial investment: $8,839.7 Projected Years2015 2016 2017 2018 2019
EBITDA $2,865.1 $2,898.9 $2,898.7 $3,150.5 $3,227.6
Implied enterprise value @ EBITDA multiple of:9.5x $27,218.6 $27,539.7 $27,537.4 $29,929.4 $30,662.0
10.0x $28,651.2 $28,989.2 $28,986.8 $31,504.7 $32,275.810.5x $30,083.8 $30,438.6 $30,436.1 $33,079.9 $33,889.6
LESS: Debt $16,809.00 $16,413.76 $15,864.49 $15,527.49 $15,093.26PLUS: Cash 350.0 350.0 350.0 350.0 350.0
Implied equity value @ EBITDA multiple of:9.5x $10,759.6 $11,475.9 $12,023.0 $14,752.0 $15,918.8
10.0x $12,192.2 $12,925.4 $13,472.3 $16,327.2 $17,532.510.5x $13,624.8 $14,374.9 $14,921.6 $17,902.4 $19,146.3
Equity return @ EBITDA multiple of:9.5x 13.9% 10.8% 13.7% 12.5%
10.0x 20.9% 15.1% 16.6% 14.7%10.5x 27.5% 19.1% 19.3% 16.7%
29
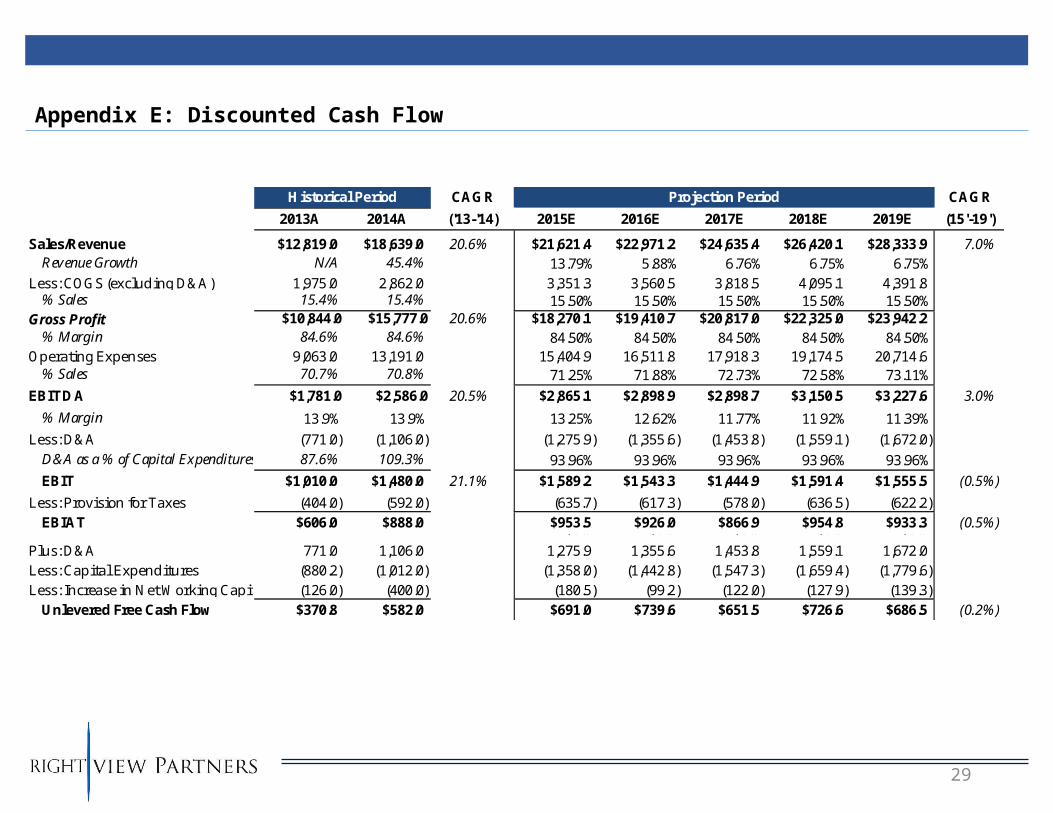
Appendix E: Discounted Cash Flow
Historical Period CAGR Projection Period CAGR
2013A 2014A ('13-'14) 2015E 2016E 2017E 2018E 2019E (15'-19')
Sales/Revenue $12,819.0 $18,639.0 20.6% $21,621.4 $22,971.2 $24,635.4 $26,420.1 $28,333.9 7.0%Revenue Growth N/A 45.4% 13.79% 5.88% 6.76% 6.75% 6.75%
Less: COGS (excluding D&A) 1,975.0 2,862.0 3,351.3 3,560.5 3,818.5 4,095.1 4,391.8% Sales 15.4% 15.4% 15.50% 15.50% 15.50% 15.50% 15.50%
Gross Profit $10,844.0 $15,777.0 20.6% $18,270.1 $19,410.7 $20,817.0 $22,325.0 $23,942.2% Margin 84.6% 84.6% 84.50% 84.50% 84.50% 84.50% 84.50%
Operating Expenses 9,063.0 13,191.0 15,404.9 16,511.8 17,918.3 19,174.5 20,714.6% Sales 70.7% 70.8% 71.25% 71.88% 72.73% 72.58% 73.11%
EBITDA $1,781.0 $2,586.0 20.5% $2,865.1 $2,898.9 $2,898.7 $3,150.5 $3,227.6 3.0%
% Margin 13.9% 13.9% 13.25% 12.62% 11.77% 11.92% 11.39%
Less: D&A (771.0) (1,106.0) (1,275.9) (1,355.6) (1,453.8) (1,559.1) (1,672.0)D&A as a % of Capital Expenditures 87.6% 109.3% 93.96% 93.96% 93.96% 93.96% 93.96%
EBIT $1,010.0 $1,480.0 21.1% $1,589.2 $1,543.3 $1,444.9 $1,591.4 $1,555.5 (0.5%)
Less: Provision for Taxes (404.0) (592.0) (635.7) (617.3) (578.0) (636.5) (622.2)EBIAT $606.0 $888.0 $953.5 $926.0 $866.9 $954.8 $933.3 (0.5%)$0.0 $0.0 $0.0 $0.0 $0.0
Plus: D&A 771.0 1,106.0 1,275.9 1,355.6 1,453.8 1,559.1 1,672.0Less: Capital Expenditures (880.2) (1,012.0) (1,358.0) (1,442.8) (1,547.3) (1,659.4) (1,779.6)Less: Increase in Net Working Capital (126.0) (400.0) (180.5) (99.2) (122.0) (127.9) (139.3)
Unlevered Free Cash Flow $370.8 $582.0 $691.0 $739.6 $651.5 $726.6 $686.5 (0.2%)
30
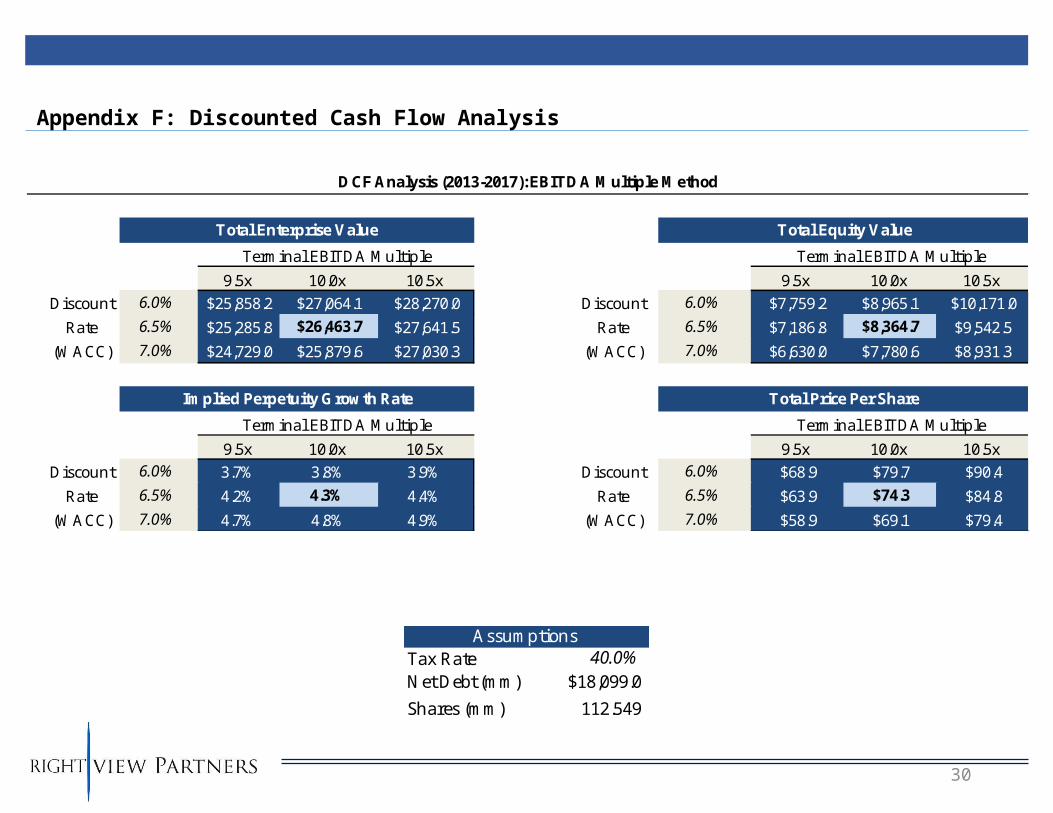
Appendix F: Discounted Cash Flow Analysis
DCF Analysis (2013-2017): EBITDA Multiple Method
Total Enterprise Value Total Equity Value
Terminal EBITDA Multiple Terminal EBITDA Multiple
9.5x 10.0x 10.5x 9.5x 10.0x 10.5x
Discount 6.0% $25,858.2 $27,064.1 $28,270.0 Discount 6.0% $7,759.2 $8,965.1 $10,171.0
Rate 6.5% $25,285.8 $26,463.7 $27,641.5 Rate 6.5% $7,186.8 $8,364.7 $9,542.5
(WACC) 7.0% $24,729.0 $25,879.6 $27,030.3 (WACC) 7.0% $6,630.0 $7,780.6 $8,931.3
Implied Perpetuity Growth Rate Total Price Per Share
Terminal EBITDA Multiple Terminal EBITDA Multiple
9.5x 10.0x 10.5x 9.5x 10.0x 10.5x
Discount 6.0% 3.7% 3.8% 3.9% Discount 6.0% $68.9 $79.7 $90.4
Rate 6.5% 4.2% 4.3% 4.4% Rate 6.5% $63.9 $74.3 $84.8
(WACC) 7.0% 4.7% 4.8% 4.9% (WACC) 7.0% $58.9 $69.1 $79.4
AssumptionsTax Rate 40.0%Net Debt (mm) $18,099.0
Shares (mm) 112.549
31
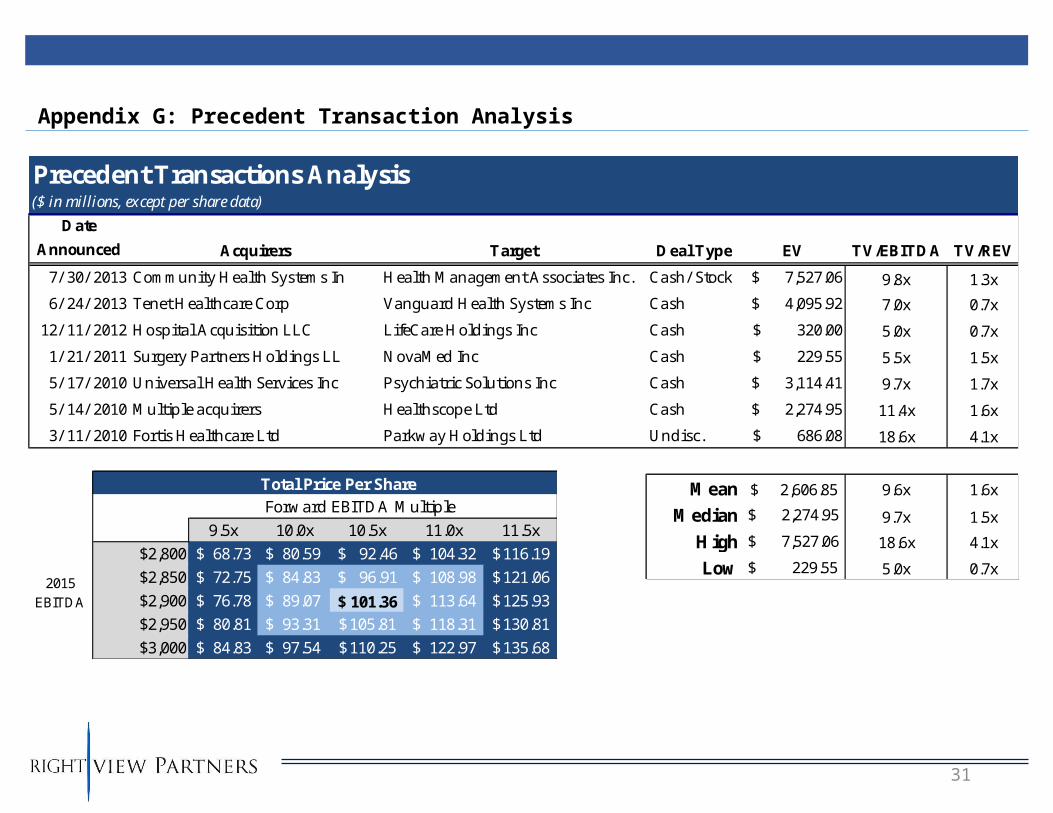
Appendix G: Precedent Transaction Analysis
Precedent Transactions Analysis($ in millions, except per share data)
Date
Announced Acquirers Target Deal Type EV TV/EBITDA TV/REV
7/ 30/ 2013 Community Health Systems In Health Management Associates Inc. Cash/ Stock $ 7,527.06 9.8x 1.3x
6/ 24/ 2013 Tenet Healthcare Corp Vanguard Health Systems Inc Cash $ 4,095.92 7.0x 0.7x
12/ 11/ 2012 Hospital Acquisition LLC LifeCare Holdings Inc Cash $ 320.00 5.0x 0.7x
1/ 21/ 2011 Surgery Partners Holdings LL NovaMed Inc Cash $ 229.55 5.5x 1.5x
5/ 17/ 2010 Universal Health Services Inc Psychiatric Solutions Inc Cash $ 3,114.41 9.7x 1.7x
5/ 14/ 2010 Multiple acquirers Healthscope Ltd Cash $ 2,274.95 11.4x 1.6x
3/ 11/ 2010 Fortis Healthcare Ltd Parkway Holdings Ltd Undisc. $ 686.08 18.6x 4.1x
Mean 2,606.85$ 9.6x 1.6x
Median $ 2,274.95 9.7x 1.5x
High $ 7,527.06 18.6x 4.1x
Low $ 229.55 5.0x 0.7x
Total Price Per Share Forward EBITDA Multiple
68.0779661 9.5x 10.0x 10.5x 11.0x 11.5x
$2,800 $ 68.73 $ 80.59 $ 92.46 104.32$ 116.19$
$2,850 $ 72.75 $ 84.83 $ 96.91 108.98$ 121.06$
$2,900 $ 76.78 $ 89.07 $ 101.36 113.64$ 125.93$
$2,950 $ 80.81 $ 93.31 105.81$ 118.31$ 130.81$
$3,000 $ 84.83 $ 97.54 110.25$ 122.97$ 135.68$
2015 EBITDA
32
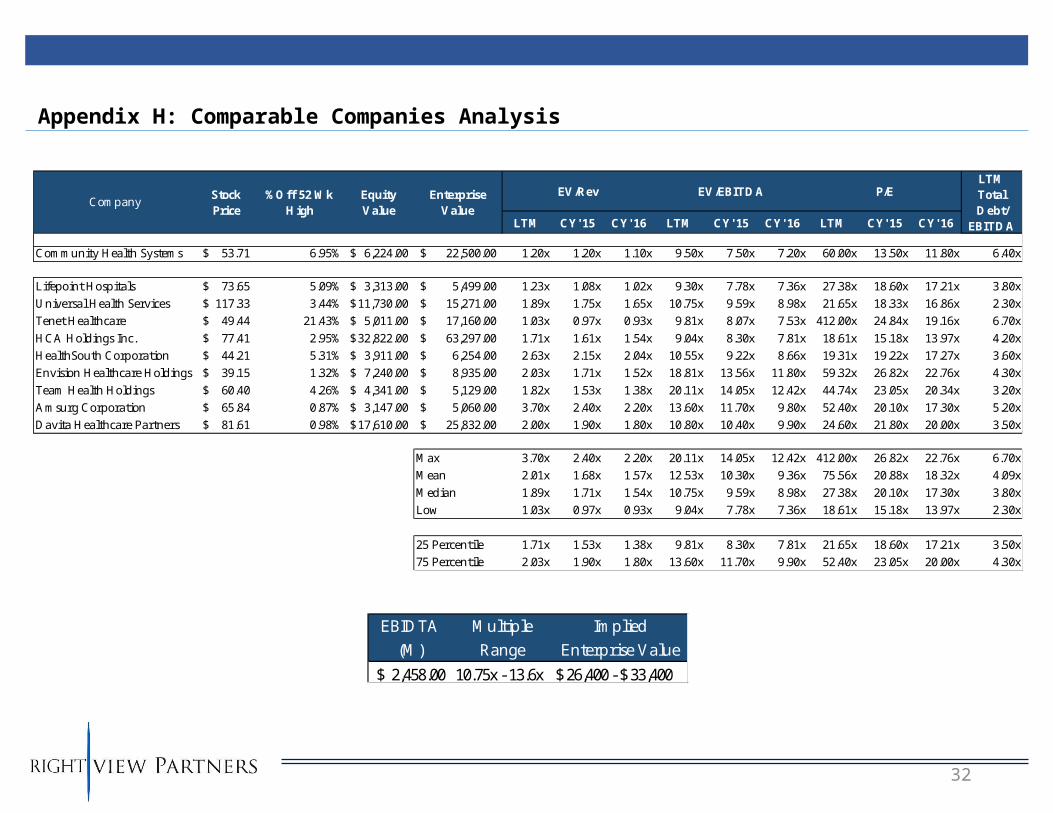
Appendix H: Comparable Companies Analysis
EBIDTA
(M)
Multiple
Range
Implied
Enterprise Value2,458.00$ 10.75x - 13.6x $ 26,400 - $ 33,400
EV/EBITDA
LTM CY' 15 CY' 16 LTM CY' 15 CY' 16 LTM CY' 15 CY' 16
Community Health Systems 53.71$ 6.95% 6,224.00$ 22,500.00$ 1.20x 1.20x 1.10x 9.50x 7.50x 7.20x 60.00x 13.50x 11.80x 6.40x
Lifepoint Hospitals 73.65$ 5.09% 3,313.00$ 5,499.00$ 1.23x 1.08x 1.02x 9.30x 7.78x 7.36x 27.38x 18.60x 17.21x 3.80x
Universal Health Services 117.33$ 3.44% 11,730.00$ 15,271.00$ 1.89x 1.75x 1.65x 10.75x 9.59x 8.98x 21.65x 18.33x 16.86x 2.30x
Tenet Healthcare 49.44$ 21.43% 5,011.00$ 17,160.00$ 1.03x 0.97x 0.93x 9.81x 8.07x 7.53x 412.00x 24.84x 19.16x 6.70x
HCA Holdings Inc. 77.41$ 2.95% 32,822.00$ 63,297.00$ 1.71x 1.61x 1.54x 9.04x 8.30x 7.81x 18.61x 15.18x 13.97x 4.20x
HealthSouth Corporation 44.21$ 5.31% 3,911.00$ 6,254.00$ 2.63x 2.15x 2.04x 10.55x 9.22x 8.66x 19.31x 19.22x 17.27x 3.60x
Envision Healthcare Holdings 39.15$ 1.32% 7,240.00$ 8,935.00$ 2.03x 1.71x 1.52x 18.81x 13.56x 11.80x 59.32x 26.82x 22.76x 4.30x
Team Health Holdings 60.40$ 4.26% 4,341.00$ 5,129.00$ 1.82x 1.53x 1.38x 20.11x 14.05x 12.42x 44.74x 23.05x 20.34x 3.20x
Amsurg Corporation 65.84$ 0.87% 3,147.00$ 5,060.00$ 3.70x 2.40x 2.20x 13.60x 11.70x 9.80x 52.40x 20.10x 17.30x 5.20x
Davita Healthcare Partners 81.61$ 0.98% 17,610.00$ 25,832.00$ 2.00x 1.90x 1.80x 10.80x 10.40x 9.90x 24.60x 21.80x 20.00x 3.50x
Max 3.70x 2.40x 2.20x 20.11x 14.05x 12.42x 412.00x 26.82x 22.76x 6.70x
Mean 2.01x 1.68x 1.57x 12.53x 10.30x 9.36x 75.56x 20.88x 18.32x 4.09x
Median 1.89x 1.71x 1.54x 10.75x 9.59x 8.98x 27.38x 20.10x 17.30x 3.80x
Low 1.03x 0.97x 0.93x 9.04x 7.78x 7.36x 18.61x 15.18x 13.97x 2.30x
25 Percentile 1.71x 1.53x 1.38x 9.81x 8.30x 7.81x 21.65x 18.60x 17.21x 3.50x
75 Percentile 2.03x 1.90x 1.80x 13.60x 11.70x 9.90x 52.40x 23.05x 20.00x 4.30x
CompanyStock Price
%Off 52 Wk High
Equity Value
Enterprise Value
P/EEV/RevLTM Total Debt/
EBITDA