Pilot Region Vorarlberg - ALPINE · PDF fileRegion Vorarlberg: Status Quo and Masterplan 4...
75
Region Vorarlberg: Status Quo and Masterplan 1 Pilot Region Vorarlberg Status Quo Report and Masterplan Author: Stefan Hartmann BA MSc Contact: Vorarlberger Kraftwerke AG, Weidachstraße 6, 6900 Bregenz, Austria, [email protected] +43 5574 601 - 73103 Status Quo Reports are contributing to AlpStore WP4, Action 4.2 Masterplans are contributing to AlpStore WP5, Action 5.2 Work Package Responsible WP4, University of Liechtenstein, Professor Peter Droege and Team, Work Package Responsible WP5, Novae Alsace (Freshmile), Arnaud Mora Lead Partner B.A.U.M. Consult Ludwig Karg, Patrick Ansbacher, Anja Lehmann, Dr. Michael Stöhr
Transcript of Pilot Region Vorarlberg - ALPINE · PDF fileRegion Vorarlberg: Status Quo and Masterplan 4...

Region Vorarlberg:
Status Quo and Masterplan
1
Pilot Region Vorarlberg
Status Quo Report and Masterplan
Author: Stefan Hartmann BA MSc
Contact: Vorarlberger Kraftwerke AG, Weidachstraße 6, 6900 Bregenz, Austria,
+43 5574 601 - 73103
Status Quo Reports are contributing to AlpStore WP4, Action 4.2
Masterplans are contributing to AlpStore WP5, Action 5.2
Work Package Responsible WP4, University of Liechtenstein, Professor Peter Droege
and Team, Work Package Responsible WP5, Novae Alsace (Freshmile), Arnaud Mora
Lead Partner
B.A.U.M. Consult
Ludwig Karg, Patrick Ansbacher, Anja Lehmann, Dr. Michael Stöhr

Region Vorarlberg:
Status Quo and Masterplan
2
AlpStore Status Quo- and Masterplans:
Status Quo Reports: All subconsortia describe the regional situation in their pilot region concerning
the current impact and future trends of hybrid, electric and gas powered vehicles, energy storage
systems, smart grids and renewable energy sources - taking planned demonstration sites as repre-
sentative examples and considering transnational opportunities (e.g. roaming with electric cars, cross
border aggregation of flexibility of mobile storages).
Masterplans: All subconsortia develop holistic masterplans for their respective regions with the spe-
cific emphases listed in Table 1. The masterplans build on the overarching STORM principle as devel-
oped in WP4 (see Appendix). With the masterplans developed in WP5 decision makers in the in-
volved regions are to receive long-range concepts to enhance their regional and municipal develop-
ment planning. With many different types of regions being involved many other decision making and
planning processes in the Alpine Space can be informed by these masterplans as blueprints.
Table 1: Overview of AlpStore Status Quo- and Masterplans:
No. Region Specific Emphasis of Masterplan according Application Resp. PP
1 West Milan IT EV fleet management and VPS, involvement of ESCO
and PAES for efficient energy management
EU-IMP
2 Aosta IT “AOSTA Valley Regional Energy Plan 2011-2020” AOSTA
3 Lombardy IT electric public transport ALOT
integration of VPS long term plan (gas, PV) with sustain-
able mobility needs and storage opportunities
AGIRE
4 Alsace FR fleet management with EV and fuel cell vehicles in of-
fice buildings
FRESH
UTBM
5 Vorarlberg AT hydro pump vs. mobile and stationary battery storage,
mass roll-out of EV
VLOTTE
6 Güssing AT mobile vs. stationary use of biogas EEE
7 Haslital Brienz CH controlled charging with 2nd life batteries in semi-
public areas (supermarkets)
KWO
8 Gorenjska SI off grid situations of small mountain villages UL
RDA
JEZ
9 Allgäu DE integrated storage and mobility for public transport,
electric car and e-bike charging infrastructure
BAUM
fully integrated plus energy houses EZA
10 Ebersberg DE managing biogas and wind energy in Ebersberg BAUM
FFE
11 Berchtesgaden DE small hydro pump, pressed air storage in salt mines in
Berchtesgaden
BAUM
FFE
12 Ticino CH Ticino RE Platform USI
13 Liechtenstein LI
FL
potential for RES in various settlement forms
(masterplan focused on potential for RES in various
settlement forms)
LIECH

Region Vorarlberg:
Status Quo and Masterplan
3
Contents Contents .................................................................................................................................................. 3
List of Figures ........................................................................................................................................... 5
1 Summary ......................................................................................................................................... 7
2 The Pilot Region ............................................................................................................................... 9
3 Status quo of Energy System ......................................................................................................... 15
3.1 Energy Production ................................................................................................................. 15
3.1.1 Conventional Power Plants ........................................................................................... 15
3.1.2 Renewable Energies ...................................................................................................... 16
3.2 Energy Consumption ............................................................................................................. 19
4 Energy Consumption by sector ..................................................................................................... 24
4.1.1 Business clients .............................................................................................................. 24
4.1.2 Private consumers and small-scale business clients ..................................................... 24
4.1.3 Trends ............................................................................................................................ 25
4.2 Energy Transmission and Distribution ................................................................................... 26
4.2.1 Power grid ..................................................................................................................... 26
4.2.2 Gas grid .......................................................................................................................... 28
4.2.3 (Smart) grid issues and development status ................................................................. 29
4.3 Energy Storage ...................................................................................................................... 29
4.3.1 Pump and hydro storage power plants ......................................................................... 29
....................................................................................................................................................... 34
4.3.2 Biogas digesters and storage tanks ............................................................................... 45
4.3.3 Thermal energy storage system - Water ....................................................................... 45
4.3.4 Mobile batteries (electric vehicles) ............................................................................... 45
5 Future Energy System .................................................................................................................... 46
5.1.1 Renewable Energies ...................................................................................................... 46
5.2 Regional Energy Consumption .............................................................................................. 49
5.2.1 Buildings ........................................................................................................................ 50
5.2.2 Mobility ......................................................................................................................... 51
5.2.3 Business clients: Industry .............................................................................................. 52

Region Vorarlberg:
Status Quo and Masterplan
4
5.2.4 Private consumers and small-scale business clients ..................................................... 52
5.2.5 Trends ............................................................................................................................ 53
5.3 Regional Energy Production .................................................................................................. 53
5.4 Transmission and Distribution Grids ..................................................................................... 54
5.4.1 Stressors for the Regional Power Grid .......................................................................... 54
5.4.2 (Smart) Grid Solutions ................................................................................................... 54
6 Future Energy Storage ................................................................................................................... 58
6.1 Storage Requirements ........................................................................................................... 58
6.2 Potentials for Regional Storage ............................................................................................. 59
7 Framework for future Storage Systems ........................................................................................ 59
7.1 Governance ........................................................................................................................... 59
7.2 Technology Trends ................................................................................................................ 63
7.3 R&D activities ........................................................................................................................ 64
7.3.1 VLOTTE........................................................................................................................... 64
7.3.2 Smart City Rheintal ........................................................................................................ 64
7.3.3 Vehicle to Grid ............................................................................................................... 65
7.4 Stakeholders .......................................................................................................................... 66
8 Master Plan ................................................................................................................................... 68
8.1 Objectives .............................................................................................................................. 68
8.1.1 Vision and Goals ............................................................................................................ 68
8.2 Regional Storage Park............................................................................................................ 68
8.3 Storage Roadmap .................................................................................................................. 69
8.3.1 Measures and Projects .................................................................................................. 69
8.4 Implementation Structure ..................................................................................................... 74
9 Literature ....................................................................................................................................... 75

Region Vorarlberg:
Status Quo and Masterplan
5
List of Figures
Figure 1: Map of Vorarlberg .................................................................................................................... 9
Figure 2: Inhabitants and Working Population in Vorarlberg ............................................................... 10
Figure 3: Municipalities in Vorarlberg ................................................................................................... 10
Figure 4: Rivers, Lakes in Vorarlberg and Drainage Area ...................................................................... 11
Figure 5: Economic Growth of Vorarlberg............................................................................................. 12
Figure 6: Energy Autonomy Vorarlberg ................................................................................................. 13
Figure 7: Path toward Energy Autonomy by 2050 ................................................................................ 14
Figure 8: Import and Export of Electricity in Vorarlberg ....................................................................... 15
Figure 9: European Electricity Mix vs. Vorarlberg Electricity Mix and Allocation of Renewable Energies
............................................................................................................................................................... 16
Figure 10: Energy Production with renewable energy sources ............................................................ 16
Figure 11: Number of Facilities and Capacity ........................................................................................ 17
Figure 12: Hydro Power Plants in Vorarlberg ........................................................................................ 18
Figure 13: Overview Energy Consumption ............................................................................................ 19
Figure 14: Allocation of Total Energy Consumption and CO2 ............................................................... 19
Figure 15: Development of Energy Consumption by form of Energy ................................................... 20
Figure 16: Allocation Electricity ............................................................................................................. 20
Figure 17: Consumption Heating Oil and Natural Gas .......................................................................... 21
Figure 18: Heat Production ................................................................................................................... 21
Figure 19: Development of Heat Production out of Renewable Energy Sources ................................. 22
Figure 20: Consumption of Fuel in Vorarlberg ...................................................................................... 22
Figure 21: Driving Distances of EVs in Vorarlberg (2012) ...................................................................... 23
Figure 22: Energy Consumption by Sector ............................................................................................ 24
Figure 23: Development Energy Consumption by Sector ..................................................................... 25
Figure 24: Power Grid in Vorarlberg - Data ........................................................................................... 26
Figure 25: Power Grid in Vorarlberg - Map ........................................................................................... 27
Figure 26: Gas Grid in Vorarlberg - Map ............................................................................................... 28
Figure 27: Power Plant Group of Illwerke ............................................................................................. 29
Figure 28: Barrages and Power Plants in the Montafon – Schematic Diagram .................................... 30
Figure 29: Silvrettasee ........................................................................................................................... 31
Figure 30: Vermuntsee .......................................................................................................................... 31
Figure 31: Kopssee ................................................................................................................................ 32
Figure 32: Lünersee ............................................................................................................................... 32
Figure 33: Compensating Reservoirs ..................................................................................................... 33
Figure 34: Overview: Lakes and Equalizing Basins ................................................................................ 33
Figure 35: Rodundwerk I ....................................................................................................................... 34
Figure 36: Rodundwerk II ...................................................................................................................... 35

Region Vorarlberg:
Status Quo and Masterplan
6
Figure 37: Lünerseewerk ....................................................................................................................... 36
Figure 38: Kopswerk I ............................................................................................................................ 37
Figure 39: Kopswerk II ........................................................................................................................... 38
Figure 40: Vermuntwerk ....................................................................................................................... 39
Figure 41: Latschauwerk........................................................................................................................ 40
Figure 42: Latschauwerk........................................................................................................................ 41
Figure 43: Latschauwerk........................................................................................................................ 42
Figure 44: Latschauwerk........................................................................................................................ 43
Figure 45: Key Facts Storage and Pump Storage Power Plants ............................................................. 44
Figure 46: Growth of Renewable Energy Sources till 2050 ................................................................... 46
Figure 47: Growth of Hydro Power till 2050 ......................................................................................... 47
Figure 48: Growth of Biogas till 2050 .................................................................................................... 48
Figure 49: Growth of Biomass till 2050 ................................................................................................. 48
Figure 50: Growth of Photovoltaic and Solar Thermal till 2050 ............................................................ 49
Figure 51: Development of Energy Consumption till 2050 ................................................................... 50
Figure 52: Development of Energy Consumption in Sector Buildings till 2050 .................................... 50
Figure 53: Development of Energy Consumption in Sector Mobility till 2050 ...................................... 51
Figure 54: Development of Energy Consumption in Sector Industry till 2050 ...................................... 52
Figure 55: Development of Energy Consumption in Electricity till 2050 .............................................. 52
Figure 56: Development of Population in Vorarlberg till 2050 ............................................................. 53
Figure 57: Downtime of Power Grid in Vorarlberg ............................................................................... 54
Figure 58: Electricity surplus / deficit over the year ............................................................................. 56
Figure 59: Voltage increase caused by local producers and intelligent voltage range management ... 57
Figure 60: Voltage increase caused by local producers and intelligent voltage range management ... 58
Figure 61: Path of EVs in Vorarlberg ..................................................................................................... 69
Figure 62: Concept of Obervermuntwerk II .......................................................................................... 72

Region Vorarlberg:
Status Quo and Masterplan
7
1 Summary
Energy Autonomy Vorarlberg
Energy autonomy Vorarlberg is the central energy policy program of the State of Vorarlberg, which
was initiated in 2007. Austria's westernmost province, Vorarlberg, had set itself an ambitious target:
achieving energy self-sufficiency based on renewable energy sources by 2050 and so becoming inde-
pendent of price rises and supply shortfalls affecting oil and natural gas. This long-term strategic goal
has been supported in a unanimous decision by all political parties. The process is intended to im-
plement a sustainable energy supply system step by step and make a valuable contribution to cli-
mate protection. This long-term strategy relies upon four pillars: energy saving and energy efficiency,
increased employment of renewable energy, new mobility strategies and investment in research,
development and education.
Energy Situation Vorarlberg
Vorarlberg is a region where hydro power plays an important role in the production of electricity.
More than three quarters of the sold electricity in Vorarlberg comes from hydro power plants. The
rest of the sold electricity comes from gas fired power plants (8 %), wind (4 %) and biomass (4 %).
The electricity of these power plants is purchased by the Vorarlberger Kraftwerke AG. Vorarlberg has
therefore no nuclear, gas or oil fired power plant in operation. The CO2 emissions with 28 g/kWh are
lower compared to the national and the European level, because of the high amount of renewable
energy sources. The share of renewable energies in the heating sector is also high. The biggest share
has still gas followed by renewable sources like geothermal, biomass and solar thermal. The rest of
the heat consumption is covered by oil.
Mobility Situation Vorarlberg
The total number of cars in 2012 has been 193,000. The share per inhabitant is therefore relative
high. Vorarlberg has been one of the first model regions for e-mobility in Europe and the first one in
Austria. Today are about 400 BEV on the roads and 120 public charging stations have been built by
the Vorarlberger Kraftwerke AG. The BEVs are exclusively charged with renewable energies, which
have been additionally built during the VLOTTE project in form of photovoltaic power plants and a
small hydro power plant. The EVs in Vorarlberg have proven their suitability for daily use.
Storage Situation Vorarlberg
Vorarlberg is located in the Alps. The electricity production is therefore characterized by storage and
pump storage hydro power plants. The amount of water from the lakes Silvrettasee, Kopssee,
Vemuntsee and Lünersee is processed in several stages. This means that the water is used a bunch of
times to produce control and peak energy. The hydro power plant group of Illwerke operates as a
water and energy management unit. The nominal capacity of the turbines in 2012 has been
1,812 MW and the input power of the pumps has been 999 MW. The annual output of all pump and
storage power plants has been 2,722 GWh. Other storage systems are not in operation.

Region Vorarlberg:
Status Quo and Masterplan
8
Future Energy System
Electricity will have a special role in the energy system of the future. A key element in supplying en-
ergy in the future involves a drastic expansion of tapping renewable energy from sunlight, water and
biomass. It is to be expected that the future energy supply of households and industry will increas-
ingly be based on electricity. Vorarlberg is moving towards an “electricity society”, i. e. other sources
of energy will progressively be supplanted by electricity (e. g. by using heat pumps or moving into e-
mobility). The demand for electricity will therefore rise in these areas. In addition to that energy effi-
ciency will also play a major role. The combination between energy savings, energy efficiency and
tapping renewable energy sources will be characteristic for the future energy system.
Future Storage System
The future energy storage system in Vorarlberg will be characterized by hydro storage and pump
storage power plants like it is today. With this storage system short term and long term aspects can
be covered. With the planned construction of Obervermuntwerk II further steps are taken to a sus-
tainably integration and continued expansion of renewable energy in Europe. The mass rollout of
electric vehicles will also lead to an additional storage capacity till 2050. Other storage systems like
battery storages will become more and more interesting in the near future. It is hard to predict how
big the actual potential for these storage systems really is. Beside the discussion about storages for
the electricity system, storages for the heat production play an important role in the future energy
park of Vorarlberg. In this sector the decentralized storages will play a major role. Especially solar
thermal, geothermal and biomass heating systems need storages to provide heat all day long. It will
be necessary that all these heating systems are equipped with these water storages. The capacity for
heating storages will therefore also increase.

Region Vorarlberg:
Status Quo and Masterplan
9
2 The Pilot Region
Figure 1: Map of Vorarlberg
Source: http://epp.eurostat.ec.europa.eu/portal/page/portal/eurostat/home/
The region Vorarlberg is located in the west part of Austria. It is the second smallest federal state of
Austria in terms of population (only Burgenland is less populated) and area (Vienna is the smallest).
Vorarlberg is bordered by Germany (Bavaria and Baden Württemberg via Lake Constance), Switzer-
land (Graubünden and St. Gallen) and Liechtenstein.
The region counts 371,000 inhabitants for a total surface and density of respectively 2,601 km² and
142.2 inhabitants/km². About 2,534 km² of Vorarlberg’s area is covered by land (97.4 %) and the rest
67.64 km² (2.6 %) is covered with water (rivers and lakes). The regional capital Bregenz with 28,000,
Dornbirn with 45,000 and Feldkirch with 30,000 inhabitants are larger cities in term of population in
Vorarlberg. These cities are all located in the Rhine valley, which extends from Bregenz to Feldkirch.
Nearly 80 % off all inhabitants of Vorarlberg live in this urban agglomeration, which is on the one
hand compact and on the other hand spread with valleys and hills. The area of the Rhine valley is
only 11 % of the total land area of Vorarlberg. In this relatively small surface a lot of companies have
settled down. For this reason 110,000 employees work in the Rhine valley. The GDP per inhabitant in
Vorarlberg was in 2009 (€ 34,600 per inhabitant) higher than the national GDP (€ 32,900). Beyond
Basic Information
Territory (km2) 2 601
Population (2011 in 1 000) 371
Population density (inhabitants per km2) 142.2
Economy
GDP per inhabitant (2009 in €) 34 600
Total Employment (2011 in 1 000) 188
Employment Rate (2011 in %) 77.0
Unemployment Rate (2011 in %) 3.6
Research Infrastructure
Intramural R&D Expenditure
(2009 million €) 205
(% of GDP) 1.61
EPO Patent Applications
(2009 by Priority Year) 102
Region Vorarlberg:
Status Quo and Masterplan
10
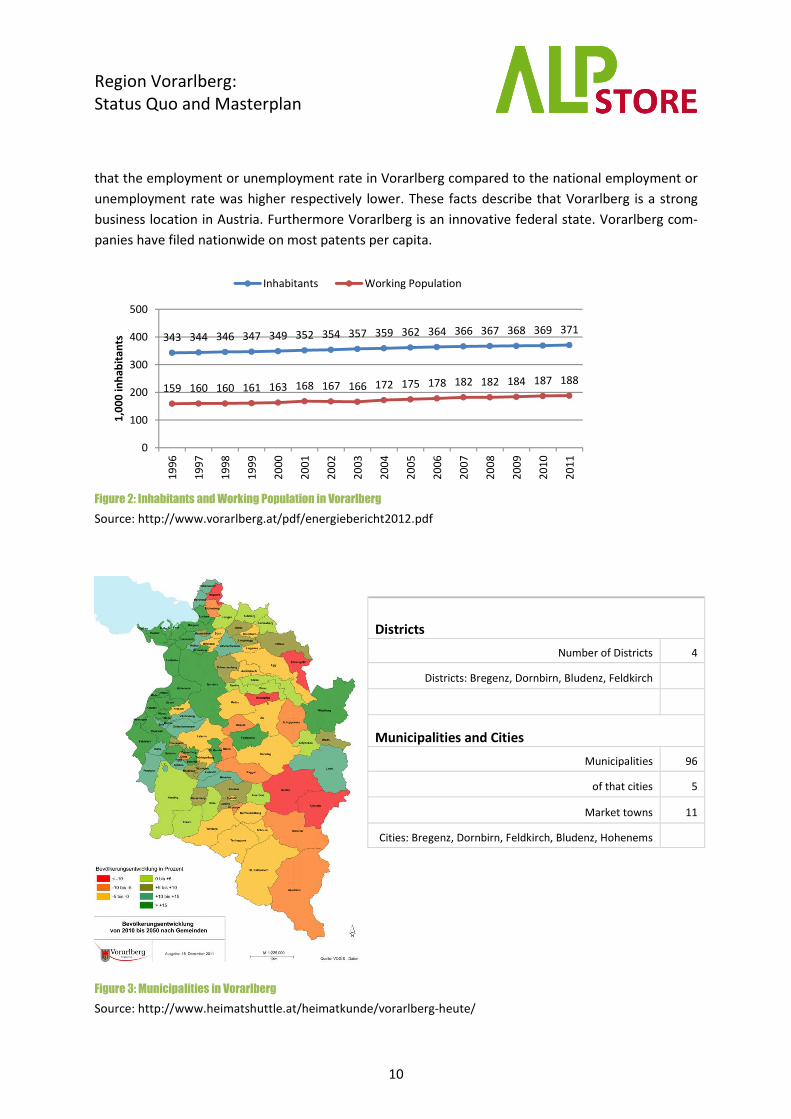
that the employment or unemployment rate in Vorarlberg compared to the national employment or
unemployment rate was higher respectively lower. These facts describe that Vorarlberg is a strong
business location in Austria. Furthermore Vorarlberg is an innovative federal state. Vorarlberg com-
panies have filed nationwide on most patents per capita.
Figure 2: Inhabitants and Working Population in Vorarlberg
Source: http://www.vorarlberg.at/pdf/energiebericht2012.pdf
Districts
Number of Districts 4
Districts: Bregenz, Dornbirn, Bludenz, Feldkirch
Municipalities and Cities
Municipalities 96
of that cities 5
Market towns 11
Cities: Bregenz, Dornbirn, Feldkirch, Bludenz, Hohenems
Figure 3: Municipalities in Vorarlberg
Source: http://www.heimatshuttle.at/heimatkunde/vorarlberg-heute/
343 344 346 347 349 352 354 357 359 362 364 366 367 368 369 371
159 160 160 161 163 168 167 166 172 175 178 182 182 184 187 188
0
100
200
300
400
500
19
96
19
97
19
98
19
99
20
00
20
01
20
02
20
03
20
04
20
05
20
06
20
07
20
08
20
09
20
10
20
11
1,0
00
in
ha
bit
an
ts
Inhabitants Working Population

Region Vorarlberg:
Status Quo and Masterplan
11
Figure 4: Rivers, Lakes in Vorarlberg and Drainage Area
Source: http://vorarlberg.naturfreunde.at/Berichte/detail/25762/
Source: http://www.vorarlberg.at/pdf/dokumentwasserwirtschafts.pdf
The main rivers in Vorarlberg are the Ill (running through the Montafon and Walgau valleys into the
Rhine), the Rhine (forming the border to Switzerland), the Bregenzer Ach and the Dornbirner Ach.
Important lakes, apart from Lake Constance are Lünersee, Silvrettasee, Vermuntsee, Spullersee, the
Kops Basin and Formarin Lake. The first four were created for the production of hydroelectric energy.
However, even before the dam for the power plant was built, Lünersee was the largest mountain
lake in the Alps.
As there are several notable mountain ranges in Vorarlberg, such as the Silvretta, the Rätikon, the
Verwall and the Arlberg, there are many well-known skiing regions (Arlberg, Montafon, Bregen-
zerwald) and ski resorts (Lech, Zürs, Schruns, Warth, Damüls, Brand and many more). Damüls is also
recognized as the municipality with the most annual snowfall worldwide (on average 9.30 meters).
The highest mountain is Piz Buin, whose rocky peak of 3,312 meters is surrounded by glaciers. The
distance from Lake Constance and the plains of the Rhine valley across the medium altitude and high
alpine zones to the glaciers of the Silvretta range is a mere 90 km.

Region Vorarlberg:
Status Quo and Masterplan
12
Vorarlberg is known as a strong economy and tourism location. For several years, the Vorarlberg
economy has been performing well above the Austrian average. The regional product per inhabitant
in Vorarlberg is 34,600 EUR, exceeding the Austrian national average of 32,900 EUR. Vorarlberg and
especially the Rhine Valley is one of the wealthiest areas in the world, with a very high standard of
living. In addition to the flourishing textile, clothing, electronics, machinery and packing materials
industries of the Rhine Valley, there is also a broad agricultural base, especially in the Bregenz Forest
(Bregenzerwald), which is noted for its dairy products and tourism. The tourist industry employs a
considerable number of inhabitants of Vorarlberg. The greatest tourist attractions are the mountains
and the numerous ski resorts, the largest of which are:
• the Bregenz Forest,
• the Arlberg region (including the high-class ski resorts Lech and Zürs),
• the Brandnertal
• the Montafon
• the Kleinwalsertal and
• the Großwalsertal
Figure 5: Economic Growth of Vorarlberg
Source: http://www.vorarlberg.at/pdf/energiebericht2012.pdf
2,0%
3,4%
5,1%5,6%
3,5%3,8%
0,9%
4,7% 4,8%
5,6%
6,6%
4,8%
-2,8%
4,1%
5,0%
-04%
-02%
00%
02%
04%
06%
08%
19
97
19
98
19
99
20
00
20
01
20
02
20
03
20
04
20
05
20
06
20
07
20
08
20
09
20
10
20
11
Economic Growth

Region Vorarlberg:
Status Quo and Masterplan
13
Energy Autonomy Vorarlberg 2050
Energy autonomy Vorarlberg is the central energy policy program of the State of Vorarlberg, which
was initiated in 2007. Austria's westernmost province, Vorarlberg, had set itself an ambitious target:
achieving energy self-sufficiency based on renewable energy sources by 2050 and so becoming inde-
pendent of price rises and supply shortfalls affecting oil and natural gas. This long-term strategic goal
has been supported in a unanimous decision by all political parties.
The process “Vorarlberg's Energy Future” is intended to implement a sustainable energy supply sys-
tem step by step and make a valuable contribution to climate protection. This long-term strategy
relies upon four pillars: energy saving and energy efficiency, increased employment of renewable
energy, new mobility strategies and investment in research, development and education.
In a first phase, a vision process was carried out in ten workshops. Based on these results concrete
measures, how to implement the vision process, have been developed. In this participatory process
experts but also representatives of interest groups have been involved. In the near future, by 2020,
Vorarlberg wants to achieve at least the energy policy goals set by the EU (20-20-20). So the task was
to draw up an action plan that describes specific measures on the one hand for the next about
10 years, which are suitable to achieve the 2020 targets and on the other hand can classify the goals
of the energy autonomy. In 2011, an extensive portfolio of measures was adopted, the so-called
“101 measures for our grandchildren”.
Figure 6: Energy Autonomy Vorarlberg
Source: http://www.energiezukunft-vorarlberg.at/
The implementation process started in spring 2012. Four working groups focused on the topics re-
newable energy, building, industry and trade and mobility and spatial planning and prioritized around
40 measures and worked out concrete implementation steps. These have been presented in Decem-
ber 2012. The main task in the coming years will be an ongoing implementation of the 101 measures
and an implementation of a continuous monitoring system, which should evaluate the implemented
projects.
Region Vorarlberg:
Status Quo and Masterplan
14
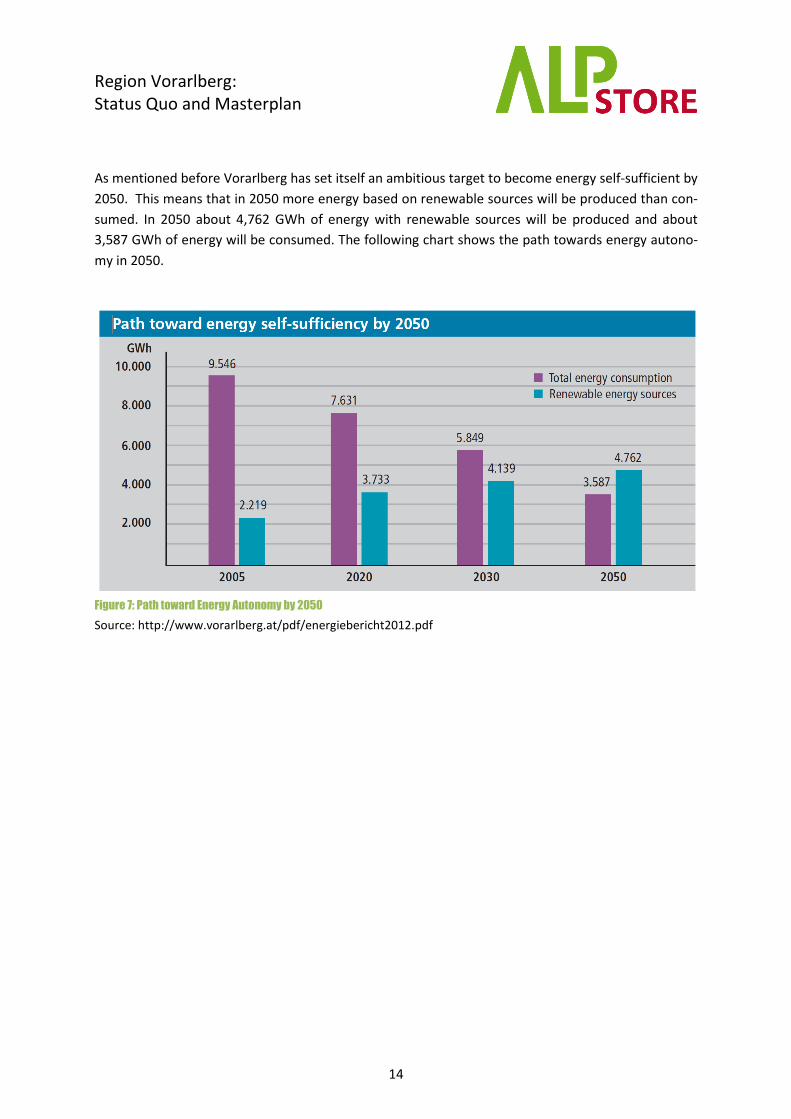
As mentioned before Vorarlberg has set itself an ambitious target to become energy self-sufficient by
2050. This means that in 2050 more energy based on renewable sources will be produced than con-
sumed. In 2050 about 4,762 GWh of energy with renewable sources will be produced and about
3,587 GWh of energy will be consumed. The following chart shows the path towards energy autono-
my in 2050.
Figure 7: Path toward Energy Autonomy by 2050
Source: http://www.vorarlberg.at/pdf/energiebericht2012.pdf

Region Vorarlberg:
Status Quo and Masterplan
15
3 Status quo of Energy System
3.1 Energy Production
The energy system is based on import and exports of energy like in other regions. Vorarlberg plays in
the European electricity market with the hydro pump storage power plants a major role. Vorarlberg
for example imports surplus electricity and pumps water back to the storage lakes and uses the
stored water to produce electricity when it is needed. The following chart shows that the amount of
imported electricity is much higher than the exported one. The reason for that situation is that Vor-
arlberg is a so called electricity transit country. This means that electricity from Germany is passed
through Vorarlberg to Switzerland. That is the reason why the bars in the chart show such a high
import and export for Germany respectively for Switzerland.
Figure 8: Import and Export of Electricity in Vorarlberg
Source: http://www.vkw.at/downloads/at/illwerke_vkw_Nachhaltigkeitsbericht_2010_Web.pdf
3.1.1 Conventional Power Plants
Vorarlberg is a region where hydro power plays an important role in the production of electricity.
More than three quarters of the sold electricity comes from hydro power plants. 8 % of the electrici-
ty, which is sold by the VKW, comes from gas fired power plants. Wind and biomass each have a per-
centage of 4 %. Other renewable energy sources and coal are practical negligible. Vorarlberg has no
conventional nuclear, gas or oil fired power plant in operation.
1084
4645
70 0
1122
827
2184
261
0
500
1000
1500
2000
2500
3000
3500
4000
4500
5000
Tyrol Germany Switzerland Liechtenstein
Import
Export

Region Vorarlberg:
Status Quo and Masterplan
16
Because of the high amount of renewable energy sources the CO2 emissions with 28 g/kWh are lower
compared to the national and the European level. Another point is that the illwerke vkw and also the
other energy suppliers in Vorarlberg don’t sell electricity which comes from nuclear power plants.
Therefore Vorarlberg has no radioactive waste.
Figure 9: European Electricity Mix vs. Vorarlberg Electricity Mix and Allocation of Renewable Energies
Source: http://www.vkw.at/inhalt/at/strom-haushalt-stromherkunft.htm
Source: http://www.vorarlberg.at/pdf/energiebericht2012.pdf
3.1.2 Renewable Energies
As mentioned before, the electricity production in Vorarlberg is strongly based on hydro power. Oth-
er renewable energy sources, like biomass, biogas, photovoltaic and other renewable energy sources
play nowadays a minor role in Vorarlberg compared to hydro power.
Figure 10: Energy Production with renewable energy sources
Source: http://www.vorarlberg.at/pdf/energiebericht2012.pdf
28%
92%46%
8%26%
0%
0%
20%
40%
60%
80%
100%
EU-Mix Vorarlberg
Nuclear
Coal, Oil, Gas
Renewable Energies (incl. Hydro Power)
83%
4%4%
1% 8%
Hydro Power
Wind
Biomass
Other Renewable Energies
Gas
2567
24410 20 16 9 58
0
500
1000
1500
2000
2500
3000
Large Hydro
Power Plants
>10 MW
Small Hydro
Power Plants
<10 MW
Production of
landfill and
sewage gas
Biomass Biogas Photovoltaic Others
GW
h

Region Vorarlberg:
Status Quo and Masterplan
17
Hydro Power
Water is and was an important economical resource in Vorarlberg. The production of electricity with
hydro power plants has in Vorarlberg a big economic significance. Round about 270 hydro power
stations produce per year about 2,869 GWh. The sizes of the power plants are different. Hydro pow-
er plants are small if they have a capacity which is less than 10 MW. Hydro power plants bigger than
10 MW are large hydro power plants. In Vorarlberg are 77 % of all hydro power plants smaller than
1 MW and produce round about 0.6 % of the total amount of energy from hydro. About 12 % of all
hydro power plants with a capacity of 1 to 10 MW produce round about 3.3 % of the total amount of
energy from hydro. About 11 % of all hydro power plants in Vorarlberg have a capacity bigger than
10 MW and produce roundabout 96 % of the total energy amount from hydro. These large power
plants have therefore the most significant impact in case of production.
Figure 11: Number of Facilities and Capacity
Source: http://www.vorarlberg.at/pdf/dokumentwasserwirtschafts.pdf
Most of the large hydro power plants are pump and hydro storage power plants. Both of them use
the water from lakes in the mountains, which act as a storage. Pump storage power plants have fur-
thermore the possibility to pump the water back to the lake. Both of them produce peak and control
energy to stabilize the European grid. The key data to the power plants, which are operating in Vor-
arlberg, can be found in the chapter 4.3.2 – Pump and hydro storage power plants.
Number of facilities in % Capacity in %

Region Vorarlberg:
Status Quo and Masterplan
18
The following map shows all the hydro power plants of VKW and Illwerke in Vorarlberg.
Figure 12: Hydro Power Plants in Vorarlberg
Source: http://www.vkw.at/downloads/at/illwerke_vkw_Nachhaltigkeitsbericht_2010_Web.pdf
Other renewable energy sources
In addition to hydro power, the other renewable energy sources biogas, biomass, photovoltaic and
other renewable sources play a minor role in Vorarlberg. All of them together produce about
113 GWh of electricity. Compared to the 2,811 GWh of hydro power it is nearly negligible.
Power Plant > 300 MW
Power Plant 200 MW to 300 MW
Power Plant 30 MW to 200 MW
Power Plant 4,000 KW to 30 MW
Power Plant 0 to 4,000 KW

Region Vorarlberg:
Status Quo and Masterplan
19
3.2 Energy Consumption
Figure 13: Overview Energy Consumption
Source: http://www.vorarlberg.at/pdf/energiebericht2012.pdf
In 2011 the total energy consumption has been in total around 10,500 GWh. The energy consump-
tion can be divided into the sectors fuel, gas, electricity, coal, wood, heating oil and other energy
forms. The biggest part of the total consumption is the sector transport (fuel) with about 36 %. In
2009 the consumption of fuel has been about 30 %. On the second and third place are electricity
with 26 % and gas with nearly 19 %. Oil for heating and wood are the next two energy forms with 9 %
and 8 %. The remaining 2 % are other energy forms. The other energy forms and coal don’t have such
a large impact on the total consumption.
Figure 14: Allocation of Total Energy Consumption and CO2
Source: http://www.vorarlberg.at/pdf/energiebericht2012.pdf
Quantity Consumption CO2to GWh to
Domestic Fuel 79 936 253,258Diesel 225 2,673 680,211Petrol 91 1,064 265,435Fuel Total 316 3,737 945,646Gas --- 1,929 381,942Coal 413 3 964Wood --- 866 ---Electricity (without pump storage) --- 2,726 399,658Heat Pumps --- 139 ---Solarthermal --- 83 ---Others --- 222 ---Total 10,419 1,981,469Total with pump storage 11,967 2,208,420
Energy Source
9%
36%
19%
8%
26%
2%
Domestic Fuel
Fuel Total
Gas
Wood
Electricity (without pump storage)
Others

Region Vorarlberg:
Status Quo and Masterplan
20
The following diagram shows the trend of the totals energy consumption in the years from 2003 till
2010. The consumption of fuel in 2009 and 2010 have sloped up most strongest compared to the
other energy forms. The energy forms like coal, gas and the other energy forms were at a constant
level in the past years. Electricity and wood increased continuously in the past years. Oil, which is
mainly used for heating, on the other hand decreased steady.
Figure 15: Development of Energy Consumption by form of Energy
Source: http://www.vorarlberg.at/pdf/energiebericht2012.pdf
Electricity
In 2011 about 2,727 GWh of electricity have been consumed in different sectors. In addition to that
the pump hydro storages needed 1,548 GWh to pump the water back to the lakes in the mountains.
So alltogether Vorarlberg had an electricity consumption of 4,275 GWh in 2011.
Figure 16: Allocation Electricity
Source: http://www.vorarlberg.at/pdf/energiebericht2012.pdf
0
500
1.000
1.500
2.000
2.500
3.000
3.500
4.000
4.500
5.000
2003 2004 2005 2006 2007 2008 2009 2010
Fuel
Gas
Electricity
Coal
Wood
Heating oil
Others
2727
1548 Consumption
Consumption Pump Storage
Region Vorarlberg:
Status Quo and Masterplan
21
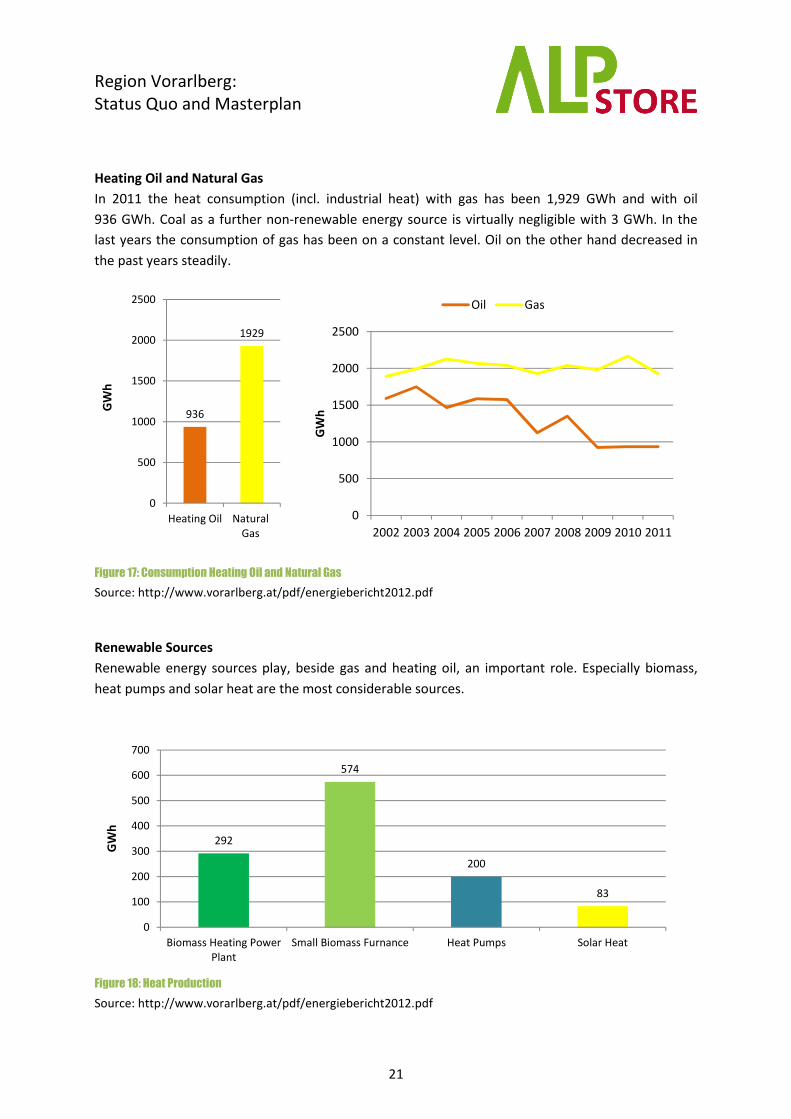
Heating Oil and Natural Gas
In 2011 the heat consumption (incl. industrial heat) with gas has been 1,929 GWh and with oil
936 GWh. Coal as a further non-renewable energy source is virtually negligible with 3 GWh. In the
last years the consumption of gas has been on a constant level. Oil on the other hand decreased in
the past years steadily.
Figure 17: Consumption Heating Oil and Natural Gas
Source: http://www.vorarlberg.at/pdf/energiebericht2012.pdf
Renewable Sources
Renewable energy sources play, beside gas and heating oil, an important role. Especially biomass,
heat pumps and solar heat are the most considerable sources.
Figure 18: Heat Production
Source: http://www.vorarlberg.at/pdf/energiebericht2012.pdf
936
1929
0
500
1000
1500
2000
2500
Heating Oil Natural
Gas
GW
h
0
500
1000
1500
2000
2500
2002 2003 2004 2005 2006 2007 2008 2009 2010 2011
GW
h
Oil Gas
292
574
200
83
0
100
200
300
400
500
600
700
Biomass Heating Power
Plant
Small Biomass Furnance Heat Pumps Solar Heat
GW
h

Region Vorarlberg:
Status Quo and Masterplan
22
Biomass with 866 GWh of heat production plays the most important role in the field of renewable
energy sources. Heat pumps with 200 GWh and solar heat with 83 GWh have also noticeable share of
the total heat production in Vorarlberg. The share of the renewable energy sources in the heat pro-
duction has steadily increased from 2009 and 2011. It can be assumed, that the share of renewable
energy production will also increase in the future.
Figure 19: Development of Heat Production out of Renewable Energy Sources
Source: http://www.vorarlberg.at/pdf/energiebericht2012.pdf
Fuel
Vorarlberg is known as a nice tourism location. Every year a lot of tourist visit Vorarlberg. This has
impacts on the fuel consumption of Vorarlberg. On the other hand are the prices for fuel, compared
to the neighbor countries, cheaper. For that reason the fuel consumption is divided into “with tour-
ism” and “without tourism”.
Figure 20: Consumption of Fuel in Vorarlberg
Source: http://www.vorarlberg.at/pdf/energiebericht2012.pdf
177 187 200216258
292
548 568 574
70 76 83
0
100
200
300
400
500
600
700
20
09
20
10
20
11
GW
h
Heat Pump Biomass Heating Power Plant Small Biomass Furnance Solar Heat
3737
2819
0
500
1000
1500
2000
2500
3000
3500
4000
total with
fuel tourism
total without
fuel tourism
GW
h
0
1000
2000
3000
4000
5000
2004 2005 2006 2007 2008 2009 2010 2011
with tourism without tourism
Region Vorarlberg:
Status Quo and Masterplan
23
The consumption for fuel has in the past years steadily increased. In 2011 about 3,737 GWh of fuel
have been consumed by the inhabitants of Vorarlberg and the tourists, who visited Vorarlberg. The
visits of the tourists strongly depend on whether conditions and fuel prices at gas stations. A forecast
of the future fuel consumption is therefore difficult to predict.
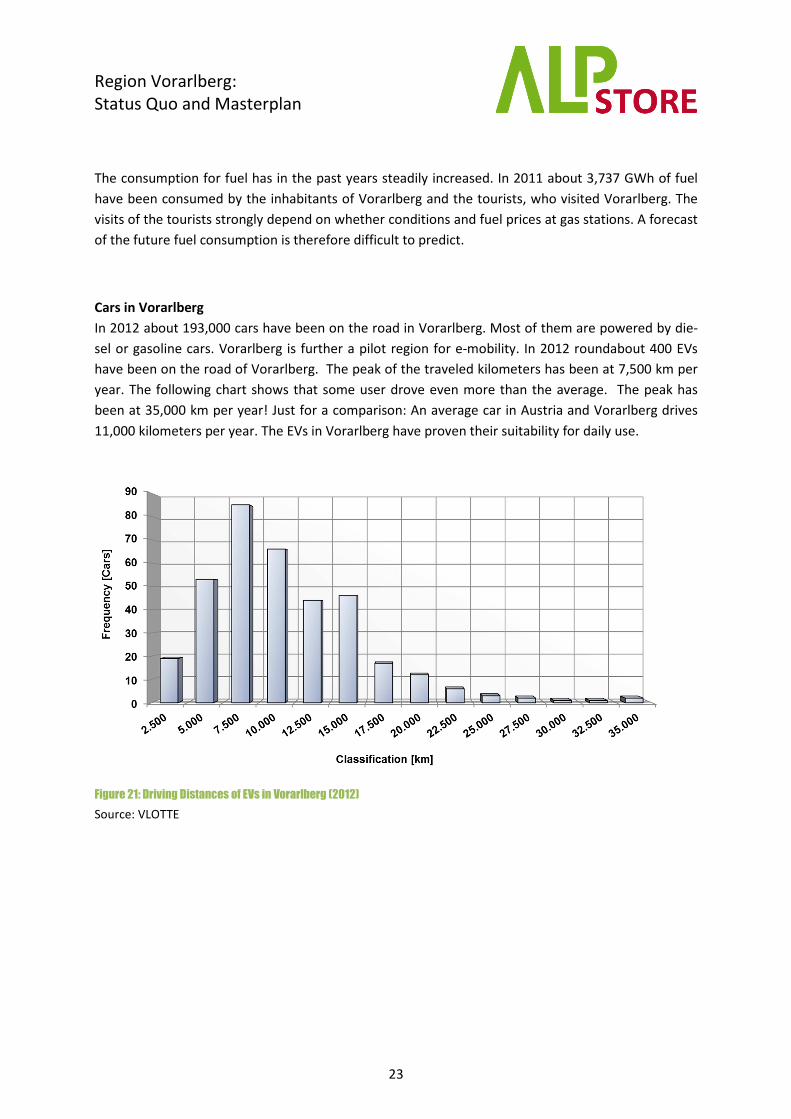
Cars in Vorarlberg
In 2012 about 193,000 cars have been on the road in Vorarlberg. Most of them are powered by die-
sel or gasoline cars. Vorarlberg is further a pilot region for e-mobility. In 2012 roundabout 400 EVs
have been on the road of Vorarlberg. The peak of the traveled kilometers has been at 7,500 km per
year. The following chart shows that some user drove even more than the average. The peak has
been at 35,000 km per year! Just for a comparison: An average car in Austria and Vorarlberg drives
11,000 kilometers per year. The EVs in Vorarlberg have proven their suitability for daily use.
Figure 21: Driving Distances of EVs in Vorarlberg (2012)
Source: VLOTTE

Region Vorarlberg:
Status Quo and Masterplan
24
40%
23%
27%
2%
8%
Industry
Crafts
Households
Agriculture
Consumption and Distribution
4 Energy Consumption by sector
Vorarlberg is a strong economy location. The industry and the crafts are two big energy consumers,
with a share of 63 % of the total energy consumption. The households are also big consumers with a
share of 27 %. The other two sectors agriculture and consumption and distribution doesn’t play such
a big role with 10 %.
Figure 22: Energy Consumption by Sector
Source: http://www.vorarlberg.at/pdf/energiebericht2012.pdf
4.1.1 Business clients
The large-scale consumer with a consumption of > 100.000 kWh/year couldn’t be figured out.
4.1.2 Private consumers and small-scale business clients
The small-scale consumer with a consumption of < 100.000 kWh/year couldn’t be figured out.
1087
633
745
51
211
0
200
400
600
800
1000
1200
Industry Crafts Households Agriculture Consumption
and
Distribution
GW
h

Region Vorarlberg:
Status Quo and Masterplan
25
4.1.3 Trends
Figure 23: Development Energy Consumption by Sector
Source: http://www.vorarlberg.at/pdf/energiebericht2012.pdf
The consumption of energy in the sector “households” hasn’t changed in recent years. Also other
sectors like crafts, agriculture and consumption and distrubition haven’t shown markable changes. In
the industry sector the situation is different. The industry is much more depending on external
factors like economic growth, crises and so on. The curve for industry shows such effects like in 2009
when the global economic crises has reached Vorarlberg. A common trend for the future is therefore
hard to predict, especially in the sectors of industry and crafts.
GWh 2007 2008 2009 2010 2011Industry 1047 1066 1022 1078 1087
Crafts 617 624 629 641 633
Households 741 745 762 772 745
Agriculture 52 52 54 56 51
Consumption and Distribution 237 228 212 221 211
Total 2694 2715 2679 2768 2727
Trends
1047 10661022
1078 1087
617 624 629 641 633
741 745 762 772 745
52 52 54 56 51
237 228 212 221 211
0
200
400
600
800
1000
1200
2007 2008 2009 2010 2011
GW
h
Industry Crafts Households Agriculture Consumption and Distribution

Region Vorarlberg:
Status Quo and Masterplan
26
4.2 Energy Transmission and Distribution
4.2.1 Power grid
Figure 24: Power Grid in Vorarlberg - Data
Source: http://www.vkw.at/downloads/at/illwerke_vkw_Nachhaltigkeitsbericht_2010_Web.pdf
Vorarlberg boarders to Germany in the North, Liechtenstein and Switzerland in the East and Tyrol in
the West. In Vorarlberg are nearly 350 km of high voltage power lines installed. These power lines
transport the electricity to and from the boarder states. Furthermore are about 1,700 km of power
lines in the medium voltage grid and about 8,200 km of power lines in the low voltage grid installed.
The total length of the power grid is 10,200 km and has atotal grid loss of 3.3 %. Vorarlberg has a
high share of cable. In the medium voltage grid are about 84 % and in the low voltage grid above
98 % of all power grids cable.
The wires run from the Montafon valley through the Rhine valley. 23 transformer stations transform
the electriciy from lower to higher voltage and the other way round. In total are 2,462 MVA of
transformer capacity installed.
High Voltage (220kV, 110 kV) 348.8 kmMedium Voltage (30kV, 20kV, 10kV) 1,691.1 kmLow Voltage (to 1kV) 8,182.4 km
Total 10,227.3 km
Power Line
Transformer Stations 23Installed capacity of Transformer Stations 2,462.0 MVAGrid losses 3.3 %Share of Cable - Medium Voltage about 84 %Share of Cable - Low Voltage > 98 %
Key Facts

Region Vorarlberg:
Status Quo and Masterplan
27
Figure 25: Power Grid in Vorarlberg - Map
Source: http://www.vkw.at/downloads/at/illwerke_vkw_Nachhaltigkeitsbericht_2010_Web.pdf
Transformer Station 30kV
Transformer Station 110kV
Transformer Station 220/380kV
Power Line VKW-Grid 30kV
Power Line VKW-Grid 110kV Power Line VKW-Grid 220/380kV Power Line Illwerke 110/220kV Power Line Illwerke 220/380kV Power Line APG 220/380kV

Region Vorarlberg:
Status Quo and Masterplan
28
4.2.2 Gas grid
Through the Rhine Valley, in which most of the inhabitants of Vorarlberg live, runs a high-pressure
pipeline with a total length of 81.5 km². In addition to the high-pressure pipeline exists medium- and
low pressure pipelines, which provide gas in the cities and municipalities. The grid length of the me-
dium-pressure and the low-pressure pipelines are 201.7 km² respectively 1,773.7 km². In total
27,000 connections to the gas grid exists at the moment.
Figure 26: Gas Grid in Vorarlberg - Map
Source: http://www.illwerke.at/downloads/at/illwerke_vkw_Nachhaltigkeitsbericht_2012.pdf
High-Pressure pipeline
Medium-Pressure pipeline
Service Area
Lake Constance
Municipal boundary
Region Vorarlberg:
Status Quo and Masterplan
29
4.2.3 (Smart) grid issues and development status
Vorarlberg has started to implement smart grids like in Großes Walsertal (see chapter 5.3.2 (Smart)
Grid Solutions.
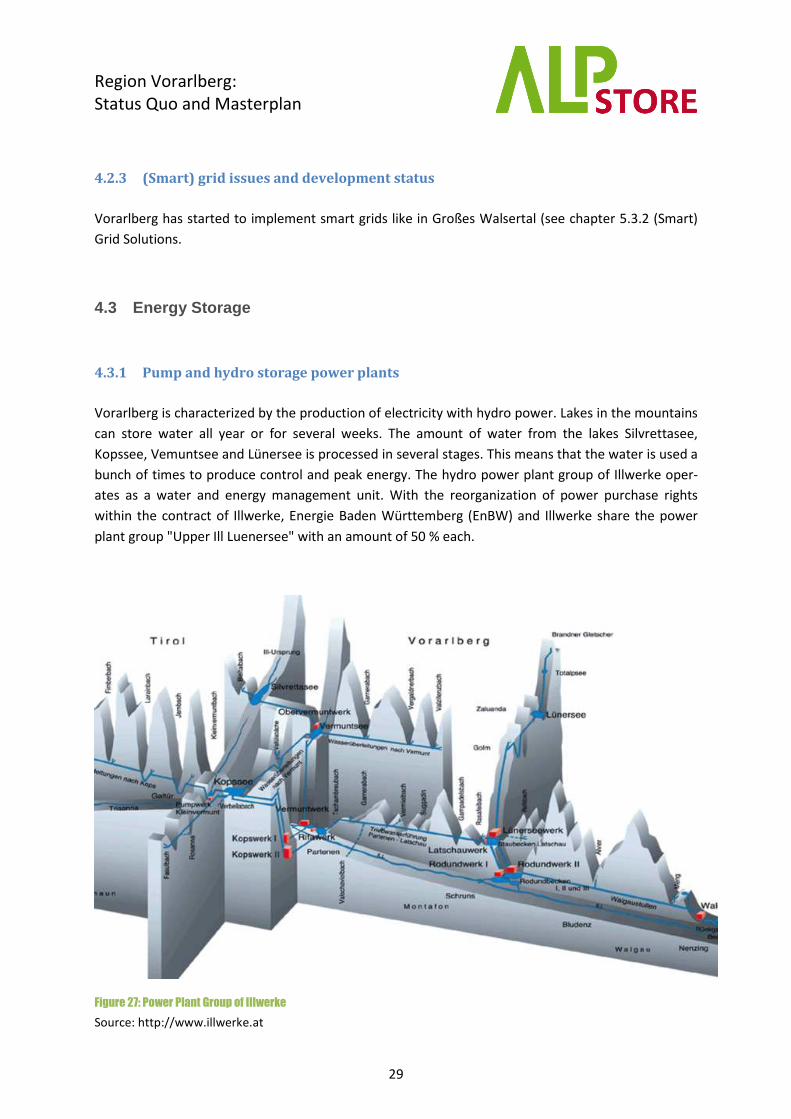
4.3 Energy Storage
4.3.1 Pump and hydro storage power plants
Vorarlberg is characterized by the production of electricity with hydro power. Lakes in the mountains
can store water all year or for several weeks. The amount of water from the lakes Silvrettasee,
Kopssee, Vemuntsee and Lünersee is processed in several stages. This means that the water is used a
bunch of times to produce control and peak energy. The hydro power plant group of Illwerke oper-
ates as a water and energy management unit. With the reorganization of power purchase rights
within the contract of Illwerke, Energie Baden Württemberg (EnBW) and Illwerke share the power
plant group "Upper Ill Luenersee" with an amount of 50 % each.
Figure 27: Power Plant Group of Illwerke
Source: http://www.illwerke.at
Region Vorarlberg:
Status Quo and Masterplan
30
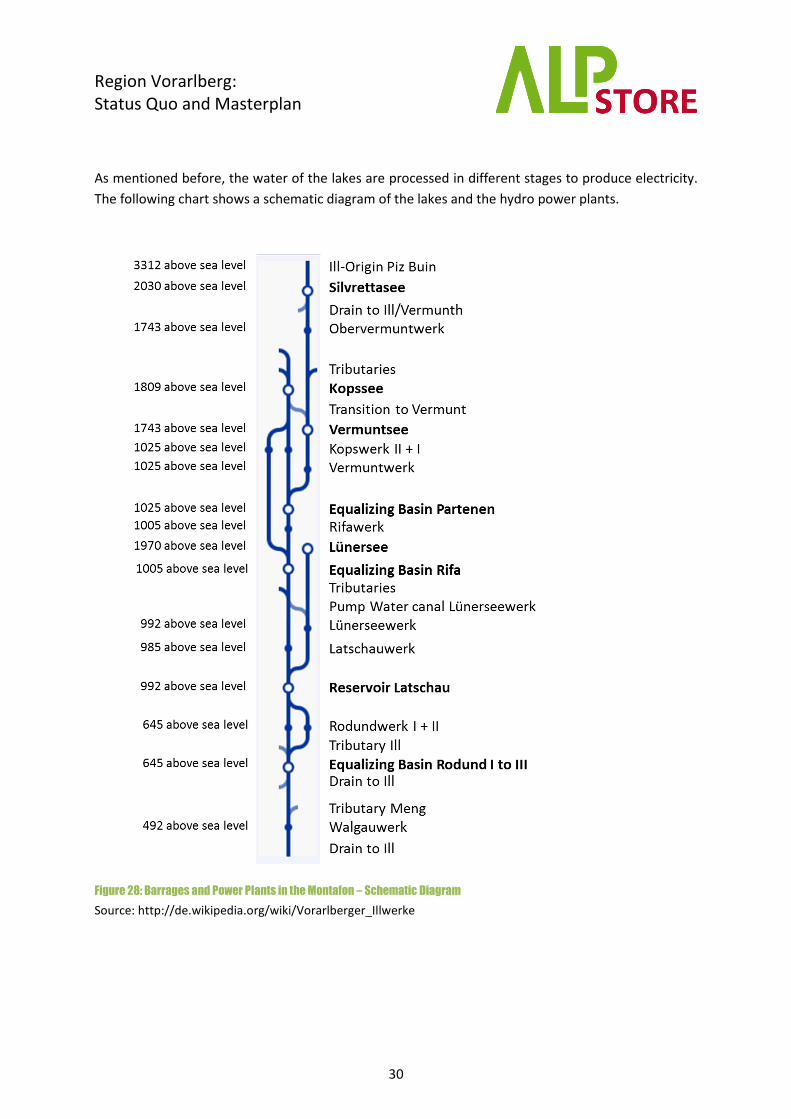
As mentioned before, the water of the lakes are processed in different stages to produce electricity.
The following chart shows a schematic diagram of the lakes and the hydro power plants.
Figure 28: Barrages and Power Plants in the Montafon – Schematic Diagram
Source: http://de.wikipedia.org/wiki/Vorarlberger_Illwerke

Region Vorarlberg:
Status Quo and Masterplan
31
4.3.1.1 Silvrettasee
The Silvrettasee is an annual storage and is fed by natural tributaries. For that reason the inflows can
be stored from summer to winter time to guarantee an all-year energy production. The maximum
storage capacity of the Silvrettasee is 38.6 Mio m³ of water (= 134.69 Mio kWh of stored energy).
Technical Specifications:
Drainage area: 45 km² (10 km² glacier)
Surface of Lake: 1.31 km²
Useable Storage Space: 38.6 Mio m³
Stored Energy: 134.69 Mio kWh
Dam wall length and height: 432 x 80 m
Link Video: Lake Silvretta
Figure 29: Silvrettasee
Source: http://www.illwerke.at
4.3.1.2 Vermuntsee
The Vermuntsee can store water for weeks. Beside the natural tributaries the lake is fed by inflows,
especially from the Kromerbach and the Ill. Furthermore the Obervermuntwerk passes the used wa-
ter to the Vermuntsee. The maximum storage capacity of the Vermuntsee is 5.3 Mio m³ of water
(= 15.13 Mio kWh of stored energy).
Technical Specifications:
Drainage area: 107 km² (12 km² glacier)
Surface of Lake: 0.35 km²
Useable Storage Space: 5.3 Mio m³
Stored Energy: 15.13 Mio kWh
Dam wall length and height: 386 x 53 m
Link Video: Vermuntsee
Figure 30: Vermuntsee
Source: http://www.illwerke.at
Region Vorarlberg:
Status Quo and Masterplan
32
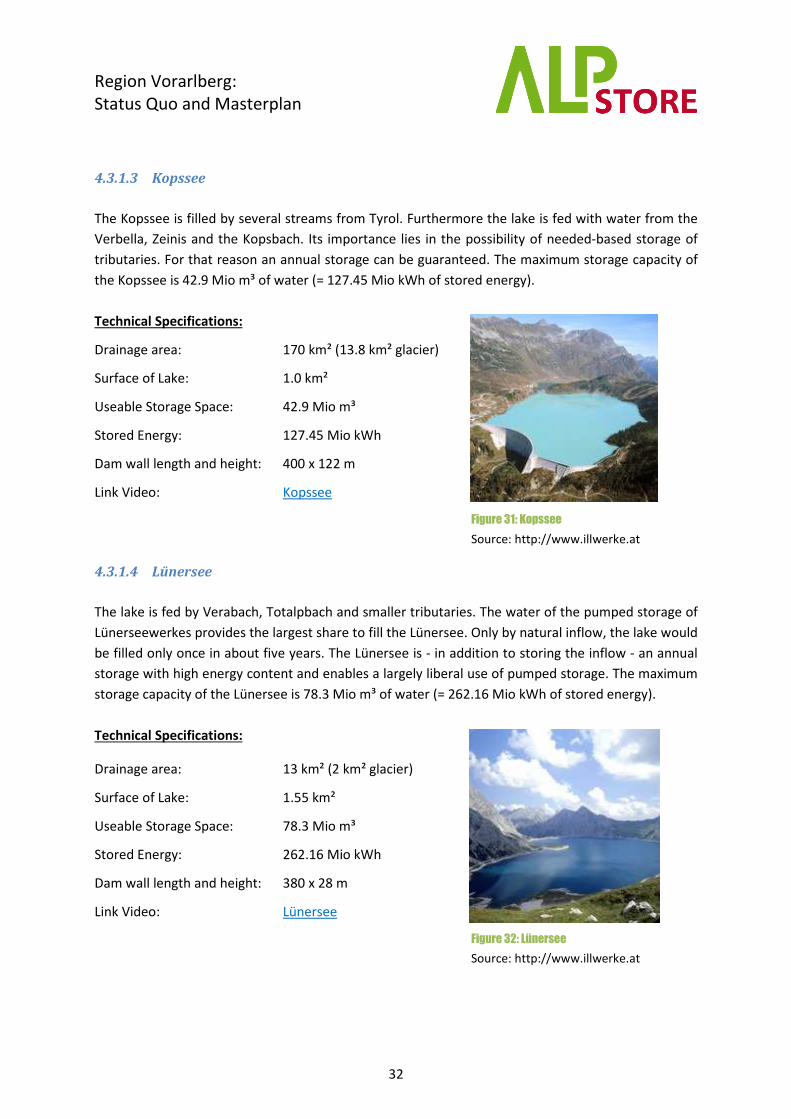
4.3.1.3 Kopssee
The Kopssee is filled by several streams from Tyrol. Furthermore the lake is fed with water from the
Verbella, Zeinis and the Kopsbach. Its importance lies in the possibility of needed-based storage of
tributaries. For that reason an annual storage can be guaranteed. The maximum storage capacity of
the Kopssee is 42.9 Mio m³ of water (= 127.45 Mio kWh of stored energy).
Technical Specifications:
Drainage area: 170 km² (13.8 km² glacier)
Surface of Lake: 1.0 km²
Useable Storage Space: 42.9 Mio m³
Stored Energy: 127.45 Mio kWh
Dam wall length and height: 400 x 122 m
Link Video: Kopssee
Figure 31: Kopssee
Source: http://www.illwerke.at
4.3.1.4 Lünersee
The lake is fed by Verabach, Totalpbach and smaller tributaries. The water of the pumped storage of
Lünerseewerkes provides the largest share to fill the Lünersee. Only by natural inflow, the lake would
be filled only once in about five years. The Lünersee is - in addition to storing the inflow - an annual
storage with high energy content and enables a largely liberal use of pumped storage. The maximum
storage capacity of the Lünersee is 78.3 Mio m³ of water (= 262.16 Mio kWh of stored energy).
Technical Specifications:
Drainage area: 13 km² (2 km² glacier)
Surface of Lake: 1.55 km²
Useable Storage Space: 78.3 Mio m³
Stored Energy: 262.16 Mio kWh
Dam wall length and height: 380 x 28 m
Link Video: Lünersee
Figure 32: Lünersee
Source: http://www.illwerke.at
Region Vorarlberg:
Status Quo and Masterplan
33
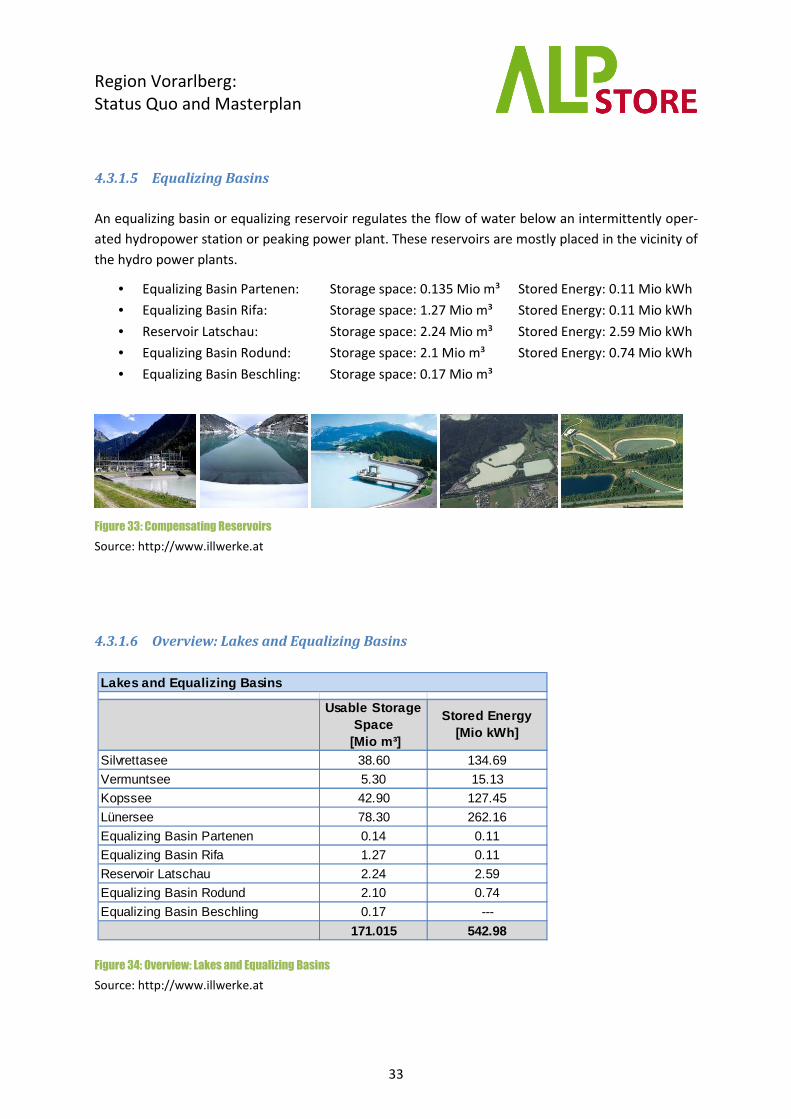
4.3.1.5 Equalizing Basins
An equalizing basin or equalizing reservoir regulates the flow of water below an intermittently oper-
ated hydropower station or peaking power plant. These reservoirs are mostly placed in the vicinity of
the hydro power plants.
• Equalizing Basin Partenen: Storage space: 0.135 Mio m³ Stored Energy: 0.11 Mio kWh
• Equalizing Basin Rifa: Storage space: 1.27 Mio m³ Stored Energy: 0.11 Mio kWh
• Reservoir Latschau: Storage space: 2.24 Mio m³ Stored Energy: 2.59 Mio kWh
• Equalizing Basin Rodund: Storage space: 2.1 Mio m³ Stored Energy: 0.74 Mio kWh
• Equalizing Basin Beschling: Storage space: 0.17 Mio m³
Figure 33: Compensating Reservoirs
Source: http://www.illwerke.at
4.3.1.6 Overview: Lakes and Equalizing Basins
Figure 34: Overview: Lakes and Equalizing Basins
Source: http://www.illwerke.at
Usable Storage Space
[Mio m³]
Stored Energy [Mio kWh]
Silvrettasee 38.60 134.69
Vermuntsee 5.30 15.13
Kopssee 42.90 127.45
Lünersee 78.30 262.16
Equalizing Basin Partenen 0.14 0.11
Equalizing Basin Rifa 1.27 0.11
Reservoir Latschau 2.24 2.59
Equalizing Basin Rodund 2.10 0.74
Equalizing Basin Beschling 0.17 ---
171.015 542.98
Lakes and Equalizing Basins

Region Vorarlberg:
Status Quo and Masterplan
34
4.3.1.7 Rodundwerk I
The Rodundwerk I uses the gradient level Latschau – Rodund. The power station Rodundwerk I pro-
duces peak and control energy. The power plant has the possibility to produce electricity or to pump
water back to reservoir Latschau. The reservoir Latschau is fed by the water of the annual storage
lakes Kops, Silvretta, Luenersee, Vermuntsee and other tributaries. In the power house are four units
installed (nominal capacity of turbines = 4 x 53 MW), one of the units is equipped with a storage
pump (1 x 40 MW). The power plant produces 332 GWh of electricity per year.
Figure 35: Rodundwerk I
Source: http://www.illwerke.at
Technical Specifications:
Height of fall: 353 m
Machines: 4
Nominal capacity of turbine: 4 x 53 MW
Input power of pump: 40 MW
Flow rate turbine and pump: 15m³/sec and 10m³/sec
Nominal voltage of generator: 10.4 kV
Nominal power of generator: 4 x 53 MVA
Bottleneck capacity: 198 MW
Output capacity per year: 332 GWh

Region Vorarlberg:
Status Quo and Masterplan
35
4.3.1.8 Rodundwerk II
The Rodundwerk II uses, like the Rodundwerk I, the gradient level Latschau – Rodund. The power
station Rodundwerk II produces peak and control energy. The power plant has the possibility to pro-
duce electricity or to pump water back to reservoir Latschau. The reservoir Latschau is fed by the
water of the annual storage lakes Kops, Silvretta, Luenersee, Vermuntsee and other tributaries. In
the power house is a pump turbine (nominal capacity of turbine = 295 MW and input power of pump
= 276 MW) installed. The power plant produces 486 GWh of peak and control energy per year.
Figure 36: Rodundwerk II
Source: http://www.illwerke.at
Technical Specifications:
Height of fall: 354 m
Nominal capacity of turbine: 295 MW
Input power of pump: 276 MW
Flow rate turbine and pump: 98m³/sec and 76m³/sec
Nominal voltage of generator: 21 kV
Nominal power of generator: 310 MVA
Bottleneck capacity: ---
Output capacity per year 486 GWh

Region Vorarlberg:
Status Quo and Masterplan
36
4.3.1.9 Lünerseewerk
The Lünerseewerk uses the gradient level Lünersee – Latschau. The power station Lünerseewerk
produces peak and control energy. The power plant has the possibility to produce electricity or to
pump water back to reservoir Lünersee. The reservoir Lünersee is an annual storage for water and is
fed by natural tributaries. In the power house are five units with a total nominal capacity of the tur-
bines with 232 MW an input power of the pumps with 224 MW installed. The power plant produces
371 GWh of electricity per year.
Figure 37: Lünerseewerk
Source: http://www.illwerke.at
Technical Specifications:
Height of fall: 974 m
Machines: 5
Nominal capacity of turbine: 232 MW (each machine 46.2 MW)
Input power of pump: 224 MW (each machine 43 MW)
Flow rate turbine and pump: 5.52m³/sec and 4.42m³/sec for each machine
Nominal voltage of generator: 10.5 kV
Nominal power of generator: 56 MVA for each machine
Bottleneck capacity: 232 MW
Output capacity: 371 GWh

Region Vorarlberg:
Status Quo and Masterplan
37
4.3.1.10 Kopswerk I
The Kopswerk I uses the gradient level Kopssee – Partenen. The power station Kopswerk I produces
peak and control energy. The reservoir Kopssee stores water from natural tributaries. In the power
house are 3 units with a total nominal capacity of the turbines with 254 MW installed. The power
plant produces 392 GWh of electricity per year.
Figure 38: Kopswerk I
Source: http://www.illwerke.at
Technical Specifications:
Height of fall: about 800 m
Machines: 3
Nominal capacity of turbine: 254 MW (each machine 84.6 MW)
Input power of pump: ---
Flow rate turbine and pump: 12m³/sec
Nominal voltage of generator: 12.5 kV
Nominal power of generator: 2 x 10² MVA
Bottleneck capacity: 247 MW
Output capacity: 392 GWh

Region Vorarlberg:
Status Quo and Masterplan
38
4.3.1.11 Kopswerk II
The Kopswerk II is the newest and biggest pump storage power plant of illwerke. It uses the gradient
level Kopssee – Partenen-Rifa. The power station Kopswerk II produces peak and control energy. The
power plant has the possibility to produce electricity or to pump water back to reservoir Kopssee. In
the power house are 3 units with a total nominal capacity of the turbines with 525 MW and an in-
stalled input power of the pumps with 450 MW placed. The power plant produces 450 GWh of peak
and control energy per year.
Figure 39: Kopswerk II
Source: http://www.illwerke.at
Technical Specifications:
Height of fall: ---
Machines: 3
Nominal capacity of turbine: 525 MW (each machine 175 MW)
Input power of pump: 450 MW (each machine 150 MW)
Flow rate turbine and pump: 25.3m³/sec and 19.3m³/sec
Nominal voltage of generator: ---
Nominal power of generator: 3 x 200 MVA
Bottleneck capacity: 525 MW
Output capacity: 450 GWh

Region Vorarlberg:
Status Quo and Masterplan
39
4.3.1.12 Vermuntwerk
The Vermuntwerk uses the gradient level Vermuntsee – Partenen. The power station Vermuntwerk
produces peak and control energy. The reservoir Vermuntsee is fed by natural tributaries and by
water of the Lake Silvretta. In the power house are five units with a total nominal capacity of the
turbines with 155 MW installed. The power plant produces 260 GWh of electricity per year.
Figure 40: Vermuntwerk
Source: http://www.illwerke.at
Technical Specifications:
Height of fall: ---
Machines: 5
Nominal capacity of turbine: 155 MW (4 x 29.6 MW and 1 x 36.8 MW)
Input power of pump: ---
Flow rate turbine: 4 machines have each 5m³/sec and 1 machine has 6m³/sec
Nominal voltage of generator: 6 kVA
Nominal power of generator: 159 MVA (4 x 30 MVA and 1 x 39 MVA)
Bottleneck capacity: 156 MW
Output capacity: 260 GWh
Region Vorarlberg:
Status Quo and Masterplan
40
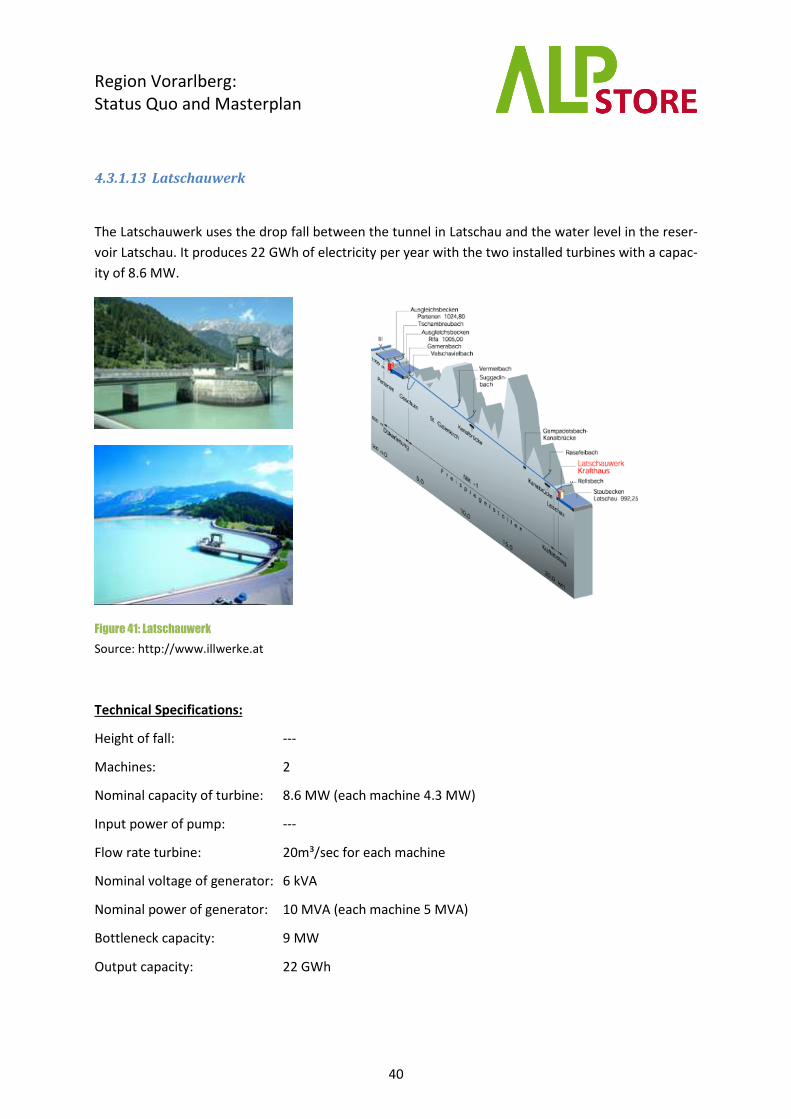
4.3.1.13 Latschauwerk
The Latschauwerk uses the drop fall between the tunnel in Latschau and the water level in the reser-
voir Latschau. It produces 22 GWh of electricity per year with the two installed turbines with a capac-
ity of 8.6 MW.
Figure 41: Latschauwerk
Source: http://www.illwerke.at
Technical Specifications:
Height of fall: ---
Machines: 2
Nominal capacity of turbine: 8.6 MW (each machine 4.3 MW)
Input power of pump: ---
Flow rate turbine: 20m³/sec for each machine
Nominal voltage of generator: 6 kVA
Nominal power of generator: 10 MVA (each machine 5 MVA)
Bottleneck capacity: 9 MW
Output capacity: 22 GWh
Region Vorarlberg:
Status Quo and Masterplan
41
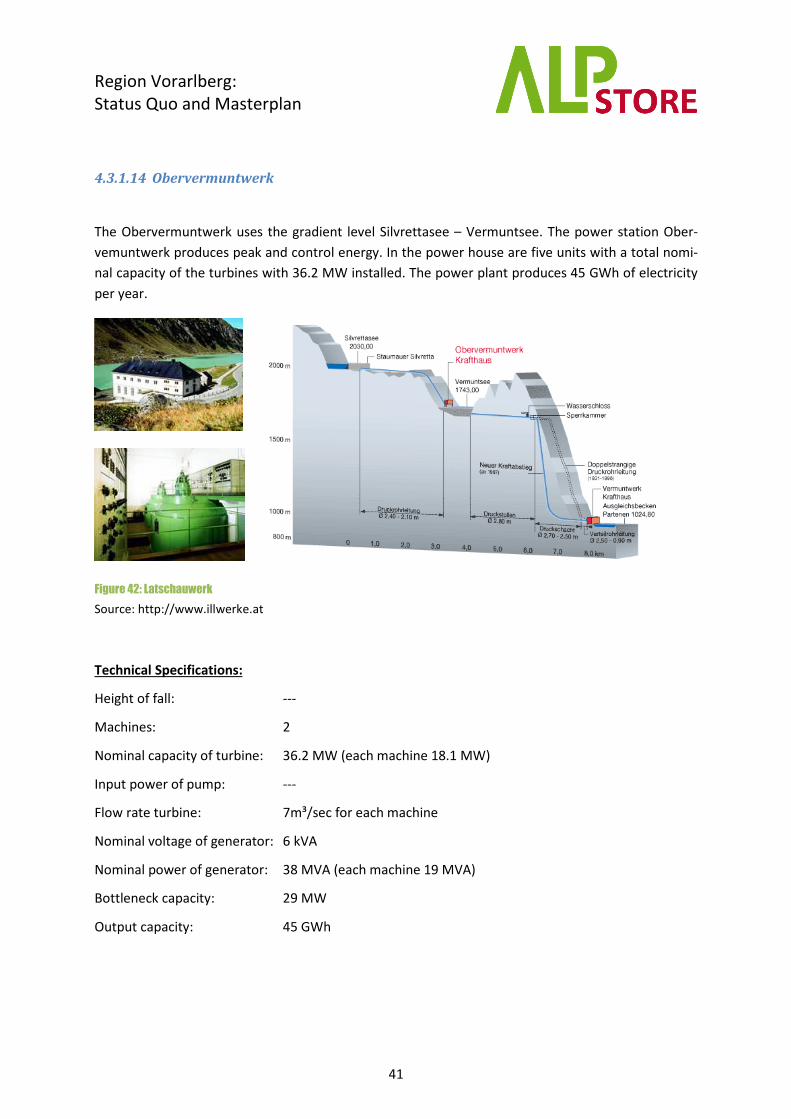
4.3.1.14 Obervermuntwerk
The Obervermuntwerk uses the gradient level Silvrettasee – Vermuntsee. The power station Ober-
vemuntwerk produces peak and control energy. In the power house are five units with a total nomi-
nal capacity of the turbines with 36.2 MW installed. The power plant produces 45 GWh of electricity
per year.
Figure 42: Latschauwerk
Source: http://www.illwerke.at
Technical Specifications:
Height of fall: ---
Machines: 2
Nominal capacity of turbine: 36.2 MW (each machine 18.1 MW)
Input power of pump: ---
Flow rate turbine: 7m³/sec for each machine
Nominal voltage of generator: 6 kVA
Nominal power of generator: 38 MVA (each machine 19 MVA)
Bottleneck capacity: 29 MW
Output capacity: 45 GWh

Region Vorarlberg:
Status Quo and Masterplan
42
4.3.1.15 Rifawerk
The Rifawerk uses the gradient level Kopssee – Partenen. The power station Rifawerk produces peak
and control energy. In the power house are 2 units with a total nominal capacity of the turbines with
8 MW and an installed input power of the pumps with 9 MW placed. The power plant produces
8 GWh of electricity per year.
Figure 43: Latschauwerk
Source: http://www.illwerke.at
Technical Specifications:
Height of fall: ---
Machines: 2
Nominal capacity of turbine: 8 MW (each machine 4 MW)
Input power of pump: 9 MW (each machine 4.5 MW)
Flow rate turbine: 9.5 - 14m³/sec and 11-15m³/sec for each machine
Nominal voltage of generator: 6 kVA
Nominal power of generator: 10.2 MVA (each machine 19 MVA)
Bottleneck capacity: 7 MW
Output capacity: 8 GWh

Region Vorarlberg:
Status Quo and Masterplan
43
4.3.1.16 Walgauwerk
The Walgauwerk uses the gradient level Rodund – Beschling. The power station Walgauwerk produc-
es medium load. In the power house are 2 units with a total nominal capacity of the turbines with 86
MW installed. The power plant produces 356 GWh of electricity per year.
Figure 44: Latschauwerk
Source: http://www.illwerke.at
Technical Specifications:
Height of fall: 162 m
Machines: 2
Nominal capacity of turbine: 86 MW (each machine 2 x 43 MW)
Input power of pump: ---
Flow rate turbine: 34m³/sec for each machine
Nominal voltage of generator: 10 kVA
Nominal power of generator: 106 MVA (each machine 53 MVA)
Bottleneck capacity: 94 MW
Output capacity: 356 GWh

Region Vorarlberg:
Status Quo and Masterplan
44
4.3.1.17 Overview: Storage and Pump Storage Power Plants
The illwerke has in total ten storage and pump storage power plants running. Half of them are pump
storage power plants. The nominal capacity of all turbines is 1,812 MW. The input power of the pump
storage power plants are 999 MW. All power plants have an annual output of 2,722 GWh.
Figure 45: Key Facts Storage and Pump Storage Power Plants
Source: http://www.illwerke.at
Nominal Capacity of
turbines [MW]
Input Power of Pump
[MW]
Output per Year
[GWh]
Pump-Storage
Rodundwerk I 212 40 332 x
Rodundwerk II 295 276 486 x
Lünerseewerk 232 224 371 x
Kopswerk I 254 --- 392 ---
Kopswerk II 525 450 450 x
Vermuntwerk 155 --- 260 ---
Latschauwerk 9 --- 22 ---
Obervermuntwerk 36 --- 45 ---
Rifawerk 8 9 8 x
Walgauwerk 86 --- 356 ---
Total 1,812 999 2,722
Storage and Pump Storage Power Plants

Region Vorarlberg:
Status Quo and Masterplan
45
4.3.2 Biogas digesters and storage tanks
In Vorarlberg are about 37 biogas power plants in use. The gas production of these facilities has been
roundabout 100 GWh in 2009. The biogas is mostly used in combined heat and power units, which
produce per year roundabout 25 GWh of electricity. This amount shall increase to a total biogas pro-
duction of 145 GWh and 42 GWh of electricity till 2020. At this point the resources for biogas power
plants are more or less exhausted. The roadmap for Vorarlberg’s energy autonomy foresees that an-
other 55 GWh of biogas production can be used till 2030. Biogas power plants can only partially con-
tribute to the storage problem. In Vorarlberg biogas power plants won’t play a leading role in the future
storage system.
4.3.3 Thermal energy storage system - Water
Most of heating systems, which use renewable energies like biomass or solar need a thermal storage.
Vorarlberg has already a high share of renewable energies in the heating sector. Vorarlberg has in the
sector of solar thermal worldwide a leading role. By the end of 2011, approximately 200,000 m² of
solar thermal collectors have been installed, which match a share of 0.7 m² per inhabitant. Every year
14,000 m² of solar collectors are installed. The storage capacity for solar thermal facilities is usually
60 to 80 liter per m². The storage capacity for solar thermal has been therefore 16,000 m³ by the end
of 2011. With a higher amount of renewable energies in the heating sector the thermal energy storage
systems based on water become more and more important. These systems will play an important role
in the decentralized thermal storage sector.
4.3.4 Mobile batteries (electric vehicles)
In Vorarlberg are at the moment roundabout 400 electric vehicles with mobile batteries on the road.
These EVs store the energy in batteries with a nominal capacity of approximately 20 kWh. Therefore
the stored capacity of these vehicles is roundabout 8,000 kWh. This capacity is needed to bring users
from point A to B. Electric vehicles don’t play nowadays an important role concerning storage issues.
In the near future this situation will not change. Mobile batteries will probably become more important
concerning storage issues in the further future.
Vorarlberg has set itself an ambitious target to bring 10,000 EVs on the road till 2020. The nominal
storage capacity of these cars will be 200,000 kWh. The capacity is not as high as other storage sys-
tems have, but EVs have the advantage that they can store energy in a short time. The local grids can
therefore be relieved and the self-consumption (e.g. photovoltaic power plants) can be increased. The
possibility to feed in electricity from batteries to the grid is in most cases not given. Mobile batteries
make, from the perspective of VLOTTE, sense, if they shift peak loads by storing them into the batter-
ies. The other way round makes, from the present day perspective, no sense. The future will show, if
there are reasonable use cases.

Region Vorarlberg:
Status Quo and Masterplan
46
5 Future Energy System
Vorarlberg has set itself the target to become autonomous concerning energy issues. This means that
in 2050 Vorarlberg will be independent of price rises and supply shortfalls affecting oil and natural
gas. The future energy system will be based on renewable energy sources.
In this case electricity will have a special role in the energy system of the future. A key element in
supplying energy in the future involves a drastic expansion of tapping renewable energy from sun-
light, water and biomass. It can be expected that the future energy supply of households and indus-
try will be based on electricity. Vorarlberg is moving towards an “electricity society”, i. e. other
sources of energy will progressively be supplanted by electricity (e. g. by using heat pumps or driving
with electric vehicles). The demand for electricity will therefore rise in these areas. In addition to that
energy efficiency will also play a major role. The combination between energy savings, energy effi-
ciency and tapping renewable energy sources will be characteristic for the future energy system.
5.1.1 Renewable Energies
The future energy system will be based on renewable energy sources. Hydro power with nearly two
third will play in the future the most important role.
Figure 46: Growth of Renewable Energy Sources till 2050
Source: http://www.vorarlberg.at/pdf/endberichtvisionprozess.pdf

Region Vorarlberg:
Status Quo and Masterplan
47
Hydro Power
Hydro power will be expanded considerably through a range of large and small power stations. It can
be expected that in 2020 the production of small hydro power plants will be 18 % higher compared
to the base year 2005. Also large scale hydro power plants will have a higher production by 5 %. In
2050 the production will increase by 39 % with small hydro power plants and 13 % by large hydro
power plants.
The production of hydro power in 2050 will be roundabout 2,275 GWh with large hydro power plants
and 512 GWh with small hydro power plants. Therefore large hydro power plants, like storage and
pump storage power plants, will play a major role in the future.
In the future water will still be one of the most valuable resources in Vorarlberg. All calculated num-
bers consider environmental impacts and other issues, which could hinder an expansion of hydro
power.
Figure 47: Growth of Hydro Power till 2050
Source: http://www.vorarlberg.at/pdf/endberichtvisionprozess.pdf

Region Vorarlberg:
Status Quo and Masterplan
48
Biogas
The potential for biogas isn’t as high as for hydro power. It can be expected that the resource biogas
is exhausted in 2030. From a present day perspective the production of biogas facilities will almost
double and will have an annual production capacity of 200 GWh in 2050.
Figure 48: Growth of Biogas till 2050
Source: http://www.vorarlberg.at/pdf/endberichtvisionprozess.pdf
Biomass
Biomass has a high priority in the sector of heat. It can be expected that in the next years the poten-
tial of biomass will be used more effectively than nowadays. Till 2020 nearly 20 % of the biomass will
be additionally used. In 2050 about 940 GWh of biomass will be used in most cases for heating.
Figure 49: Growth of Biomass till 2050
Source: http://www.vorarlberg.at/pdf/endberichtvisionprozess.pdf

Region Vorarlberg:
Status Quo and Masterplan
49
Photovoltaic and Solar Thermal
Solar energy like solar thermal energy for heat production and photovoltaic for electricity production
will play an important role in the future energy system. Till 2020 the consumption of solar thermal
and photovoltaic will double. In the further future photovoltaic will play a more important role than
it is today. In 2050 about 280 GWh of solar thermal and 210 GWh of photovoltaic will be produced.
Figure 50: Growth of Photovoltaic and Solar Thermal till 2050
Source: http://www.vorarlberg.at/pdf/endberichtvisionprozess.pdf
5.2 Regional Energy Consumption
The total energy consumption of Vorarlberg has been divided into different sector. The four largest
sectors are private households, industry, public and private services and traffic. The sector agricul-
ture plays a minor role. All sectors cover more or less the energy sources heat, electricity and hot
water. It is planned that in all sectors and energy sources efficiency measures will be implemented.
The energy consumption in 2050 will be 60 % less compared to the base year 2005.

Region Vorarlberg:
Status Quo and Masterplan
50
Figure 51: Development of Energy Consumption till 2050
Source: http://www.vorarlberg.at/pdf/endberichtvisionprozess.pdf
5.2.1 Buildings
In 2005 the energy consumption in form of heat has been roundabout 2,400 GWh. In 2050 it is as-
sumed that the energy consumption will be roundabout 700 GWh. This correspond a reduction of
70 %. To reach that goal the standards for new buildings and renovated buildings are suggested with
20 kWh/m² and year respectively 25 kWh/m² and year. Furthermore an annual renovation rate of
3 % is assumed.
Figure 52: Development of Energy Consumption in Sector Buildings till 2050
Source: http://www.vorarlberg.at/pdf/projektblaetter.pdf
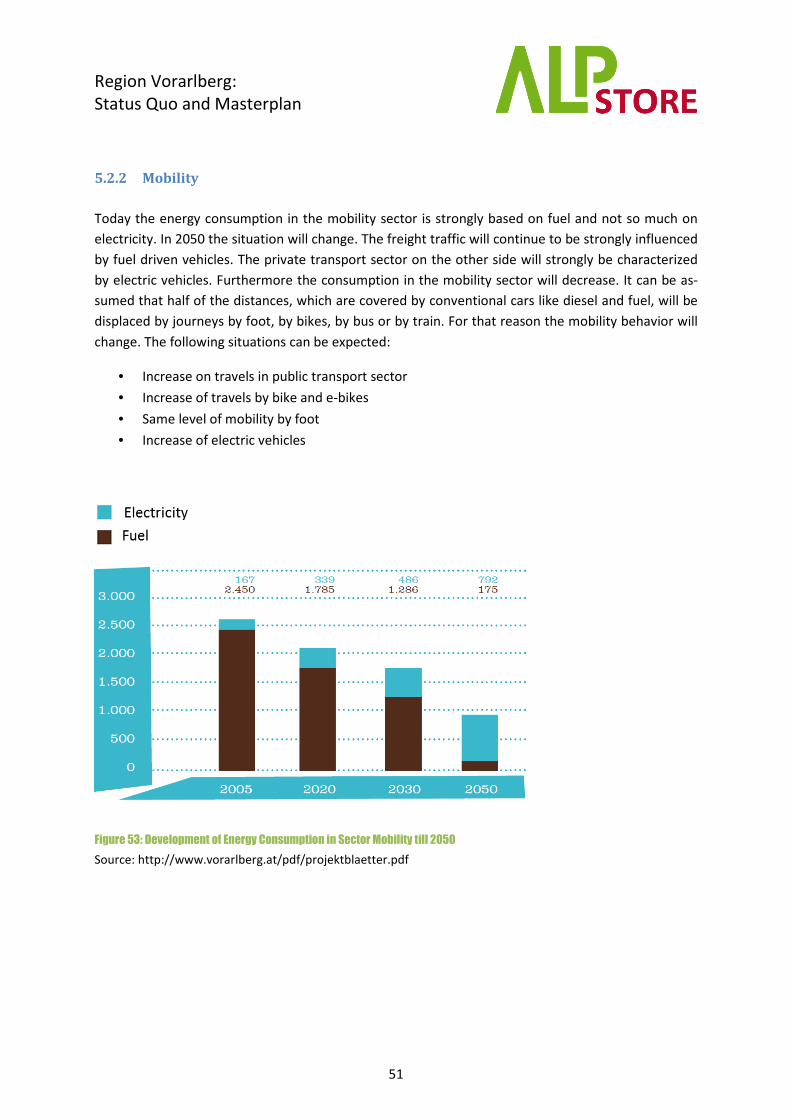
Region Vorarlberg:
Status Quo and Masterplan
51
5.2.2 Mobility
Today the energy consumption in the mobility sector is strongly based on fuel and not so much on
electricity. In 2050 the situation will change. The freight traffic will continue to be strongly influenced
by fuel driven vehicles. The private transport sector on the other side will strongly be characterized
by electric vehicles. Furthermore the consumption in the mobility sector will decrease. It can be as-
sumed that half of the distances, which are covered by conventional cars like diesel and fuel, will be
displaced by journeys by foot, by bikes, by bus or by train. For that reason the mobility behavior will
change. The following situations can be expected:
• Increase on travels in public transport sector
• Increase of travels by bike and e-bikes
• Same level of mobility by foot
• Increase of electric vehicles
Figure 53: Development of Energy Consumption in Sector Mobility till 2050
Source: http://www.vorarlberg.at/pdf/projektblaetter.pdf

Region Vorarlberg:
Status Quo and Masterplan
52
5.2.3 Business clients: Industry
The industry sector is the biggest consumer of energy in Vorarlberg. Nearly the half of the energy is
used for electricity. The other half can be assigned to the energy sources heat and process heat. A
decline for electricity in energy consumption of 33 % can be expected. The forecast in the heat sector
estimates a decrease of nearly 80 % till 2050. The total technical potential considers that the planned
measures are economically feasible.
Figure 54: Development of Energy Consumption in Sector Industry till 2050
Source: http://www.vorarlberg.at/pdf/projektblaetter.pdf
5.2.4 Private consumers and small-scale business clients
By 2050 the province of Vorarlberg aims to achieve a reduction of electricity demand from small con-
sumers by 50 %. The consumption in this sector allocates into non-residential buildings and residen-
tial buildings.
Figure 55: Development of Energy Consumption in Electricity till 2050
Source: http://www.vorarlberg.at/pdf/projektblaetter.pdf

Region Vorarlberg:
Status Quo and Masterplan
53
5.2.5 Trends
Population
The decrease in energy consumption depends on many different factors like economic growth, busi-
ness location, energy prices, population and many others. Vorarlberg will grow in the future. Statis-
tics assume that the population in Vorarlberg will steadily grow. In 2050 roundabout 420,000 inhab-
itants will live in Vorarlberg. All the mentioned targets in the different sectors consider this change in
the amount of inhabitants.
Figure 56: Development of Population in Vorarlberg till 2050
Source: http://www.vorarlberg.at/pdf/projektblaetter.pdf
5.3 Regional Energy Production
In 2050 the total energy production will be based on renewable energy sources like hydro power,
photovoltaic, solar thermal, biogas, biomass and geothermal energy. The previous chapter 5.1.1 –
Renewable energies showed the path of the different energy sources. Especially hydro power will
play a major role in the energy production in the future.

Region Vorarlberg:
Status Quo and Masterplan
54
5.4 Transmission and Distribution Grids
5.4.1 Stressors for the Regional Power Grid
Additional renewable energy sources like photovoltaic and wind can stress today’s power grid. The
power grid in Vorarlberg is one of the most reliable power grid in whole Europe. In 2012 the energy
supply was interrupted for 7 minutes due unpredictable errors. Compared to the rest of Austria and
other European countries this result is excellent. This outcome can be affiliated to the continuously
maintenance measures and the high share of cable.
Figure 57: Downtime of Power Grid in Vorarlberg
Source: http://www.illwerke.at/downloads/at/illwerke_vkw_Nachhaltigkeitsbericht_2012.pdf
5.4.2 (Smart) Grid Solutions
Due to geographical factors some regions of Vorarlberg face particular problems which have to be
taken into account for an expansion of renewable energy. In order to integrate a large number of
local energy suppliers without costly grid upgrading, innovative, intelligent strategies are needed for
the distribution grids and network management. Together with numerous partners, and with support
from BMVIT and the Climate and Energy Fund, the province of Vorarlberg is developing (within the
framework of various research projects) new approaches to smart network management, and testing
the technical and economic feasibility of these ideas in a regional context.

Region Vorarlberg:
Status Quo and Masterplan
55
This project is called “Intelligent voltage control within the distributed-generation test grid of the
Grosses Walsertal Biosphere Reserve”
As their facilities are usually medium-sized, local suppliers feed into the medium and low-voltage
grid. Decentralized feed-in can lead to impermissible local rises in mains voltage. To avoid these rises
the conductors in the affected parts of the grid have been reinforced. However, the resulting high
grid access costs make it uneconomical to erect some of the generating facilities projected. In rural
areas with low population density and little demand for electricity connecting a large number of local
power stations to the conventional distribution grid soon runs into difficulties. Electricity from re-
newable sources is mostly generated right at the source. The feed-in points are distributed all over
the grid region, including remote areas on the fringes of the grids, where their performance is more
limited. In some regions of Vorarlberg no more power stations can be hooked up to the grid without
costly enhancement measures. A new approach here is a bidirectional, so-called “active” distribution
grid. In future the lowest grid levels connected to consumers are increasingly to accept and distribute
electricity fed in from local generators and to transmit surplus power on to higher grid levels.
Energy production and consumption in the region of the Grosses Walsertal Biosphere Reserve
A typical situation involving seasonal cycles is to be found in the Großes Walsertal Biosphere Reserve,
which is 20 km long. During the winter power consumption in the valley is comparatively high, due to
the winter tourism industry with its ski lifts and hotels. At the same time the yields from hydroelec-
tric plants are low, because there is not much run-off. In spring, however, during the thawing period
and in summer after rain the small hydropower stations with a total current nameplate capacity of
around 3 MW deliver a lot more energy than is needed in the valley. This surplus electricity has to be
transmitted out of the long valley. Every additional power station and the increasing contrast be-
tween summer and winter add to the problem. Under the present conditions connecting an addi-
tional small hydroelectric plant to the Grosses Walsertal grid is not possible. The generating potential
worth exploiting and currently untapped amounts to about 10 MW.
Strategies for intelligent voltage control
In future the distribution grid should be able to transmit electricity in both directions, with the con-
trol system ensuring that the grid voltage stays within the target range at all locations (so that elec-
trical equipment/devices function reliably). If power consumption and generation are not entirely in
phase, additional feeders-in take up part of the slack in the voltage range - and thus “occupy” grid
reserves that would otherwise be available to additional consumers. As a result, the system reaches
the range limits earlier. Active distribution grids take a new approach. With the aid of control mech-
anisms which actively regulate voltages while the grid is running, spare capacities in grid infrastruc-
ture can be better exploited. This involves include grid participants and grid components in the con-
trol mechanism (by recording, linking and analysing data from the grid in real time). In the course of
the multiphase research project “DG DemoNet – Concept”, together with numerous partners, differ-
ent approaches for active distribution grids have been investigated and their capability evaluated.
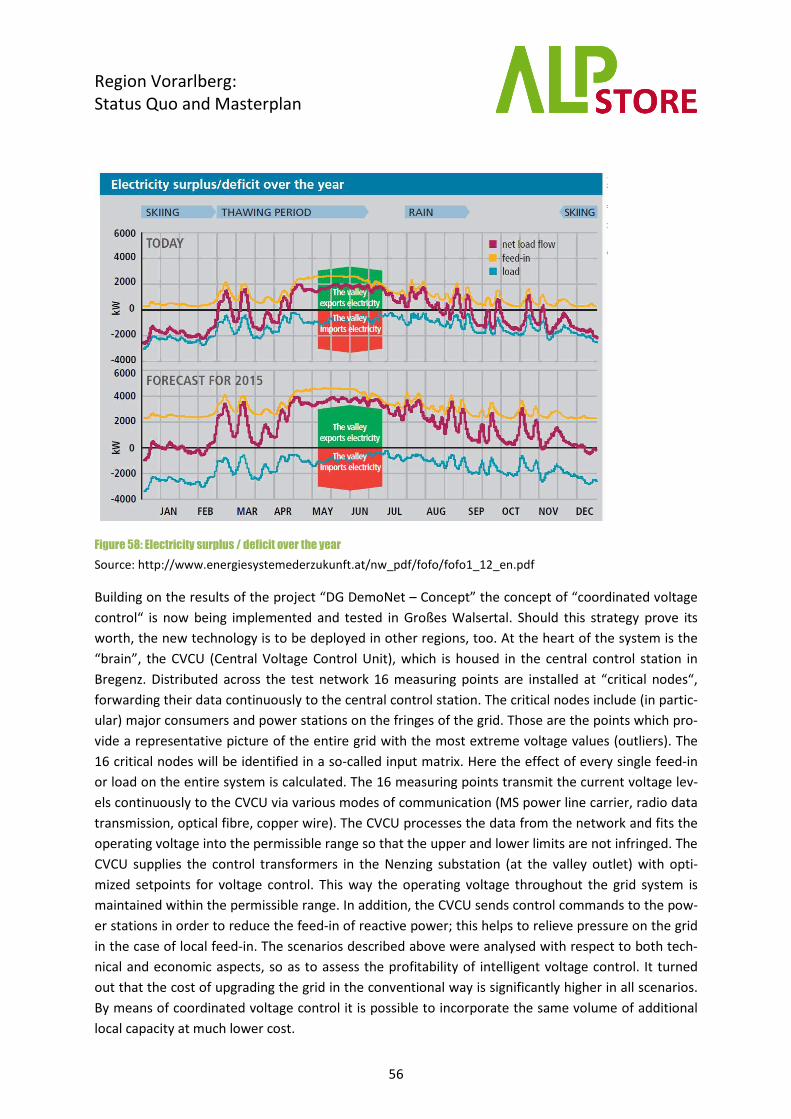
Region Vorarlberg:
Status Quo and Masterplan
56
Figure 58: Electricity surplus / deficit over the year
Source: http://www.energiesystemederzukunft.at/nw_pdf/fofo/fofo1_12_en.pdf
Building on the results of the project “DG DemoNet – Concept” the concept of “coordinated voltage
control“ is now being implemented and tested in Großes Walsertal. Should this strategy prove its
worth, the new technology is to be deployed in other regions, too. At the heart of the system is the
“brain”, the CVCU (Central Voltage Control Unit), which is housed in the central control station in
Bregenz. Distributed across the test network 16 measuring points are installed at “critical nodes“,
forwarding their data continuously to the central control station. The critical nodes include (in partic-
ular) major consumers and power stations on the fringes of the grid. Those are the points which pro-
vide a representative picture of the entire grid with the most extreme voltage values (outliers). The
16 critical nodes will be identified in a so-called input matrix. Here the effect of every single feed-in
or load on the entire system is calculated. The 16 measuring points transmit the current voltage lev-
els continuously to the CVCU via various modes of communication (MS power line carrier, radio data
transmission, optical fibre, copper wire). The CVCU processes the data from the network and fits the
operating voltage into the permissible range so that the upper and lower limits are not infringed. The
CVCU supplies the control transformers in the Nenzing substation (at the valley outlet) with opti-
mized setpoints for voltage control. This way the operating voltage throughout the grid system is
maintained within the permissible range. In addition, the CVCU sends control commands to the pow-
er stations in order to reduce the feed-in of reactive power; this helps to relieve pressure on the grid
in the case of local feed-in. The scenarios described above were analysed with respect to both tech-
nical and economic aspects, so as to assess the profitability of intelligent voltage control. It turned
out that the cost of upgrading the grid in the conventional way is significantly higher in all scenarios.
By means of coordinated voltage control it is possible to incorporate the same volume of additional
local capacity at much lower cost.

Region Vorarlberg:
Status Quo and Masterplan
57
Figure 59: Voltage increase caused by local producers and intelligent voltage range management
Source: http://www.energiesystemederzukunft.at/nw_pdf/fofo/fofo1_12_en.pdf

Region Vorarlberg:
Status Quo and Masterplan
58
The scenarios described were analysed with respect to both technical and economic aspects, so as to
assess the profitability of intelligent voltage control. It turned out that the cost of upgrading the grid
in the conventional way is significantly higher in all scenarios. By means of coordinated voltage con-
trol it is possible to incorporate the same volume of additional local capacity at much lower cost.
Figure 60: Voltage increase caused by local producers and intelligent voltage range management
Source: http://www.energiesystemederzukunft.at/nw_pdf/fofo/fofo1_12_en.pdf
6 Future Energy Storage
6.1 Storage Requirements
The future energy storage system in Vorarlberg will be characterized by hydro storage and pump
storage power plants like it is today. With this storage system short term and long term aspects can
be covered. Furthermore, the lakes in the Alps already exists .

Region Vorarlberg:
Status Quo and Masterplan
59
6.2 Potentials for Regional Storage
The future energy storage system in Vorarlberg will be characterized by hydro storage and pump
storage power plants like it is today. With this storage system short term and long term aspects can
be covered. With the commissioning of Kopswerk II in 2008, the refitting of Rodundwerk II in 2011
and the planned construction of Obervermuntwerk II further steps are to be taken to sustainably
advance the integration and continued expansion of renewable energy in Europe.
Beyond the hydro storage and pump storage power plants the mass rollout of electric vehicles will
lead to an additional storage capacity till 2050. Other storage systems like battery storages will be-
come more and more interesting in the near future. No one knows or can predict how big the actual
potential for these storage systems really is. However, Vorarlberg will be strongly influenced in the
future by hydro storage and pump storage power plants, which will work together in one big unit to
use the water a few times to produce peak and control energy.
7 Framework for future Storage Systems
7.1 Governance
20 – 20 – 20 Targets
In January 2008, the European Commission presented a legal package on climate protection which is
often referred to as the 20-20-20 targets. The proposals focus on a restrictive climate and energy
policy and set new goals. By 2020, Europe shall thus:
• increase energy efficiency by 20 %.
• cut greenhouse gas emissions by 20 %,
• increase the share of energy from renewable sources by 20 %,
The burden of reducing greenhouse gas emissions will be shared by the Member States on the basis
of their wealth. Austria is committed to reducing emissions by 16 % by 2020 as compared to 2005.
This target applies to all emitters not subject to the emissions trading scheme set out in the Europe-
an directive 2003/87/EC. However, this emissions trading scheme should also be further developed
and more restrictively applied. Apart from the fact that, as of 2010, certificates will no longer be dis-
tributed free of charge, the sectors subject to the emissions trading scheme will be assigned a reduc-
tion target of 21 %. The new directive on carbon capture and storage is another important compo-
nent of the efforts in climate protection. This directive promotes relevant technologies and the prac-
tice of geological storage of CO2 emissions. Finally, the third pillar of the 20-20-20 targets is raising
the share of energy from renewable sources. By 2020, the share of energy from renewable sources
shall be increased to 20 % of total energy consumption, i.e. not only regarding electricity, but also
heating, transport, etc. The contribution set for Austria is an increase in this share from 23.3 % in
2005 to 34 % in 2020. [Link]
Region Vorarlberg:
Status Quo and Masterplan
60
The Kyoto Protocol
At a supranational level the Kyoto Protocol has been the central instrument of climate policy. All EU
member states have agreed to share the climate burden and have committed to individual climate
protection targets.
The Austrian target is a reduction of greenhouse gas emissions by 13 % as compared to the base year
1990 by the end of the so-called Kyoto period. An Austrian climate strategy for target attainment
defined a series of instruments and measures, which cover all important areas, from the renovation
of residential buildings, traffic regulations, the optimization of processes for the generation of elec-
tricity and heat to the promotion of renewable energy technologies. So far, these efforts have not
produced the expected results. Current values of greenhouse gas emissions in Austria significantly
exceed the original Kyoto targets - i.e. 15 % above the base value of 1990. [Link]
The energy end-use directive
Another central point of European energy policy is the energy end-use directive. It stipulates an in-
crease in energy end-use efficiency by 9 % by 2016 as compared to 2006. This target does not require
a "real" reduction in energy consumption in absolute numbers but a more efficient use of energy, i.e.
driving more kilometers with the same amount of gasoline. Last but not least the common energy
policy strives for a significant increase of the share of energy generated from renewable energy
sources in Europe. This applies to both the energy end-use (i.e. heating, bio-fuels for vehicles) and
transformation processes in the generation of electricity and heat. [Link]
Energy Strategy Austria
The aim of the "Energy Strategy Austria" is the development of a sustainable energy system, energy
services for private consumption as well as for companies. The defined goals should provide the EU
targets on climate and energy (20-20-20, Kyoto Protocol). Security of supply, environmental impact,
cost, energy efficiency, social equity and competitiveness were fixed as frameworks in the Austrian
energy strategy. In working groups concrete measures should be defined. Concerning storages and e-
mobility two working groups; “storage and grid” and “mobility”; have been implemented. [Link]
• Storages
Concerning storages further studies shall be conducted. Important topics in this case are CCS, gas
storages and “environmental friendly storages”. Different market players (e.g. energy suppliers) will
get an order to create helpful studies.

Region Vorarlberg:
Status Quo and Masterplan
61
• EVs and PHEVs
In 2020, in total 250,000 electric vehicles (proposed all-electric vehicles and plug-in hybrid vehicles)
should be on the road in Austria. This represents a ratio of not quite 5 percent of the forecast of the
total number of passenger cars in 2020.
National Renewable Energy Action Plan for Austria
The 2010 National Renewable Energy Action Plan for Austria presents measures to achieve an in-
crease to 34 percent, by 2020, of renewables as a share of gross energy consumption (in line with EU
Directive 2009/28/EC). Compared to a reference scenario based on the data on energy consumption
available up to 2009, final energy consumption is to be cut by 13 percent by 2020 in order to achieve
the target. Sectors will contribute different shares to this goal. The largest contribution is expected
from transport (–22 percent), followed by heating and cooling (–12 percent) and electricity (–5 per-
cent). The directive's implementation is a dynamic process, to a large extent controlled by the envis-
aged energy strategy of the Austrian Federal Government.
Klima- und Energiefonds (Climate and Energy Fund)
The climate and energy fund is an institution of the Austrian government. It was founded in 2007 and
has the goal to reduce greenhouse gas emissions in Austria by setting targeted pulses and initiating
funding for projects. The Climate and Energy Fund is therefore a key instrument of the Austrian gov-
ernment for the achievement of climate protection (20-20-20 targets, Kyoto Protocol), higher energy
efficiency (the energy end-use directive) and the development of innovative renewable energies.
Since 2007 in total 35,000 energy and climate projects have been implemented with a total budget of
€ 600 Mio by the Climate and Energy Fund. The Climate and Energy Fund is responsible to keep the
European targets (20-20-20) in mind and promote a “zero emission Austria”.
For the efficient operational implementation of the funding allocation the Climate and Energy Fund is
supported by management agencies. These are currently the “Österreichischen Forschungs-
förderungsgesellschaft mbh” (FFG), „Kommunalkredit Public Consulting GmbH“ (KPC) and the
„Schieneninfrastruktur-Dienstleistungsgesellschaft mbH“ (SCHIG mbH).
Projects concerning energy storages and also smart grids, which also include the topic of storage, are
big issues in the different programs. The following programs of the Climate and Energy Fund, which
have a close link to energy storages, are registered in the following list.
• Smart Cities – FIT for SET
This program attends to the topics renewable energies, energy efficiency, mobility, e-mobility and
model regions. The vision of the Climate and Energy Fund for the program "Smart Cities - FIT for SET"
is the first implementation of a "smart city" or a "smart urban region" and also includes neighbor-
hoods, communities or other urban regions in Austria. The main task lies on the implementation of

Region Vorarlberg:
Status Quo and Masterplan
62
intelligent green technologies to build up a "zero emission city" or "zero emission urban regions"
with a high quality of life. The program focuses on the areas of buildings, energy networks, supply
and waste management, mobility, communication and information. The storage of energy is there-
fore an essential way to achieve the objectives, which are defined in the “Smart Cities – FIT for SET”
program.
• Smart Energy Demo – FIT for SET
The central objective is the implementation of the visible "Smart City" pilot and demonstration pro-
jects in which existing and already largely mature technologies, systems and processes are integrated
to interacting global systems. The key strategic objectives of the pro-gram are aimed at improving
energy efficiency, increasing the share of renewable energy sources and the reduction of greenhouse
gas emissions.
• Neue Energien 2020
This program attends to the topics renewable energies, energy efficiency, smart energy and aware-
ness. In the program, ideas and concepts with long-term prospects have been realized by basic re-
search and technological research and development work and implemented through pilot and
demonstration plants. In addition to these primarily technology-related is-sues, the program has to
work out the task to address social issues and knowledge for long-term planning processes. The pro-
gram closed in 2011. The objectives of the program will be continued in the new program
“e!Missi0n+.at – Energy Mission Austria”, which started in 2012.
• e!Missi0n+.at – Energy Mission Austria
This program attends to the topics renewable energies, energy efficiency and R&D. This program
pursues the Climate and Energy Fund aims to reduce the cost of high-efficiency and low emission
energy technologies and help ensure that Austrian companies play in this rapidly growing sector a
leading role. The focus lies on collaborative projects between industry and science. The program is
designed to convert scientific breakthroughs into innovative and sustainable products and services
that provide business opportunities and make a contribution to reduce greenhouse gas emissions
significantly.
Regional Specific
Federalism is very strong in Austria and hence every province does have energy strategies as well as
the national government has its own energy policy, which has not really a binding character. The
Federal Ministry of Environment is supporting a nationwide project named “Climate and Energy
Model Regions” with regional focus in order to encourage more and more regions to do efforts in the
field of renewable energy and energy efficiency. The subjects of smart grid, e-mobility and energy

Region Vorarlberg:
Status Quo and Masterplan
63
storage can be a part of these regional strategies but are not necessarily in the focus of every region.
Since this framework there are regions in Austria with strong focus of e-mobility (8 model regions in
Austria) and smart grids (Model regions in Vorarlberg, Salzburg and Upper Austria).There is no par-
ticular plan in the subject of energy stationary storage.
Vorarlberg
Vorarlberg has set itself the target to become self-sufficient concerning energy issues in 2050. For
that reason Vorarlberg has set different action plans (see chapter 2 Pilot Region). In Vorarlberg is no
law which handles with the topic of storages in particular. Hydro power plants in general play a major
role in the process of Vorarlberg energy autonomy till 2050. Storages and in this case hydro storage
and pump storage power plants have a high significance in Vorarlberg’s politics. E-Mobility will also
play an important role in the future. Furthermore, the policy for renewable energies and energy
storages move largely along lines defined by the European Union (Goal 2020) and the national gov-
ernment (Energy strategy Austria).
7.2 Technology Trends
Technological trends will affect the future energy and the storage system. For example an increase of
self-consumption can lead to a growth of decentralized storage systems like batteries. Also
e-mobility can support households to increase the share of self-consumption. Plus-energy-houses
produce more energy as they require. Thermal or electric storages will be therefore useful and es-
sential instruments. Especially electric decentralized storage systems, like batteries, are nowadays
not in use because of the high prices. They have proved their functionality, but don’t have a big im-
pact on the total share of storages. In the future this situation can change, but the price for the dif-
ferent storage system will play an important role. The prize for different storage systems will there-
fore be the most important indicator of the future technology trends.
Region Vorarlberg:
Status Quo and Masterplan
64
7.3 R&D activities
7.3.1 VLOTTE
Founded as Project Management Agency for the «Electromobility Model Region» Vorarlberg project,
the VLOTTE is wholly-owned subsidiary of the illwerke vkw group, the local electricity producer and
distributor in Vorarlberg. Key competence areas include «decentralised energy grids», «photovolta-
ic», «energy monitoring», «energy efficiency and alternative energies», «e-stations» and project
management. VLOTTE is primarily responsible for the implementation and support of the model re-
gion project and serves as platform for all partners. One of the major tasks is worldwide monitoring
of new technologies in connection with electromobility. With the execution of on-road tests new
technologies are being checked for «mass suitability». Further tasks are centralised buying, negotia-
tion of frame contracts, installation and coordination of service points and vehicle-oriented monitor-
ing. Moreover, the corporation is responsible for a carbon neutral supply of energy. Apart from the
initiation of local mobility projects the company also offers comprehensive mobility consulting and
care for Europe-wide promotion of the project with targeted public relations.
Key facts electromobility in Vorarlberg
• 357 e-cars during project (2009 – 2011)
• 120 charging stations + 3 fast-charging stations
• Energy for charging from additional built up power plants (photovoltaic and hydro power)
• 2.5 million driven kilometers and over 400 tons of CO2 saved during project VLOTTE
7.3.2 Smart City Rheintal
The Rheintal valley of Vorarlberg with its 29 municipalities is characterized by a polycentric structure.
It is one of the most dynamically growing economical areas in central Europe. Due to the high stand-
ard of living, about 65% of the state’s population work and live here. Therefore, the consumption of
resources in Vorarlberg is mainly determined by the activities in this area. In 2009 the state parlia-
ment of Vorarlberg unanimously passed a resolution for the vision and roadmap of carbon free ener-
gy autonomy by 2050. Subsequently, similar interdisciplinary working groups developed a corre-
sponding action plan 2020, which was unanimously enacted in parliament in 2011. Beside cross-
cutting issues the measures focus on space planning, production, buildings, mobility and energy sup-
ply from local resources.
In view of the above goal SmartCityRheintal aims for the realisation of 4 zero-emission districts in the
centres Bregenz, Hard and Feldkirch. Heating and cooling in all districts will be based on ground or

Region Vorarlberg:
Status Quo and Masterplan
65
the lake water and local biomass. The central area of Bregenz, including the main station, will be
completely re-designed and re-built as an integrated multi-purpose district. The unique, all-wood life-
cycle tower will be constructed within a passive house district. In Hard a former industrial site will be
revitalized and Feldkirch will get a high efficiency, zero emission conference center for green meet-
ings, resulting in a broadly accepted car-free entry to the historic city. To account for the different
societal and technical needs, participatory approaches and interdisciplinary planning processes are
put in place. These issues will be investigated with regard to lessons learnt for similar future projects.
The planned districts strive for the zero emission goal in conjunction with an integrative considera-
tion of sustainable modes of transport as well as the necessary social infrastructure (working, shop-
ping, leisure, living, education, ..). Such an orchestrated urban planning with high-quality building and
landscape architecture generates high-quality locations for business and living with excellent connec-
tion to infrastructure networks like railway, roads, bus lines and new e-mobility hubs. This holistic
approach aims for the extension of the pedestrian area as well as the integration of bicycle paths and
new e-car sharing models. Active location development and marketing will communicate the ad-
vantages of striving for zero emission. Communication between supply and demand side will spawn a
Smart Grid in combination with a Mobility on Demand system, which, from the user’s point-of-view,
integrates electric cars, public transport systems, homes, and renewable energy sources. Load man-
agement and peak-cutting will be tested in this virtual power plant. Finally, the cooperation between
real estate developers and energy suppliers allows the introduction and investigation of new busi-
ness models that promote the supply of whole districts with carbon neutral energy. At the same
time, these business models increase user awareness for climate protection issues. This new urban
structural elements will help to revitalize city cores. Hence, rising demand for residential and com-
mercial development will not increase urban sprawl but will be met by the revitalization of urban
centers already served by existing infrastructure.
7.3.3 Vehicle to Grid
A further keystone of Vorarlberg's long-term energy strategy is electromobility. Energy self-
sufficiency scenarios involve a complete transition to electric power trains by 2050, at least as far as
private transport is concerned. The mass-market introduction of electromobility will have a great
impact on the operation of the distribution grid; bidirectional load and energy management will play
an important role in this area, too, in future. Since 2008 the province of Vorarlberg has been con-
ducting one of Europe's biggest electromobility tests, the project VLOTTE, in which 357 electric cars
running on electricity from renewable energy sources have already travelled 2.5 million kilometers.
As part of the project Continental's “AutoLinQ™ for Electric Vehicles” system is being tested as a
strategy for intelligent energy management on the road. The focus is on data transmission between
vehicles and the grid (VehicletoGrid). Currently smart approaches to recharging vehicle accumulators
are being tested, in order to avoid uncoordinated simultaneous recharging of a large number of vehi-
cles (e.g. in the evening) in future. The focus of interest is on how the grid operator can influence
recharging. The “AutoLinQ™ for Electric Vehicles” system consists of a communications box built into

Region Vorarlberg:
Status Quo and Masterplan
66
the vehicle, maintaining a constant mobile data connection with the “Gateway and Service Delivery
Platform”, which provides a connection to the electricity provider's energy management systems.
The new system allows “Smart Charging” via ordinary power plugs. This means that the grid operator
receives information about plugged-in vehicles' state of charge and energy requirements, and can
control recharging depending on the current availability of electricity from wind power or solar ener-
gy. In the summer of 2011 VLOTTE's first 20 electric vehicles were equipped with the new system in
Bregenz. During a 2-year test phase the system's functionality in load management is to be tested on
the road and experience with delaying recharging is to be gathered.
7.4 Stakeholders
Federal State of Vorarlberg
The federal State of Vorarlberg is the biggest stakeholder concerning political issues. With the energy
program “Energy Autonomy 2050”, which has been supported by all parties in the Vorarlberger Land-
tag, Vorarlberg has defined a path for the future energy system.
Illwerke AG
The illwerke AG is focused on the generation of peak and control energy with hydro pump and stor-
age power plants. They have therefore the leading role concerning energy storage in Vorarlberg.
Vorarlberger Kraftwerke AG
The Vorarlberger Kraftwerke AG is the most important and most relevant energy supplier in Vorarl-
berg. They mainly produce electricity from hydro power and operate in Vorarlberg and in the West of
the Allgäu in Germany. The VKW is furthermore supplier of gas in Vorarlberg.
Vorarlberger Energienetze GmbH
The Vorarlberger Energienetze GmbH is integrated into the illwerke vkw concern and is the largest
grid operator for electricity and gas in Vorarlberg.
Vorarlberger Elektroautomobil Planungs- und Beratungs GmbH (VLOTTE)
The Vorarlberger Elektroautomobil Planungs- und Beratungs GmbH (VLOTTE) is dealing with several
topics regarding e-mobility. VLOTTE takes care among other things about public charging infrastruc-
ture, consulting, test-drives, R&D projects, and many more. VLOTTE is integrated into the illwerke
vkw concern.

Region Vorarlberg:
Status Quo and Masterplan
67
Energieinstitut Vorarlberg
The Energieinstitut Vorarlberg was founded in 1985. The main goal of the institute is to positively
influence the key success factors of sustainable energy systems in the short and long term. The Ener-
gieinstitut Vorarlberg focuses on efficient energy use, the utilisation of renewable energy sources,
environmentally sound building methods and sustainable transport policies.
Klima- und Energiefonds (Climate and Energy Fund)
The climate and energy fund is an institution of the Austrian government. It was founded in 2007 and
has the goal to reduce greenhouse gas emissions in Austria by setting targeted pulses and initiating
funding for projects. [Link]
Kommunalkredit Public Consulting
Kommunalkredit Public Consulting has set itself the goal of making a sustainable contribution to envi-
ronmental, economic and social developments through the management of support programs and
targeted consulting activities. [Link]
Home owner
Apart from these large scale stakeholders every home owner of the region has an important role as
owner of decentralized power (e.g. photovoltaic) plant or energy storage systems.

Region Vorarlberg:
Status Quo and Masterplan
68
8 Master Plan
8.1 Objectives
8.1.1 Vision and Goals
The main Vision of the region Vorarlberg is to become autonomous in energy issues. Vorarlberg
started therefore in 2007 a program called “Energy Autonomy Vorarlberg” to reach that goal till
2050. The province, Vorarlberg, had set itself an ambitious target: achieving energy self-sufficiency
based on renewable energy sources by 2050 and so becoming independent of price rises and supply
shortfalls affecting oil and natural gas. This log-term strategic goal has been supported in a unani-
mous decision by all political parties.
A sustainable energy supply in the future causes the planning and construction of new storages and
an expansion of the existing grids. These two special issues are not explicit mentioned in the program
of “Energy Autonomy 2050”. The regional energy suppliers, like illwerke vkw, will care of these prob-
lems in the future. The mentioned expansion of the energy source hydro power includes the addi-
tional development of pump storage power plants.
The mass-market introduction of electromobility will have a big impact on the operation of the dis-
tribution grid; bidirectional load and energy management will play an important role in this area.
8.2 Regional Storage Park
The existing storage park in Vorarlberg will still depend on the needs of the electricity market in Eu-
rope. In the future large storage systems, like hydro storage and pump storage power plants and grid
expansion will be needed to stabilize the energy systems. The storage park in Vorarlberg will be
strongly focused on hydro power storage and pump storage power plants as it is today. Electric vehi-
cles have also the possibility to store electricity when needed. Furthermore, stationary batteries can
make their contribution to the future storage park in Vorarlberg.
Beside the discussion about storages for the electricity system, storages for the heat production play
an important role in the future energy park of Vorarlberg. In this sector the decentralized storages
will play a major role. Especially solar thermal, geothermal and biomass heating systems need stor-
ages to provide heat all day long. It will be necessary that all these heating systems are equipped
with these water storages.

Region Vorarlberg:
Status Quo and Masterplan
69
8.3 Storage Roadmap
8.3.1 Measures and Projects
EV as storage
Vorarlberg will be characterized by electric vehicles in the future. The action plan “101 grandchild
qualified measures” provides that 10,000 electric driven vehicles (EVs) and plug-in hybrids (PHEV) are
on the road in Vorarlberg in 2020. Nowadays the electric vehicles (EVs) have storage capacity of
roundabout 20 kWh which enables a diving distance of 130 km in summer and roundabout 80 km in
winter. The range anxiety for most of the people therefore exists. For that reason electric vehicles
will be really difficult to use as storage in the near future. The existing battery chargers have fur-
thermore not the function to charge and to discharge the vehicles with the same unit. Other chargers
and dischargers are therefore needed in the future.
On the other side the bidirectional way – charge and discharge of the battery – is just one possibility
to use the electric vehicle as storage. Electric vehicles are normal electric consumers and can be
charged and need energy at certain times. EVs stand most of the time still. Smart charging, for exam-
ple when the photovoltaic power plant produces much more energy than is consumed, can be an-
other way to use the electric vehicle as storage (= demand side management). It is necessary to get a
connection between the charging station, the car and the power plant (e.g. photovoltaic). With this
approach it is possible to relieve the grids and to use the produced energy from renewable energy
sources in an effective way. The technical implementation of such an approach is nothing new and
can be done in most case easily.
Figure 61: Path of EVs in Vorarlberg
Source: VLOTTE

Region Vorarlberg:
Status Quo and Masterplan
70
The Vorarlberger Kraftwerke AG has already started some pilot implementation to charge the electric
vehicles smarter than nowadays. It is planned to extend such pilot projects to get more experiences
in this field. But the main goal of electromobility in Vorarlberg will be expansion of charging infra-
structure, higher share of EVs in the market and the distribution of renewable energy sources to
guarantee a sustainable way of transportation in the future. Such projects have just a demonstration
character.
Timeline:
Today Ongoing pilot test in smart charging
2013 Data pooling of pilot tests
Q1+Q2: 2014 Evaluation of pilot test
Q3+Q4: 2014 Development of further pilot tests
Stationary Battery Storages
Decentralized power generation will increase significantly in the future. In 2050 the photovoltaic
power plants will produce 210 GWh. With a photovoltaic power plant the self-consumption of the
produced energy is already 30 %. With a stationary battery the self-consumption rate can be in-
creased up to 60 to 90 %. The desire in the population for increased self-sufficiency increases strong-
ly. Electricity consumers want to become independent of their energy supplier. Stationary battery
systems could therefore become more and more important in the near future. Different studies as-
sume that the global installations of photovoltaic storages will double from year to year. Germany
will have a leading role in this sector, because of their new funding scheme for battery storages.
Vorarlberg has not the same issues in the energy sector like Germany. The share of photovoltaic
power plants isn’t as high as in Germany. Furthermore, the price for electricity is much cheaper than
in Germany. These are aspects, which currently do not support battery storages. A forecast for a
potential market for battery storage is therefore difficult. Within the next years battery storages will
be implemented into households anyway. How much of these systems will be implemented is still
unclear. The Vorarlberger Kraftwerke AG is going to install pilots to test the functionality and to
measure the real outcome of such battery storages. The market for battery storages will change very
fast. Therefore it is necessary to analyze and to observe the market.

Region Vorarlberg:
Status Quo and Masterplan
71
Timeline:
Today Market research of stationary battery storages
Q4: 2013 Concept for battery storages, financial planning
2014 Installation of battery storages in households
Q3+Q4: 2014 Start test mode
2015 Evaluation
2nd use batteries of EVs for stationary storages
Batteries from electric vehicles lose power over several years. At a certain point they are no longer
suitable for operation in an electric vehicle. In most cases they will be removed and replaced through
a new battery. These “old” batteries can be used for stationary storage. The batteries get therefore a
“second life”. These batteries will be cheaper than new ones but will be fully functional.
In the project Alpstore a pilot with 2nd life batteries shall be implemented and tested. These batter-
ies will be charged from a photovoltaic plant. The goal of this pilot is to demonstrate that 2nd life
batteries can be used also in case when they are no longer good enough for the electric vehicles.
Timeline:
Today Planning of pilot in project Alpstore
Q4: 2013 Implementation of pilot activity
2014 Test mode, testing of different functions
Q3+Q4: 2014 Evaluation of pilot

Region Vorarlberg:
Status Quo and Masterplan
72
Hydro power pump storage – Obervermuntwerk II
The Obervermuntwerk II is the next major milestone in the history of Illwerke. It will be the second
largest power station of illwerke vkw and will have a significant contribution to European energy
policy. The new Obervermuntwerk pumped storage power plant is being built between the reservoirs
Silvretta and Vermunt and is used to generate peak and control energy. The Obervermuntwerk II can
be optimally integrated into the work group Upper Ill – Luenersee.
The system concept of Obervermuntwerk II is very focused on the energy industry needs. Two highly
flexible, rapidly controlled machine units with separate pumps and turbines are used here. The ca-
pacity is 360 megawatts in the pump and turbine operation. The machines can regulate over the
entire range of ± 100 percent. The storage capacity of the illwerke is going to be extended
by 360 MW of turbine capacity and 360 MW of input power of the pump. The transport of energy
takes place through an underground 220 kV cable system.
Figure 62: Concept of Obervermuntwerk II
Source: http://www.illwerke.at/downloads/at/illwerke_vkw_Nachhaltigkeitsbericht_2012.pdf
The illwerke produces peak and control energy for the European energy market. Pump storage pow-
er plants are from a present-day perspective the only large-scale option for power storage. The ex-
pansion of renewable sources will lead to a higher demand for storages. With the new Oberver-
muntwerk II Vorarlberg will have a further opportunity to be competitive in the European energy
market. So illwerke is going to invest into the business location Vorarlberg, but also will pursues the
vision of a sustainable energy future.

Region Vorarlberg:
Status Quo and Masterplan
73
Technical Specifications:
Nominal capacity of the turbine: 2 x 180 MW = 360 MW
Input power of the pump: 2 x 180 MW = 360 MW
Minimum drop height: 243.20 m
Maximum Drop Height: 311.20 m
Turbine operation (360 MW): QT, A = 150 m³ / s
Pump operation (360 MW): QP, A = 135 m³ / s
The project of the Obervermuntwerk II started with the preliminary proceeding of the environmental
impact assessment. The power plant will be realized from 2013 to 2018. It is planned that the new
power plant will operate for the first time in 2018.
Timeline and Milestones:
9th of June 2009 Political Decision for Energy Autonomy Vorarlberg 2050
9th of March 2011 Decision for expansion of hydro power in Vorarlberg
March 2011 Start of preliminary proceeding Environmental Impact Assessment
October 2011 Start of main proceeding Environmental Impact Assessment
End of 2012 Decision for construction
2013 – 2018 Realization of construction
2018 First time operation
2018 – 2019 Recultivation
Link Video

Region Vorarlberg:
Status Quo and Masterplan
74
Thermal water storages
Solar thermal, geothermal and biomass heating systems need storages to provide heat all day long. It
will be necessary that all these heating systems are equipped with water storages. In Vorarlberg the
share of renewable energy systems in the heating systems is high. In the near future it will increase
even more and the need for water storage systems in households will also increase. In this sector are
no pilots planned, because for the private households it is even today obvious that such heating sys-
tems need thermal water storages.
8.4 Implementation Structure
The group illwerke vkw is in nearly all mentioned projects mainly responsible for the planning and
implementation. The illwerke take care of the pump storage power plant, which is from the present
day perspective the biggest storage project in Vorarlberg. Alone with this project, the storage capaci-
ty can be increased significantly in Vorarlberg. The other projects don’t have such a big influence on
the storage framework in Vorarlberg, but make an important contribution to a possible energy future
in Vorarlberg. For this projects are mainly the Vorarlberger Kraftwerke AG and the VLOTTE responsi-
ble.
A common implementation structure is therefore not given. More or less all planned storage projects
are implemented independently from each other.

Region Vorarlberg:
Status Quo and Masterplan
75
9 Literature
[1] Eurostat, http://epp.eurostat.ec.europa.eu/portal/page/portal/eurostat/home/
[2] Energiebericht Vorarlberg, 2012, http://www.vorarlberg.at/pdf/energiebericht2012.pdf
[3] Vorarlberg Naturfreunde, http://vorarlberg.naturfreunde.at/Berichte/detail/25762/
[4] Wasserwirtschaft Vorarlberg, http://www.vorarlberg.at/pdf/dokumentwasserwirtschafts.pdf
[5] Energiezukunft Vorarlberg, http://www.energiezukunft-vorarlberg.at/
[6] Nachhaltigkeitsbericht illwerke vkw,
http://www.vkw.at/downloads/at/illwerke_vkw_Nachhaltigkeitsbericht_2010_Web.pdf
[7] Stromherkunft VKW, http://www.vkw.at/inhalt/at/strom-haushalt-stromherkunft.htm
[8] Vorarlberger Kraftwerke AG, http://www.vkw.at
[9] Wikipedia Illwerke, http://de.wikipedia.org/wiki/Vorarlberger_Illwerke
[10] Vorarlberger Illwerke AG, http://www.illwerke.at
[11] Energieautonomie Vorarlberg 2050, http://www.vorarlberg.at/pdf/endberichtvisionprozess.pdf
[12] Smart Grid Großes Walsertal
http://www.energiesystemederzukunft.at/nw_pdf/fofo/fofo1_12_en.pdf
[13] Projektdatenblätter Energieautonomie, http://www.vorarlberg.at/pdf/projektblaetter.pdf
[14] e-control, 20-20-20-Ziele der EU
http://www.e-control.at/en/consumers/renewables/climate-and-enviroment/20-20-20
[15] e-control, Kyoto-Protocol,
http://www.e-control.at/en/consumers/renewables/climate-and-enviroment/kyoto-protocol
[16] Energiestrategie Österreich,
http://www.energiestrategie.at/images/stories/pdf/longversion/energiestrategie_oesterreic
h.pdf
[17] Klima- und Energiefonds, http://www.klimafonds.gv.at/
[18] Energieinstitut Vorarlberg, http://www.energieinstitut.at
[19] Landtag Vorarlberg, http://www.vorarlberg.at
[20] VLOTTE, http://www.vlotte.at
[21] Statistik Austria, http://www.statistik.at