Piezoelectric composites : design, fabrication and ... · PDF filePiezoelectric composites :...
124
Piezoelectric composites : design, fabrication and performance analysis Babu, Indu DOI: 10.6100/IR760468 Published: 01/01/2013 Document Version Publisher’s PDF, also known as Version of Record (includes final page, issue and volume numbers) Please check the document version of this publication: • A submitted manuscript is the author's version of the article upon submission and before peer-review. There can be important differences between the submitted version and the official published version of record. People interested in the research are advised to contact the author for the final version of the publication, or visit the DOI to the publisher's website. • The final author version and the galley proof are versions of the publication after peer review. • The final published version features the final layout of the paper including the volume, issue and page numbers. Link to publication Citation for published version (APA): Babu, I. (2013). Piezoelectric composites : design, fabrication and performance analysis Eindhoven: Technische Universiteit Eindhoven DOI: 10.6100/IR760468 General rights Copyright and moral rights for the publications made accessible in the public portal are retained by the authors and/or other copyright owners and it is a condition of accessing publications that users recognise and abide by the legal requirements associated with these rights. • Users may download and print one copy of any publication from the public portal for the purpose of private study or research. • You may not further distribute the material or use it for any profit-making activity or commercial gain • You may freely distribute the URL identifying the publication in the public portal ? Take down policy If you believe that this document breaches copyright please contact us providing details, and we will remove access to the work immediately and investigate your claim. Download date: 22. May. 2018
Transcript of Piezoelectric composites : design, fabrication and ... · PDF filePiezoelectric composites :...
Piezoelectric composites : design, fabrication andperformance analysisBabu, Indu
DOI:10.6100/IR760468
Published: 01/01/2013
Document VersionPublisher’s PDF, also known as Version of Record (includes final page, issue and volume numbers)
Please check the document version of this publication:
• A submitted manuscript is the author's version of the article upon submission and before peer-review. There can be important differencesbetween the submitted version and the official published version of record. People interested in the research are advised to contact theauthor for the final version of the publication, or visit the DOI to the publisher's website.• The final author version and the galley proof are versions of the publication after peer review.• The final published version features the final layout of the paper including the volume, issue and page numbers.
Link to publication
Citation for published version (APA):Babu, I. (2013). Piezoelectric composites : design, fabrication and performance analysis Eindhoven: TechnischeUniversiteit Eindhoven DOI: 10.6100/IR760468
General rightsCopyright and moral rights for the publications made accessible in the public portal are retained by the authors and/or other copyright ownersand it is a condition of accessing publications that users recognise and abide by the legal requirements associated with these rights.
• Users may download and print one copy of any publication from the public portal for the purpose of private study or research. • You may not further distribute the material or use it for any profit-making activity or commercial gain • You may freely distribute the URL identifying the publication in the public portal ?
Take down policyIf you believe that this document breaches copyright please contact us providing details, and we will remove access to the work immediatelyand investigate your claim.
Download date: 22. May. 2018
PIEZOELECTRIC COMPOSITES
Design, fabrication and performance analysis
PROEFSCHRIFT
ter verkrijging van de graad van doctor aan de Technische Universiteit
Eindhoven, op gezag van de rector magnificus prof.dr.ir. C.J. van Duijn,
voor een commissie aangewezen door het College voor Promoties, in het
openbaar te verdedigen op maandag 11 november 2013 om 16:00 uur
door
Indu Babu
geboren te Trichur, India
2
Dit proefschrift is goedgekeurd door de promotoren en de samenstelling van de
promotiecommissie is als volgt:
voorzitter: prof.dr.ir. J.C. Schouten
1e promotor: prof.dr. G. de With
2e promotor: prof.dr. R.A.T.M. van Benthem
leden: prof.dr. J.Th.M. de Hosson
(University of Groningen)
prof.dr. S.J. Picken
(Delft University of Technology)
dr.ing. C.W.M. Bastiaansen

3
To Babu, Iva Maria (Ponnu) and parents
4
Indu Babu
PIEZOELECTRIC COMPOSITES
Design, fabrication and performance analysis
Eindhoven University of Technology, 2013
A catalogue record is available from the Eindhoven University of Technology Library.
ISBN: 978-90-386-3483-8
Copyright 2013, Indu Babu
The research results described in this thesis form part of the research program of the
Dutch “Smart systems based on integrated Piezo" (SmartPIE).
Cover design: Indu Babu and Babu Varghese
Printed at the Printservice, Eindhoven University of Technology
5
Table of contents
Chapter 1 Introduction 7
1. 1. Introduction 9
1.2. Piezoelectric materials 11
1.3. Piezoelectric properties 12
1.4. Piezoelectric composites 14
1.5. Fabrication process 16
1.6. Theory 18
1.7. Purpose of the research 20
1.8. Outline of the thesis 21
Chapter 2 Processing and characterization of piezoelectric
0-3 PZT/LCT/PA composites 25
2. 1.Introduction 27
2.2 Experimental 28
2.3 Theory 30
2.4. Results and discussion 32
2.5. Conclusions 46
Chapter 3 Highly flexible piezoelectric 0-3 PZT/PDMS composites
with high filler content 49
3. 1.Introduction 51
3.2. Experimental 53
3.3. Results and discussion 54
3.4. Conclusions 66
6
Chapter 4 Enhanced electromechanical properties of piezoelectric
thin flexible films 69
4. 1. Introduction 71
4.2. Experimental 72
4.3. Results and discussion 72
4.4. Conclusions 82
Chapter 5 Design, fabrication and performance analysis of
piezoelectric PZT composite bimorphs 85
5. 1. Introduction 87
5.2. Experimental 89
5.3. Results and discussion 94
5.4. Conclusions 97
Chapter 6 Accurate measurements of the piezoelectric
charge coefficient 99
6. 1. Introduction 101
6.2. Experimental 102
6.3. Results and discussion 103
6.4. Conclusions 106
Chapter 7 Summary and Outlook 109
7. 1. Summary 111
7.2. Outlook 113
Samenvatting
Publications
Acknowledgements
Curriculum Vitae
7
Chapter 1
Introduction
In this chapter a concise introduction and an overview to piezoelectricity
and piezoelectric materials are given. Important piezoelectric materials,
properties and piezo composites are briefly reviewed, while pointing to
aspects relevant to current and emerging applications. Furthermore the
purpose of the research and an outline of the structure of the thesis are
described.
*Part of this chapter has been submitted for publication as: I. Babu, N. Meis and G. de With, "Review of
piezoelectric composites,” Journal of Materials Chemistry (2013).

8
9
1. 1. Introduction
Piezoelectricity is the property of certain crystalline materials to develop electric charge
in response to applied mechanical stress. The word piezoelectricity means electricity
resulting from pressure [1]. The German physicist Wilhelm G. Hankel gave this
phenomenon the name piezoelectricity, derived from the Greek ‘piezo’ or ‘piezein’
which means to squeeze or press, and electric or electron, which stands for amber, an
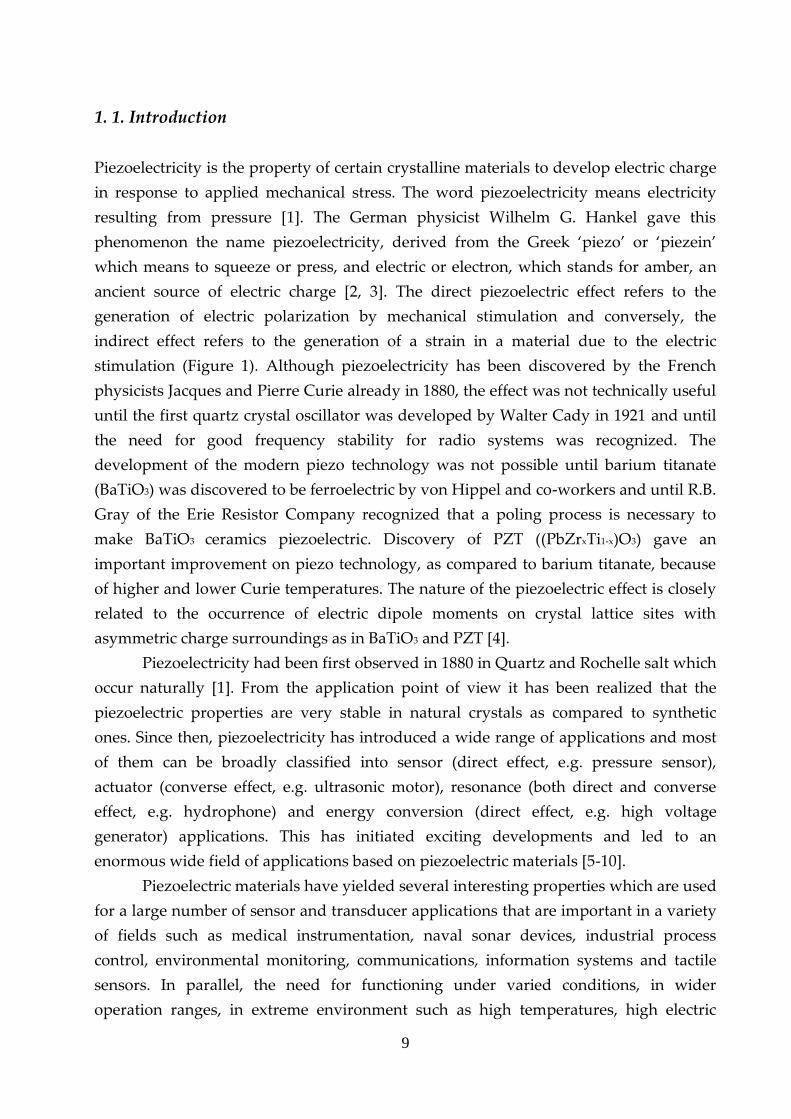
ancient source of electric charge [2, 3]. The direct piezoelectric effect refers to the
generation of electric polarization by mechanical stimulation and conversely, the
indirect effect refers to the generation of a strain in a material due to the electric
stimulation (Figure 1). Although piezoelectricity has been discovered by the French
physicists Jacques and Pierre Curie already in 1880, the effect was not technically useful
until the first quartz crystal oscillator was developed by Walter Cady in 1921 and until
the need for good frequency stability for radio systems was recognized. The
development of the modern piezo technology was not possible until barium titanate
(BaTiO3) was discovered to be ferroelectric by von Hippel and co-workers and until R.B.
Gray of the Erie Resistor Company recognized that a poling process is necessary to
make BaTiO3 ceramics piezoelectric. Discovery of PZT ((PbZrxTi1-x)O3) gave an
important improvement on piezo technology, as compared to barium titanate, because
of higher and lower Curie temperatures. The nature of the piezoelectric effect is closely
related to the occurrence of electric dipole moments on crystal lattice sites with
asymmetric charge surroundings as in BaTiO3 and PZT [4].
Piezoelectricity had been first observed in 1880 in Quartz and Rochelle salt which
occur naturally [1]. From the application point of view it has been realized that the
piezoelectric properties are very stable in natural crystals as compared to synthetic
ones. Since then, piezoelectricity has introduced a wide range of applications and most
of them can be broadly classified into sensor (direct effect, e.g. pressure sensor),
actuator (converse effect, e.g. ultrasonic motor), resonance (both direct and converse
effect, e.g. hydrophone) and energy conversion (direct effect, e.g. high voltage
generator) applications. This has initiated exciting developments and led to an
enormous wide field of applications based on piezoelectric materials [5-10].
Piezoelectric materials have yielded several interesting properties which are used
for a large number of sensor and transducer applications that are important in a variety
of fields such as medical instrumentation, naval sonar devices, industrial process
control, environmental monitoring, communications, information systems and tactile
sensors. In parallel, the need for functioning under varied conditions, in wider
operation ranges, in extreme environment such as high temperatures, high electric
10
fields or pressures, high frequencies continues to grow and this lead to the development
of new piezoelectric materials and processing technologies. A wide variety of materials
are piezoelectric which include crystals (natural and synthetic), ceramics and polymers
[11].
Figure 1. Direct and converse piezoelectric effect.
1980 1984 1988 1992 1996 2000 2004 2008 20120
100
200
300
400
500
600
700
Nu
mb
er
of
pu
bli
cati
on
s
Year
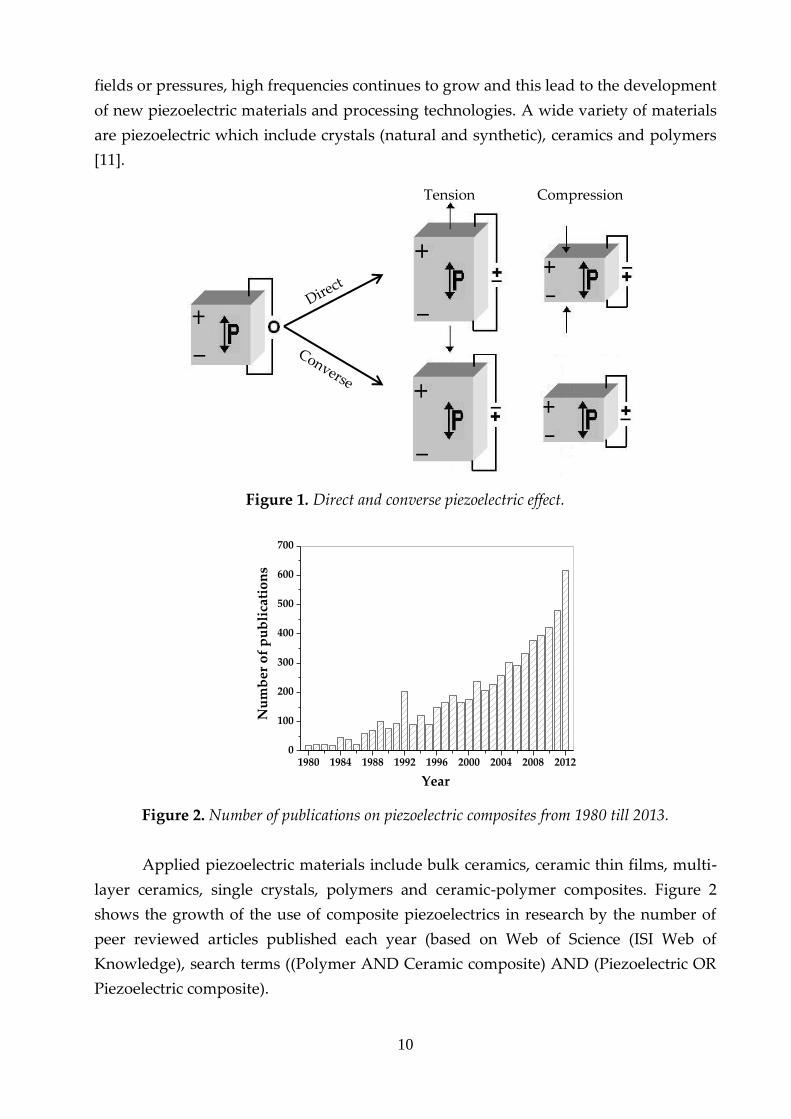
Figure 2. Number of publications on piezoelectric composites from 1980 till 2013.
Applied piezoelectric materials include bulk ceramics, ceramic thin films, multi-
layer ceramics, single crystals, polymers and ceramic-polymer composites. Figure 2
shows the growth of the use of composite piezoelectrics in research by the number of
peer reviewed articles published each year (based on Web of Science (ISI Web of
Knowledge), search terms ((Polymer AND Ceramic composite) AND (Piezoelectric OR
Piezoelectric composite).
Compression Tension
11
1.2. Piezoelectric materials
Piezoelectric materials exhibit intrinsic polarization and the characteristic of this state is
the thermodynamically stable and reversibility of the axis of polarization under the
influence of an electric field. The reversibility of the polarization, and the coupling
between mechanical and electrical effects are of crucial significance for the wide
technological utilization of piezoelectric materials. Piezoelectric materials can be
classified in to crystals, ceramics and polymers. The most well-known piezoelectric
crystal is quartz SiO2. Most of the piezoelectric materials are ceramic in nature though
these ceramics are not actually piezoelectric but rather exhibit a polarized
electrostrictive effect. These include lead zirconate titanate PZT (PbZrxTi1-x)O3, lead
titanate (PbTiO2), lead zirconate (PbZrO3), and barium titanate (BaTiO3). There are some
polymeric materials which are piezoelectric and polyvinylidene fluoride is one of them
[12-13].
The perovskite Pb(ZrxTi1-x)O3 piezoelectric ceramic is playing a dominant role in
piezoelectric materials. PZT and its related materials have been extensively investigated
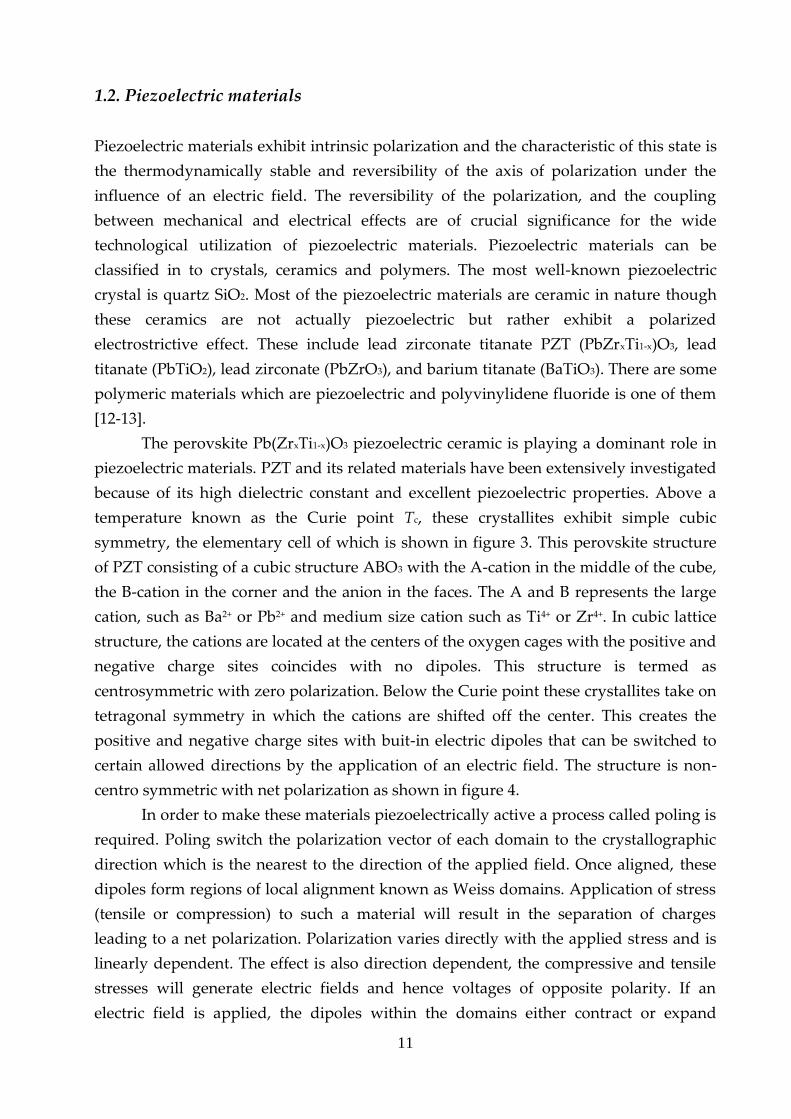
because of its high dielectric constant and excellent piezoelectric properties. Above a
temperature known as the Curie point Tc, these crystallites exhibit simple cubic
symmetry, the elementary cell of which is shown in figure 3. This perovskite structure
of PZT consisting of a cubic structure ABO3 with the A-cation in the middle of the cube,
the B-cation in the corner and the anion in the faces. The A and B represents the large
cation, such as Ba2+ or Pb2+ and medium size cation such as Ti4+ or Zr4+. In cubic lattice
structure, the cations are located at the centers of the oxygen cages with the positive and
negative charge sites coincides with no dipoles. This structure is termed as
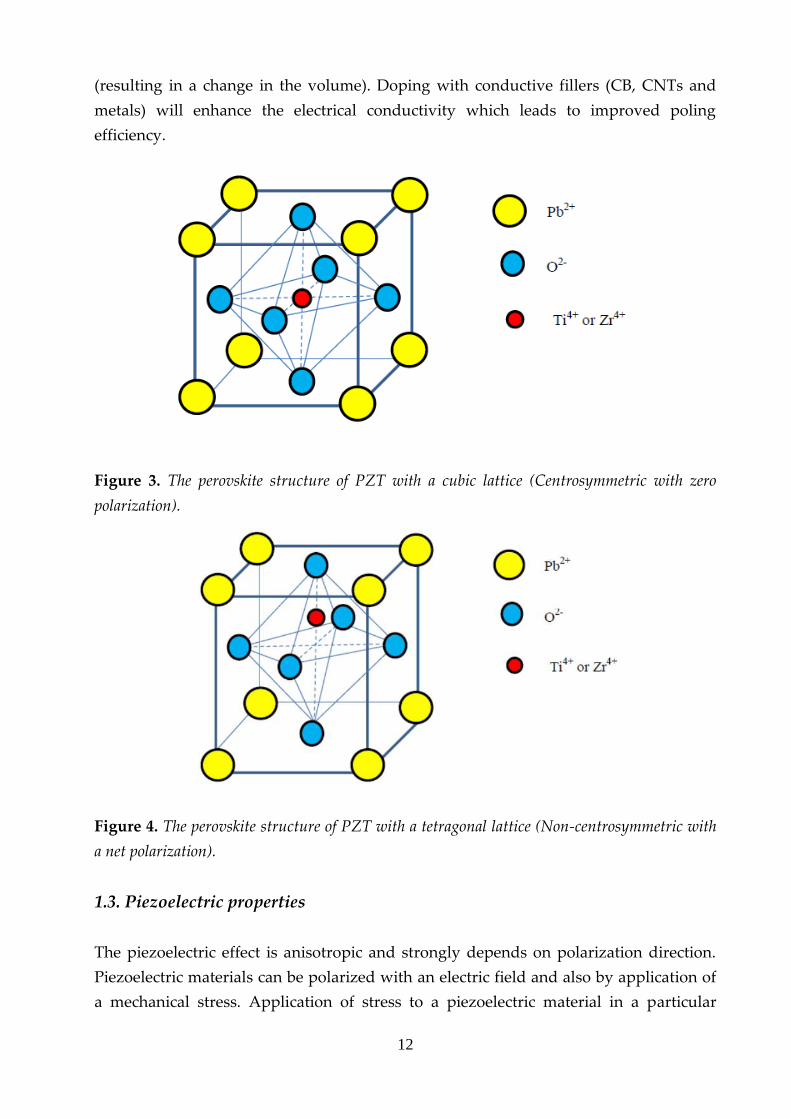
centrosymmetric with zero polarization. Below the Curie point these crystallites take on
tetragonal symmetry in which the cations are shifted off the center. This creates the
positive and negative charge sites with buit-in electric dipoles that can be switched to
certain allowed directions by the application of an electric field. The structure is non-
centro symmetric with net polarization as shown in figure 4.
In order to make these materials piezoelectrically active a process called poling is
required. Poling switch the polarization vector of each domain to the crystallographic
direction which is the nearest to the direction of the applied field. Once aligned, these
dipoles form regions of local alignment known as Weiss domains. Application of stress
(tensile or compression) to such a material will result in the separation of charges
leading to a net polarization. Polarization varies directly with the applied stress and is
linearly dependent. The effect is also direction dependent, the compressive and tensile
stresses will generate electric fields and hence voltages of opposite polarity. If an
electric field is applied, the dipoles within the domains either contract or expand
12
(resulting in a change in the volume). Doping with conductive fillers (CB, CNTs and
metals) will enhance the electrical conductivity which leads to improved poling
efficiency.
Figure 3. The perovskite structure of PZT with a cubic lattice (Centrosymmetric with zero
polarization).
Figure 4. The perovskite structure of PZT with a tetragonal lattice (Non-centrosymmetric with
a net polarization).
1.3. Piezoelectric properties
The piezoelectric effect is anisotropic and strongly depends on polarization direction.
Piezoelectric materials can be polarized with an electric field and also by application of
a mechanical stress. Application of stress to a piezoelectric material in a particular
13
direction, will strain the material in not only the direction of the applied stress but also
in directions perpendicular to the stress as well. The linear relationship between the
stress applied on a piezoelectric material and the resulting polarization generated is
known as the direct piezoelectric effect. Conversely strain generated (contract or
expand) in a piezoelectric material when an electric field is applied is called converse
piezoelectric effect. Since the piezoelectric coupling is described by a linear relationship
between the first-rank tensor (D or E) and the second-rank tensor (σ or ε), the
corresponding coupling coefficients form a third-rank tensor. Both the direct and
converse piezoelectric effects can be described mathematically through the tensor
notation in the following form (i, j, k = 1, 2, 3), [14].
Di = dijk σjk Direct effect (1)
εjk = dijk Ei Converse effect (2)
where Di is the dielectric displacement, σjk is the applied stress, εjk is the strain
generated, Ei is the applied field and dijk is the piezolectric coeiffficient. The units of
direct piezoelectric effect are C/N (Coulomb/Newton) and for the converse piezoelectric
effect are m/V (meter/Volt).
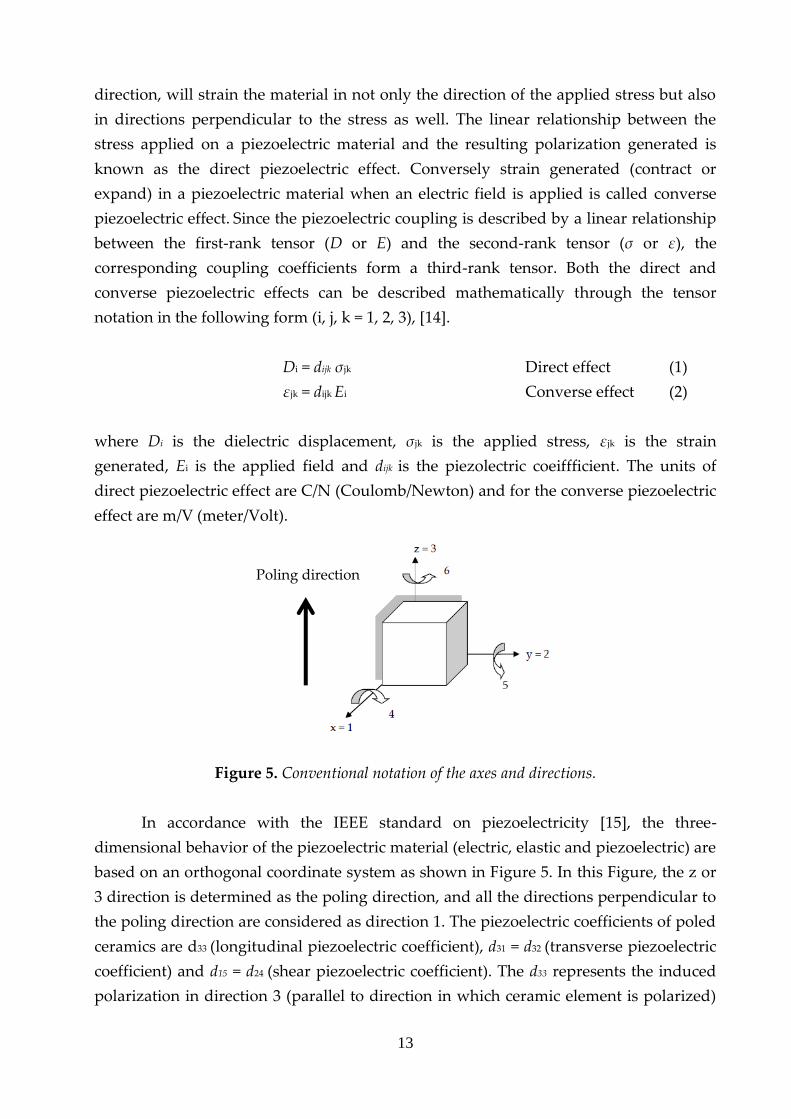
Figure 5. Conventional notation of the axes and directions.
In accordance with the IEEE standard on piezoelectricity [15], the three-
dimensional behavior of the piezoelectric material (electric, elastic and piezoelectric) are
based on an orthogonal coordinate system as shown in Figure 5. In this Figure, the z or
3 direction is determined as the poling direction, and all the directions perpendicular to
the poling direction are considered as direction 1. The piezoelectric coefficients of poled
ceramics are d33 (longitudinal piezoelectric coefficient), d31 = d32 (transverse piezoelectric
coefficient) and d15 = d24 (shear piezoelectric coefficient). The d33 represents the induced
polarization in direction 3 (parallel to direction in which ceramic element is polarized)
Poling direction
14
per unit stress applied in direction 3. Conversely it is the strain generated in the
direction 3 due to an electric field applied in the direction 3. While the d31 stands for
(induced polarization in direction 3 (parallel to direction in which ceramic element is
polarized) per unit stress applied in direction 1 (perpendicular to direction in which
ceramic element is polarized). The three principal axes are assigned as x, y and z (1, 2
and 3) while 4, 5, and 6 describe mechanical shear stress which acts tangentially to the
areas defining the coordinate system.
1.4. Piezoelectric composites
Realization of excellent properties is acquired in piezoelectric composites by the
combination of its constituent phases. As a result the demand for piezoelectric
composites is growing and developing such materials is a common way to tailor the
material properties for particular applications. The arrangement of the constituent
phases in a composite is critical for the electromechanical coupling of the composites.
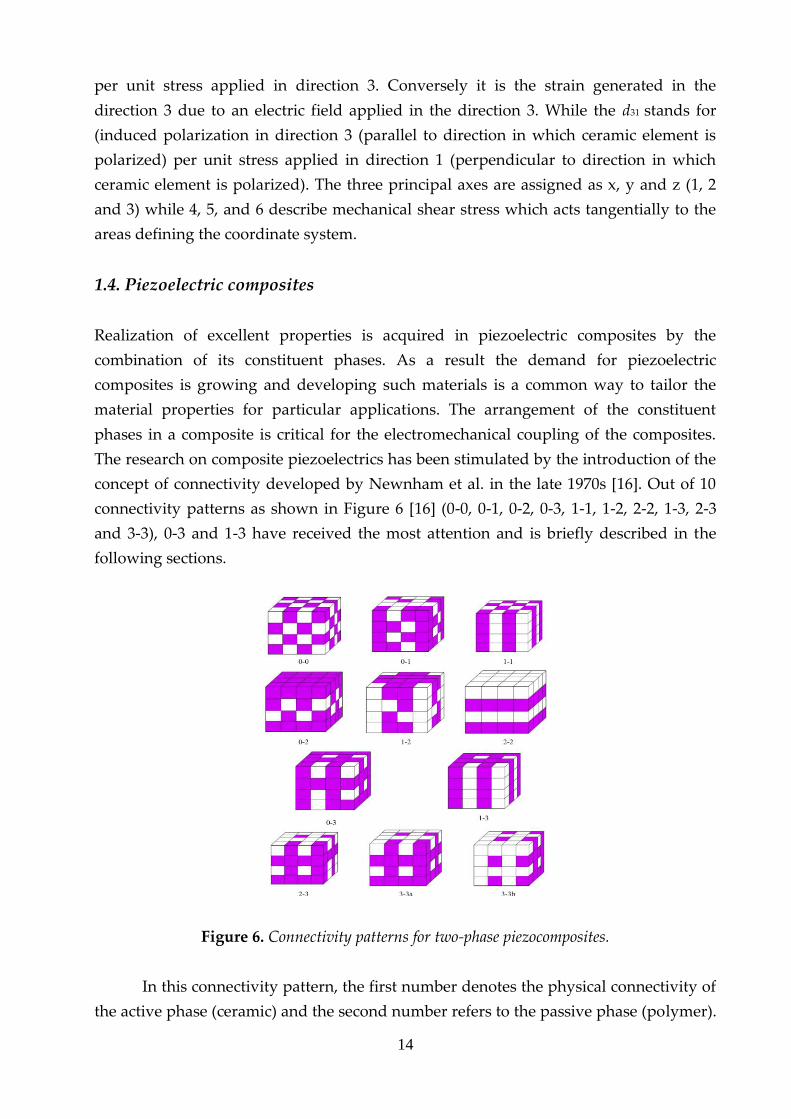
The research on composite piezoelectrics has been stimulated by the introduction of the
concept of connectivity developed by Newnham et al. in the late 1970s [16]. Out of 10
connectivity patterns as shown in Figure 6 [16] (0-0, 0-1, 0-2, 0-3, 1-1, 1-2, 2-2, 1-3, 2-3
and 3-3), 0-3 and 1-3 have received the most attention and is briefly described in the
following sections.
Figure 6. Connectivity patterns for two-phase piezocomposites.
In this connectivity pattern, the first number denotes the physical connectivity of
the active phase (ceramic) and the second number refers to the passive phase (polymer).
15
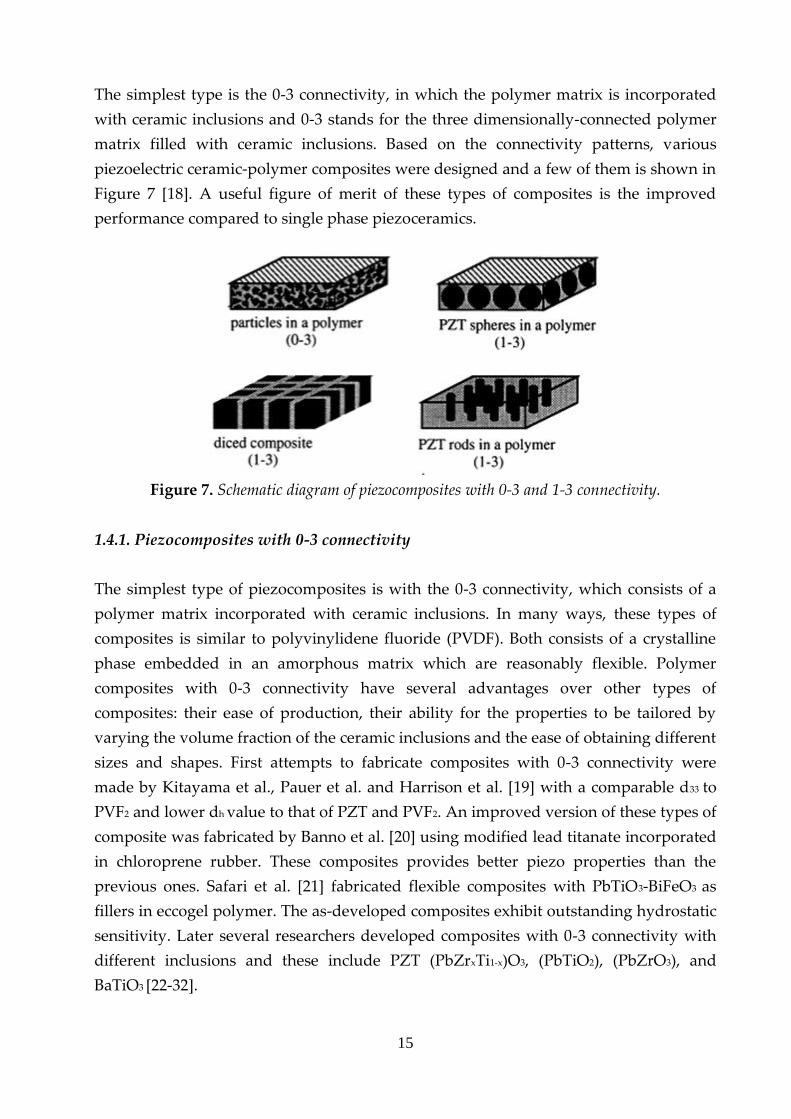
The simplest type is the 0-3 connectivity, in which the polymer matrix is incorporated
with ceramic inclusions and 0-3 stands for the three dimensionally-connected polymer
matrix filled with ceramic inclusions. Based on the connectivity patterns, various
piezoelectric ceramic-polymer composites were designed and a few of them is shown in
Figure 7 [18]. A useful figure of merit of these types of composites is the improved
performance compared to single phase piezoceramics.
Figure 7. Schematic diagram of piezocomposites with 0-3 and 1-3 connectivity.
1.4.1. Piezocomposites with 0-3 connectivity
The simplest type of piezocomposites is with the 0-3 connectivity, which consists of a
polymer matrix incorporated with ceramic inclusions. In many ways, these types of
composites is similar to polyvinylidene fluoride (PVDF). Both consists of a crystalline
phase embedded in an amorphous matrix which are reasonably flexible. Polymer
composites with 0-3 connectivity have several advantages over other types of
composites: their ease of production, their ability for the properties to be tailored by
varying the volume fraction of the ceramic inclusions and the ease of obtaining different
sizes and shapes. First attempts to fabricate composites with 0-3 connectivity were
made by Kitayama et al., Pauer et al. and Harrison et al. [19] with a comparable d33 to
PVF2 and lower dh value to that of PZT and PVF2. An improved version of these types of
composite was fabricated by Banno et al. [20] using modified lead titanate incorporated
in chloroprene rubber. These composites provides better piezo properties than the
previous ones. Safari et al. [21] fabricated flexible composites with PbTiO3-BiFeO3 as
fillers in eccogel polymer. The as-developed composites exhibit outstanding hydrostatic
sensitivity. Later several researchers developed composites with 0-3 connectivity with
different inclusions and these include PZT (PbZrxTi1-x)O3, (PbTiO2), (PbZrO3), and
BaTiO3 [22-32].
16
1.4.2. Piezocomposites with 1-3 connectivity
In composites with 1-3 connectivity, the ceramic rods or fibers are self-connected one
dimensionally in a three dimensionally connected polymer matrix. In this type of
composites, the PZT rods or fibers are aligned in a direction parallel to the poling
direction. These types of composites have relatively good hydrostatic piezoelectric
constants. First attempts to fabricate composites with 1-3 connectivity were developed
by Klicker et al. [33] by incorporating PZT rods in porous polyurethane matrix. Lynn et
al. [34] also developed these types of composites by incorporating PZT rods in different
types of polymer matrices. Since the high Poisson ratio of the polymer plays a negative
role in the piezo properties of the composites, porous polymer matrices are used for the
fabrication of 1-3 types composites. Fabrication of these types of composites is not easy
and a recent study shows that the PZT particles can align in one dimension by
dielectrophoresis (DEP) by applying an electric field to a composite incorporated with
PZT particle [35].
1.5. Fabrication process
Piezoceramic materials are available in a large variety of shapes and forms.
Consequently, these materials are manufactured in many different ways: sputtering,
metal organic chemical vapor deposition (MOCVD), chemical solution deposition
(CSD), the sol gel method and pulsed laser deposition (PLD) which is a physical
method by thermal evaporation. These new technologies all techniques have (large)
drawbacks. The MOCVD process has a fundamental drawback, in that the stable
delivery of metal-organic precursors is difficult to achieve with conventional bubbler
technology, because of the lack of suitable precursors. Moreover, precursors tent to
degrade at elevated temperatures and vapor pressure in the bubbler varies with time,
and therefore constant delivery is hard to achieve. The CSD method has the
disadvantage that it can not be utilized for high density memory devices because the
substrate must undergo the planarization process in order to spin-coat ferroelectric
films. In sol-gel methods cracks are liable to occur in the post-annealing process when
the thickness of the PZT film is larger than several hundred of angstroms. Therefore,
forming many thin layers of film is usually done in order to prevent cracks. However,
many time repetition of spin coating, pre-baking and post-annealing is time consuming
and also increases the probability of contamination [36-40].
PLD technique is the most popular and powerful one in terms of stoichiometric
transfer from the multi component oxide target to the growing film and its easy
applications of PZT material. However, PLD has shortcomings too, in particular the
17
oxygen content in the deposited layer may differ from that of the target and sometimes
large entities are deposited, leading to a particulate nature of the films realized. The size
of these particulates may be as large as few micrometers. Such particulates will greatly
affect the growth of the subsequent layers as well as the electrical properties of the
films, which can be detrimental for PZT material [41, 42].
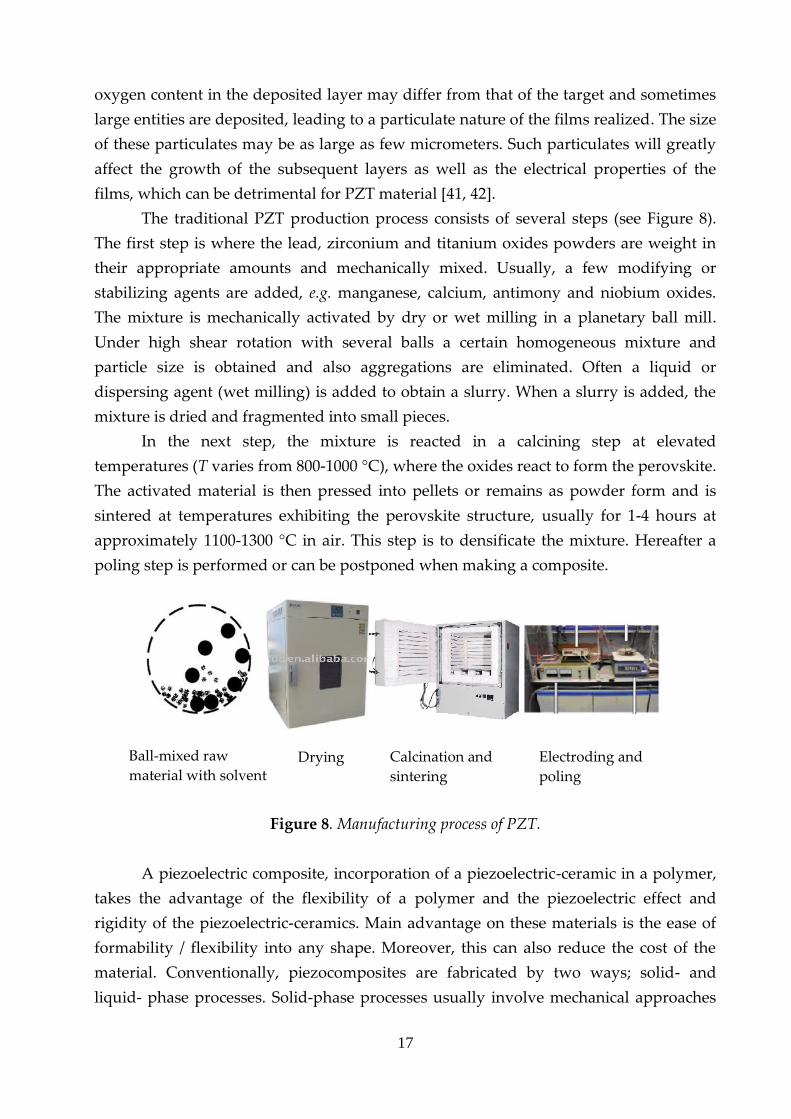
The traditional PZT production process consists of several steps (see Figure 8).
The first step is where the lead, zirconium and titanium oxides powders are weight in
their appropriate amounts and mechanically mixed. Usually, a few modifying or
stabilizing agents are added, e.g. manganese, calcium, antimony and niobium oxides.
The mixture is mechanically activated by dry or wet milling in a planetary ball mill.
Under high shear rotation with several balls a certain homogeneous mixture and
particle size is obtained and also aggregations are eliminated. Often a liquid or
dispersing agent (wet milling) is added to obtain a slurry. When a slurry is added, the
mixture is dried and fragmented into small pieces.
In the next step, the mixture is reacted in a calcining step at elevated
temperatures (T varies from 800-1000 °C), where the oxides react to form the perovskite.
The activated material is then pressed into pellets or remains as powder form and is
sintered at temperatures exhibiting the perovskite structure, usually for 1-4 hours at
approximately 1100-1300 °C in air. This step is to densificate the mixture. Hereafter a
poling step is performed or can be postponed when making a composite.
Figure 8. Manufacturing process of PZT.
A piezoelectric composite, incorporation of a piezoelectric-ceramic in a polymer,
takes the advantage of the flexibility of a polymer and the piezoelectric effect and
rigidity of the piezoelectric-ceramics. Main advantage on these materials is the ease of
formability / flexibility into any shape. Moreover, this can also reduce the cost of the
material. Conventionally, piezocomposites are fabricated by two ways; solid- and
liquid- phase processes. Solid-phase processes usually involve mechanical approaches
Ball-mixed raw
material with solvent Drying Calcination and
sintering
Electroding and
poling
18
like direct compounding and melt compounding. Liquid-phase processes involve
solvent assisted dispersion of the piezo-material in the polymer monomer followed by
in-situ polymerization processes [17].
The major ingredient in PZT is lead oxide, which is a hazardous material with a
relatively high vapor pressure at calcining temperatures. Consequently, last decades
PZT also attracted attention from an environmental perspective. Concerns about the
lead compound in PZT, which can during calcination and sintering release volatiles
causing pollution. More concern is about the recycling and disposal of devices
containing PZT, especially those used in consumers products. Extensive effort in
research has been made to arrive with alternatives for PZT, which do not contain lead
such as BaTiO3, Na0.5Bi0.5TiO3, K0.5Bi0.5TiO3, Na0.5K0.5NbO3 and many more [43-48].
However, till today, none of the alternatives encounters better performance as
compared to PZT for ferroelectric and piezoelectric properties (converting very efficient
electrical energy into mechanical energy or vice versa).
1.6. Theory
Various theoretical models have been proposed for the permittivity and piezoelectric
properties of the 0-3 composites. Some of the mostly used analytic expressions are
briefly discussed here. For a brief review we refer to [49] while [50] provides an
extensive discussion. One of the first, if not the first, model for understanding the
dielectric behavior of composites, still widely used, was given in 1904 by Maxwell
Garnett [50]. In this model spherical inclusions are embedded in a polymer matrix
without any kind of interaction resulting in:
ε = εp {1+[ 3φc (εc – εp/εc + 2εc)] / [1 – φc (εc – εp/εc + 2εc)]} (2)
where φc is the volume fraction of the inclusions and ε, εc and εp are the relative
permittivity of the composite, ceramic particles and matrix, respectively. Lichtenecker
[51] provided in 1923 a rule of mixtures, also still widely used, that reads:
cc 1
pc
(3)
Although initially largely empirical, in 1998 Zakri et al. [52] provided a theoretical
underpinning of this rule.
In 1982 Yamada et al. [22] proposed a model to explain the behavior of the
permittivity, piezoelectric constant and elastic constant of a composite in which
ellipsoidal particles are dispersed in a continuous medium aligned along the electric
19
field. Their model shows excellent agreement with experimental data of PVDF-PZT
composites. Their final equations read:
)1)((
)(1
cpcp
pcc
p
n
n (4)
ccp Gdd (5)
)13(
1 with
)1)((
)(1
p
p
cpcp
pcc
p
n'
EEn'E
EEEE (6)
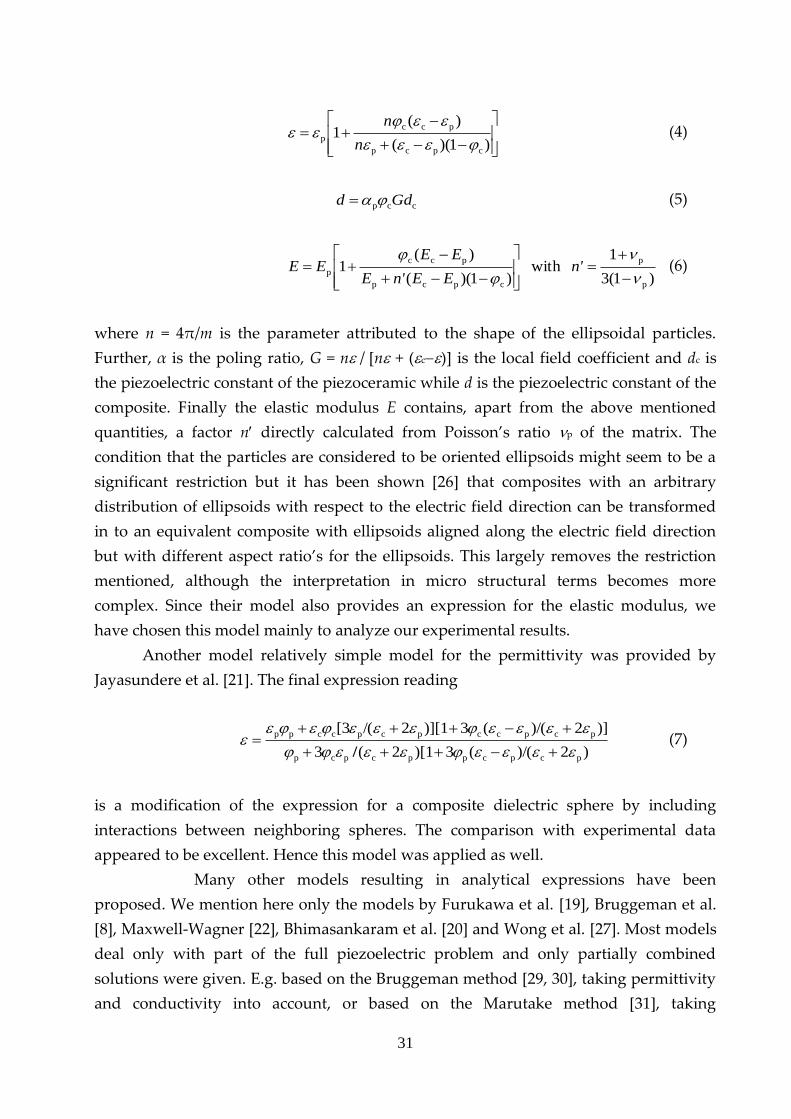
where n = 4π/m is the parameter attributed to the shape of the ellipsoidal particles.
Further, α is the poling ratio, G = n / [n + (c)] is the local field coefficient and dc is
the piezoelectric constant of the piezoceramic while d is the piezoelectric constant of the
composite. Finally the elastic modulus E contains, apart from the above mentioned
quantities, a factor n directly calculated from Poisson’s ratio p of the matrix. The
condition that the particles are considered to be oriented ellipsoids might seem to be a
significant restriction but it has been shown [52] that composites with an arbitrary
distribution of ellipsoids with respect to the electric field direction can be transformed
in to an equivalent composite with ellipsoids aligned along the electric field direction
but with different aspect ratio’s for the ellipsoids. This largely removes the restriction
mentioned, although the interpretation in micro structural terms becomes more
complex.
Another model relatively simple model for the permittivity was provided by
Jayasundere et al. [53]. The final expression reading:
)2)/((3)[12(3
)]2)/((3)][12/([3
pcpcppcpcp
pcpccpcpccpp
/ (7)
is a modification of the expression for a composite dielectric sphere by including
interactions between neighboring spheres.
Many other models resulting in analytical expressions have been
proposed. We mention here only the models by Furukawa et al. [23], Bruggeman et al.
[54], Maxwell-Wagner [49], Bhimasankaram et al. [49] and Wong et al. [55]. Most
models deal only with part of the full piezoelectric problem and only partially
combined solutions were given. e.g. based on the Bruggeman method [54, 56], taking
permittivity and conductivity into account, or based on the Marutake method [57],
taking permittivity piezoelectric coefficients and elastic compliance into account. The
20
latter already requires numerical solution. Recently complete numerical solutions to the
fully coupled piezoelectric equations for ellipsoidal inclusions of the same orientation
have been provided [58] predicting giant piezoelectric and dielectric enhancement. No
experimental evidence for this effect was presented though while a significant
conductivity is required rendering the options for practical applications probably less
useful.
1.7. Purpose of the research
Piezoelectric composites with 0-3 connectivity have several unique properties and have
been widely utilized in a large number of sensor and transducer applications. Due to
the continued and increased demands for an enormous wide field of applications,
extensive research has been carried out in recent years. This leads to the development of
new piezoelectric materials and processing technologies. In general, the performance of
these composite materials is optimized depending on specific applications. These
composite systems have several advantages: their ease of production, their ability for
the properties to be tailored by varying the volume fraction of the ceramic inclusions
and the ease of obtaining different sizes and shapes and excellent high temperature
stability. However, in spite of the developments throughout the years, the need for
highly flexible, soft and thin composites having excellent piezoelectric properties have
not been fulfilled yet and this limit the usefulness of the composite materials for
potential soft-touch applications. The development and characterization of novel
piezoelectric composites may overcome this limitation and has potential applications in
the fields of fundamental as well as applied research and opens new ways to ‘soft
touch’ applications in a variety of transducer and sensor applications.
The general aim of this research is to design and fabricate fairly flexible
composites with high permittivity and piezoelectric charge constant for transducer and
sensors applications. In this research, we have developed novel single-piezo layer
(unimorph) and double-piezo layer (bimorph) 0-3 piezoelectric composites. The
functional and mechanical properties of these composites were quantified using
experimental and theoretical methods. We also investigated the feasibility of
fabricating these novel composites in the form of films and the reliability of laminated
films. The correlation of the chemistry of matrix material to the adhesion of the PZT
particles in the matrix and the resulting properties were also studied.
The novel composites developed in this study possess the ability to attain
various sizes and shapes, each with high flexibility and combined with good functional
properties. Furthermore, we report for the first time on the enhancement of
electromechanical properties by incorporating nano-size conductive fillers like carbon
21
nano tubes and carbon black into composite matrix. The newly developed bimorphs
have several advantages in terms of ease of fabrication, tailoring the properties and low
price and renders as a useful alternative for high temperature applications. The
excellent properties and the relatively simple fabrication procedure of different
unimorph and bimorph composites developed in this research make them promising
candidates in piezoelectric sensors, actuators and high efficiency capacitors.
1.8. Outline of the thesis
Chapter 2 describes the processing and characterization of new series of fairly flexible 0-
3 PZT/LCT/PA (Lead Zirconate Titanate Pb(Zr1-xTix)O3/Liquid crystalline
thermotropic/Polyamide) piezoelectric composites with high permittivity and
piezoelectric charge constant by incorporating PZT5A4 into a matrix of LCT and
polyamide (PA11). For comparison PZT/PA composites were studied. Commercially
available PZT powder was calcined at different temperatures for the optimization of the
composite properties. The phase transition during calcination of the powder was
studied by X-ray diffraction and the particle size by light scattering and scanning
electron microscopy. The experimental results for relative permittivity εr, piezoelectric
charge constant d33, piezoelectric voltage coefficient g33 obtained for these composites
were compared with several theoretical models (Jayasundere, Yamada and
Lichtenecker).
Chapter 3 describes realization of highly flexible piezoelectric composites with 0-
3 connectivity, with filler volume fractions up to 50 vol. % and having no pores.
Composites were fabricated by solution casting of dispersions of (Pb(ZrxTi1-x)O3 (PZT) in
poly-(dimethylsiloxane) (PDMS). The electrical, dielectrical and mechanical properties
were investigated as a function of ceramic volume fraction and frequency. The
experimental results were compared with theoretical models (Yamada and
Jayasundere). These PZT/PDMS composites offer the advantage of high flexibility in
comparison with other 0-3 composites, even with 50 vol. % PZT. These composites
possess the ability to attain various sizes and shapes, each with high flexibility due to
the exceptional elastic behavior of PDMS, combined with good functional properties.
The high flexibility combined with excellent properties of these composites opens new
ways to ‘soft touch’ applications in a variety of transducer and sensor applications.
Chapter 4 reports on the enhancement of electromechanical properties of 0-3
PZT/PDMS composites incorporated with nano-size conductive fillers like carbon nano
tubes (CNT) and carbon black (CB). Highly flexible piezoelectric 0-3 PZT/PDMS (lead
zirconate titanate - poly dimethyl siloxane) composites incorporated with carbon
22
nanotubes (CNT) and carbon black (CB) were fabricated by solution casting technique
using a constant PZT/PDMS ratio of 40/60 and conductive fillers ranging from 0 to 0.5
vol.%. The electromechanical properties and the characterization of the composites
were studied as a function of the volume fraction and frequency. In this study we
realized a simple fabrication procedure for highly dense piezoelectric composites
containing CNTs and CB with a combination of high dielectric constant and low
dielectric loss. The excellent (di-)electrical properties and the relatively simple
fabrication procedure of these composites make them promising candidates in
piezoelectric sensors, actuators and high efficiency capacitors.
Chapter 5 describes design, fabrication and performance analysis of two new
disc-type composite bimorphs with series connection by compression molding
(PZT/PA-rigid) and solution casting (PZT/PDMS-flexible) technique. The bimorph
consists of two circular piezoelectric disks, which are separated by a metal plate
aluminium, which act as central electrode and also as reinforcement. We have used two
types of composites, PZT/PA and PZT/PDMS, both using lead zirconate titanate (PZT)
as piezoelectric filler and the matrix consisted of polyamide (PA) and poly dimethyl
siloxane (PDMS). Electric force microscopy (EFM) is used to study the structural
characterization and the piezoelectric properties of the materials realized. The newly
developed bimorphs have several advantages in terms of ease of fabrication, tailoring
the properties and low price. The absence of any bonding agent in the fabrication
process renders these bimorphs a useful alternative for high temperature applications.
Chapter 6 describes the contribution of the electric field dependence of the strain,
i.e. dx/dE, to the experimentally determined d33 due to the mechanical load is applied to
realize proper measurements of the piezoelectric charge constant d33 of materials. The
samples were characterized with respect to their piezoelectric properties in terms of a
static preload, imposing a varying load and constant frequency of 110 Hz using a d33
meter. We used 0-3 composites (PZT/LCT/PA, PZT/PA and PZT/PDMS) and compared
measurements as a function of load for these materials with ceramic reference samples
(PZT disks). While for stiff reference materials this contribution is small, ~ 1.5%, for the
compliant composite materials it is about 15%. Hence for an accurate determination of
the d-value the experimental data extrapolated to load zero. Since equipment to
measure the d33 is conventionally used for stiff, ceramic-like materials and the expected
load dependence for polymer matrix piezo-composites is expected to larger than for
ceramics, a study on the load dependence of d33 for polymer matrix composites was
done.
Finally, chapter 7 describes a summary of the results of this research project and
discusses the future applications and potentials of the results described in this thesis.
23
References
[1] B. Jaffe, W.R. Cook and H. Jaffe, Piezoelectric ceramics, New York, 1971, p. 49-50.
[2] G.W. Taylor, Piezoelectricity, New York, 1985, p. 3-5.
[3] G. Gautschi, Piezoelectric Sensorics, Germany, 2002, p. 5-7.
[4] N. Setter, Piezoelectric materials in devices, Switzerland, 2002, p. 29-30.
[5] M.S. Vijaya, Piezoelectric materials and devices, New York, 2013, p. 39-40.
[6] W. Wersing, M. Schnoller and H. Wahl, Ferroelectrics, 68, 1986, p. 145-156.
[7] Z.M. Dang, Y.H. Lin, C.W. Nan, Adv Mater, 2003, 15, 1525-9.
[8] R. Newnham, L.J. Bowen, K. Klicker and L.E. Cross, Material Engineering, 1980, 2, 93-9.
[9] K. Uchino, Piezoelectric actuators and ultrasonic motors, USA, 1997, p. 2-20.
[10] J. Lu, K.S. Moon, J. Xu, C.P. Wong, J. Mater Chem, 2006, 16, 1543-8.
[11] P. Muralt, J. Micromech. microeng., 2000, p. 136-146.
[12] C.Z. Rosen, B.V. Hiremath and R.E. Newnham, Piezoelectricity, New York, 1992, p. 10-
15.
[13] H. Nalwa, Ferroelectric polymers, New York, 1995, p. 13-15
[14] M.R. Kermani, Applied vibration suppression using piezoelectric materials, USA, 2008,
p. 5-7.
[15] IEEE standard on piezoelectricity, IEEE Ultrasonics, Ferroelectrics, and Frequency
Control Society, USA, 1987, p. 21-22.
[16] R.E. Newnham, D.P. Skinner and L.E. Cross, Mat. Res. Bull. 1978, 13, p. 525-536.
[17] Z.M. Dang, J.K. Yuan, J.W. Zha, T. Zhou, S.T. Li and G.H. Hu, Progress in materials
Science, 2012, 57, 660-723.
[18] J.F. Tressler, S. Alkoy, A. Dogan, R.E. Newnham, Composites Part A: Applied Science
and Manufacturing, 1999, 30, p. 477-482.
[19] C.Z. Rosen, B.V. Hiremath and R.E. Newnham, Piezoelectricity, New York, 1992, p. 195-
204.
[20] H. Banno, Ferroelectrics, 1983, 50, p. 3-12.
[21] A. Safari, G. Sa-gong, J. Giniewicz and R.E. Newnham, Proceedings of the 21st university
conference on ceramic sciences, 1986, 20, 445-454.
[22] T. Yamada, T. Udea and T. Kitayama, J. Appl. Phys., 1982, 53, p. 4328-4332.
[23] T. Furukawa, K. Ishida and E. Fukada, J. Appl. Phys., 1979, 50, p. 4904-4912.
[24] T. Bhimasankaran, S.V. Suryanarayana and G. Prasad, Cur. Sci. 74, 1998, 11, p. 967-976.
[25] E. Venkatragavaraj, B. Satish, P.R. Vinod, M.S. Vijaya, J. Phys. D: Appl. Phys. 2001, 34, p.
487.
[26] D. Khastgir, K. Adachi, J. Polym. Sci., Part B: Polym. Phys. 1999, 37, p. 3065.
[27] W.K. Sakamoto, E.d. Souza and D.K. Das-Gupta, Materials Research 2001, 4, p. 201-204
[28] G. Rujijanagul, S. Boonyakul and T. Tunkasiri, J. mater. Sci. Ltrs, 2001, 20, p. 1943-1945.
[29] B. Satish, K. Sridevi and M.S. Vijaya, J. Phys. D: Appl. Phys., 2002, 35, p. 2048–2050.
[30] D.A. van den Ende, P de Almeida and S. van der Zwaag, J. Mater. Sci., 2007, 42, p. 6417-
6425.
24
[31] I. Babu, D. A. v. d. Ende, G. de. With, J. Phys. D: Appl. Phys. 2010, 43, 425402.
[32] I. Babu and G. de. With, Composites Science and Technology. 2013; Submitted.
[33] K.A. Klicker, J.V. Biggers and R.E. Newnham, J. Am. Ceram. Soc., 1982, 64:5.
[34] S.Y. Lynn, R. E. Newnham, K. A. Klicker, K. Rittenmyer, A. Safari and W. A. Schulze,
1983, Ferroelectrics, 1981, 38, p. 955-958.
[35] D. A. van den Ende, S. E. van Kempen, X. Wu, W. A. Groen, C. A. Randall, and S. van
der Zwaag, J. Appl. Phys. 2012, 111, 124107.
[36] S. B. Krupanidhi, N. Maffei, M. Sayer, and K. El-Assal, J. Appl. Phys. 1983, 54, 6601-09.
[37] M. Toyama, R. Kubo, E. Takata, K. Tanaka, K. Ohwada, Sensors and Actuators A:
Physical, 1994, 45, 2, 125–129.
[38] S. Jeong, J. Shi-Zhao, H.R. Kim, D.Y. Park, C. S. Hwang, Y. K. Han, C. H. Yang, K. Y. Oh,
S. H. Kim, D.S. Lee and J. Ha, J. Electrochem. Soc. 2003, 150, 10, C678-C687.
[39] J.S. Zhao, D.Y. Park, M. J. Seo, C. S. Hwang, Y. K. Han, C. H. Yang and K. Y. Oh
J. Electrochem. Soc. 2004 151(5): C283-C291.
[40] Y. Sakashita, T. Ono, H. Segawa, K. Tominaga, and M. Okada, J. Appl. Phys. 1991, 69,
8352.
[41] G. Yi, Z. Wu, and M. Sayer, J. Appl. Phys. 1988, 64, 2717.
[42] K. W. Seo, S. H. Cho, S.H. Lee, Korean Journal of Chemical Engineering, 2001, 18, Issue
1, pp 75-80.
[43] D. Damjancovic, N. Klein, J. Li, V. Porokhonskyy, 2010, Functional Materials Letters, 3,
5-13.
[44] M. Demartin Maeder, D. Damjanovic, N. Setter, 2004, Journal of Electroceramics, 13, 385-
392.
[45] D. Xiao, D. Lin, J. Zhu, P. Yu, 2008, Journal of Electroceramics, 21, 34-38.
[46] E.A. Gurdal, S.O. Ural, H.-Y. Park, S. Nahm, K. Uchino, 2011, The Japan Society of
Applied Physics, 50, 027101.
[47] E. Aksel, J.L. Jones, 2010, Sensors, 10, 1935-1954.
[48] H. Li, W.-H. Shih, W.Y. Shih, 1993, Journal of the American Ceramic Society, 1852-1855.
[49] S. Firmino Mendes, C.M. Costa, V. Sencadas, J. Serrado Nunes, P. Costa, R. Gregorio jr.,
S. Lanceros-Méndez, J. Appl. Phys. A, 2009, 96, p. 899-908.
[50] A. Sihvola, Electromagnetic mixing formulas and applications, 1999, London, p. 166-167.
[51] K. Lichtenecker, Physikalische Zeitschrift, 1926, 27, p. 115-158.
[52] T. Zakri, J.P. Laurent and M.J. Vauclin, j. Phys. D: Appl. Phys., 1998, 31, p. 1589-1594.
[53] N. Jayasundere and B.V. Smith, J. Appl. Phys., 1993, 5, p. 2462-2466
[54] D.A.G. Bruggeman, Ann. Physik, 1935, 24, p. 636-664.
[55] C.K. Wong, Y. M. Poon, F.G. Shin, J. Appl. Phys., 2001, 90, p. 4690-4700.
[56] J.A. Reynolds and J.M. Hough, Proc. Phys Soc., 1957, London, B70, p. 769-774.
[57] M. Marutake, J. Phys Soc. Japan, 1956, 11, p. 807-814.
[58] A.V. Turik, A.I. Chernobabov, G.S. Radchenko and S.A. Turik, Physics of the Solid State,
2004, 46, p. 2213-2216.
25
Chapter 2
Processing and characterization of piezoelectric
0-3 PZT/LCT/PA composites*
PZT/LCT/PA (Lead Zirconate Titanate Pb(Zr1-xTix)O3/Liquid crystalline
thermotropic/Polyamide) composites of 0-3 connectivity were fabricated by hot-
pressing. Commercially available PZT powder was calcined at different temperatures
for the optimization of the composite properties. The phase transition during calcination
of the powder was studied by X-ray diffraction and the particle size by light scattering
and scanning electron microscopy. The relative permittivity εr, piezoelectric charge
constant d33, conductivity and elastic modulus E of the composites were found to
increase with increasing ceramic volume fraction φ. The obtained d33 and g33 values of
this newly developed PZT/LCT/PA composite with 50 volume percent PZT using a low
poling voltage of 60 kV/cm and poling time of 30 minutes are 42 pC/N and 65 mVm/N,
respectively, which are high values for this volume fraction in comparison with the
other 0-3 composites reported. Good agreement was found between the experimental
data of relative permittivity and piezoelectric constants with several theoretical models
(Jayasundere, Yamada and Lichtenecker) of 0-3 composites. In order to assess the
correlation of the experimental data with the theoretical models, the experimental data
obtained from PZT/PA composites were also included.
*This chapter has been published as: I. Babu, D.A. van den Ende, G. de With, "Processing and
characterization of piezoelectric 0-3 PZT/LCT/PA composites," Journal of Physics D: Applied Physics, 43
425402 (2010).

26

27
2.1. Introduction
Sensors and actuators based on piezoelectric ceramic-polymer composites, so-called
smart materials, offer a high potential for high tech systems. These composite materials
provide superior overall performance over conventional pure ceramics in having good
elastic compliance while maintaining good durability. Usually they are optimized for
special applications and the demand for these materials has led to extensive research
during the past three decades [1-4]. One of the most used piezoceramics in these types
of composites is lead zirconate titanate Pb(Zr1-xTix)O3 (PZT) which is a typical
piezoelectric material having the perovskite crystal structure. PZT shows excellent
electromechanical piezoelectric properties at the morphotropic phase boundary due to
the coexistence of the tetragonal and rhombohedral phases and its properties are
influenced by the variation in composition [5].
The types and number of phases, composition, and connectivity of the individual
phases determine the properties of the composites. Newnham et al. [6] introduced the
concept of 0-3 connectivity (a three dimensionally-connected polymer matrix filled with
ceramic particles) for the classification of composites. Polymer composites with 0-3
connectivity have several advantages over other types of composites: their ease of
production, their ability for the properties to be tailored by varying the volume fraction
of the ceramic inclusions and the ease of obtaining different sizes and shapes.
Recently, a number of articles were published on 0-3 composites showing an
increased demand on this type of composites [7-10]. The recently developed PZT/ liquid
crystalline thermotropic (LCT) [11] composites by van den Ende et al. [12] showed
excellent high temperature stability. However, although these composites are more
flexible than PZT ceramics, they are rather brittle, limiting their potential applications.
To overcome this limitation and be able to realize fairly flexible composites with high
permittivity and piezoelectric charge constant, we developed a new series of 0-3
piezoelectric composites (PZT/LCT/PA) by incorporating PZT5A4 into a matrix of LCT
and polyamide (PA11).
In this chapter we report on the processing and characterization of these new 0-3
piezoelectric composites. Hot-pressing was utilized for the fabrication and the effect of
the volume fraction of PZT on the composite properties was studied. For comparison
also PZT/PA composites were studied. A comparison of the experimental results for
relative permittivity εr, piezoelectric charge constant d33, piezoelectric voltage coefficient
g33 obtained for these composites with several theoretical models were made.
28
2.2. Experimental
2.2.1. Materials
The PZT powder used in this research is a half-product of the commercial PZT ceramic
PZT5A4 (Morgan Electro Ceramics, Ruabon UK), a soft PZT with 1 mol% Nb added as
dopant. The LCT polymer used are phenylethynyl end-capped oligomers based on 6-
hydroxy-2-naphthoic acid (HNA) and 4-hydroxybenzoic acid (HBA) (Mn = 9000 g mol-1,
HBA/HNA ratio of 73/27), obtained from TU Delft. The amide was PA11, obtained from
Aldrich Chemical Company (Tg = 46 C, Tm = 198 C). The PZT powder was calcined at
different temperatures (Table 1) with a heating rate of 3 °C/min and a 60 minute hold at
the required temperature and cooling to room temperature with a temperature ramp of
3 °C/min. Per calcination temperature 20 gram PZT powder was used in an alumina
crucible covered with an alumina lid.
2.2.2. Fabrication of composites
Two types of composites were fabricated. PZT/PA composites were made in order to
optimize the calcination temperature and to correlate the theoretical results with
PZT/LCT/PA composites. PZT/LCT/PA composites were made with the optimized PZT.
Temperatures in the range of 800 to 1300 °C were utilized for optimization.
In order to optimize the calcination temperature, PZT/PA composites were
fabricated with 40 volume percent calcined PZT at different temperatures and 60
volume percent PA11. For the correlation of the results with PZT/LCT/PA composites,
PZT/PA composites were fabricated with five different volume percent of PZT. The
raw materials were initially mixed by hand with a spatula at room temperature and
further ball milled for 60 minutes at 800 rpm. Composites with specific dimensions of 14
mm in diameter and 280-300 µm thickness were fabricated by hot-pressing with an
applied force of 90 kN.
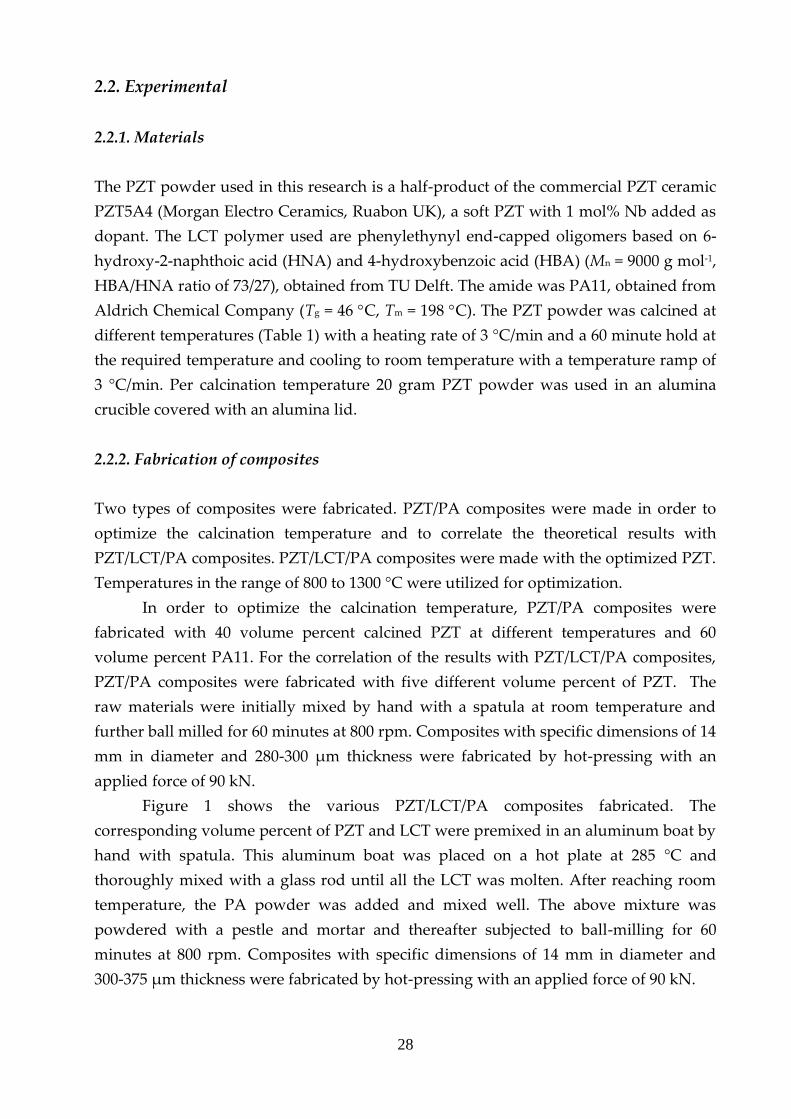
Figure 1 shows the various PZT/LCT/PA composites fabricated. The
corresponding volume percent of PZT and LCT were premixed in an aluminum boat by
hand with spatula. This aluminum boat was placed on a hot plate at 285 °C and
thoroughly mixed with a glass rod until all the LCT was molten. After reaching room
temperature, the PA powder was added and mixed well. The above mixture was
powdered with a pestle and mortar and thereafter subjected to ball-milling for 60
minutes at 800 rpm. Composites with specific dimensions of 14 mm in diameter and
300-375 µm thickness were fabricated by hot-pressing with an applied force of 90 kN.
29
The LCT was allowed to melt at 280 °C for 30 min and after that the temperature
was increased to 320 °C and kept at that temperature for 30 min for curing the LCT.
Circular gold electrodes of thickness 300 nm and an area of 7.85x10⁻⁵ m2 are sputtered on
both sides of the composites using an Edwards sputter coater (model S150B). The
poling of the electroded sample is performed by applying an electric field of 60 kV/cm
with a Heinziger 10 kV high voltage generator for 30 min at 100 °C (PZT/PA) and 120
°C (PZT/LCT/PA) in a silicone oil bath to ensure uniform heating. The electric field was
kept on while cooling to room temperature.
1 2 3 4 5 60
20
40
60
80 PZT
LCR
Nylon
Vo
lum
e fr
acti
on
(%
)
Sample
Figure 1. Volume fraction of PZT/LCT/PA composites fabricated with PZT calcined at 1100 °C.
2.2.3. Measurements
The phase identification was done at room temperature with an X-ray diffractometer
(Rigaku) with CuKα radiation of wavelength 0.15418 nm. The diffraction spectra were
recorded in the 2θ range of 10-80° with a step size of 0.01° and a scanning speed of
0.4°/minute. The microstructure of the calcined PZT powder and the composites were
examined by SEM (FEI, Quanta 3D FEG). The particle size of the calcined powders was
determined by light scattering (Beckman Coulter LS230) and also by SEM. The aspect
ratio of the particles was estimated by Image J software [15] on the SEM pictures of the
calcined and milled powder.
In order to calculate the ac conductivity , relative permittivity r and the loss
tangent tan of the composites, impedance data were collected by an impedance
analyzer (EG&G Princeton Applied Research, Model 1025) coupled with a potentiostat
(Potentiostat/Galvanostat, Model 283) at room temperature in a frequency range of 50
Hz – 5 MHz. The dc conductivity (Table 2) is measured as follows. The electrical current
was provided by a source measure unit Keithley 237 while the voltage was measured
30
by an electrometer Keithley 6517A. The piezoelectric charge constant d33 was measured
with a d33 meter (Piezotest, PM300) at a fixed frequency of 110 Hz. The d33 and εr
obtained at 110 Hz is used to calculate piezoelectric voltage coefficient g33 according to
g33 = d33 / εo εr (1)
where d33 is the piezoelectric charge constant in pC/N, εo is the permittivity of free space
(8.85x10⁻¹² F/m) and εr is the relative permittivity of the composite. The elastic moduli of
the composites were tested in three-point bending in static mode on a TA Instruments
Q800 series DMA at room temperature. The dimensions of the specimens tested were 20
mm x 10 mm x 2 mm and for each composition two specimens were measured.
2.3. Theory
Various theoretical models have been proposed for the permittivity and piezoelectric
properties of the 0-3 composites. Some of the mostly used analytic expressions are
briefly discussed here. For a brief review we refer to [20] while [24] provides an
extensive discussion.
One of the first, if not the first, model for understanding the dielectric behavior of
composites, still widely used, was given in 1904 by Maxwell Garnett [24]. In his model
spherical inclusions are embedded in a polymer matrix without any kind of interaction
resulting in
ε = εp {1+[ 3φc (εc – εp/εc + 2εc)] / [1 – φc (εc – εp/εc + 2εc)]} (2)
where φc is the volume fraction of the inclusions and ε, εc and εp are the relative
permittivity of the composite, ceramic particles and matrix, respectively. Lichtenecker
provided in 1923 a rule of mixtures, also still widely used, that reads
cc 1
pc
(3)
Although initially largely empirical, in 1998 Zakri et al. [26] provided a theoretical
underpinning of this rule.
In 1982 Yamada et al. [18] proposed a model to explain the behavior of the
permittivity, piezoelectric constant and elastic constant of a composite in which
ellipsoidal particles are dispersed in a continuous medium aligned along the electric
field. Their model shows excellent agreement with experimental data of PVDF-PZT
composites. Their final equations read
31
)1)((
)(1
cpcp
pcc
p
n
n (4)
ccp Gdd (5)
)13(
1 with
)1)((
)(1
p
p
cpcp
pcc
p
n'
EEn'E
EEEE (6)
where n = 4π/m is the parameter attributed to the shape of the ellipsoidal particles.
Further, α is the poling ratio, G = n / [n + (c)] is the local field coefficient and dc is
the piezoelectric constant of the piezoceramic while d is the piezoelectric constant of the
composite. Finally the elastic modulus E contains, apart from the above mentioned
quantities, a factor n directly calculated from Poisson’s ratio p of the matrix. The
condition that the particles are considered to be oriented ellipsoids might seem to be a
significant restriction but it has been shown [26] that composites with an arbitrary
distribution of ellipsoids with respect to the electric field direction can be transformed
in to an equivalent composite with ellipsoids aligned along the electric field direction
but with different aspect ratio’s for the ellipsoids. This largely removes the restriction
mentioned, although the interpretation in micro structural terms becomes more
complex. Since their model also provides an expression for the elastic modulus, we
have chosen this model mainly to analyze our experimental results.
Another model relatively simple model for the permittivity was provided by
Jayasundere et al. [21]. The final expression reading
)2)/((3)[12(3
)]2)/((3)][12/([3
pcpcppcpcp
pcpccpcpccpp
/ (7)
is a modification of the expression for a composite dielectric sphere by including
interactions between neighboring spheres. The comparison with experimental data
appeared to be excellent. Hence this model was applied as well.
Many other models resulting in analytical expressions have been
proposed. We mention here only the models by Furukawa et al. [19], Bruggeman et al.
[8], Maxwell-Wagner [22], Bhimasankaram et al. [20] and Wong et al. [27]. Most models
deal only with part of the full piezoelectric problem and only partially combined
solutions were given. E.g. based on the Bruggeman method [29, 30], taking permittivity
and conductivity into account, or based on the Marutake method [31], taking
32
permittivity piezoelectric coefficients and elastic compliance into account. The latter
already requires numerical solution. Recently complete numerical solutions to the fully
coupled piezoelectric equations for ellipsoidal inclusions of the same orientation have
been provided [28] predicting giant piezoelectric and dielectric enhancement. No
experimental evidence for this effect was presented though while a significant
conductivity is required rendering the options for practical applications probably less
useful.
2. 4. Results and discussion
2.4.1. Optimization of PZT
X-ray diffraction
The XRD patterns of PZT5A4 powder before and after calcination at different
temperatures (800 to 1300 °C) are shown in figure 2. The X-ray diffraction pattern of the
PZT5A4 before calcination shows the coexistence of both rhombohedral (200)R and
tetragonal phases [(002)T, (200)T] together with the presence of a pyrochlore phase.
Calcination resulted in the disappearance of the rhombohedral perovskite structure and
in the formation of peak splitting, indicating an increase of tetragonal distortion. The
phenomenon of peak splitting and peaks shifting to higher angle with increasing
calcination temperature was also reported in previous studies [13, 14].
As the calcination temperature increases, the intensity of the pyrochlore phase
peaks decrease while the intensity of the tetragonal perovskite peaks increase. This
indicates the transformation to almost single phase tetragonal PZT. The PZT calcined at
1100 °C shows a maximum intensity of the tetragonal perovskite peaks at (200)T and
(211)T which indicates that at this temperature the material has become (XRD) single
phase. From 1150 °C onwards, the peak height decreases as a result of lead loss and also
the 2:1 ratio becomes more like 1:1. Zhang et al. reported that the shrinkage of the lattice
is believed to result from loss of lead that creates some vacancies in the PZT lattice [14].
The optimal calcination temperature was found to be 1100 °C and PZT5A4 calcined at
this temperature was used for composite fabrication.
33
10 20 30 40 50 600
1000
2000
3000
4000
5000
Pyrochlore
PZT5A4
800
900
1000
1050
1100
1150
1200
1300(210)
(201)
(211)(112)
(111)(110)
(100)(001)
002(T) 200(T)
200(R)
(002)(200)
Inte
nsi
ty (
a.u
)
2 Theta(º)
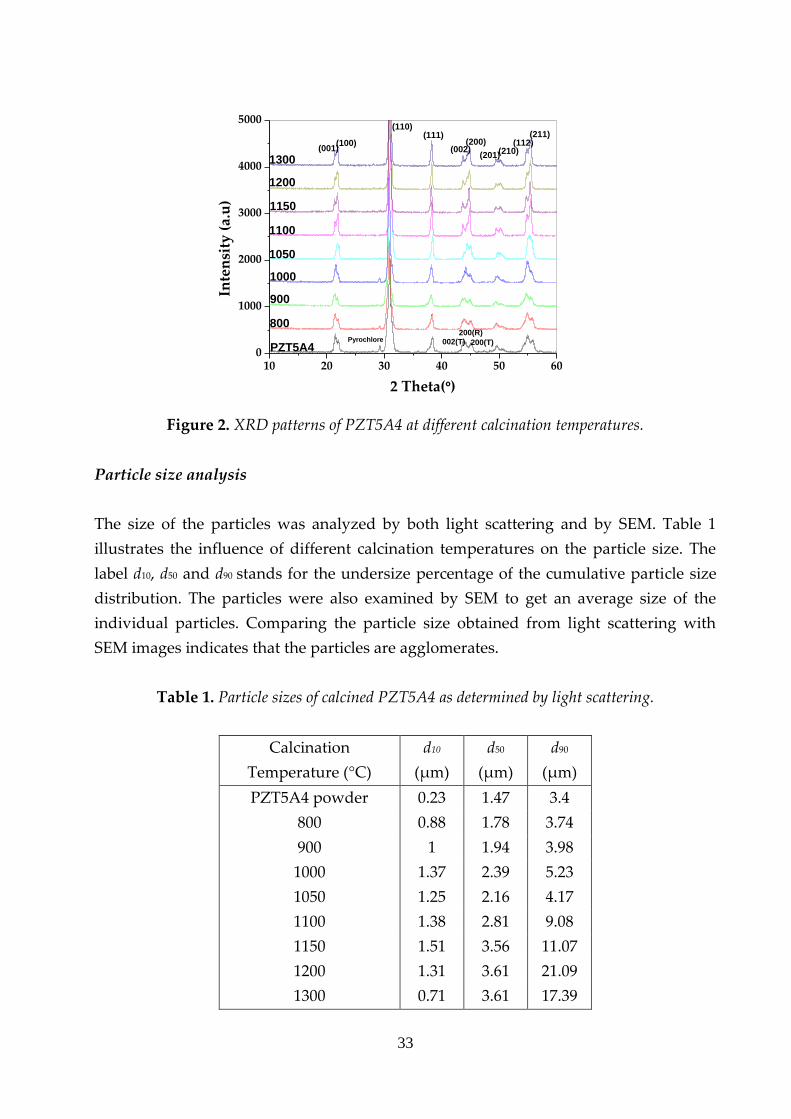
Figure 2. XRD patterns of PZT5A4 at different calcination temperatures.
Particle size analysis
The size of the particles was analyzed by both light scattering and by SEM. Table 1
illustrates the influence of different calcination temperatures on the particle size. The
label d10, d50 and d90 stands for the undersize percentage of the cumulative particle size
distribution. The particles were also examined by SEM to get an average size of the
individual particles. Comparing the particle size obtained from light scattering with
SEM images indicates that the particles are agglomerates.
Table 1. Particle sizes of calcined PZT5A4 as determined by light scattering.
Calcination
Temperature (°C)
d10
(µm)
d50
(µm)
d90
(µm)
PZT5A4 powder 0.23 1.47 3.4
800 0.88 1.78 3.74
900 1 1.94 3.98
1000 1.37 2.39 5.23
1050 1.25 2.16 4.17
1100 1.38 2.81 9.08
1150 1.51 3.56 11.07
1200 1.31 3.61 21.09
1300 0.71 3.61 17.39

34
Figure 3. SEM micrographs of the PZT5A4 calcined at different temperatures.
Figure 3 shows the SEM micrographs of the calcined PZT5A4 at different
temperatures. From these micrographs it is observed that, as the calcination
temperature increases, the grain size gradually increases, which implies that the
particles sinter together during the calcination process. The approximate primary
particle size in PZT5A4 calcined at 1000 °C is less than 600 nm, at 1100 °C the average
size is about 1.0 µm and as the calcination temperature reaches to 1200 °C, the size of
the primary particles becomes 2 to 2.5 µm. The aspect ratio of the particles was
estimated by Image J software [15] on the SEM pictures of the calcined and milled
powder. The number of particles per agglomerate can be estimated as about (d50/dSEM)3.
For 1100 °C this yields (2.8/1.0)3 22 primary particles which appears to be not an
unreasonable number.
1000°C 1100 °C
1200 °C 1150°C
35
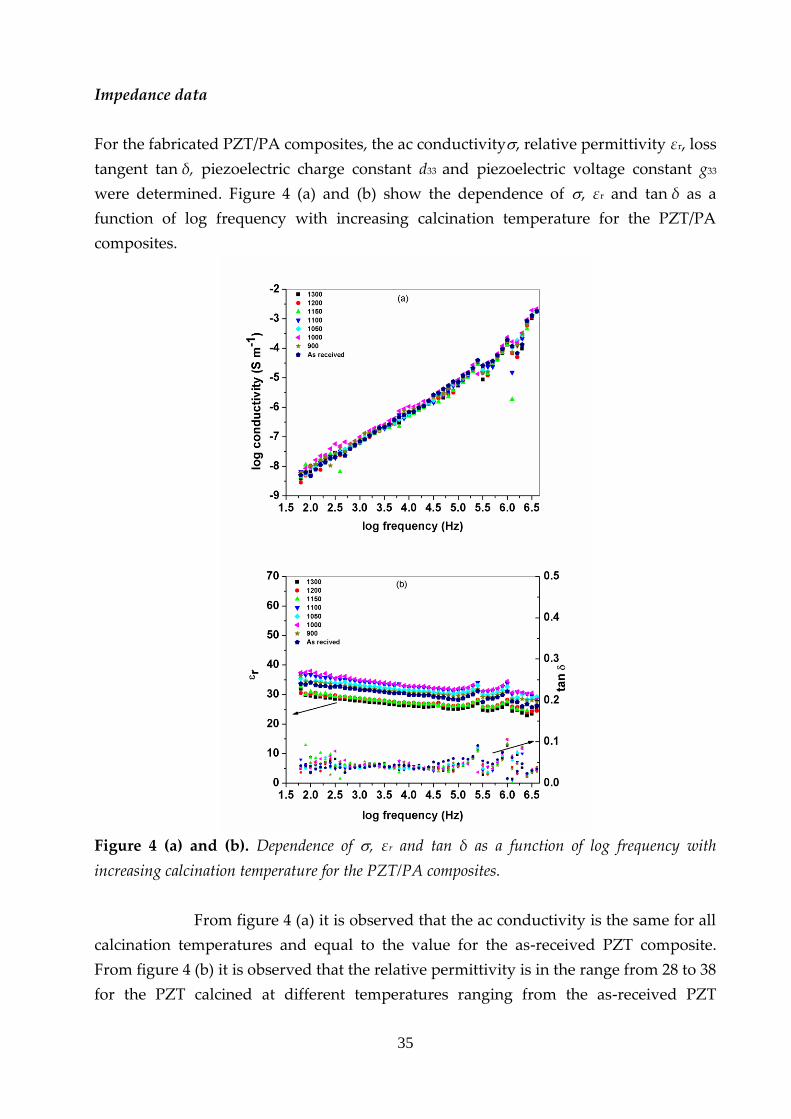
Impedance data
For the fabricated PZT/PA composites, the ac conductivity, relative permittivity εr, loss
tangent tan δ, piezoelectric charge constant d33 and piezoelectric voltage constant g33
were determined. Figure 4 (a) and (b) show the dependence of , εr and tan δ as a
function of log frequency with increasing calcination temperature for the PZT/PA
composites.
Figure 4 (a) and (b). Dependence of , εr and tan δ as a function of log frequency with
increasing calcination temperature for the PZT/PA composites.
From figure 4 (a) it is observed that the ac conductivity is the same for all
calcination temperatures and equal to the value for the as-received PZT composite.
From figure 4 (b) it is observed that the relative permittivity is in the range from 28 to 38
for the PZT calcined at different temperatures ranging from the as-received PZT
36
powder to the one calcined at 1300 °C. The maximum relative permittivity is observed
at 1000 °C and 1100 °C. From 1200 °C, a small decrease in εr is observed which may be
due to the loss of lead from PZT. The tan δ has a weak dependence on calcination
temperature and is about 0.02 to 0.06 neglecting scattered points.
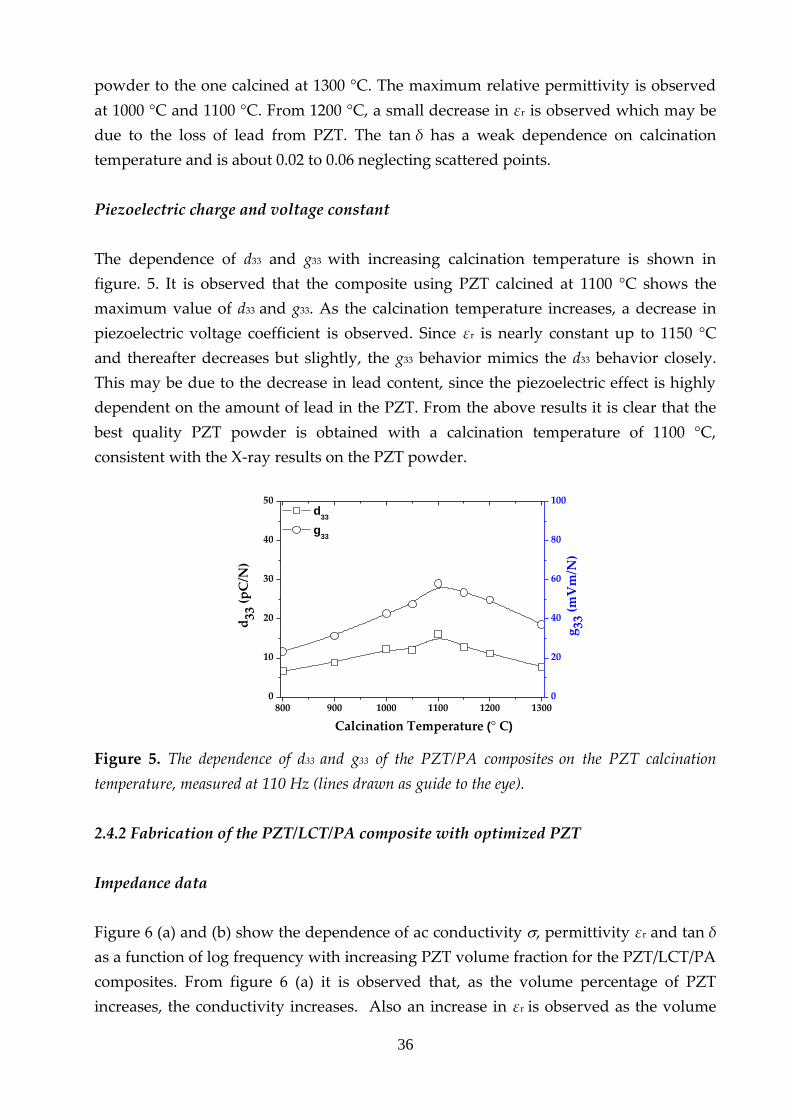
Piezoelectric charge and voltage constant
The dependence of d33 and g33 with increasing calcination temperature is shown in
figure. 5. It is observed that the composite using PZT calcined at 1100 °C shows the
maximum value of d33 and g33. As the calcination temperature increases, a decrease in
piezoelectric voltage coefficient is observed. Since εr is nearly constant up to 1150 °C
and thereafter decreases but slightly, the g33 behavior mimics the d33 behavior closely.
This may be due to the decrease in lead content, since the piezoelectric effect is highly
dependent on the amount of lead in the PZT. From the above results it is clear that the
best quality PZT powder is obtained with a calcination temperature of 1100 °C,
consistent with the X-ray results on the PZT powder.
800 900 1000 1100 1200 13000
10
20
30
40
50
Calcination Temperature (° C)
d33
(p
C/N
)
d33
g33
0
20
40
60
80
100
g33
(m
Vm
/N)
Figure 5. The dependence of d33 and g33 of the PZT/PA composites on the PZT calcination
temperature, measured at 110 Hz (lines drawn as guide to the eye).
2.4.2 Fabrication of the PZT/LCT/PA composite with optimized PZT
Impedance data
Figure 6 (a) and (b) show the dependence of ac conductivity , permittivity εr and tan δ
as a function of log frequency with increasing PZT volume fraction for the PZT/LCT/PA
composites. From figure 6 (a) it is observed that, as the volume percentage of PZT
increases, the conductivity increases. Also an increase in εr is observed as the volume
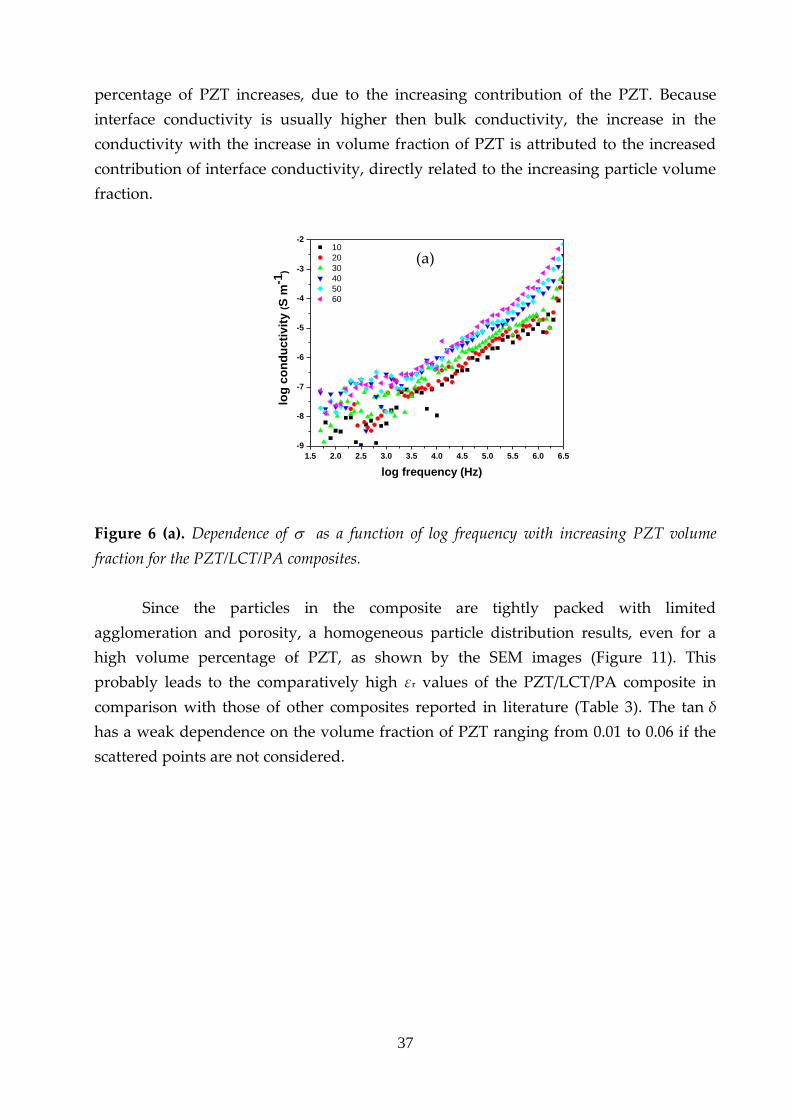
37
percentage of PZT increases, due to the increasing contribution of the PZT. Because
interface conductivity is usually higher then bulk conductivity, the increase in the
conductivity with the increase in volume fraction of PZT is attributed to the increased
contribution of interface conductivity, directly related to the increasing particle volume
fraction.
1.5 2.0 2.5 3.0 3.5 4.0 4.5 5.0 5.5 6.0 6.5
-9
-8
-7
-6
-5
-4
-3
-2 10
20
30
40
50
60
log
co
nd
ucti
vit
y (S
m-1
)
log frequency (Hz)
Figure 6 (a). Dependence of as a function of log frequency with increasing PZT volume
fraction for the PZT/LCT/PA composites.
Since the particles in the composite are tightly packed with limited
agglomeration and porosity, a homogeneous particle distribution results, even for a
high volume percentage of PZT, as shown by the SEM images (Figure 11). This
probably leads to the comparatively high εr values of the PZT/LCT/PA composite in
comparison with those of other composites reported in literature (Table 3). The tan δ
has a weak dependence on the volume fraction of PZT ranging from 0.01 to 0.06 if the
scattered points are not considered.
(a)
38
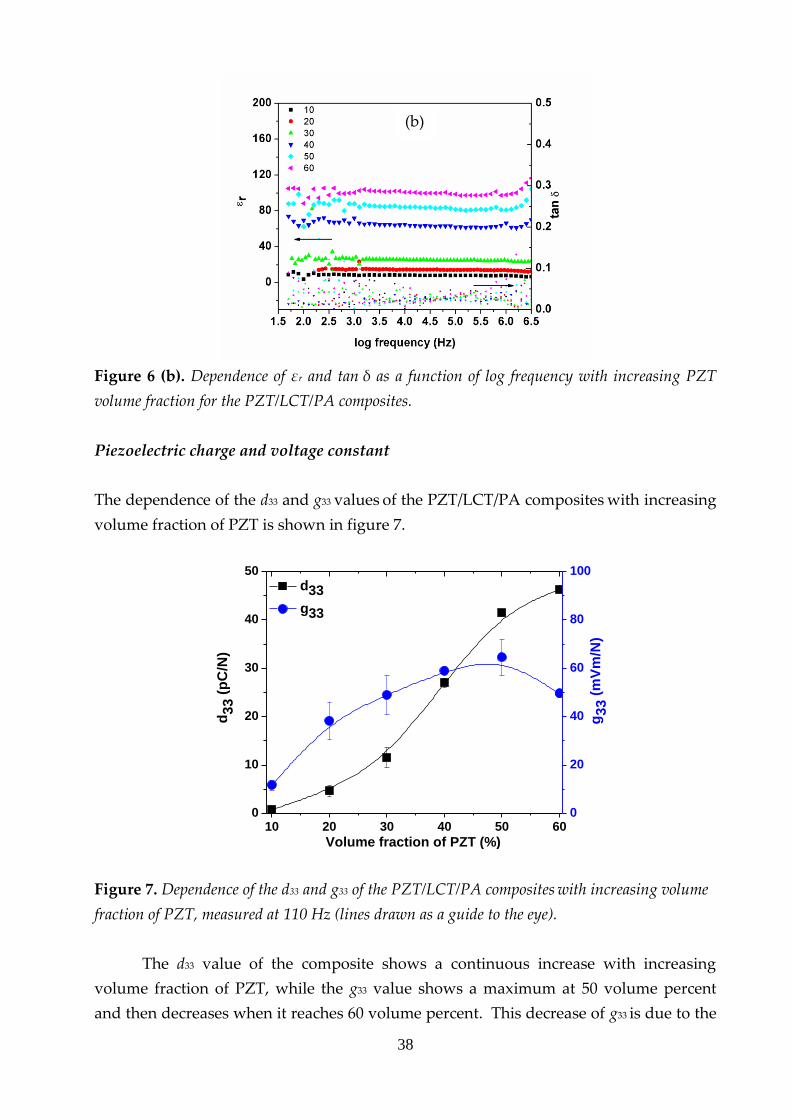
Figure 6 (b). Dependence of εr and tan δ as a function of log frequency with increasing PZT
volume fraction for the PZT/LCT/PA composites.
Piezoelectric charge and voltage constant
The dependence of the d33 and g33 values of the PZT/LCT/PA composites with increasing
volume fraction of PZT is shown in figure 7.
10 20 30 40 50 600
10
20
30
40
50
Volume fraction of PZT (%)
d3
3 (
pC
/N)
d33
g33
0
20
40
60
80
100
g
33
(m
Vm
/N)
Figure 7. Dependence of the d33 and g33 of the PZT/LCT/PA composites with increasing volume
fraction of PZT, measured at 110 Hz (lines drawn as a guide to the eye).
The d33 value of the composite shows a continuous increase with increasing
volume fraction of PZT, while the g33 value shows a maximum at 50 volume percent
and then decreases when it reaches 60 volume percent. This decrease of g33 is due to the
(b)
39
behavior of d33 relative to εr. A maximum value for d33 of 46 pC/N is observed for the 60
volume percent PZT while for g33 a maximum value of 65 mVm/N is obtained, both for
the 50 volume percent PZT composite.
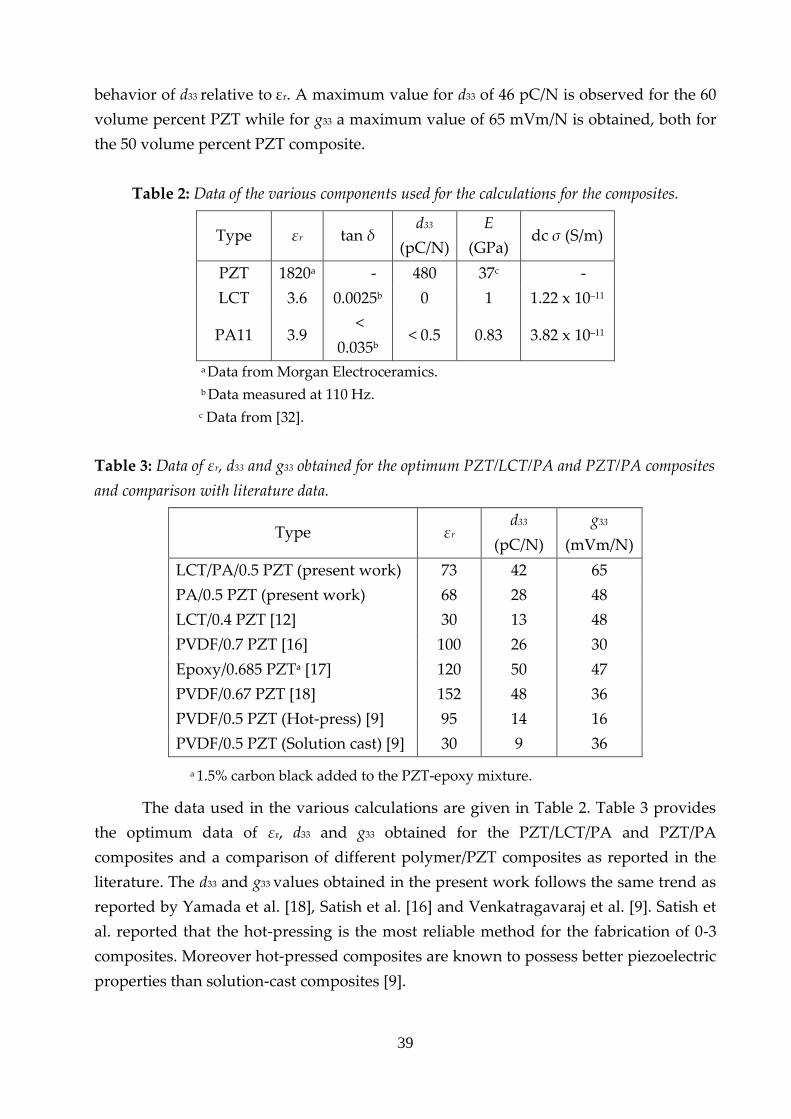
Table 2: Data of the various components used for the calculations for the composites.
Type εr tan δ d33
(pC/N)
E
(GPa) dc σ (S/m)
PZT 1820a - 480 37c -
LCT 3.6 0.0025b 0 1 1.22 x 10⁻¹¹
PA11 3.9 <
0.035b < 0.5 0.83 3.82 x 10⁻¹¹
a Data from Morgan Electroceramics.
b Data measured at 110 Hz.
c Data from [32].
Table 3: Data of εr, d33 and g33 obtained for the optimum PZT/LCT/PA and PZT/PA composites
and comparison with literature data.
Type εr d33
(pC/N)
g33
(mVm/N)
LCT/PA/0.5 PZT (present work) 73 42 65
PA/0.5 PZT (present work) 68 28 48
LCT/0.4 PZT [12] 30 13 48
PVDF/0.7 PZT [16] 100 26 30
Epoxy/0.685 PZTa [17] 120 50 47
PVDF/0.67 PZT [18] 152 48 36
PVDF/0.5 PZT (Hot-press) [9] 95 14 16
PVDF/0.5 PZT (Solution cast) [9] 30 9 36
a 1.5% carbon black added to the PZT-epoxy mixture.
The data used in the various calculations are given in Table 2. Table 3 provides
the optimum data of εr, d33 and g33 obtained for the PZT/LCT/PA and PZT/PA
composites and a comparison of different polymer/PZT composites as reported in the
literature. The d33 and g33 values obtained in the present work follows the same trend as
reported by Yamada et al. [18], Satish et al. [16] and Venkatragavaraj et al. [9]. Satish et
al. reported that the hot-pressing is the most reliable method for the fabrication of 0-3
composites. Moreover hot-pressed composites are known to possess better piezoelectric
properties than solution-cast composites [9].

40
Comparison with theoretical models
0 10 20 30 40 50 600
20
40
60
80
100
120
140
160
r
Volume fraction of PZT (%)
Jayasundere
Yamada
Lichtenecker
PZT/LCT/PA
0 10 20 30 40 50 600
20
40
60
80
100
120
140
160
r
Volume fraction of PZT (%)
Jayasudere
Yamada
Lichtenecker
PZT/PA
Figure 8. The relative permittivity values of the PZT/LCT/PA and PZT/PA composites as
compared to 3 models for 0-3 composites.
In figures 8-10 the experimental data of the PZT/LCT/PA and PZT/PA
composites is compared to several models for 0-3 composites, both for dielectric and
piezoelectric constants. It is observed that both the composites follow the same trend. In
the PZT/LCT/PA, the relative permittivity of the matrix phase was taken to be the
combined relative permittivity of the LCT and PA11 phases and was calculated by
Lichtenecker’s rule of mixtures [23] given by equation 3. The relative permittivity’s of
virgin LCT and PA11 materials were found to be 3.6 and 3.9, respectively, and the

41
relative permittivity of the ceramic phase was taken to εr = 1820 (data Morgan
electroceramics, UK). The relative permittivity of the PZT/LCT/PA composite was
calculated using Lichtenecker’s formula and 2 models for high filler content 0-3
composites, namely Yamada’s model [18] and Jayasundere’s model [21].
The fit of the equation to the data points of the composites for both these models
is plotted in figure 8. Both Yamada’s and Jayasundere’s model underestimate the
permittivity of the composites, while Lichtenecker’s mixing rule correlates well with the
measured values up to 50 volume percent PZT for the PZT/LCT/PA composites. The
dielectric behavior therefore, seems to satisfy the logarithmic mixing rule for the
PZT/LCT/PA composites. The discrepancy at 60 volume percent is probably due to the
fact that at this volume fraction processing becomes much more difficult.
The strong increase in relative permittivity with the increase in PZT volume
fraction indicates good coupling of the PZT phase with the polymer phases up to high
volume percentages. In both composites the discrepancy between the experimental data
and theoretical models is higher at higher volume fraction. Two effects probably play a
role here. According to theory the dielectric constant increases with increasing
ellipticity of the particles [18, 24, 25]. Moreover, at higher volume fraction the
composites, no more act as 0-3 but as 1-3 composites and this is another reason for the
high relative permittivity.
0 10 20 30 40 50 600
10
20
30
40
50
60
Volume fraction of PZT (%)
d3
3(p
C/N
)
Yamada
PZT/LCT/PA
PZT/PA
Figure 9. The d33 values of PZT/LCT/PA and PZT/PA composites as compared to Yamada’s
model for piezoelectric composites.
In figure 9 the d33 values are calculated using Yamada’s model [18] for high PZT
content composites with the d33 of the ceramic phase taken to be d33 = 480 pC/N (data
Morgan electroceramics, UK). This model was originally developed for PZT/PVDF
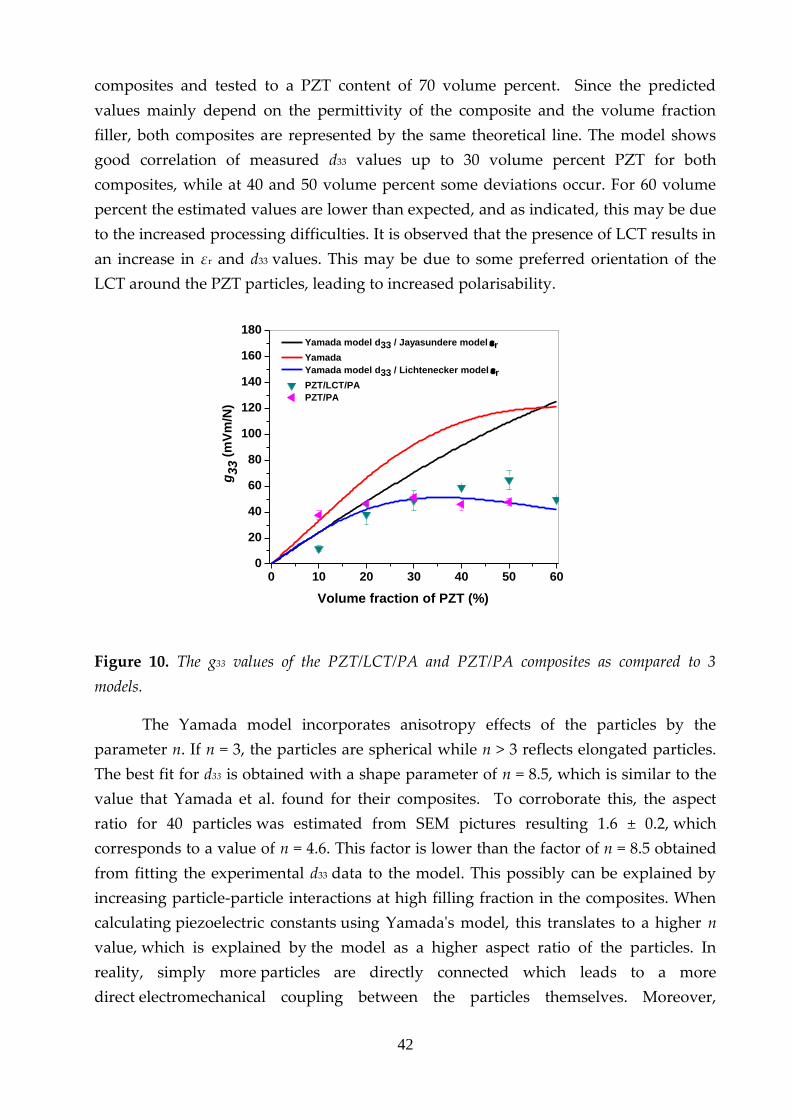
42
composites and tested to a PZT content of 70 volume percent. Since the predicted
values mainly depend on the permittivity of the composite and the volume fraction
filler, both composites are represented by the same theoretical line. The model shows
good correlation of measured d33 values up to 30 volume percent PZT for both
composites, while at 40 and 50 volume percent some deviations occur. For 60 volume
percent the estimated values are lower than expected, and as indicated, this may be due
to the increased processing difficulties. It is observed that the presence of LCT results in
an increase in εr and d33 values. This may be due to some preferred orientation of the
LCT around the PZT particles, leading to increased polarisability.
0 10 20 30 40 50 600
20
40
60
80
100
120
140
160
180
Volume fraction of PZT (%)
g33 (
mV
m/N
)
Yamada model d33 / Jayasundere modelr
Yamada
Yamada model d33 / Lichtenecker modelr
PZT/LCT/PA
PZT/PA
Figure 10. The g33 values of the PZT/LCT/PA and PZT/PA composites as compared to 3
models.
The Yamada model incorporates anisotropy effects of the particles by the
parameter n. If n = 3, the particles are spherical while n > 3 reflects elongated particles.
The best fit for d33 is obtained with a shape parameter of n = 8.5, which is similar to the
value that Yamada et al. found for their composites. To corroborate this, the aspect
ratio for 40 particles was estimated from SEM pictures resulting 1.6 ± 0.2, which
corresponds to a value of n = 4.6. This factor is lower than the factor of n = 8.5 obtained
from fitting the experimental d33 data to the model. This possibly can be explained by
increasing particle-particle interactions at high filling fraction in the composites. When
calculating piezoelectric constants using Yamada's model, this translates to a higher n
value, which is explained by the model as a higher aspect ratio of the particles. In
reality, simply more particles are directly connected which leads to a more
direct electromechanical coupling between the particles themselves. Moreover,
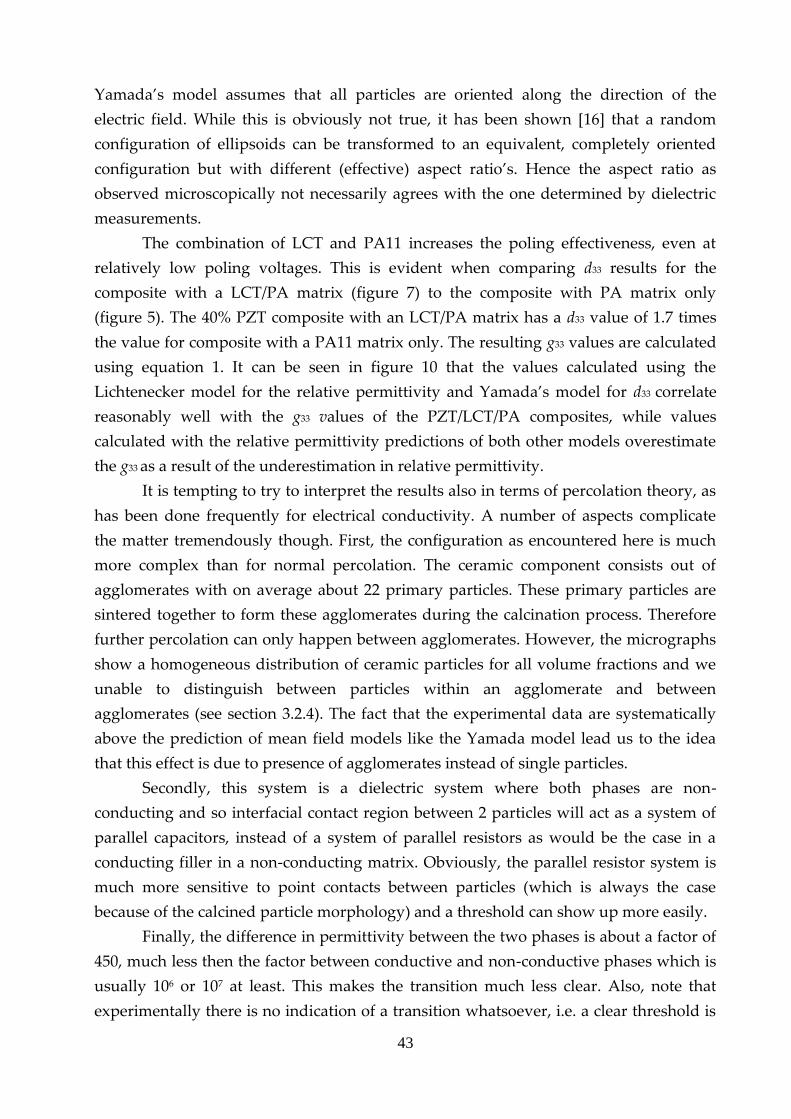
43
Yamada’s model assumes that all particles are oriented along the direction of the
electric field. While this is obviously not true, it has been shown [16] that a random
configuration of ellipsoids can be transformed to an equivalent, completely oriented
configuration but with different (effective) aspect ratio’s. Hence the aspect ratio as
observed microscopically not necessarily agrees with the one determined by dielectric
measurements.
The combination of LCT and PA11 increases the poling effectiveness, even at
relatively low poling voltages. This is evident when comparing d33 results for the
composite with a LCT/PA matrix (figure 7) to the composite with PA matrix only
(figure 5). The 40% PZT composite with an LCT/PA matrix has a d33 value of 1.7 times
the value for composite with a PA11 matrix only. The resulting g33 values are calculated
using equation 1. It can be seen in figure 10 that the values calculated using the
Lichtenecker model for the relative permittivity and Yamada’s model for d33 correlate
reasonably well with the g33 values of the PZT/LCT/PA composites, while values
calculated with the relative permittivity predictions of both other models overestimate
the g33 as a result of the underestimation in relative permittivity.
It is tempting to try to interpret the results also in terms of percolation theory, as
has been done frequently for electrical conductivity. A number of aspects complicate
the matter tremendously though. First, the configuration as encountered here is much
more complex than for normal percolation. The ceramic component consists out of
agglomerates with on average about 22 primary particles. These primary particles are
sintered together to form these agglomerates during the calcination process. Therefore
further percolation can only happen between agglomerates. However, the micrographs
show a homogeneous distribution of ceramic particles for all volume fractions and we
unable to distinguish between particles within an agglomerate and between
agglomerates (see section 3.2.4). The fact that the experimental data are systematically
above the prediction of mean field models like the Yamada model lead us to the idea
that this effect is due to presence of agglomerates instead of single particles.
Secondly, this system is a dielectric system where both phases are non-
conducting and so interfacial contact region between 2 particles will act as a system of
parallel capacitors, instead of a system of parallel resistors as would be the case in a
conducting filler in a non-conducting matrix. Obviously, the parallel resistor system is
much more sensitive to point contacts between particles (which is always the case
because of the calcined particle morphology) and a threshold can show up more easily.
Finally, the difference in permittivity between the two phases is about a factor of
450, much less then the factor between conductive and non-conductive phases which is
usually 106 or 107 at least. This makes the transition much less clear. Also, note that
experimentally there is no indication of a transition whatsoever, i.e. a clear threshold is

44
not observed, which makes it difficult to assess whether one is above or below the
percolation threshold. A similar observation has been noticed before [33]. Estimating
the critical exponents could help but the spacing of the experimental points renders
such an analysis useless here.
SEM Morphology
Figure 11. SEM surface morphology of the PZT/LCT/PA composites with 20, 30, 40, 50 and 60
volume percent of PZT. The bright colour represents the PZT and the dark background the
polymer.
20 vol %
PZT 30 vol %
PZT
40 vol %
PZT
50 vol %
PZT
60 vol %
PZT
60 vol % PZT – detailed view
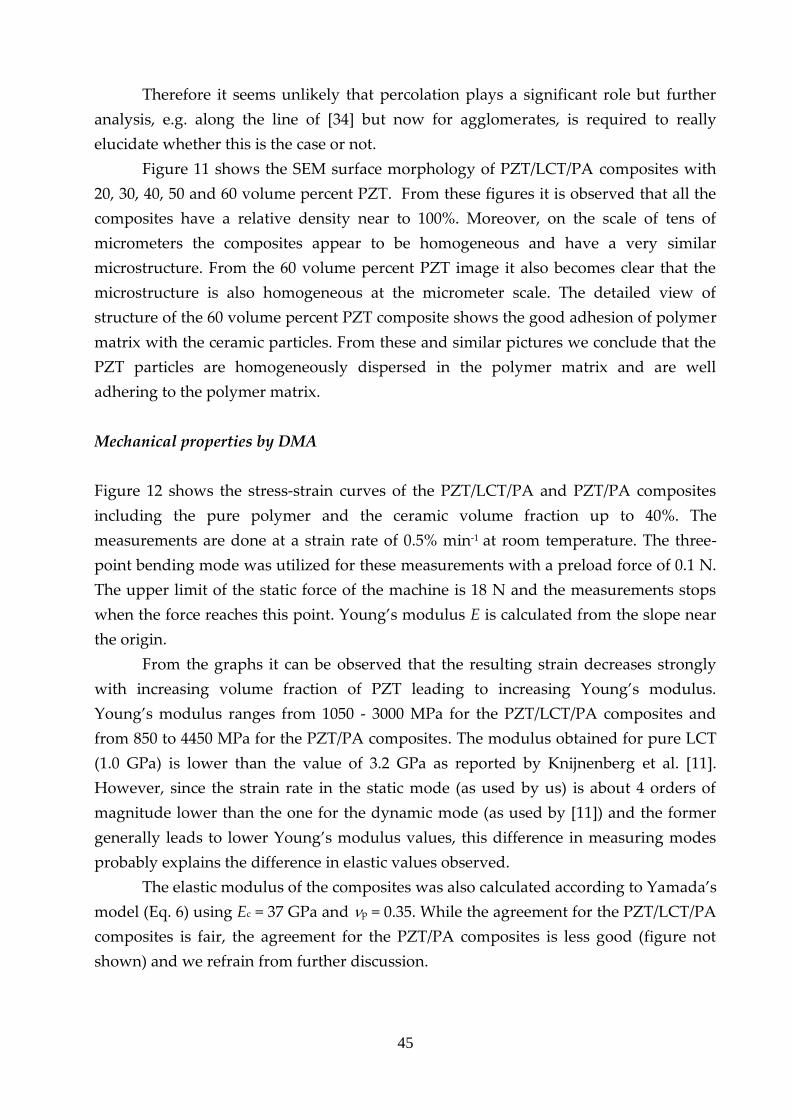
45
Therefore it seems unlikely that percolation plays a significant role but further
analysis, e.g. along the line of [34] but now for agglomerates, is required to really
elucidate whether this is the case or not.
Figure 11 shows the SEM surface morphology of PZT/LCT/PA composites with
20, 30, 40, 50 and 60 volume percent PZT. From these figures it is observed that all the
composites have a relative density near to 100%. Moreover, on the scale of tens of
micrometers the composites appear to be homogeneous and have a very similar
microstructure. From the 60 volume percent PZT image it also becomes clear that the
microstructure is also homogeneous at the micrometer scale. The detailed view of
structure of the 60 volume percent PZT composite shows the good adhesion of polymer
matrix with the ceramic particles. From these and similar pictures we conclude that the
PZT particles are homogeneously dispersed in the polymer matrix and are well
adhering to the polymer matrix.
Mechanical properties by DMA
Figure 12 shows the stress-strain curves of the PZT/LCT/PA and PZT/PA composites
including the pure polymer and the ceramic volume fraction up to 40%. The
measurements are done at a strain rate of 0.5% min-1 at room temperature. The three-
point bending mode was utilized for these measurements with a preload force of 0.1 N.
The upper limit of the static force of the machine is 18 N and the measurements stops
when the force reaches this point. Young’s modulus E is calculated from the slope near
the origin.
From the graphs it can be observed that the resulting strain decreases strongly
with increasing volume fraction of PZT leading to increasing Young’s modulus.
Young’s modulus ranges from 1050 - 3000 MPa for the PZT/LCT/PA composites and
from 850 to 4450 MPa for the PZT/PA composites. The modulus obtained for pure LCT
(1.0 GPa) is lower than the value of 3.2 GPa as reported by Knijnenberg et al. [11].
However, since the strain rate in the static mode (as used by us) is about 4 orders of
magnitude lower than the one for the dynamic mode (as used by [11]) and the former
generally leads to lower Young’s modulus values, this difference in measuring modes
probably explains the difference in elastic values observed.
The elastic modulus of the composites was also calculated according to Yamada’s
model (Eq. 6) using Ec = 37 GPa and p = 0.35. While the agreement for the PZT/LCT/PA
composites is fair, the agreement for the PZT/PA composites is less good (figure not
shown) and we refrain from further discussion.
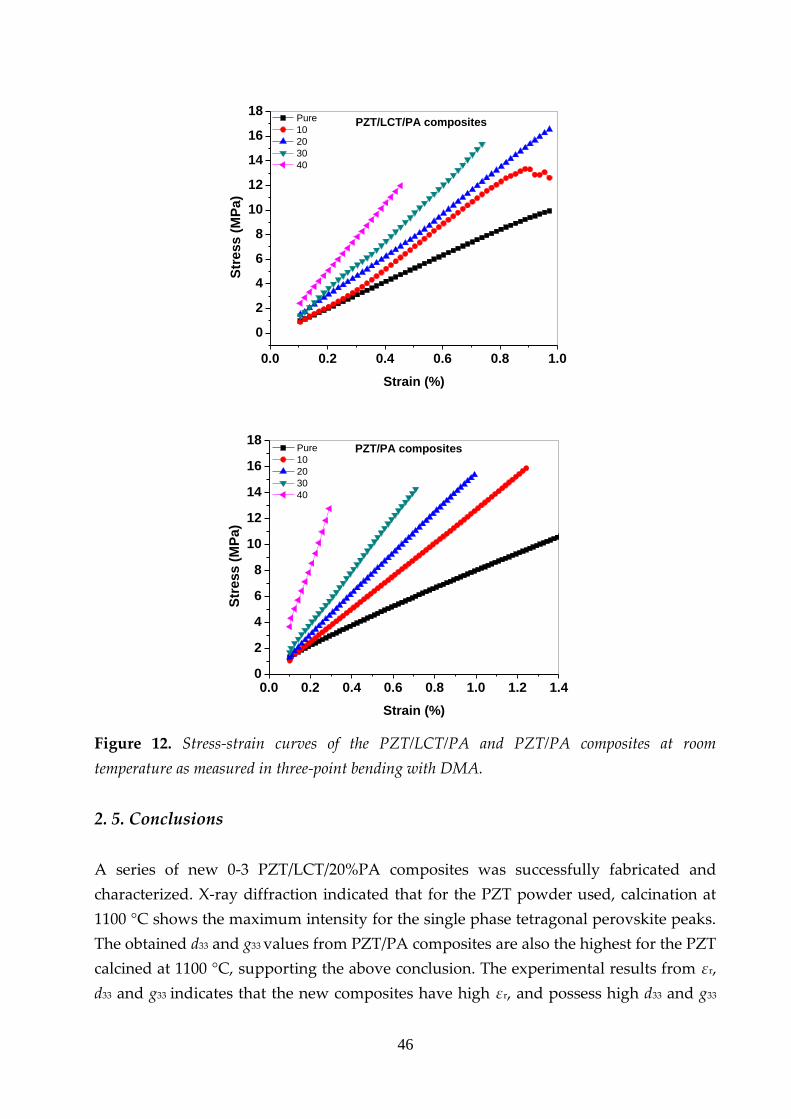
46
0.0 0.2 0.4 0.6 0.8 1.0
0
2
4
6
8
10
12
14
16
18
Str
ess (
MP
a)
Strain (%)
Pure
10
20
30
40
PZT/LCT/PA composites
0.0 0.2 0.4 0.6 0.8 1.0 1.2 1.40
2
4
6
8
10
12
14
16
18
Str
ess (
MP
a)
Strain (%)
Pure
10
20
30
40
PZT/PA composites
Figure 12. Stress-strain curves of the PZT/LCT/PA and PZT/PA composites at room
temperature as measured in three-point bending with DMA.
2. 5. Conclusions
A series of new 0-3 PZT/LCT/20%PA composites was successfully fabricated and
characterized. X-ray diffraction indicated that for the PZT powder used, calcination at
1100 °C shows the maximum intensity for the single phase tetragonal perovskite peaks.
The obtained d33 and g33 values from PZT/PA composites are also the highest for the PZT
calcined at 1100 °C, supporting the above conclusion. The experimental results from εr,
d33 and g33 indicates that the new composites have high εr, and possess high d33 and g33
47
values (50 volume percent PZT) of about 42 pC/N and 65 mVm/N. These results
compare favourably and show the highest g33 value in comparison with other reported
data in the literature. The experimental data for εr agree quite well with the
Lichtenecker model for PZT volume fraction up to 50%, while the Yamada and
Jayasundere model underestimate the experimental data. The experimental data for the
piezoelectric constants agree well with the Yamada model, suggesting an elongated
particle shape and confirmed by independent image analysis. Moreover, the addition of
PA11 to PZT/LCT composites leads to a lower elastic modulus providing more
flexibility to the materials. From the above observations we conclude that these
composites are suitable candidate for both sensors and may even show possibilities for
actuators.
Acknowledgements
This work was financially supported by the Smartmix funding program (grant
SMVA06071), as part of the program “Smart systems based on integrated Piezo”. The
authors are grateful to Morgan Electro Ceramics (Ruabon, United Kingdom) for
providing the PZT powder used in this research, Prof. Dr. Sybrand van der Zwaag and
Dr. Theo Dingemans (Delft University) for providing the LCT polymer used in this
research and Dr. Pim Groen (TNO, Eindhoven) for the use of their poling set-up.
References
[1] T. Furukawa, K. Ishida and E.Fukada, J. Appl. Phys., 1979, 50, p. 4904-4912.
[2] D.K. Dasgupta and M.J. Abdullah, J. Mat. Sci. Letters, 1988, 7, p. 167-170.
[3] H.L.W. Chan, Y. Chen and C.L. Choy, Trans. Dielectrics and Electrical Insulation, 1996, 3,
p. 800-805.
[4] E.K. Akdogan, M. Allahverdi and A. Safari, Trans. Ultrasonics, Ferroelectrics and Frequency
control, 2005, 52, p. 746-775.
[5] B. Jaffe, W.R. Cook and H. Jaffe, Piezoelectric ceramics, New York, 1971, p. 49-50.
[6] R.E. Newnham, D.P. Skinner and L.E. Cross, Mat. Res. Bull., 1978, 13, p. 525-536.
[7] J. ChoiJ, B. Hahn, J. Ryu, W. Yoon, B. Lee and D. Park, Sensors and Actuators A, 2009, 153
p. 89-95 .
[8] M. Wegener and K. Arlt, J. Phys. D: Appl. Phys., 200, 41, p. 1-6.
[9] E. Venkatragavaraj, B. Satish, P.R. Vinod and M.S. Vijaya, J. Phys. D: Appl. Phys., 2001,
34, p. 487-492.
[10] Y. Bai, Z. Y. Cheng, V. Bharti, H.S. Xu and Q. M. Zhang, Applied Physics Letters, 2000, 76
p. 3804-3806.
48
[11] A. Knijnenberg, E.S. Weiser, T.L. StClair, E. Mendes and T.J. Dingemans, Macromolecules,
2006, 39, p. 6936-6943.
[12] D.A. van den Ende, P de Almeida and S. van der Zwaag, J. Mater. Sci., 2007, 42, p. 6417-
6425.
[13] A.M. Amer, S.A. Ibrahim, R.M. Ramadan and M.S. Ahmed, J. Electroceramics, 2005, 14 p.
273-281.
[14] H. Zhang, A. Uusimaki, S. Leppavuori and P. Karjalainen, J. Appl. Phys., 1994, 76, p.
4294-4300.
[15] Image J: http://rsbweb.nih.gov/ij/ version 1.42 q release 08-06-09, accessed 20-01-10
[16] B. Satish, K. Sridevi and M.S. Vijaya, J. Phys. D: Appl. Phys., 2002, 35, p. 2048–2050.
[17] G. Sa-Gong, A. Safari, S.J. Jang and R.E. Newnham, Ferroelectrics Lett., 1986, 5, p. 131-142.
[18] T. Yamada, T. Udea and T. Kitayama, J. Appl. Phys., 1982, 53, p. 4328-4332.
[19] T. Furukawa, K. Ishida, E. Fukada, J. Appl. Phys., 1979, 50, p. 4904-4912.
[20] S. Firmino Mendes, C.M. Costa, V. Sencadas, J. Serrado Nunes, P. Costa, R. Gregorio jr.,
S. Lanceros-Méndez, J. Appl. Phys. A, 2009, 96, p. 899-908.
[21] N. Jayasundere and B.V. Smith, J. Appl. Phys., 1993, 5, p. 2462-2466.
[22] D. Khastgir and K. Adachi, J. Polymer Science, 1999, 37, p. 3067-3070.
[23] K. Lichtenecker, Physikalische Zeitschrift, 1926, 27, p. 115-158.
[24] A. Sihvola, Electromagnetic mixing formulas and applications, 1999, London, p. 166-167.
[25] R.W. Sillars, J. Inst Electr, 1937, 80, p. 378-394.
[26] T. Zakri, J.P. Laurent and M.J. Vauclin, j. Phys. D: Appl. Phys., 1998, 31, p. 1589-1594.
[27] C.K. Wong, Y. M. Poon, F.G. Shin, J. Appl. Phys., 2001, 90, p. 4690-4700.
[28] A.V. Turik, A.I. Chernobabov, G.S. Radchenko and S.A. Turik, Physics of the Solid State,
2004, 46, p. 2213-2216.
[29] D.A.G. Bruggeman, Ann. Physik, 1935, 24, p. 636-664.
[30] J.A. Reynolds and J.M. Hough, Proc. Phys Soc., 1957, London, B70, p. 769-774.
[31] M. Marutake, J. Phys Soc. Japan, 1956, 11, p. 807-814.
[32] Piezoelectric Materials Data Book, 1996, Ferroperm, Kvistgård, Denmark.
[33] C. Cui, R.H. Baughman, Z. Iqbal, T.R. Kazmar and D.K. Dahlstrom, Synth. Metals, 1997,
85, p. 1391-1392.
[34] J.P. Calame, J. Appl. Phys., 2006, 99, 084101-1 / 084101-11.

49
Chapter 3
Highly flexible piezoelectric 0-3 PZT/PDMS
composites with high filler content*
Flexible piezoelectric composites offer alternative and/or additional solutions to sensor,
actuator and transducer applications. Here high density, highly flexible piezoelectric
composites with 0-3 connectivity using filler volume fractions up to 50 vol. % are
realized by solution casting of dispersions of ferroelectric (Pb(ZrxTi1-x)O3 (PZT) in poly-
dimethylsiloxane (PDMS). Excellent piezoelectric properties (permittivity r up to ~ 40,
piezoelectric charge constant d33 up to 25 pC/N, piezoelectric voltage coefficient g33 up to
75 mV.m/N), electrical properties (conductivity about 1106 S/m at 1000 Hz) and
mechanical properties (storage modulus E up to 10 MPa, loss modulus E less than 0.5
MPa, limited creep and stress relaxation) have been realized. The high flexibility
combined with excellent properties of these composites opens new ways to ‘soft touch’
applications in a variety of transducer and sensor applications.
*This chapter has been submitted for publication as: I. Babu and G. de With, "Highly flexible piezoelectric
0-3 PZT/PDMS composites with high filler content," Composites Science and Technology (2013).

50
51
3.1. Introduction
Piezoelectric composites with 0-3 connectivity are of paramount importance for sensors,
actuators and transducers in a variety of fields. In particular, flexible soft composite
materials relate to transducer and sensor applications for the generation and detection
of underwater acoustic signals (sonar), medical diagnostic systems (e.g. micropumps in
micro- / nano-fluidic devices) and tactile sensors (energy scavenger for aerospace /
automotive / domestic devices or touch-base switches for the consumer market). For
each of the above mentioned applications, a different balance in properties is required.
In many cases the most important requirements are that the composite films should be
flexible and soft in the appropriate thickness range and still possess as good as possible
piezoelectric properties [1-3].
Due to the increasing demands on structural performance for these electronic
devices, there has been extensive research carried out in the design and fabrication of
polymer-matrix composites (PMCs) in recent years [4-7]. Composite materials allow for
optimization of electrical, magnetic and mechanical effects and this resulted in the
emergence of many advanced functional materials. These PMCs offer several
advantages over other types of materials: their ability to be tailored with properties by
varying the volume fraction of the ceramic inclusions and their ease of production
including the option to realize easily different sizes and shapes [8-10].
The most widely used ceramic for such composite materials is (ferroelectric) lead
zirconate titanate (Pb(ZrxTi1-x)O3 or PZT) because of its excellent electromechanical
properties [11, 12]. The properties of PMCs will depend not only on the nature of the
phases but also the connectivity of the ceramic particles and the matrix. For the matrix
of 0-3 composites various polymers are used.
In a previous study, we reported on the processing and characterization of 0-3
lead zirconate titanate / liquid crystalline thermotropic / polyamide (PZT/LCT/PA)
composites [13]. Hot-pressing was utilized for the fabrication and the effect of the
volume fraction of PZT on the piezoelectric and dielectric properties was studied. The
experimental data of permittivity and piezoelectric constants were compared with
several theoretical models (Jayasundere, Yamada and Lichtenecker) for these 0-3
composites. In order to assess the correlation of the experimental data with the
theoretical models, the experimental data obtained from PZT/PA composites were also
included. The matrix used leads to relatively stiff composite materials.
An interesting matrix material choice is poly-(dimethylsiloxane) (PDMS), a
silicon-based elastomer with repeating unit of SiO(CH3)2. Due to its very low glass
transition temperature Tg, PDMS exhibits rubbery behaviour at room temperature.
Properties such as elastic behavior, resistance to high temperatures, resistance to
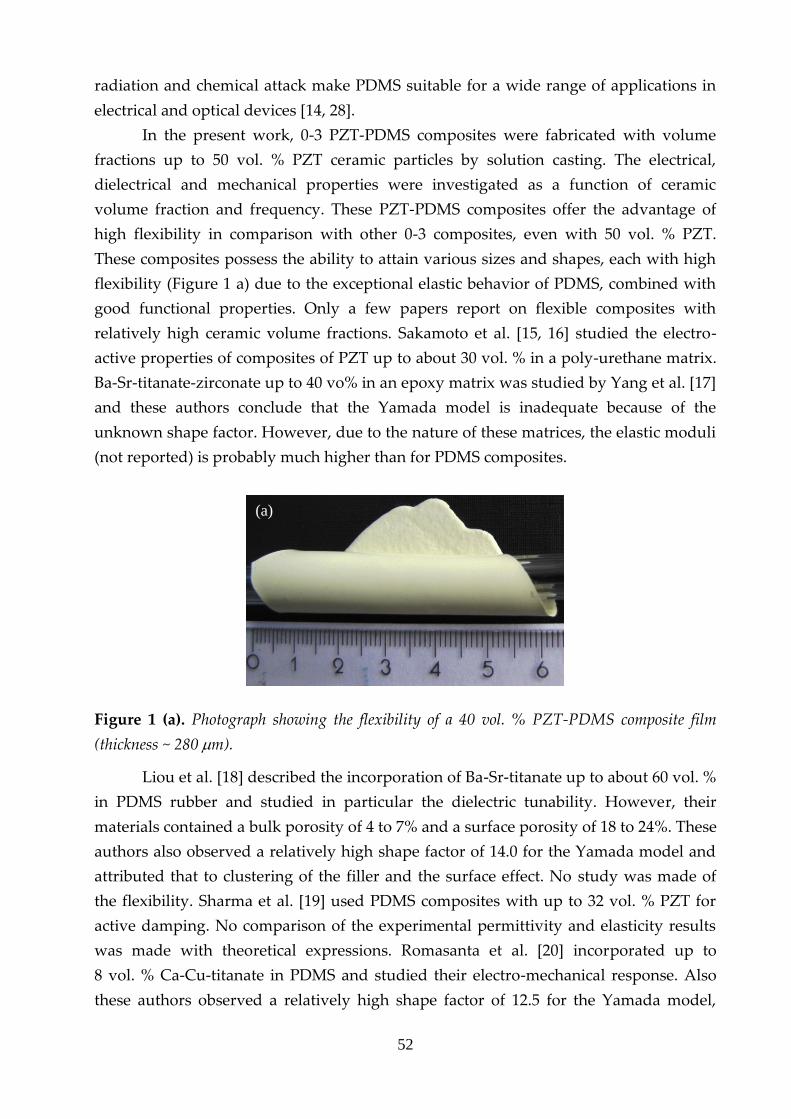
52
radiation and chemical attack make PDMS suitable for a wide range of applications in
electrical and optical devices [14, 28].
In the present work, 0-3 PZT-PDMS composites were fabricated with volume
fractions up to 50 vol. % PZT ceramic particles by solution casting. The electrical,
dielectrical and mechanical properties were investigated as a function of ceramic
volume fraction and frequency. These PZT-PDMS composites offer the advantage of
high flexibility in comparison with other 0-3 composites, even with 50 vol. % PZT.
These composites possess the ability to attain various sizes and shapes, each with high
flexibility (Figure 1 a) due to the exceptional elastic behavior of PDMS, combined with
good functional properties. Only a few papers report on flexible composites with
relatively high ceramic volume fractions. Sakamoto et al. [15, 16] studied the electro-
active properties of composites of PZT up to about 30 vol. % in a poly-urethane matrix.
Ba-Sr-titanate-zirconate up to 40 vo% in an epoxy matrix was studied by Yang et al. [17]
and these authors conclude that the Yamada model is inadequate because of the
unknown shape factor. However, due to the nature of these matrices, the elastic moduli
(not reported) is probably much higher than for PDMS composites.
Figure 1 (a). Photograph showing the flexibility of a 40 vol. % PZT-PDMS composite film
(thickness ~ 280 m).
Liou et al. [18] described the incorporation of Ba-Sr-titanate up to about 60 vol. %
in PDMS rubber and studied in particular the dielectric tunability. However, their
materials contained a bulk porosity of 4 to 7% and a surface porosity of 18 to 24%. These
authors also observed a relatively high shape factor of 14.0 for the Yamada model and
attributed that to clustering of the filler and the surface effect. No study was made of
the flexibility. Sharma et al. [19] used PDMS composites with up to 32 vol. % PZT for
active damping. No comparison of the experimental permittivity and elasticity results
was made with theoretical expressions. Romasanta et al. [20] incorporated up to
8 vol. % Ca-Cu-titanate in PDMS and studied their electro-mechanical response. Also
these authors observed a relatively high shape factor of 12.5 for the Yamada model,
(a)
tio
n
ov
erv
ie
w
b)
ti
o
n
o
v
er
vi
e
w
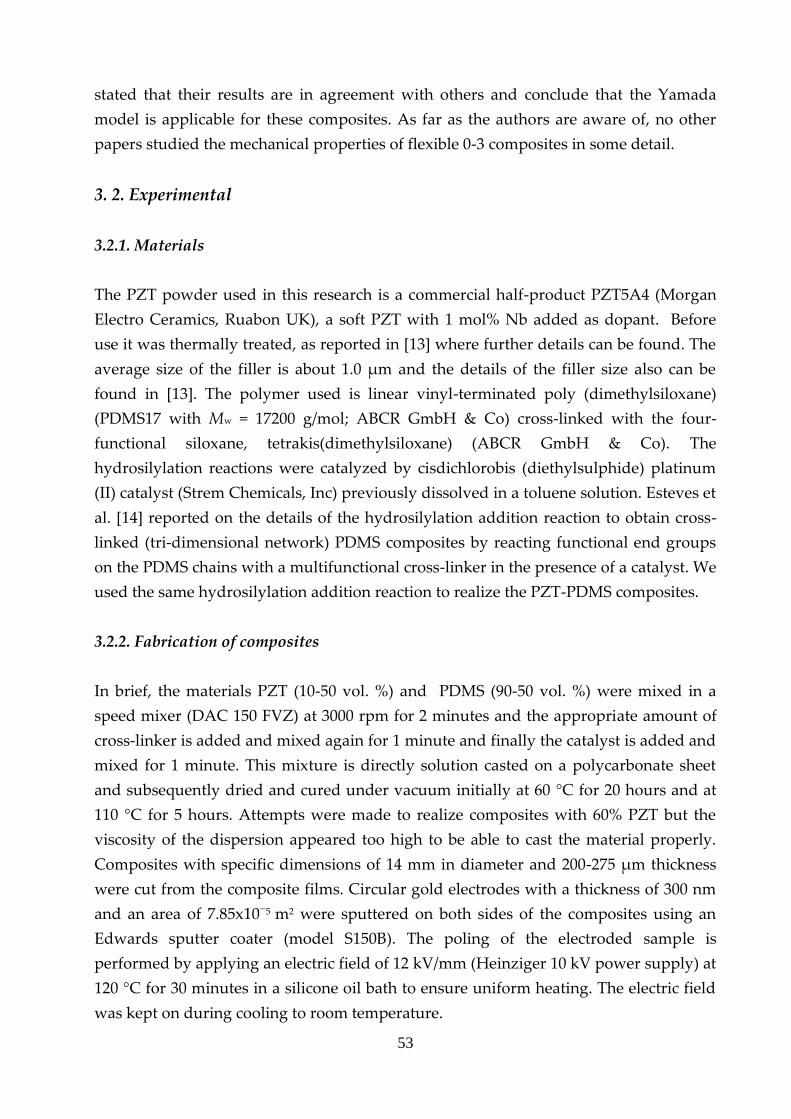
53
stated that their results are in agreement with others and conclude that the Yamada
model is applicable for these composites. As far as the authors are aware of, no other
papers studied the mechanical properties of flexible 0-3 composites in some detail.
3. 2. Experimental
3.2.1. Materials
The PZT powder used in this research is a commercial half-product PZT5A4 (Morgan
Electro Ceramics, Ruabon UK), a soft PZT with 1 mol% Nb added as dopant. Before
use it was thermally treated, as reported in [13] where further details can be found. The
average size of the filler is about 1.0 µm and the details of the filler size also can be
found in [13]. The polymer used is linear vinyl-terminated poly (dimethylsiloxane)
(PDMS17 with Mw = 17200 g/mol; ABCR GmbH & Co) cross-linked with the four-
functional siloxane, tetrakis(dimethylsiloxane) (ABCR GmbH & Co). The
hydrosilylation reactions were catalyzed by cisdichlorobis (diethylsulphide) platinum
(II) catalyst (Strem Chemicals, Inc) previously dissolved in a toluene solution. Esteves et
al. [14] reported on the details of the hydrosilylation addition reaction to obtain cross-
linked (tri-dimensional network) PDMS composites by reacting functional end groups
on the PDMS chains with a multifunctional cross-linker in the presence of a catalyst. We
used the same hydrosilylation addition reaction to realize the PZT-PDMS composites.
3.2.2. Fabrication of composites
In brief, the materials PZT (10-50 vol. %) and PDMS (90-50 vol. %) were mixed in a
speed mixer (DAC 150 FVZ) at 3000 rpm for 2 minutes and the appropriate amount of
cross-linker is added and mixed again for 1 minute and finally the catalyst is added and
mixed for 1 minute. This mixture is directly solution casted on a polycarbonate sheet
and subsequently dried and cured under vacuum initially at 60 °C for 20 hours and at
110 °C for 5 hours. Attempts were made to realize composites with 60% PZT but the
viscosity of the dispersion appeared too high to be able to cast the material properly.
Composites with specific dimensions of 14 mm in diameter and 200-275 µm thickness
were cut from the composite films. Circular gold electrodes with a thickness of 300 nm
and an area of 7.85x10⁵ m2 were sputtered on both sides of the composites using an
Edwards sputter coater (model S150B). The poling of the electroded sample is
performed by applying an electric field of 12 kV/mm (Heinziger 10 kV power supply) at
120 °C for 30 minutes in a silicone oil bath to ensure uniform heating. The electric field
was kept on during cooling to room temperature.

54
3.2.3. Measurements
The relative density of the composites were measured by the displacement of the
solvent (2 wt % sodium dodecyl sulphate (Merck) in ultra-pure water) using dynamic
contact angle measuring instrument and tensiometer (Dataphysics DCAT 21).
Impedance data of the composites were collected by an impedance analyzer (EG&G
Princeton Applied Research, Model 1025) coupled with a potentiostat
(Potentiostat/Galvanostat, Model 283) at room temperature at a frequency range of 10
mHz - 5 MHz. The piezoelectric charge constant was measured with a d33 meter
(Piezotest, PM300) at a fixed frequency of 110 Hz. The d33 and εr values obtained at 110
Hz were used to calculate the piezoelectric voltage coefficient g33 according to
g33 = d33 / εo εr (1)
where d33 is the piezoelectric charge constant in pC/N, εo is the permittivity of free space
(8.85.1012 F/m) and εr is the relative permittivity of the composite. The microstructure of
the composites was examined by SEM (FEI, Quanta 3D FEG). The mechanical
properties of the composite films were tested in a tensile mode on DMA (TA
Instruments Q800 series) at room temperature. The static elastic modulus E of the
composites was measured by performing stress-strain tests with a strain rate of
0.5 % min1. Creep measurements were conducted at 0.1 MPa, a stress level within the
linear viscoelastic region while stress relaxation measurements were conducted at a
constant strain of 0.55%. Both were monitored for 140 min. The dynamic behavior of
pure PDMS and 40 vol. % PZT-PDMS composites were studied using a temperature
ramp and multi-frequency mode. The specimens are heated at a constant rate of
3 °C /min. While heating, the specimens are deformed at constant amplitude over a
single frequency. The mechanical properties are also measured over a range of discrete
frequencies. The frequencies 1, 5 and 10 Hz were used in this study. The dynamic tests
were conducted at constant force amplitude of 5 μm with a preload force of 0.01 N. The
temperature range used was from 120 °C to +120 °C at a frequency of 1 Hz.
3.3. Results and discussion
3.3.1. Density, morphology and electrical conductivity
The theoretical and experimental densities of the fabricated composites are shown in
Figure 1 b.

55
The theoretical density values were calculated using the simple rule of mixtures,
ρc = ρp (1–φ) + ρf φ (2)
where ρc, ρp and ρf are the densities of the composite, polymer and the ceramic filler and
φ is the volume fraction of the ceramic filler. The values of ρp and ρf were taken to be 970
kg/m3 and 7950 kg/m3, respectively. The experimental density values are all
approximately 90% of the theoretical prediction.
10 20 30 40 50
1500
2000
2500
3000
3500
4000
4500
Theoretical density
Experimental density
Den
sit
y (
kg
/m3)
Volume fraction of composites
(b)
Figure 1 (b). Comparison between the experimental and theoretical density values of the
composites.
The quality of many materials and in particular those of composites depends to a
large extent on the homogeneity of the materials realized. Scanning electron microscopy
(SEM) of cross-sections of the PZT-PDMS composite films was done to investigate the
homogeneity of the dispersed particles (Figure 2 a and b). From these images it is
observed that the PZT particles are homogeneously dispersed on the micrometer scale
in the polymer matrix and are well adhering to the polymer matrix. Moreover the
composites have hardly any residual porosity, rendering a positive influence on the
structural integrity.
The dependence of ac conductivity of the PZT-PDMS composites as a function
of frequency and volume fraction was determined (Figure 3 a and b). As the volume
fraction of PZT increases, the conductivity increases about 1 decade from ~5x10¹⁰ S/m
(10 vol. %) to ~2x10⁹ S/m (50 vol. %) at 1000 Hz. The latter is still a value corresponding
to a highly insulating material, as required for sensor and transducer applications.
Because interface conductivity is usually higher then bulk conductivity, the increase in
the conductivity with the increase in volume fraction of PZT is attributed to the
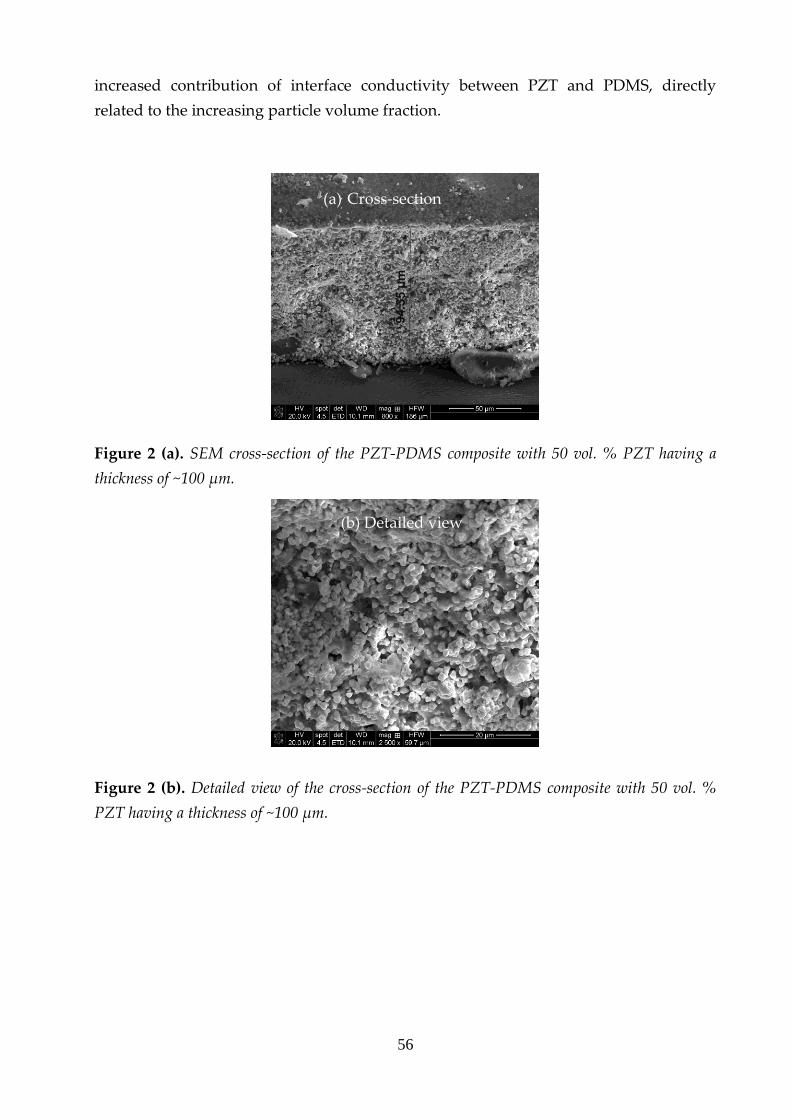
56
increased contribution of interface conductivity between PZT and PDMS, directly
related to the increasing particle volume fraction.
Figure 2 (a). SEM cross-section of the PZT-PDMS composite with 50 vol. % PZT having a
thickness of ~100 μm.
Figure 2 (b). Detailed view of the cross-section of the PZT-PDMS composite with 50 vol. %
PZT having a thickness of ~100 μm.
a) Cross-section overview (a) Cross-section
overview
(b) Detailed view
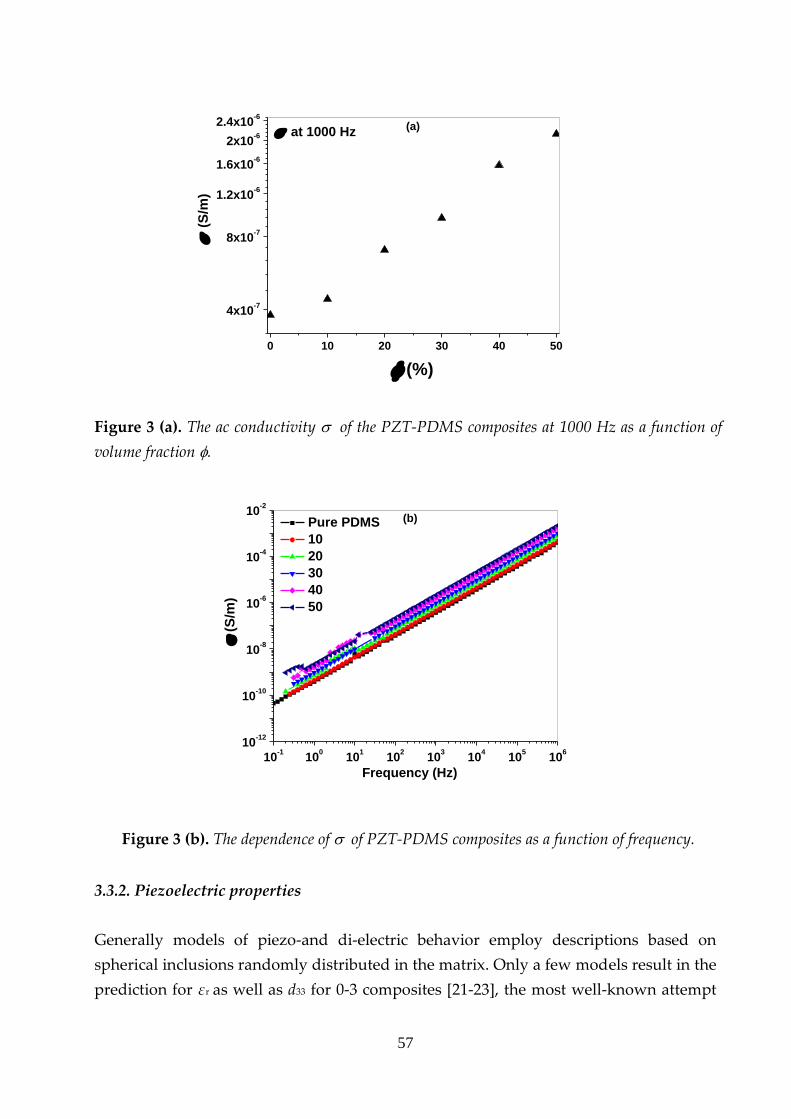
57
0 10 20 30 40 50
4x10⁻⁷
8x10⁻⁷
1.2x10⁻⁶
1.6x10⁻⁶
2x10⁻⁶
2.4x10⁻⁶
at 1000 Hz
(S/m
)
(%)
(a)
Figure 3 (a). The ac conductivity of the PZT-PDMS composites at 1000 Hz as a function of
volume fraction .
10-1
100
101
102
103
104
105
106
10-12
10-10
10-8
10-6
10-4
10-2
(b)
(
S/m
)
Frequency (Hz)
Pure PDMS
10
20
30
40
50
Figure 3 (b). The dependence of of PZT-PDMS composites as a function of frequency.
3.3.2. Piezoelectric properties
Generally models of piezo-and di-electric behavior employ descriptions based on
spherical inclusions randomly distributed in the matrix. Only a few models result in the
prediction for εr as well as d33 for 0-3 composites [21-23], the most well-known attempt
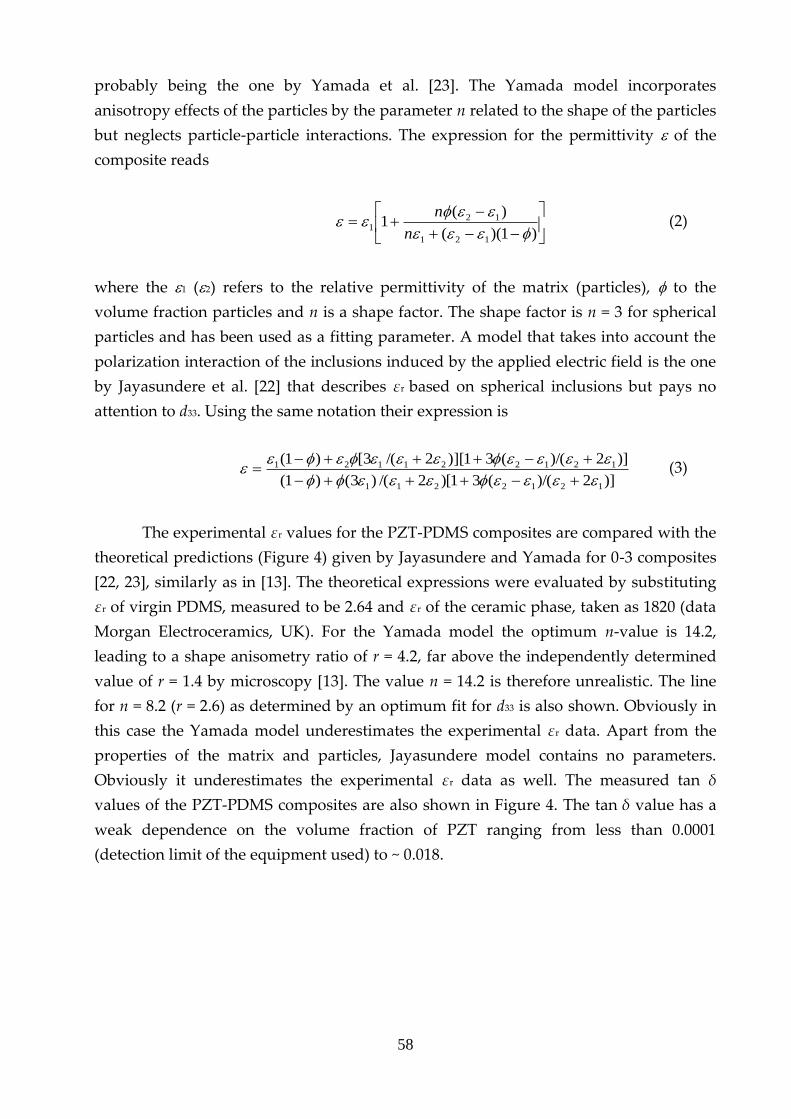
58
probably being the one by Yamada et al. [23]. The Yamada model incorporates
anisotropy effects of the particles by the parameter n related to the shape of the particles
but neglects particle-particle interactions. The expression for the permittivity of the
composite reads
)1)((
)(1
121
121
n
n (2)
where the 1 (2) refers to the relative permittivity of the matrix (particles), to the
volume fraction particles and n is a shape factor. The shape factor is n = 3 for spherical
particles and has been used as a fitting parameter. A model that takes into account the
polarization interaction of the inclusions induced by the applied electric field is the one
by Jayasundere et al. [22] that describes εr based on spherical inclusions but pays no
attention to d33. Using the same notation their expression is
)]2)/((31[)2/()3()1(
)]2)/((31][)2/(3[)1(
1212211
121221121
(3)
The experimental εr values for the PZT-PDMS composites are compared with the
theoretical predictions (Figure 4) given by Jayasundere and Yamada for 0-3 composites
[22, 23], similarly as in [13]. The theoretical expressions were evaluated by substituting
εr of virgin PDMS, measured to be 2.64 and εr of the ceramic phase, taken as 1820 (data
Morgan Electroceramics, UK). For the Yamada model the optimum n-value is 14.2,
leading to a shape anisometry ratio of r = 4.2, far above the independently determined
value of r = 1.4 by microscopy [13]. The value n = 14.2 is therefore unrealistic. The line
for n = 8.2 (r = 2.6) as determined by an optimum fit for d33 is also shown. Obviously in
this case the Yamada model underestimates the experimental εr data. Apart from the
properties of the matrix and particles, Jayasundere model contains no parameters.
Obviously it underestimates the experimental εr data as well. The measured tan δ
values of the PZT-PDMS composites are also shown in Figure 4. The tan δ value has a
weak dependence on the volume fraction of PZT ranging from less than 0.0001
(detection limit of the equipment used) to ~ 0.018.
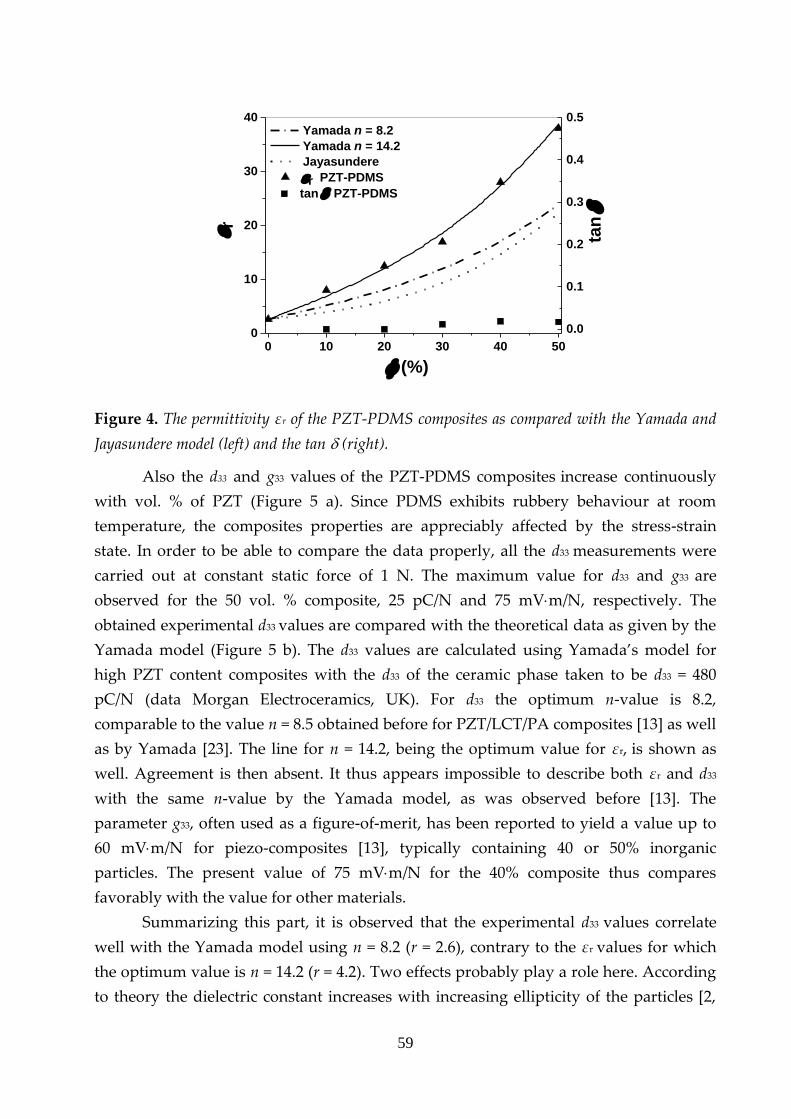
59
0 10 20 30 40 500
10
20
30
40
tan
r
(%)
Yamada n = 8.2
Yamada n = 14.2
Jayasundere
r PZT-PDMS
0.0
0.1
0.2
0.3
0.4
0.5
tan PZT-PDMS
Figure 4. The permittivity εr of the PZT-PDMS composites as compared with the Yamada and
Jayasundere model (left) and the tan (right).
Also the d33 and g33 values of the PZT-PDMS composites increase continuously
with vol. % of PZT (Figure 5 a). Since PDMS exhibits rubbery behaviour at room
temperature, the composites properties are appreciably affected by the stress-strain
state. In order to be able to compare the data properly, all the d33 measurements were
carried out at constant static force of 1 N. The maximum value for d33 and g33 are
observed for the 50 vol. % composite, 25 pC/N and 75 mVm/N, respectively. The
obtained experimental d33 values are compared with the theoretical data as given by the
Yamada model (Figure 5 b). The d33 values are calculated using Yamada’s model for
high PZT content composites with the d33 of the ceramic phase taken to be d33 = 480
pC/N (data Morgan Electroceramics, UK). For d33 the optimum n-value is 8.2,
comparable to the value n = 8.5 obtained before for PZT/LCT/PA composites [13] as well
as by Yamada [23]. The line for n = 14.2, being the optimum value for εr, is shown as
well. Agreement is then absent. It thus appears impossible to describe both εr and d33
with the same n-value by the Yamada model, as was observed before [13]. The
parameter g33, often used as a figure-of-merit, has been reported to yield a value up to
60 mVm/N for piezo-composites [13], typically containing 40 or 50% inorganic
particles. The present value of 75 mVm/N for the 40% composite thus compares
favorably with the value for other materials.
Summarizing this part, it is observed that the experimental d33 values correlate
well with the Yamada model using n = 8.2 (r = 2.6), contrary to the εr values for which
the optimum value is n = 14.2 (r = 4.2). Two effects probably play a role here. According
to theory the dielectric constant increases with increasing ellipticity of the particles [2,
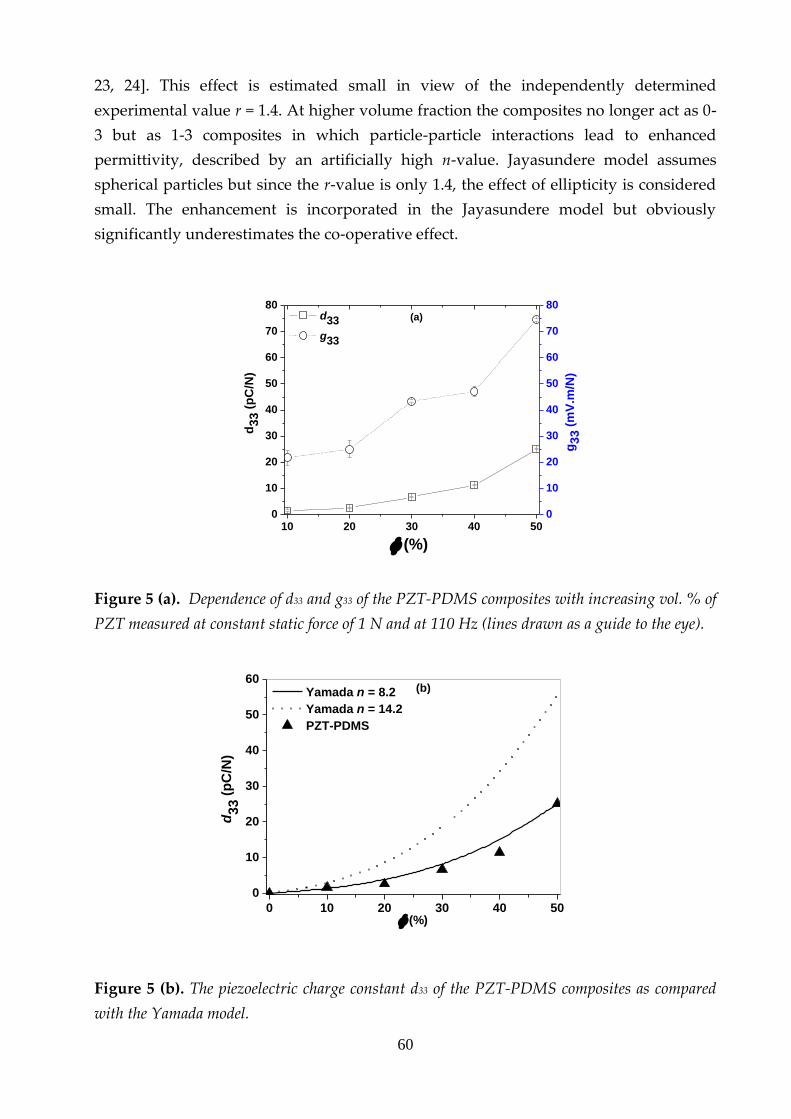
60
23, 24]. This effect is estimated small in view of the independently determined
experimental value r = 1.4. At higher volume fraction the composites no longer act as 0-
3 but as 1-3 composites in which particle-particle interactions lead to enhanced
permittivity, described by an artificially high n-value. Jayasundere model assumes
spherical particles but since the r-value is only 1.4, the effect of ellipticity is considered
small. The enhancement is incorporated in the Jayasundere model but obviously
significantly underestimates the co-operative effect.
10 20 30 40 500
10
20
30
40
50
60
70
80(a)
(%)
d
33
(p
C/N
)
d33
g33
0
10
20
30
40
50
60
70
80
g3
3 (
mV
.m/N
)
Figure 5 (a). Dependence of d33 and g33 of the PZT-PDMS composites with increasing vol. % of
PZT measured at constant static force of 1 N and at 110 Hz (lines drawn as a guide to the eye).
0 10 20 30 40 50
0
10
20
30
40
50
60(b)
d33 (
pC
/N)
(%)
Yamada n = 8.2
Yamada n = 14.2
PZT-PDMS
Figure 5 (b). The piezoelectric charge constant d33 of the PZT-PDMS composites as compared
with the Yamada model.
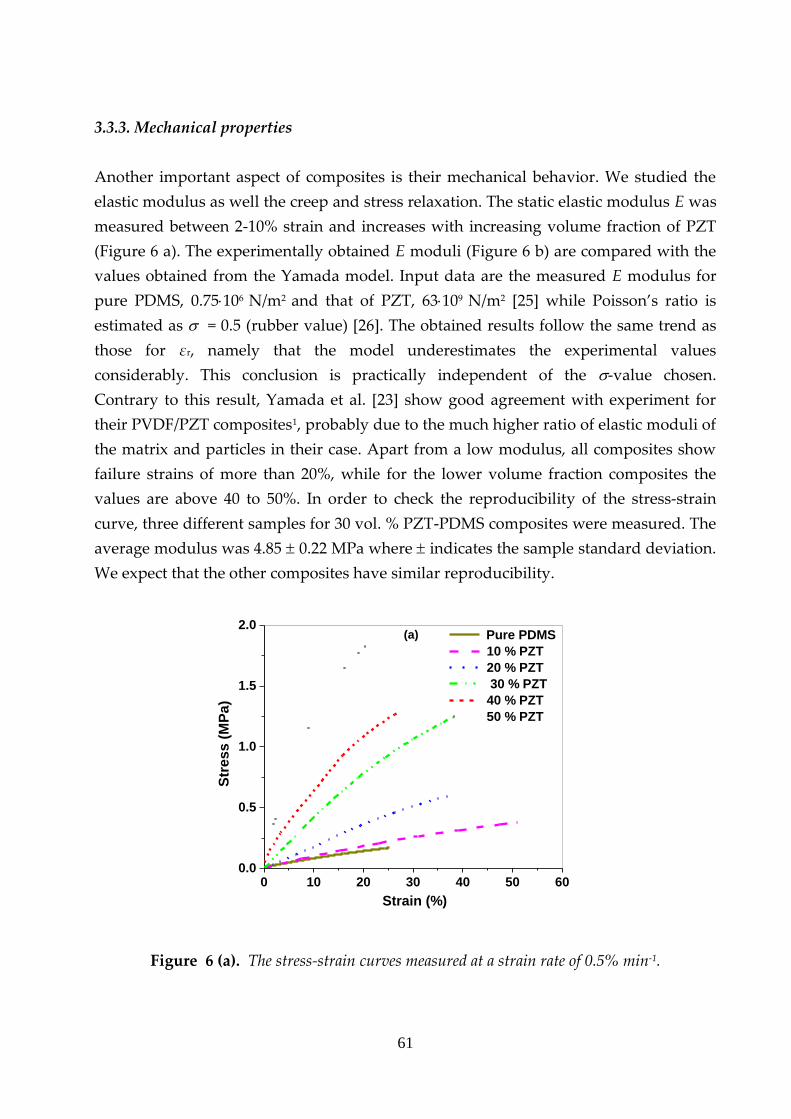
61
3.3.3. Mechanical properties
Another important aspect of composites is their mechanical behavior. We studied the
elastic modulus as well the creep and stress relaxation. The static elastic modulus E was
measured between 2-10% strain and increases with increasing volume fraction of PZT
(Figure 6 a). The experimentally obtained E moduli (Figure 6 b) are compared with the
values obtained from the Yamada model. Input data are the measured E modulus for
pure PDMS, 0.75106 N/m2 and that of PZT, 63109 N/m2 [25] while Poisson’s ratio is
estimated as = 0.5 (rubber value) [26]. The obtained results follow the same trend as
those for εr, namely that the model underestimates the experimental values
considerably. This conclusion is practically independent of the -value chosen.
Contrary to this result, Yamada et al. [23] show good agreement with experiment for
their PVDF/PZT composites1, probably due to the much higher ratio of elastic moduli of
the matrix and particles in their case. Apart from a low modulus, all composites show
failure strains of more than 20%, while for the lower volume fraction composites the
values are above 40 to 50%. In order to check the reproducibility of the stress-strain
curve, three different samples for 30 vol. % PZT-PDMS composites were measured. The
average modulus was 4.85 0.22 MPa where indicates the sample standard deviation.
We expect that the other composites have similar reproducibility.
0 10 20 30 40 50 600.0
0.5
1.0
1.5
2.0
Strain (%)
Str
es
s (
MP
a)
Pure PDMS
10 % PZT
20 % PZT
30 % PZT
40 % PZT
50 % PZT
(a)
Figure 6 (a). The stress-strain curves measured at a strain rate of 0.5% min-1.
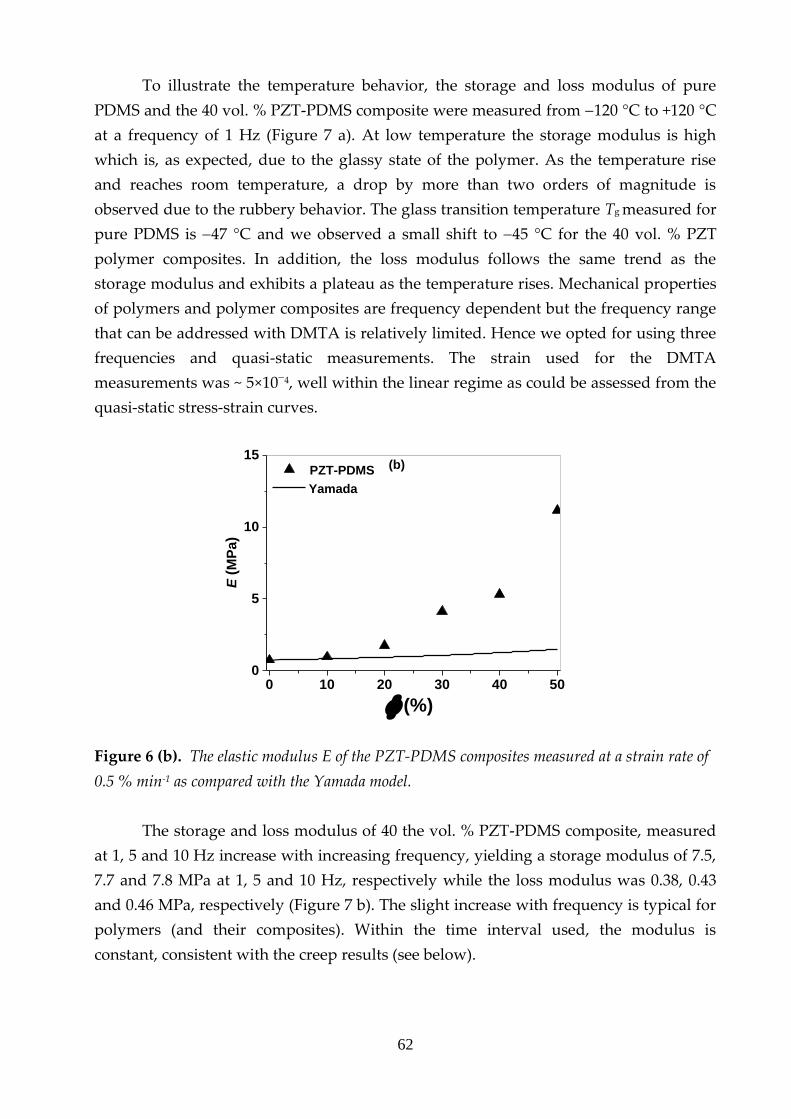
62
To illustrate the temperature behavior, the storage and loss modulus of pure
PDMS and the 40 vol. % PZT-PDMS composite were measured from 120 °C to +120 °C
at a frequency of 1 Hz (Figure 7 a). At low temperature the storage modulus is high
which is, as expected, due to the glassy state of the polymer. As the temperature rise
and reaches room temperature, a drop by more than two orders of magnitude is
observed due to the rubbery behavior. The glass transition temperature Tg measured for
pure PDMS is 47 °C and we observed a small shift to 45 °C for the 40 vol. % PZT
polymer composites. In addition, the loss modulus follows the same trend as the
storage modulus and exhibits a plateau as the temperature rises. Mechanical properties
of polymers and polymer composites are frequency dependent but the frequency range
that can be addressed with DMTA is relatively limited. Hence we opted for using three
frequencies and quasi-static measurements. The strain used for the DMTA
measurements was ~ 5×10⁴, well within the linear regime as could be assessed from the
quasi-static stress-strain curves.
0 10 20 30 40 500
5
10
15
E (
MP
a)
(%)
PZT-PDMS
Yamada
(b)
Figure 6 (b). The elastic modulus E of the PZT-PDMS composites measured at a strain rate of
0.5 % min-1 as compared with the Yamada model.
The storage and loss modulus of 40 the vol. % PZT-PDMS composite, measured
at 1, 5 and 10 Hz increase with increasing frequency, yielding a storage modulus of 7.5,
7.7 and 7.8 MPa at 1, 5 and 10 Hz, respectively while the loss modulus was 0.38, 0.43
and 0.46 MPa, respectively (Figure 7 b). The slight increase with frequency is typical for
polymers (and their composites). Within the time interval used, the modulus is
constant, consistent with the creep results (see below).

63
-120 -80 -40 0 40 80 1200.1
1
10
100
1000
10000
Temperature (ºC)
Lo
ss M
od
ulu
s (
MP
a)
log
Sto
rag
e M
od
ulu
s (
MP
a) PZT40-PDMS Storage Modulus
Pure PDMS Storage Modulus
0
200
400
600
800
1000
PZT40-PDMS Loss Modulus
Pure PDMS Loss modulus
(a)
Figure 7 (a). Dynamic behavior of pure PDMS and the 40 vol. % PZT-PDMS composite at 1
Hz using a heating rate of 3 °C/min.
0 2 4 6 8 10 127.0
7.2
7.4
7.6
7.8
8.0
Lo
ss
Mo
du
lus (
MP
a)
Sto
rag
e M
od
ulu
s (
MP
a)
Time (min)
1 Hz
5 Hz
10 Hz
(b)
0.0
0.2
0.4
0.6
0.8
1.0
1.2
1.4
Figure 7 (b). Dynamic behavior of 40 vol. % PZT-PDMS composites measured at 1, 5 and 10
Hz at room temperature.
Creep measurements were conducted at a stress of 0.1 MPa in the linear
viscoelastic region at room temperature for times up to 105 min (Figure 8 a). The
specimens were allowed to recover for another 35 min after stress removal. The
equilibrium elongation decreases strongly with increasing volume fraction of PZT.
After stress removal, all the composites exhibit instantaneous recovery indicating that
these composites are fully cross-linked and a three dimensional network is formed

64
encapsulating the ceramic particles. Stress relaxation measurements were conducted at
a constant strain of 0.55% (value taken from creep measurements for the 50 vol. %
composite) for 105 min and the strain recovery was followed for another 35 min (Figure
8 b). The obtained stress from the stress relaxation measurements for the 50 vol. % is
equal to the applied stress in the creep measurements which indicates that the results
obtained from these measurements are in excellent agreement.
0 20 40 60 80 1000
5
10
15
20
25(a) Pure PDMS
10% PZT
20% PZT
30% PZT
40% PZT
50% PZT
Str
ain
(%
)
Time (min)
___Model fit
Figure 8 (a). Creep measurements at 0.1 MPa compared with the Burgers’ four element model.
0 20 40 60 80 1000.00
0.02
0.04
0.06
0.08
0.10
0.12
0.14(b)
Time (min)
Pure PDMS
10% PZT
20% PZT
30% PZT
40% PZT
50% PZT
Str
es
s (
MP
a)
___ Model fit
Figure 8 (b). Stress relaxation measurements at 0.55% compared with the Burgers’ four
element model.

65
Table 1: Burgers’ model parameters for creep at a stress of 0.1 MPa
Creep EM (MPa) ηM (MPa.s) EK (MPa) ηK (MPa.s)
Pure PDMS 0.00583 124 0.117 0.00168
10PZT-90PDMS 0.0103 124 0.234 0.00200
20PZT-80PDMS 0.0249 66.6 0.439 0.0885
30PZT-70PDMS 0.0492 102 0.821 7.68
40PZT-60PDMS 0.0993 142 1.28 7.95
50PZT-50PDMS 0.208 264 1.46 15.6
a The above shown parameters from the fitting of the Burgers’ model to the creep data
were used for the calculation of the stress relaxation curves.
Burgers’ model, containing a Maxwell element (with elastic constant EM and
viscosity M) and a Kelvin element (with elastic constant EK and viscosity K) in series,
was used to analyze the creep data of the composites [27], resulting in a good fit for the
higher vol. % composites and reasonable agreement for the lower vol. % composites
(Figure 8 a). As expected, the elastic parameters EM and EK increase continuously with
increasing vol. % of PZT (Table 1). Since both the Maxwell spring EM and the Kelvin
spring EK increase with vol. % of PZT, both the instantaneous elastic deformation and
anelastic relaxation decrease with increasing vol%. The viscous parameter ηM is
approximately constant while the parameter ηK also increases continuously with
increasing vol. % of PZT, rendering that creep of the composites decreased with respect
to the pure PDMS, diminishing even further the already small effects present for pure
PDMS. The parameters as obtained from the creep data were used to predict the stress
relaxation data and the predicted curves show a good match with the experimental
data, indicating the suitability of the model (Figure 8 b).
Finally we note that PDMS-based composites show excellent thermal stability.
Thermal gravimetric analysis on similar composites have shown that these materials are
thermally stable in nitrogen and air up to at least 300 C [28]. In fact, the presence of the
particles does seem to have a significant influence on the thermal stability. Since the
Curie temperature of the PZT is about 360 C [25], these composites can be used up to a
temperature close to the Curie temperature.
Note: 1 Ref. [23] reports n = 0.67 to fit the experimental data while we obtain n =
0.65 using digitized data from fig. 6 in ref. [23], i.e. essentially agreement. Calculating
Poisson’s ratio from eq. 16 in ref. [23], n = (1+)/3(1), results in = 0.34, a more
reasonable value for a glassy polymer than = 0.49 as reported in ref. [23] . Moreover,
66
the value for the Young’s modulus of the PZT is given as E = 6.32.109 N/m2 which
probably should read E = 63.2.109 N/m2, an acceptable value for a PZT particle, and that
value indeed yields E 3.1109 N/m2 as calculated from eq. 17 in ref. [23] for a volume
fraction = 0.67.
3.4. Conclusions
In conclusion, highly flexible piezoelectric PZT-PDMS composite films of 0-3
connectivity with filler volume fractions up to 50 vol. % could be successfully and easily
fabricated by solution casting. SEM analysis of the composites shows a homogeneous
distribution of PZT particles in the polymer matrix. The experimental relative density
values proved to be about 90%. The relative permittivity and piezoelectric charge
constant increase with the increasing contribution of PZT, maintaining a low ac
conductivity. The experimental results were compared with theoretical models and we
note that the Yamada model can either describe the piezoelectric charge constant d33
well meanwhile describing poorly the permittivity εr or vice versa, albeit in both cases
with unrealistically high shape factors, but not both. Results obtained from static and
dynamic mechanical analysis show that the present composites are highly compliant
with a Young’s modulus only a few times higher than for pure PDMS. The Yamada
model underestimates the Young’s moduli E significantly, though, as compared with
the experimental data. A similar remark can be made for the permittivity with respect
to the Jayasundere model. The good combination of the material properties, i.e. a decent
value for permittivity, piezoelectric charge and voltage constant combined with low
electrical conductivity, low elastic stiffness and very limited creep and stress relaxation,
promotes the development of prototypes for transducer and sensors applications.
Moreover, by varying the volume fraction a proper balance in dielectric and mechanical
properties for various applications can be realized. It is highly likely that other
piezoelectric oxide particles can be incorporated in PDMS without having any porosity
in a similar easy way, thereby increasing the applicability range.
Acknowledgements
This work was financially supported by the Smartmix funding program (grant
SMVA06071), as part of the program “Smart systems based on integrated Piezo”. The
authors are grateful to Morgan Electro Ceramics (Ruabon, UK) for providing the PZT
powder used in this research and to Dr. Daan van den Ende, Dr. Pim Groen (TNO,
Eindhoven) and Prof. Sybrand van der Zwaag (Novel Aerospace Materials Group, Delft
University of Technology) for fruitful discussions.
67
References
[1] L. Dong , R. Li, C. Xiong, H. Quan., 2010, Polym Int.; 59(6):756- 758.
[2] D. Khastgir, K. Adachi., Piezoelectric and dielectric properties of siloxane elastomers
filled with bariumtitanate, 1999, J Polym Sci, Part B: Polym Phys., 37(21):3065-3070.
[3] E. Venkatragavaraj, B. Satish, P.R. Vinod, M.S. Vijaya, 2001, J Phys D: Appl Phys.,
34(4):487.
[4] M. Akiyama, T. Kamohara, K. Kano, A. Teshigahara, Y. Takeuchi, N. Kawahara, 2009,
Adv Mater., 21(5):593-596.
[5] S.V. Glushanin, V.Y. Topolov, A.V. Krivoruchko, 2006, Mater Chem Phys., 97(2–3):357-
364.
[6] G. Rujijanagul, S. Jompruan, A. Chaipanich, 2008, Curr Appl Phys., 8(3–4):359-362.
[7] J. Yao, C. Xiong, L. Dong, C. Chen, Y. Lei, L. Chen. et al, 2009, J Mater Chem.,
19(18):2817-2821.
[8] Y. Lin, H.A. Sodano., 2009, Adv Funct Mater., 19(4):592-598.
[9] J.H. Park, T.Y. Kwon, D.S. Yoon, H. Kim, T.S. Kim., 2005, Adv Funct Mater., 15(12):2021-
2028.
[10] R.C. Twiney., Novel piezoelectric materials, 1992, Adv Mater., 4(12):819-822.
[11] P. Moetakef, Z.A. Nemati., 2009, J Alloys Compd., 476(1–2):791-796.
[12] C-B. Yoon, S-H. Lee, S-M. Lee, Y-H. Koh, H-E. Kim, K-W. Lee., 2006, J Am Ceram Soc.
89(8):2509-2513.
[13] I. Babu, D. van den Ende, G. de With., 2010, J Phys D: Appl Phys., 43(42):425402.
[14] A.C.C. Esteves, J. Brokken-Zijp, J. Laven, H.P. Huinink, N.J.W. Reuvers, M.P. Van et al.,
2009, Polymer, 50(16):3955-3966.
[15] W.K. Sakamoto, S. Shibatta-Katesawa, D.H.F. Kanda, S.H. Fernandes, E. Longo, G.O.
Chierice., 1999, physica status solidi (a), 172(1):265-271.
[16] W.K. Sakamoto, Ed. Souza, D.K. Das-Gupta., 2001, Materials Research, 4:201-204.
[17] C-F. Yang, C-C. Wu, Y-C. Chen, C-C. Su., 2009, Appl Phys Lett., 94(5):052905-052905-
052903.
[18] J.W. Liou, B.S. Chiou., 1998, J Phys: Condens Matter., 10(12):2773.
[19] S.K. Sharma, H. Gaur, M. Kulkarni, G. Patil, B. Bhattacharya, A. Sharma., 2013,
Composites Science and Technology, 77(0):42-51.
[20] L.J. Romasanta, P. Leret, L. Casaban, M. Hernandez, M.A. de la Rubia, J.F. Fernandez., et
al, 2012, J Mater Chem., 22(47):24705-24712.
[21] T. Bhimasankaram, S. Suryanarayana, G. Prasad., 1998, Current Science(India),
74(11):967-976.
[22] N. Jayasundere, B.V. Smith., 1993, J Appl Phys, 73(5):2462-2466.
[23] T. Yamada, T. Ueda, T. Kitayama., 1982, J Appl Phys, 53(6):4328-4332.
[24] R.W. Sillars., 1937, Journal of the Institution, 80(484):378-394.
[25] T.S. Low, W. Guo., 1995, J. MEMS, 4(4)230-237.
68
[26] M.A. Jayaram., 2007, C. Prentice-Hall of India, p.19-20.
[27] G. de With., 2008, Chapter 18, Structure, Deformation, and Integrity of Materials. Wiley-
VCH Verlag GmbH, p. 569-591.
[28] A.C.C. Esteves, J. Brokken-Zijp, J. Laven, G. de With., 2010, Progr Org Coat., 68: 12-18.
69
Chapter 4
Enhanced electromechanical properties of
piezoelectric thin flexible films*
Highly flexible piezoelectric 0-3 PZT/PDMS (lead zirconate titanate - poly dimethyl
siloxane) composites incorporated with carbon nanotubes (CNT) and carbon black (CB)
were fabricated by solution casting technique using a constant PZT/PDMS ratio of 40/60
and conductive fillers ranging from 0 to 0.5 vol.%. Impedance measurements proved
that a small addition of conductive fillers sufficiently enhanced the electrical
conductivity to lead to improved poling efficiency. For too high volume fractions (and
consequently too high conductivity), poling becomes impossible. For the optimum
PZT/PDMS/0.125CNT a relative permittivity r ~ 50 and conductivity ~ 2.810–6 S/m
was obtained while for the optimum PZT/PDMS/0.125CB r ~ 35 and ~ 1.910–6 S/m
have been realized. The piezoelectric charge constant d33 of the PZT/PDMS/0.125CNT
and PZT/PDMS/0.125CB composites were 25 and 18 pC/N, respectively. Dynamic
mechanical analysis (DMA) shows better performance for PZT/PDMS/CB with lower
volume fraction conductive fillers than for the PZT/PDMS/CNT composites. The
excellent (di-)electrical properties and the relatively simple fabrication procedure of
these composites make them promising candidates in piezoelectric sensors, actuators
and high efficiency capacitors.
*This chapter has been submitted for publication as: I. Babu and G. de With, “Enhanced
electromechanical properties of piezoelectric thin flexible films," Composites Science and Technology
(2013).

70
71
4.1. Introduction
Composites with piezoceramics and polymers have attracted much attention and have
been the subject of many fundamental researches due to their technological potential.
These composites, often named “smart materials”, are optimized for special
applications and can act as both sensors and actuators materials in many technical
systems. The operation principle is the conversion of the mechanical energy into
electrical energy [1-3]. Combining a piezoelectric ceramic and a polymer offers the
advantage of flexibility and formability over ceramics with reduced sizes and lower
operating voltages. The most widely used ceramic for such composite materials is lead
zirconate titanate (Pb(ZrxTi1-x)O3 or PZT), with perovskite structure and a promising
candidate material due to its excellent electromechanical properties [4-7].
Piezoelectricity produced by polar materials like PZT is applied over the whole range of
piezoelectric devices that includes linear actuators, underwater acoustic signals, naval
sonar devices, medical diagnostic systems and tactile sensors [8, 9].
The properties of these composites depend on the connectivity pattern of the
ceramic and the polymer and the distribution and the size of the dispersed particles.
The concept of connectivity was proposed by Newnham et al. to explain the
piezoelectric behavior of the composites [10]. Many theoretical investigations have been
carried out on such composites and the study done by Furukawa et al., Yamada et al.
and Jayasundere et al. are considered to be the most extensive ones [11-13]. Out of
these, composites with so-called 0-3 connectivity receive increasing attraction due to the
ease of fabrication, high structural performance and the control of flexibility. The
connectivity pattern 0-3 stands for the three dimensionally-connected polymer matrix
filled with isolated ceramic particles.
Including nano-size conductive fillers like carbon nano tubes (CNT) and carbon
black (CB) to 0-3 composites leads to a significant increase in the properties of the
composites. Composites with conductive fillers have several advantages depending on
the types used [14-19]. The use of CB as conductive filler is widely increasing because of
its cost advantage and high surface area [20-22]. On the other hand, the addition of low
concentration of CNT results in outstanding electrical and mechanical properties of the
composites, but so far the use of CNT is limited due to their relatively high cost. As an
advantage of the use of conductive fillers, previous research reported that their
presence results in the formation of a continuous electric flux path between the ceramic
grains and that poling can be carried out at low voltages and in shorter times [4, 23].
In a previous study, we reported on the processing and characterization of 0-3
PZT/LCT/PA composites [5]. Hot-pressing was utilized for the fabrication and the effect
of the volume fraction of PZT on the piezoelectric and dielectric properties was studied.
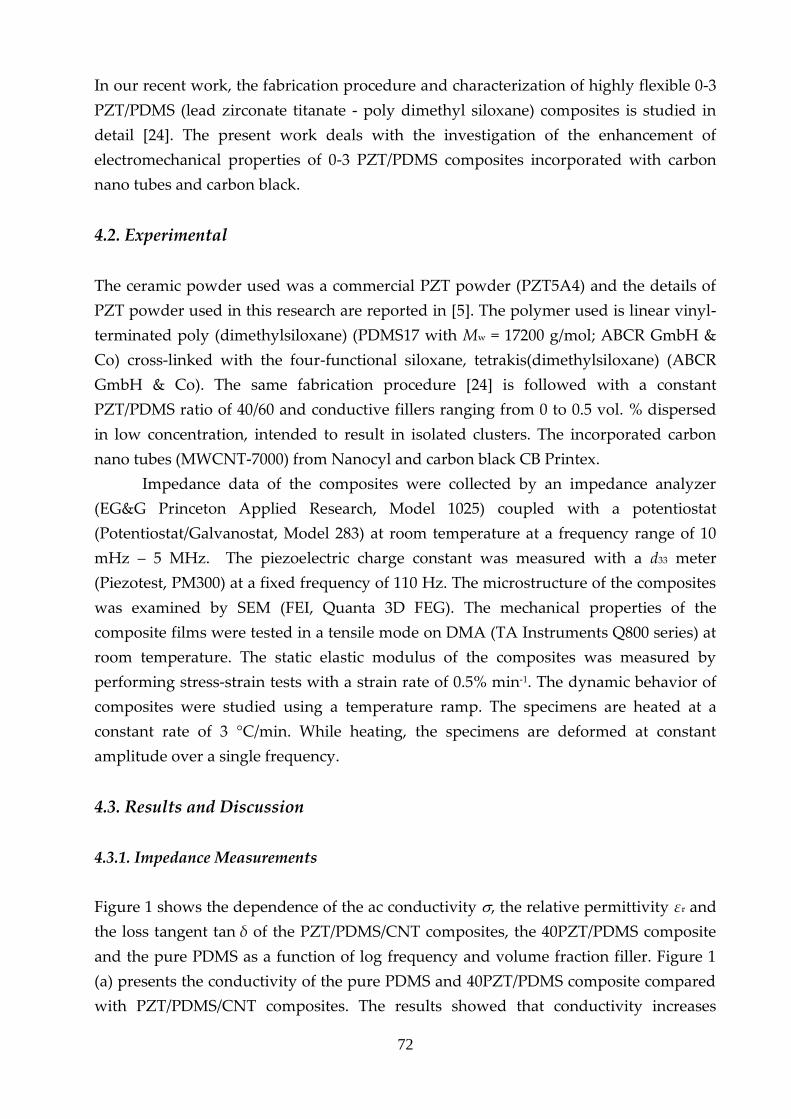
72
In our recent work, the fabrication procedure and characterization of highly flexible 0-3
PZT/PDMS (lead zirconate titanate - poly dimethyl siloxane) composites is studied in
detail [24]. The present work deals with the investigation of the enhancement of
electromechanical properties of 0-3 PZT/PDMS composites incorporated with carbon
nano tubes and carbon black.
4.2. Experimental
The ceramic powder used was a commercial PZT powder (PZT5A4) and the details of
PZT powder used in this research are reported in [5]. The polymer used is linear vinyl-
terminated poly (dimethylsiloxane) (PDMS17 with Mw = 17200 g/mol; ABCR GmbH &
Co) cross-linked with the four-functional siloxane, tetrakis(dimethylsiloxane) (ABCR
GmbH & Co). The same fabrication procedure [24] is followed with a constant
PZT/PDMS ratio of 40/60 and conductive fillers ranging from 0 to 0.5 vol. % dispersed
in low concentration, intended to result in isolated clusters. The incorporated carbon
nano tubes (MWCNT-7000) from Nanocyl and carbon black CB Printex.
Impedance data of the composites were collected by an impedance analyzer
(EG&G Princeton Applied Research, Model 1025) coupled with a potentiostat
(Potentiostat/Galvanostat, Model 283) at room temperature at a frequency range of 10
mHz – 5 MHz. The piezoelectric charge constant was measured with a d33 meter
(Piezotest, PM300) at a fixed frequency of 110 Hz. The microstructure of the composites
was examined by SEM (FEI, Quanta 3D FEG). The mechanical properties of the
composite films were tested in a tensile mode on DMA (TA Instruments Q800 series) at
room temperature. The static elastic modulus of the composites was measured by
performing stress-strain tests with a strain rate of 0.5% min-1. The dynamic behavior of
composites were studied using a temperature ramp. The specimens are heated at a
constant rate of 3 °C/min. While heating, the specimens are deformed at constant
amplitude over a single frequency.
4.3. Results and Discussion
4.3.1. Impedance Measurements
Figure 1 shows the dependence of the ac conductivity , the relative permittivity εr and
the loss tangent tan δ of the PZT/PDMS/CNT composites, the 40PZT/PDMS composite
and the pure PDMS as a function of log frequency and volume fraction filler. Figure 1
(a) presents the conductivity of the pure PDMS and 40PZT/PDMS composite compared
with PZT/PDMS/CNT composites. The results showed that conductivity increases
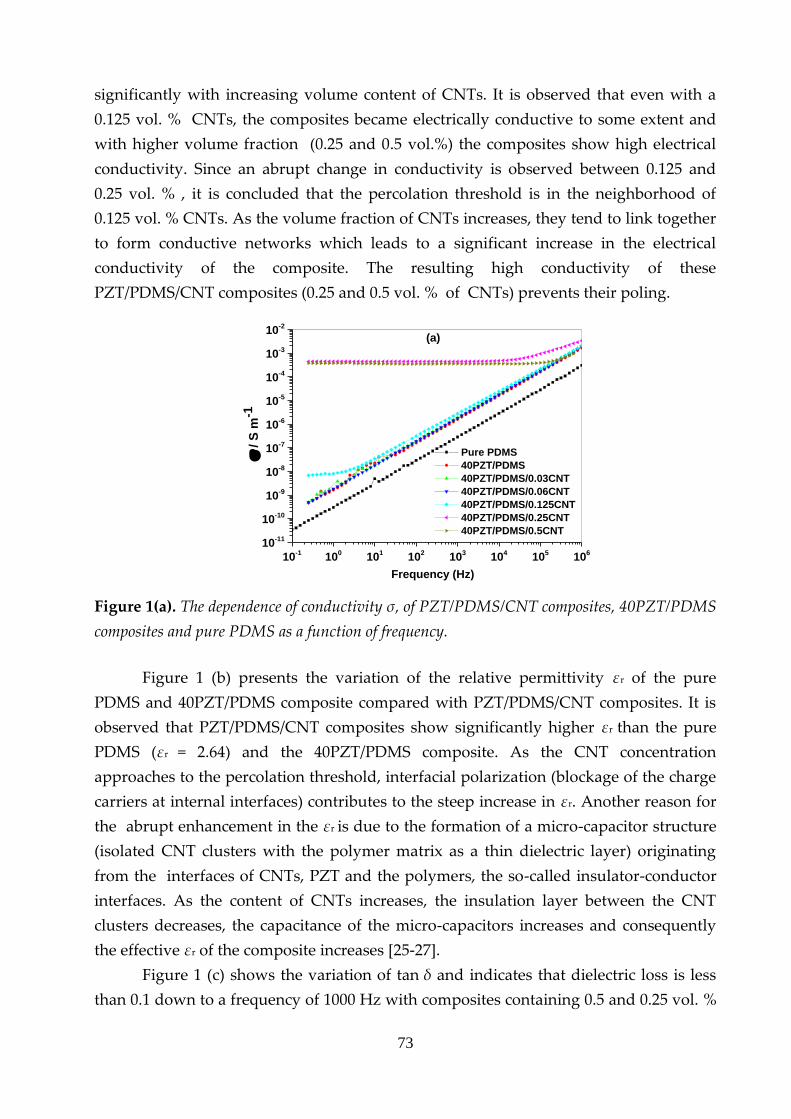
73
significantly with increasing volume content of CNTs. It is observed that even with a
0.125 vol. % CNTs, the composites became electrically conductive to some extent and
with higher volume fraction (0.25 and 0.5 vol.%) the composites show high electrical
conductivity. Since an abrupt change in conductivity is observed between 0.125 and
0.25 vol. % , it is concluded that the percolation threshold is in the neighborhood of
0.125 vol. % CNTs. As the volume fraction of CNTs increases, they tend to link together
to form conductive networks which leads to a significant increase in the electrical
conductivity of the composite. The resulting high conductivity of these
PZT/PDMS/CNT composites (0.25 and 0.5 vol. % of CNTs) prevents their poling.
10-1
100
101
102
103
104
105
106
10-11
10-10
10-9
10-8
10-7
10-6
10-5
10-4
10-3
10-2
/ S
m-1
Frequency (Hz)
Pure PDMS
40PZT/PDMS
40PZT/PDMS/0.03CNT
40PZT/PDMS/0.06CNT
40PZT/PDMS/0.125CNT
40PZT/PDMS/0.25CNT
40PZT/PDMS/0.5CNT
(a)
Figure 1(a). The dependence of conductivity σ, of PZT/PDMS/CNT composites, 40PZT/PDMS
composites and pure PDMS as a function of frequency.
Figure 1 (b) presents the variation of the relative permittivity εr of the pure
PDMS and 40PZT/PDMS composite compared with PZT/PDMS/CNT composites. It is
observed that PZT/PDMS/CNT composites show significantly higher εr than the pure
PDMS (εr = 2.64) and the 40PZT/PDMS composite. As the CNT concentration
approaches to the percolation threshold, interfacial polarization (blockage of the charge
carriers at internal interfaces) contributes to the steep increase in εr. Another reason for
the abrupt enhancement in the εr is due to the formation of a micro-capacitor structure
(isolated CNT clusters with the polymer matrix as a thin dielectric layer) originating
from the interfaces of CNTs, PZT and the polymers, the so-called insulator-conductor
interfaces. As the content of CNTs increases, the insulation layer between the CNT
clusters decreases, the capacitance of the micro-capacitors increases and consequently
the effective εr of the composite increases [25-27].
Figure 1 (c) shows the variation of tan δ and indicates that dielectric loss is less
than 0.1 down to a frequency of 1000 Hz with composites containing 0.5 and 0.25 vol. %
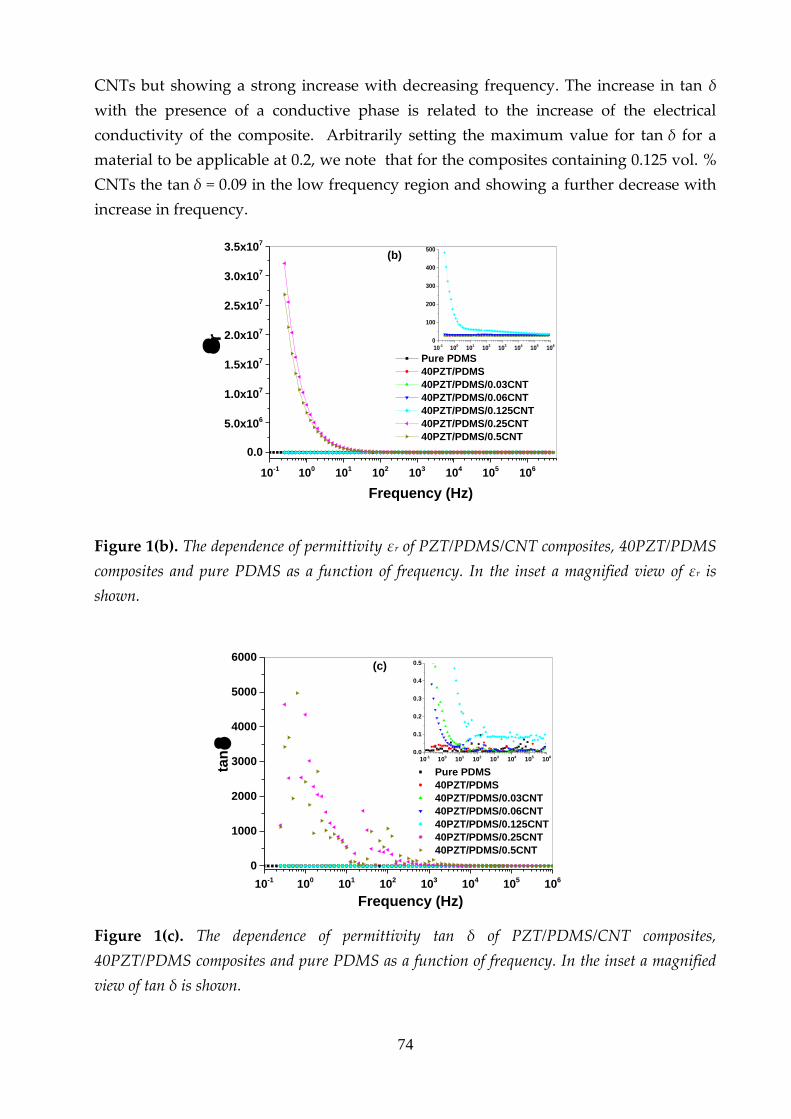
74
CNTs but showing a strong increase with decreasing frequency. The increase in tan δ
with the presence of a conductive phase is related to the increase of the electrical
conductivity of the composite. Arbitrarily setting the maximum value for tan δ for a
material to be applicable at 0.2, we note that for the composites containing 0.125 vol. %
CNTs the tan δ = 0.09 in the low frequency region and showing a further decrease with
increase in frequency.
10-1
100
101
102
103
104
105
106
0.0
5.0x10⁶
1.0x10⁷
1.5x10⁷
2.0x10⁷
2.5x10⁷
3.0x10⁷
3.5x10⁷
Pure PDMS
40PZT/PDMS
40PZT/PDMS/0.03CNT
40PZT/PDMS/0.06CNT
40PZT/PDMS/0.125CNT
40PZT/PDMS/0.25CNT
40PZT/PDMS/0.5CNT
10-1
100
101
102
103
104
105
106
0
100
200
300
400
500
Frequency (Hz)
r
(b)
Figure 1(b). The dependence of permittivity εr of PZT/PDMS/CNT composites, 40PZT/PDMS
composites and pure PDMS as a function of frequency. In the inset a magnified view of εr is
shown.
10-1
100
101
102
103
104
105
106
0
1000
2000
3000
4000
5000
6000
Pure PDMS
40PZT/PDMS
40PZT/PDMS/0.03CNT
40PZT/PDMS/0.06CNT
40PZT/PDMS/0.125CNT
40PZT/PDMS/0.25CNT
40PZT/PDMS/0.5CNT
10-1
100
101
102
103
104
105
106
0.0
0.1
0.2
0.3
0.4
0.5
Frequency (Hz)
tan
(c)
Figure 1(c). The dependence of permittivity tan δ of PZT/PDMS/CNT composites,
40PZT/PDMS composites and pure PDMS as a function of frequency. In the inset a magnified
view of tan δ is shown.
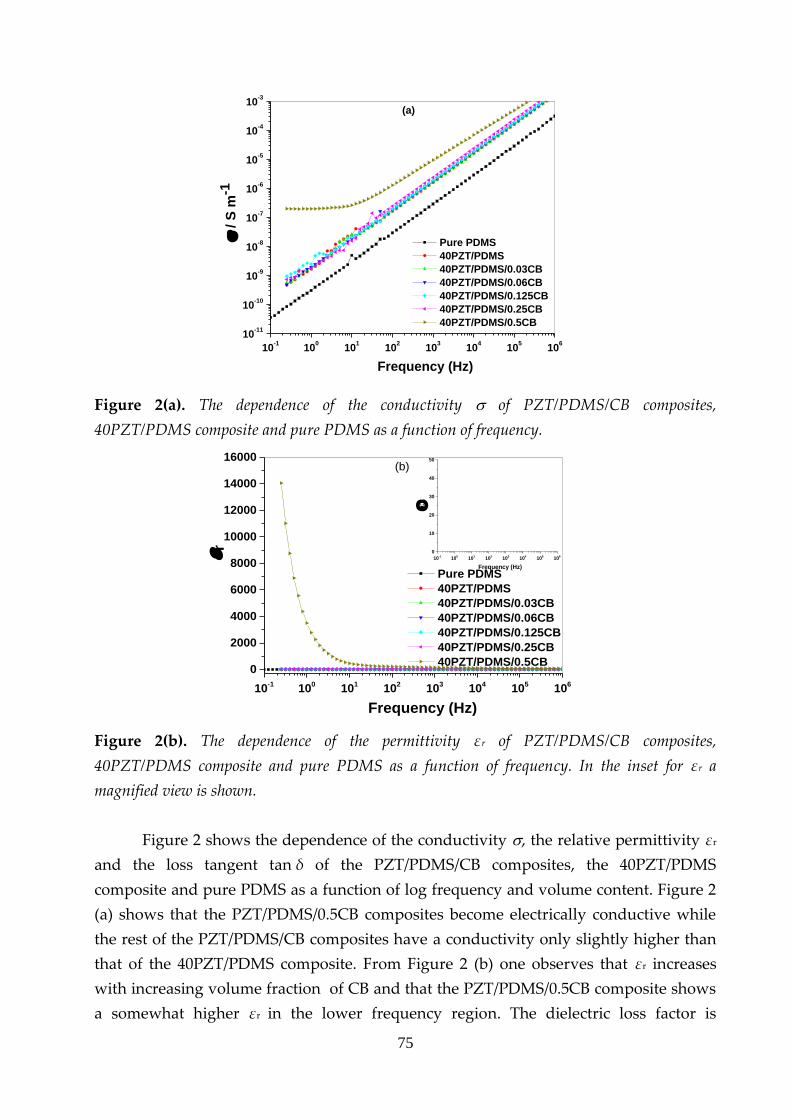
75
10-1
100
101
102
103
104
105
106
10-11
10-10
10-9
10-8
10-7
10-6
10-5
10-4
10-3
Frequency (Hz)
/ S
m-1
Pure PDMS
40PZT/PDMS
40PZT/PDMS/0.03CB
40PZT/PDMS/0.06CB
40PZT/PDMS/0.125CB
40PZT/PDMS/0.25CB
40PZT/PDMS/0.5CB
(a)
Figure 2(a). The dependence of the conductivity of PZT/PDMS/CB composites,
40PZT/PDMS composite and pure PDMS as a function of frequency.
10-1
100
101
102
103
104
105
106
0
2000
4000
6000
8000
10000
12000
14000
16000
10-1
100
101
102
103
104
105
106
0
10
20
30
40
50
Frequency (Hz)
r
Frequency (Hz)
r
Pure PDMS
40PZT/PDMS
40PZT/PDMS/0.03CB
40PZT/PDMS/0.06CB
40PZT/PDMS/0.125CB
40PZT/PDMS/0.25CB
40PZT/PDMS/0.5CB
(b)
Figure 2(b). The dependence of the permittivity εr of PZT/PDMS/CB composites,
40PZT/PDMS composite and pure PDMS as a function of frequency. In the inset for εr a
magnified view is shown.
Figure 2 shows the dependence of the conductivity , the relative permittivity εr
and the loss tangent tan δ of the PZT/PDMS/CB composites, the 40PZT/PDMS
composite and pure PDMS as a function of log frequency and volume content. Figure 2
(a) shows that the PZT/PDMS/0.5CB composites become electrically conductive while
the rest of the PZT/PDMS/CB composites have a conductivity only slightly higher than
that of the 40PZT/PDMS composite. From Figure 2 (b) one observes that εr increases
with increasing volume fraction of CB and that the PZT/PDMS/0.5CB composite shows
a somewhat higher εr in the lower frequency region. The dielectric loss factor is
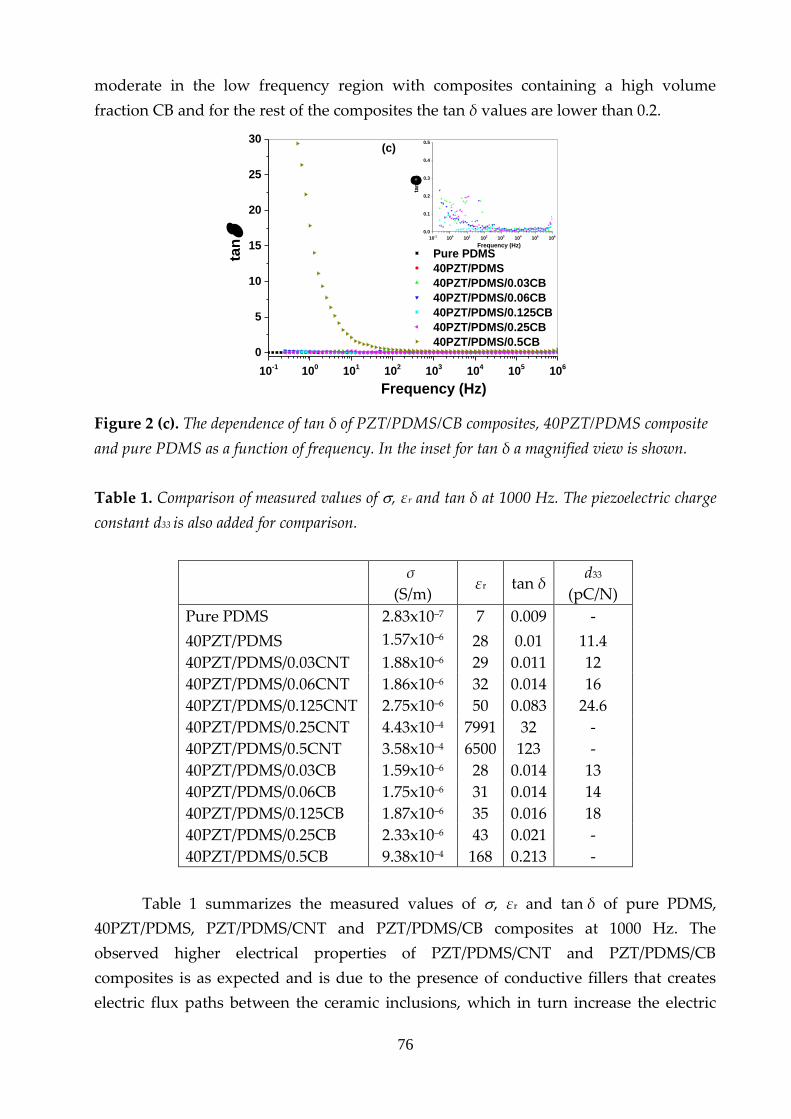
76
moderate in the low frequency region with composites containing a high volume
fraction CB and for the rest of the composites the tan δ values are lower than 0.2.
10-1
100
101
102
103
104
105
106
0
5
10
15
20
25
30
10-1
100
101
102
103
104
105
106
0.0
0.1
0.2
0.3
0.4
0.5
Frequency (Hz)
tan
Pure PDMS
40PZT/PDMS
40PZT/PDMS/0.03CB
40PZT/PDMS/0.06CB
40PZT/PDMS/0.125CB
40PZT/PDMS/0.25CB
40PZT/PDMS/0.5CB
Frequency (Hz)
tan
(c)
Figure 2 (c). The dependence of tan δ of PZT/PDMS/CB composites, 40PZT/PDMS composite
and pure PDMS as a function of frequency. In the inset for tan δ a magnified view is shown.
Table 1. Comparison of measured values of , εr and tan δ at 1000 Hz. The piezoelectric charge
constant d33 is also added for comparison.
σ
(S/m) εr tan δ
d33
(pC/N)
Pure PDMS 2.83x10⁻⁷ 7 0.009 -
40PZT/PDMS 1.57x10⁻⁶ 28 0.01 11.4
40PZT/PDMS/0.03CNT 1.88x10⁻⁶ 29 0.011 12
40PZT/PDMS/0.06CNT 1.86x10⁻⁶ 32 0.014 16
40PZT/PDMS/0.125CNT 2.75x10⁻⁶ 50 0.083 24.6
40PZT/PDMS/0.25CNT 4.43x10⁻⁴ 7991 32 -
40PZT/PDMS/0.5CNT 3.58x10⁻⁴ 6500 123 -
40PZT/PDMS/0.03CB 1.59x10⁻⁶ 28 0.014 13
40PZT/PDMS/0.06CB 1.75x10⁻⁶ 31 0.014 14
40PZT/PDMS/0.125CB 1.87x10⁻⁶ 35 0.016 18
40PZT/PDMS/0.25CB 2.33x10⁻⁶ 43 0.021 -
40PZT/PDMS/0.5CB 9.38x10⁻⁴ 168 0.213 -
Table 1 summarizes the measured values of , εr and tan δ of pure PDMS,
40PZT/PDMS, PZT/PDMS/CNT and PZT/PDMS/CB composites at 1000 Hz. The
observed higher electrical properties of PZT/PDMS/CNT and PZT/PDMS/CB
composites is as expected and is due to the presence of conductive fillers that creates
electric flux paths between the ceramic inclusions, which in turn increase the electric

77
field enabling improved poling efficiency. The PZT/PDMS/CNT composites exhibited
an abrupt increase in electrical properties above 0.125 vol.% CNTs indicating that a
percolation threshold is reached between 0.125 and 0.25 vol. % CNTs, while for the
PZT/PDMS/CB composites the percolation threshold is reached in between 0.25 and 0.5
vol.% CB. The obtained percolation threshold is in accordance with the previous results
[17, 19].
The frequency dependence of the permittivity r of these composites shows a
power law dependence, i.e. r ~ u1, where is the angular frequency and u an
exponent with value between 0 and 1. A value of u = 0.7 is indicative for the presence of
a percolating network [28-29]. We limited the fit range on the low side to 100 Hz since
below that frequency a plateau is present, starting at ~ 50 Hz for the CNT composites
and ~ 5 Hz for the CB composites. As shown in figure 3, for the optimum volume
fractions the exponent u = 0.95 for the CNT composite and u = 0.85 for the CB
composites. This indicates that the conductive fillers do not result in an ideal
percolation network, as probably could have been expected. Nevertheless the
homogeneity of the conductive network is sufficiently good that an improved poling
can be realized.
102
103
104
105
106
50
100
150
200
250
300
Frequency (Hz)
r
40PZT/PDMS/0.125CNT, u = 0.96
40PZT/PDMS/0.5CB, u = 0.86
Linear fit
Figure 3. Frequency dependence of the permittivity and line fit.
Several investigators also reported similar results of obtaining a high ac
conductivity and relative permittivity εr for slightly conductive composites.
Rujijanagul et al. [16] and Liu et al. [4] reported that the presence of conductive phase
creates a better conduction path between piezoelectric particles leading to better poling
efficiency which enhances the dielectric properties. A similar result of obtaining a high
conductivity with the presence of CNTs was reported by Lisunova et al. [30]. Using

78
CNTs, a percolation threshold can be achieved at a very low concentration, much lower
than for CB. This sharp enhancement of conductivity with CNTs incorporated
composites is due to the high aspect ratio and specific surface areas of the CNTs.
4.3.2. Piezoelectric properties
Figure 4 shows the dependence of the piezoelectric charge constant d33 of 40PZT/PDMS
and PZT/PDMS composites containing CNTs and CB with a varying volume fraction of
0.03, 0.06 and 0.125. For the pure 40PZT/PDMS composite the obtained d33 is 11.4 pC/N.
It is observed that the presence of conductive fillers enhances the piezoelectric charge
constant, where the 40PZT/PDMS/CNT composites show a larger effect than
40PZT/PDMS/CB composites. The d33 of 40PZT/PDMS/CNT composites increases from
11.4 to 24.6 and from 11.4 to 18 for 40PZT/PDMS/CB composites. This increase in d33 is
probably due to the presence of the conductive fillers that reduce the effective polymer
resistivity thus leading to a more effective poling of the ceramic.
40 PZT-PDMS CF 0.03 CF 0.06 CF 0.1250
5
10
15
20
25
30
CNTs
CB
d3
3 (
pC
/N)
Volume fraction (%)
Figure 4. Dependence of d33 of PZT/PDMS composites containing conductive fillers (CF).
4.3.3. Morphology
Sakamoto et al. [23] reported similar results of enhancing the piezoelectric effect with
the presence of conductive fillers by creating a continuous electric flux path between the
PZT grains during poling. Twiney et al. [8] reported that the doping of polymer
composites with conductive fillers reduces the effective polymer resistivity but that this
also has the effect of increasing the material dielectric loss. Levi et al. [31] observed an
enhancement in piezoelectric behavior with the CNTs inclusion in the PVDF/nanotube
blends.
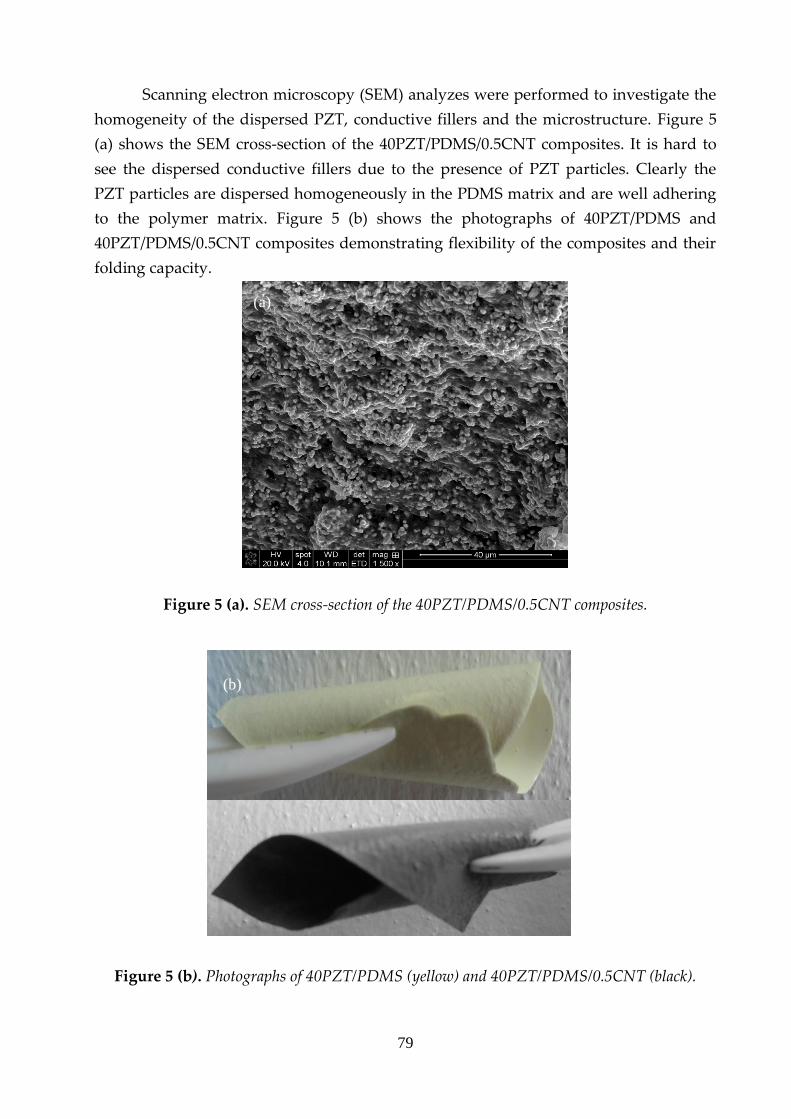
79
Scanning electron microscopy (SEM) analyzes were performed to investigate the
homogeneity of the dispersed PZT, conductive fillers and the microstructure. Figure 5
(a) shows the SEM cross-section of the 40PZT/PDMS/0.5CNT composites. It is hard to
see the dispersed conductive fillers due to the presence of PZT particles. Clearly the
PZT particles are dispersed homogeneously in the PDMS matrix and are well adhering
to the polymer matrix. Figure 5 (b) shows the photographs of 40PZT/PDMS and
40PZT/PDMS/0.5CNT composites demonstrating flexibility of the composites and their
folding capacity.
Figure 5 (a). SEM cross-section of the 40PZT/PDMS/0.5CNT composites.
Figure 5 (b). Photographs of 40PZT/PDMS (yellow) and 40PZT/PDMS/0.5CNT (black).
(a)
(b)
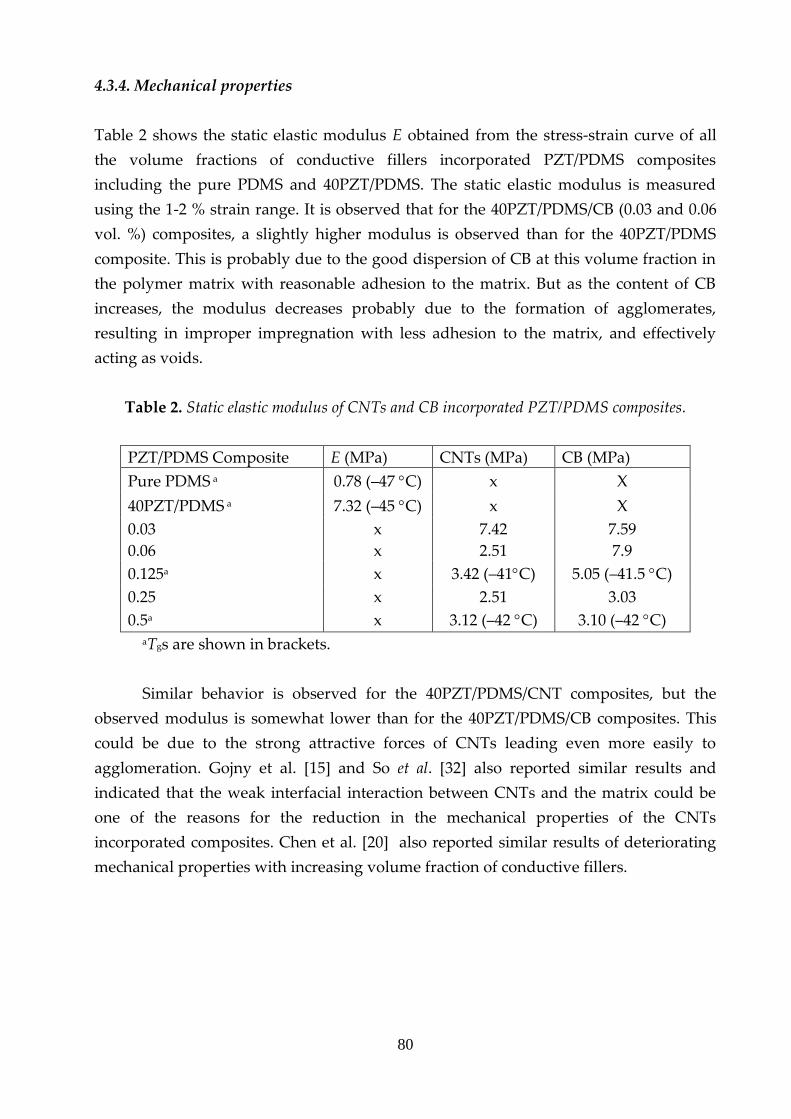
80
4.3.4. Mechanical properties
Table 2 shows the static elastic modulus E obtained from the stress-strain curve of all
the volume fractions of conductive fillers incorporated PZT/PDMS composites
including the pure PDMS and 40PZT/PDMS. The static elastic modulus is measured
using the 1-2 % strain range. It is observed that for the 40PZT/PDMS/CB (0.03 and 0.06
vol. %) composites, a slightly higher modulus is observed than for the 40PZT/PDMS
composite. This is probably due to the good dispersion of CB at this volume fraction in
the polymer matrix with reasonable adhesion to the matrix. But as the content of CB
increases, the modulus decreases probably due to the formation of agglomerates,
resulting in improper impregnation with less adhesion to the matrix, and effectively
acting as voids.
Table 2. Static elastic modulus of CNTs and CB incorporated PZT/PDMS composites.
PZT/PDMS Composite E (MPa) CNTs (MPa) CB (MPa)
Pure PDMS a 0.78 (–47 C) x X
40PZT/PDMS a 7.32 (–45 C) x X
0.03 x 7.42 7.59
0.06 x 2.51 7.9
0.125a x 3.42 (–41C) 5.05 (–41.5 C)
0.25 x 2.51 3.03
0.5a x 3.12 (–42 C) 3.10 (–42 C) aTgs are shown in brackets.
Similar behavior is observed for the 40PZT/PDMS/CNT composites, but the
observed modulus is somewhat lower than for the 40PZT/PDMS/CB composites. This
could be due to the strong attractive forces of CNTs leading even more easily to
agglomeration. Gojny et al. [15] and So et al. [32] also reported similar results and
indicated that the weak interfacial interaction between CNTs and the matrix could be
one of the reasons for the reduction in the mechanical properties of the CNTs
incorporated composites. Chen et al. [20] also reported similar results of deteriorating
mechanical properties with increasing volume fraction of conductive fillers.
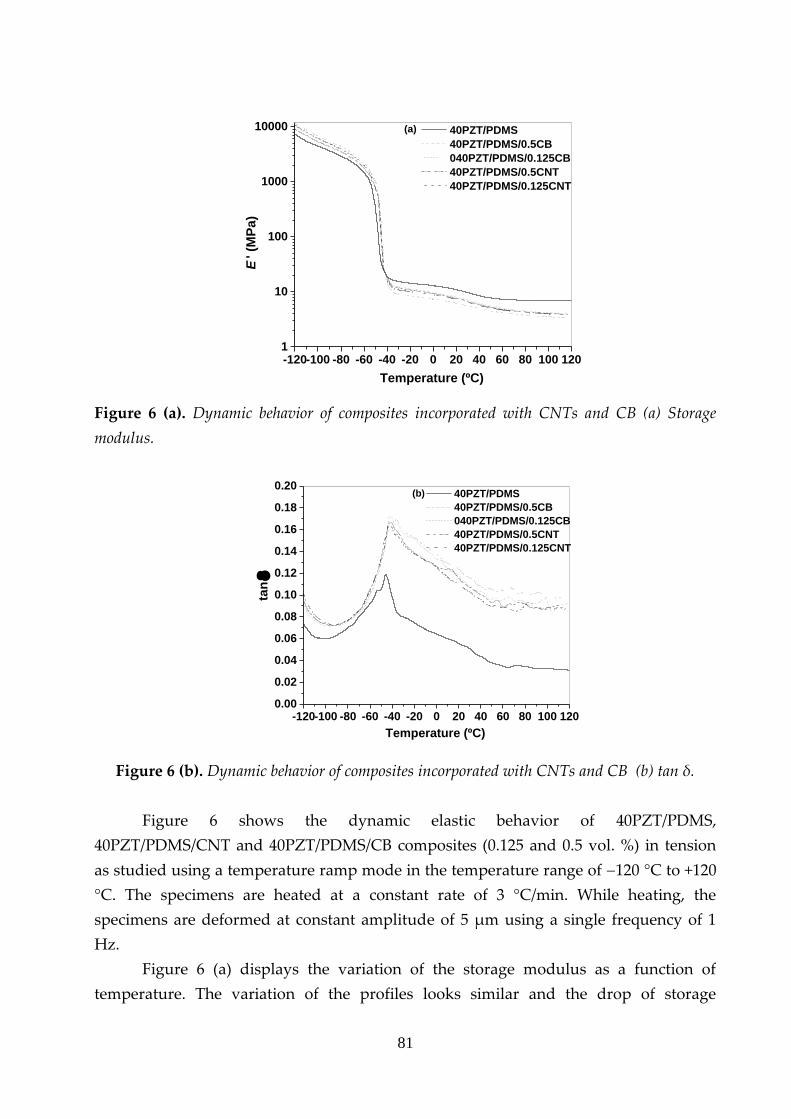
81
-120-100 -80 -60 -40 -20 0 20 40 60 80 100 1201
10
100
1000
10000 40PZT/PDMS
40PZT/PDMS/0.5CB
040PZT/PDMS/0.125CB
40PZT/PDMS/0.5CNT
40PZT/PDMS/0.125CNT
E '
(MP
a)
Temperature (ºC)
(a)
Figure 6 (a). Dynamic behavior of composites incorporated with CNTs and CB (a) Storage
modulus.
-120-100 -80 -60 -40 -20 0 20 40 60 80 100 1200.00
0.02
0.04
0.06
0.08
0.10
0.12
0.14
0.16
0.18
0.20
tan
Temperature (ºC)
40PZT/PDMS
40PZT/PDMS/0.5CB
040PZT/PDMS/0.125CB
40PZT/PDMS/0.5CNT
40PZT/PDMS/0.125CNT
(b)
Figure 6 (b). Dynamic behavior of composites incorporated with CNTs and CB (b) tan δ.
Figure 6 shows the dynamic elastic behavior of 40PZT/PDMS,
40PZT/PDMS/CNT and 40PZT/PDMS/CB composites (0.125 and 0.5 vol. %) in tension
as studied using a temperature ramp mode in the temperature range of 120 °C to +120
°C. The specimens are heated at a constant rate of 3 °C/min. While heating, the
specimens are deformed at constant amplitude of 5 μm using a single frequency of 1
Hz.
Figure 6 (a) displays the variation of the storage modulus as a function of
temperature. The variation of the profiles looks similar and the drop of storage
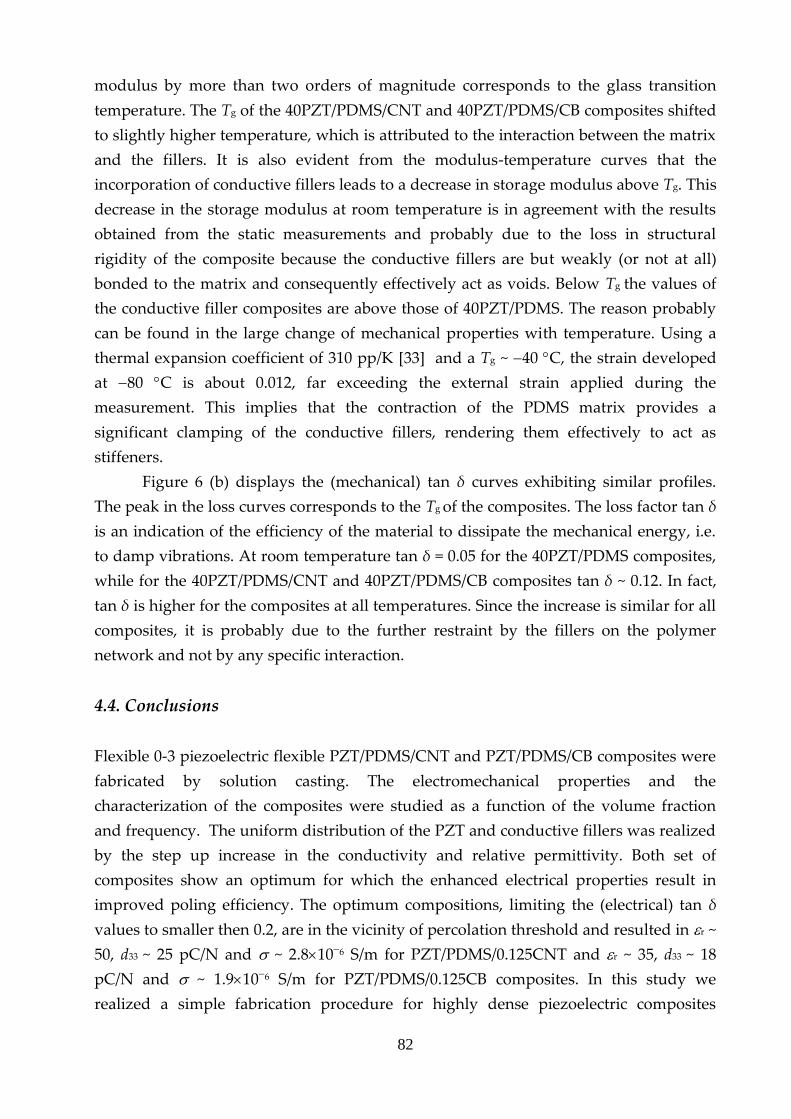
82
modulus by more than two orders of magnitude corresponds to the glass transition
temperature. The Tg of the 40PZT/PDMS/CNT and 40PZT/PDMS/CB composites shifted
to slightly higher temperature, which is attributed to the interaction between the matrix
and the fillers. It is also evident from the modulus-temperature curves that the
incorporation of conductive fillers leads to a decrease in storage modulus above Tg. This
decrease in the storage modulus at room temperature is in agreement with the results
obtained from the static measurements and probably due to the loss in structural
rigidity of the composite because the conductive fillers are but weakly (or not at all)
bonded to the matrix and consequently effectively act as voids. Below Tg the values of
the conductive filler composites are above those of 40PZT/PDMS. The reason probably
can be found in the large change of mechanical properties with temperature. Using a
thermal expansion coefficient of 310 pp/K [33] and a Tg ~ 40 C, the strain developed
at 80 C is about 0.012, far exceeding the external strain applied during the
measurement. This implies that the contraction of the PDMS matrix provides a
significant clamping of the conductive fillers, rendering them effectively to act as
stiffeners.
Figure 6 (b) displays the (mechanical) tan δ curves exhibiting similar profiles.
The peak in the loss curves corresponds to the Tg of the composites. The loss factor tan δ
is an indication of the efficiency of the material to dissipate the mechanical energy, i.e.
to damp vibrations. At room temperature tan δ = 0.05 for the 40PZT/PDMS composites,
while for the 40PZT/PDMS/CNT and 40PZT/PDMS/CB composites tan δ ~ 0.12. In fact,
tan δ is higher for the composites at all temperatures. Since the increase is similar for all
composites, it is probably due to the further restraint by the fillers on the polymer
network and not by any specific interaction.
4.4. Conclusions
Flexible 0-3 piezoelectric flexible PZT/PDMS/CNT and PZT/PDMS/CB composites were
fabricated by solution casting. The electromechanical properties and the
characterization of the composites were studied as a function of the volume fraction
and frequency. The uniform distribution of the PZT and conductive fillers was realized
by the step up increase in the conductivity and relative permittivity. Both set of
composites show an optimum for which the enhanced electrical properties result in
improved poling efficiency. The optimum compositions, limiting the (electrical) tan δ
values to smaller then 0.2, are in the vicinity of percolation threshold and resulted in r ~
50, d33 ~ 25 pC/N and ~ 2.8106 S/m for PZT/PDMS/0.125CNT and r ~ 35, d33 ~ 18
pC/N and ~ 1.9106 S/m for PZT/PDMS/0.125CB composites. In this study we
realized a simple fabrication procedure for highly dense piezoelectric composites
83
containing CNTs and CB with a combination of high dielectric constant and low
dielectric loss. The advancement in properties of this multifunctional composite
material provides much benefit over other types of 0-3 piezoelectric composites in terms
of relative permittivity and piezo-electric charge constant.
Acknowledgements
This work was financially supported by the Smartmix funding program (grant
SMVA06071), as part of the program “Smart systems based on integrated Piezo”. The
authors are grateful to Morgan Electro Ceramics (Ruabon, UK) for providing the PZT
powder used in this research and to Dr. Daan van den Ende, Dr. Pim Groen (TNO,
Eindhoven) and Prof. Sybrand van der Zwaag (Novel Aerospace Materials Group, Delft
University of Technology) for fruitful discussions.
References
[1] X. Chen, S. Xu, N. Yao and Y. Shi, Nano Lett., 2010, 10 (6), p. 2133-2137.
[2] Y. Lin and H.A. Sodano, Adv. Funct. Mater., 2009, 19 (4), p. 592-598.
[3] Y. Qi, N.T. Jafferis, K. Lyons, C.M. Lee and H.Ahmad, and M.C. McAlpine,Nano Lett.
2010, 10 (2), p. 524-528.
[4] X.F. Liu, C.X. Xiong, H.J. Sun, L.J. Dong,R. Li, and Y. Liu, Materials Science and
Engineering: B 2006, 127 (2-3), p. 261-266.
[5] I. Babu, D. A. v. d. Ende and G. de. With, J. Phys. D: Appl. Phys. 2010, 43 (42), 425402.
[6] G.L. Brennecka, C.M. Parish, B.A. Tuttle, L.N. Brewer, amd M.A. Rodriguez, Adv. Mater.
2008, 20 (8), p. 1407-1411.
[7] P. Moetakef and Z.A. Nemati, J. Alloys Compd. 2009, 476 (1-2), p. 791-796.
[8] R.C. Twiney, Adv. Mater. 1992, 4 (12), p. 819-822.
[9] C.B. Yoon, S.H. Lee, S.M. Lee, Y.H. Koh, H.E. Kim, and K.W. Lee, J. Am. Ceram. Soc.
2006, 89 (8), p. 2509-2513.
[10] R.E. Newnham, D.P. Skinner and L.E. Cross, Mater. Res. Bull. 1978, 13 (5), p. 525-536.
[11] N. Jayasundere and B.V. Smith, J. Appl. Phys. 1993, 73 (5), p. 2462-2466.
[12] T. Furukawa, K. Fujino, and E. Fukada, Japanese Journal of Applied Physics 1976, 15 (11), p.
2119-2129.
[13] T. Yamada, T. Ueda and T. Kitayama, J. Appl. Phys. 1982, 53 (6), p. 4328-4332.
[14] S. Tian and X. Wang, Journal of Materials Science 2008, 43 (14),p. 4979-4987.
[15] F.H. Gojny, M.H.G. Wichmann, B. Fiedler and K. Schulte, Composites Science and
Technology 2005, 65 (15-16), p. 2300-2313.
[16] G. Rujijanagul, S. Jompruan and A. Chaipanich, Curr. Appl. Phys. 2008, 8 (3-4), p. 359-362
[17] S. Banerjee and K.A. Cook-Chennault, Composites Part A: Applied Science and
Manufacturing 2012, 43 (9), 1612-1619.

84
[18] H. Gong, Y. Zhang, J. Quan and S. Che, Curr. Appl. Phys. 2011, 11 (3), p. 653-656.
[19] M. Ma and X. Wang, Mater. Chem. Phys. 2009, 116 (1), p. 191-197.
[20] G. Chen, B. Yang, S. Guo, Journal of Applied Polymer Science 2009, 114 (3), p. 1848-1855.
[21] H. Gong, Z. Li, Y. Zhang and R. Fan, J. Eur. Ceram. Soc. 2009, 29, p. 2013-2019.
[22] M. Knite, V. Teteris, A. Kiploka and J. Kaupuzs, Sensors and Actuators A: Physical 2004,
110, p. 142-149.
[23] W.K. Sakamoto, E.d. Souza and D.K. Das-Gupta, Materials Research 2001, 4, p. 201-204.
[24] I. Babu and G. de. With, Composites Science and Technology. 2013; Submitted.
[25] S.H. Yao, Z.M. Dang, M.J. Jiang and J. Bai, Appl. Phys. Lett. 2008, 93 (18).
[26] J.K. Yuan, W.L. Li, S.H. Yao, Y.Q. Lin and A. Sylvestre, J. Appl. Phys. Lett. 2011, 98 (3).
[27] Z.M. Dang, S.H. Yao, J.K. Yuan and J. Bai, The Journal of Physical Chemistry C 2010, 114
(31), p. 13204-13209.
[28] L. Wang and Z.M. Dang, Appl. Phys. Lett. 2005, 87 (4), 042903.
[29] Q. Chen, P. Du, L. Jin, W. Weng and G. Han, Appl. Phys. Lett. 2007, 91 (3), 022912.
[30] M.O. Lisunova, Y. P. Mamunya, N.I. Lebovka and A.V. Melezhyk, Eur. Polym. J. 2007, 43
(3), p. 949-958.
[31] N. Levi, R. Czerw, S. Xing, P. Iyer and D.L. Carroll, Nano Lett. 2004, 4 (7), p. 1267-1271
[32] H.H. So, J.W. Cho and N.G. Sahoo, Eur. Polym. J. 2007, 43 (9), p. 3750-3756.
[33] CTE data available at http://www.dowcorning.com.
85
Chapter 5
Design, fabrication and performance analysis of
piezoelectric PZT composite bimorphs*
A disc type reinforced piezoelectric composite bimorphs with series connection
was designed and the performance was investigated. The composite bimorphs
(PZT/PA and PZT/PDMS (40/60 vol.%)) were successfully fabricated by
compression molding and solution casting technique. The charge developed at
an applied force of 150 N is 18150 pC (PZT/PA) and 2310 pC (PZT/PDMS),
respectively. Electric force microscopy (EFM) is used to study the structural
characterization and the piezoelectric properties of the materials realized. A clear
inverse piezoelectric effect was observed when the bimorphs were subjected to
an electric field stepped up through 2, 6 and 10 V, indicating the net polarization
direction of the different ferroelectric domains. The as-developed bimorphs have
the basic structure of a sensor and actuator and since they do not use any
bonding agent for bonding, they can provide a valuable alternative to the present
bimorphs where bonding processes required for their realization, can limit the
application at high temperature.
*This chapter has been submitted for publication as: I. Babu, M. M. R. M. Hendrix and G. de With,
"Design, fabrication and performance analysis of piezoelectric PZT composite bimorphs,” Smart
Materials and Structures (2013).

86
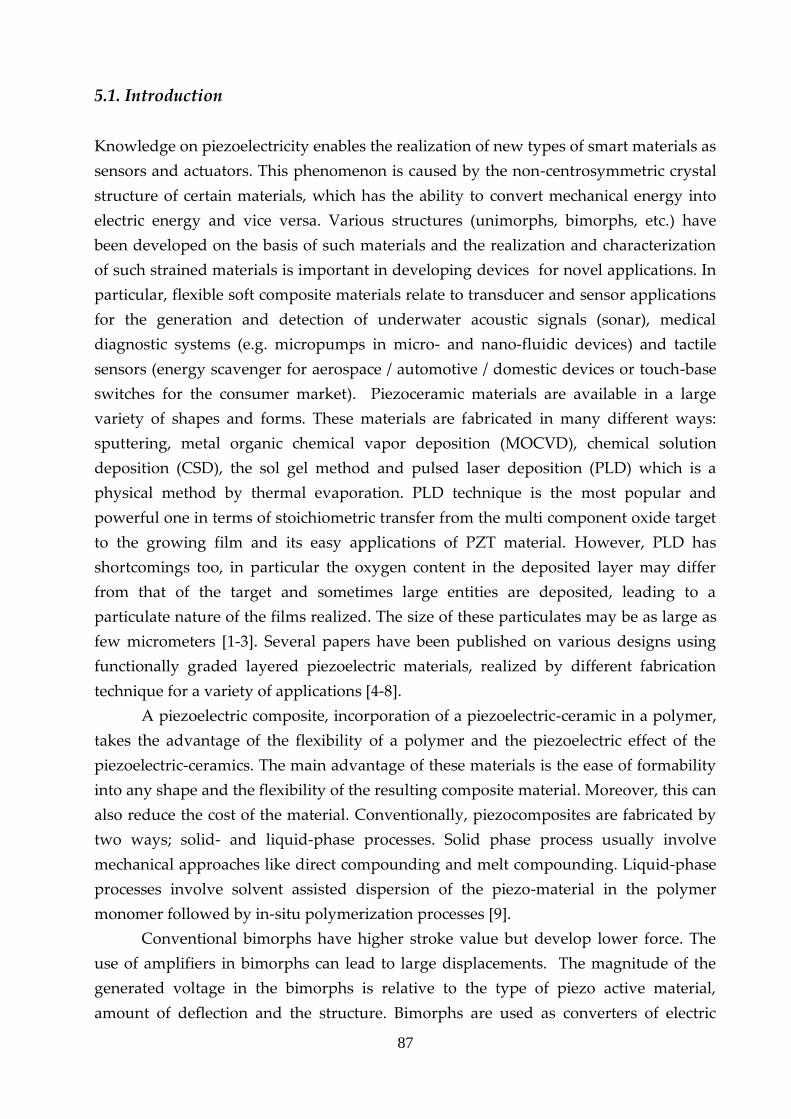
87
5.1. Introduction
Knowledge on piezoelectricity enables the realization of new types of smart materials as
sensors and actuators. This phenomenon is caused by the non-centrosymmetric crystal
structure of certain materials, which has the ability to convert mechanical energy into
electric energy and vice versa. Various structures (unimorphs, bimorphs, etc.) have
been developed on the basis of such materials and the realization and characterization
of such strained materials is important in developing devices for novel applications. In
particular, flexible soft composite materials relate to transducer and sensor applications
for the generation and detection of underwater acoustic signals (sonar), medical
diagnostic systems (e.g. micropumps in micro- and nano-fluidic devices) and tactile
sensors (energy scavenger for aerospace / automotive / domestic devices or touch-base
switches for the consumer market). Piezoceramic materials are available in a large
variety of shapes and forms. These materials are fabricated in many different ways:
sputtering, metal organic chemical vapor deposition (MOCVD), chemical solution
deposition (CSD), the sol gel method and pulsed laser deposition (PLD) which is a
physical method by thermal evaporation. PLD technique is the most popular and
powerful one in terms of stoichiometric transfer from the multi component oxide target
to the growing film and its easy applications of PZT material. However, PLD has
shortcomings too, in particular the oxygen content in the deposited layer may differ
from that of the target and sometimes large entities are deposited, leading to a
particulate nature of the films realized. The size of these particulates may be as large as
few micrometers [1-3]. Several papers have been published on various designs using
functionally graded layered piezoelectric materials, realized by different fabrication
technique for a variety of applications [4-8].
A piezoelectric composite, incorporation of a piezoelectric-ceramic in a polymer,
takes the advantage of the flexibility of a polymer and the piezoelectric effect of the
piezoelectric-ceramics. The main advantage of these materials is the ease of formability
into any shape and the flexibility of the resulting composite material. Moreover, this can
also reduce the cost of the material. Conventionally, piezocomposites are fabricated by
two ways; solid- and liquid-phase processes. Solid phase process usually involve
mechanical approaches like direct compounding and melt compounding. Liquid-phase
processes involve solvent assisted dispersion of the piezo-material in the polymer
monomer followed by in-situ polymerization processes [9].
Conventional bimorphs have higher stroke value but develop lower force. The
use of amplifiers in bimorphs can lead to large displacements. The magnitude of the
generated voltage in the bimorphs is relative to the type of piezo active material,
amount of deflection and the structure. Bimorphs are used as converters of electric
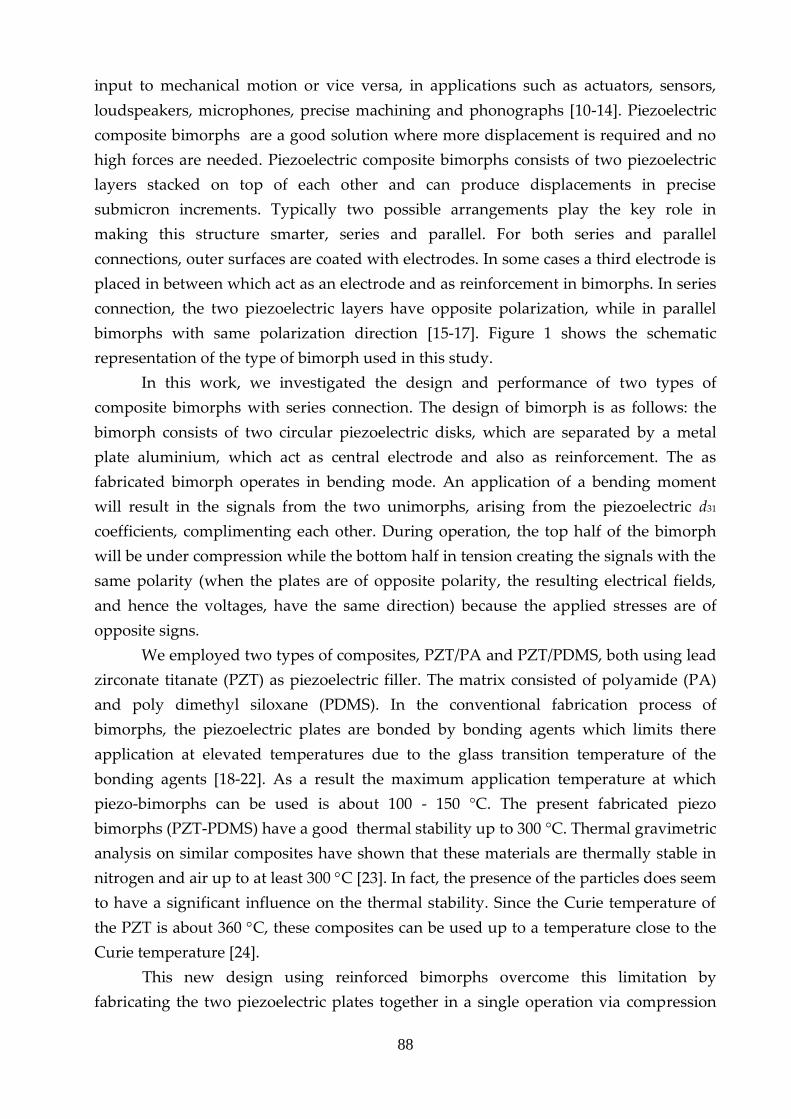
88
input to mechanical motion or vice versa, in applications such as actuators, sensors,
loudspeakers, microphones, precise machining and phonographs [10-14]. Piezoelectric
composite bimorphs are a good solution where more displacement is required and no
high forces are needed. Piezoelectric composite bimorphs consists of two piezoelectric
layers stacked on top of each other and can produce displacements in precise
submicron increments. Typically two possible arrangements play the key role in
making this structure smarter, series and parallel. For both series and parallel
connections, outer surfaces are coated with electrodes. In some cases a third electrode is
placed in between which act as an electrode and as reinforcement in bimorphs. In series
connection, the two piezoelectric layers have opposite polarization, while in parallel
bimorphs with same polarization direction [15-17]. Figure 1 shows the schematic
representation of the type of bimorph used in this study.
In this work, we investigated the design and performance of two types of
composite bimorphs with series connection. The design of bimorph is as follows: the
bimorph consists of two circular piezoelectric disks, which are separated by a metal
plate aluminium, which act as central electrode and also as reinforcement. The as
fabricated bimorph operates in bending mode. An application of a bending moment
will result in the signals from the two unimorphs, arising from the piezoelectric d31
coefficients, complimenting each other. During operation, the top half of the bimorph
will be under compression while the bottom half in tension creating the signals with the
same polarity (when the plates are of opposite polarity, the resulting electrical fields,
and hence the voltages, have the same direction) because the applied stresses are of
opposite signs.
We employed two types of composites, PZT/PA and PZT/PDMS, both using lead
zirconate titanate (PZT) as piezoelectric filler. The matrix consisted of polyamide (PA)
and poly dimethyl siloxane (PDMS). In the conventional fabrication process of
bimorphs, the piezoelectric plates are bonded by bonding agents which limits there
application at elevated temperatures due to the glass transition temperature of the
bonding agents [18-22]. As a result the maximum application temperature at which
piezo-bimorphs can be used is about 100 - 150 °C. The present fabricated piezo
bimorphs (PZT-PDMS) have a good thermal stability up to 300 °C. Thermal gravimetric
analysis on similar composites have shown that these materials are thermally stable in
nitrogen and air up to at least 300 C [23]. In fact, the presence of the particles does seem
to have a significant influence on the thermal stability. Since the Curie temperature of
the PZT is about 360 C, these composites can be used up to a temperature close to the
Curie temperature [24].
This new design using reinforced bimorphs overcome this limitation by
fabricating the two piezoelectric plates together in a single operation via compression
89
molding (PZT/PA) and adhesion by solution casting (PZT/PDMS). These bimorphs
have the basic structure of a sensor and/or actuator and have several advantages over
other types of bimorphs that is the flexibility of obtaining different sizes and shapes due
to easy processing and the possibility of tailoring the properties by varying the volume
fraction of the ceramic inclusions and the low price.
Figure 1. Schematic side-view of the bimorphs realized in this study and the loading
configuration using a ring support and central load for the charge measurement.
5.2. Experimental
5.2.1. Materials
The PZT powder used in this research is a commercial half-product PZT5A4 (Morgan
Electro Ceramics, Ruabon UK), a soft PZT with 1 mol% Nb added as dopant. Before use it
was thermally treated, as reported in [25] where further details can be found. The average
size of the filler is about 1.0 µm and the details of the filler size also can be found in [25].
The polymer used are polyamide PA 11 (Aldrich Chemical Company) and linear vinyl-
terminated poly (dimethylsiloxane) (PDMS17 with Mw = 17200 g/mol; ABCR GmbH & Co)
cross-linked with the four-functional siloxane, tetrakis(dimethylsiloxane) (ABCR GmbH &
Co). The hydrosilylation reactions were catalyzed by cisdichlorobis (diethylsulphide)
platinum (II) catalyst (Strem Chemicals, Inc) previously dissolved in a toluene solution.
Esteves et al. [26] reported on the details of the hydrosilylation addition reaction to obtain
cross-linked (tri-dimensional network) PDMS composites by reacting functional end
groups on the PDMS chains with a multifunctional cross-linker in the presence of a
90
catalyst. We used the same hydrosilylation addition reaction to realize the PZT-PDMS
composites [27].
5.2.2. Fabrication of composites
The disc type PZT/PA reinforced bimorphs with specific dimensions of 14 mm in
diameter and ~350 µm thickness with an aluminum foil as central electrode (thickness
15 µm) were fabricated by hot-pressing with an applied force of 100 kN for 15 minutes.
The disc type PZT/PDMS reinforced bimorphs with specific dimensions of 20 mm in
diameter and ~250 µm thickness with an aluminum foil as central electrode (thickness
15 µm) were fabricated by solution casting.
Figure 2. Fabricated (a) PZT/PA and (b) PZT/PDMS bimorphs with aluminum foil as central
electrode.
In brief, the materials PZT (40 vol. %) and PDMS (60 vol. %) were mixed in a
speed mixer (DAC 150 FVZ) at 3000 rpm for 2 minutes and the appropriate amount of
cross-linker is added and mixed again for 1 minute and finally the catalyst is added and
mixed for 1 minute. This mixture is directly solution casted on an aluminum foil and
subsequently dried and cured under vacuum initially at 60 C for 20 hours and at
110 C for 5 hours. The other side of aluminum foil (dried and cured with adhering
PZT/PDMS) is again solution casted with the same mixture as mentioned above and the
process is repeated. This process resulted in a PZT/PDMS bimorph in which the central
aluminium electrode is coated on both sides with the PZT/PDMS mixture. Using a
cutter the required shape of the bimorphs is realized, while the outer electrodes are
provided by sputter coating. Circular gold electrodes of thickness 30 nm and an area of
7.85x10⁵ m2 (PZT/PA) and 15.3x10⁵ m2 (PZT/PDMS) are sputtered on both sides of the
composites using an Edwards sputter coater (model S150B). The poling of the
(a) (b)
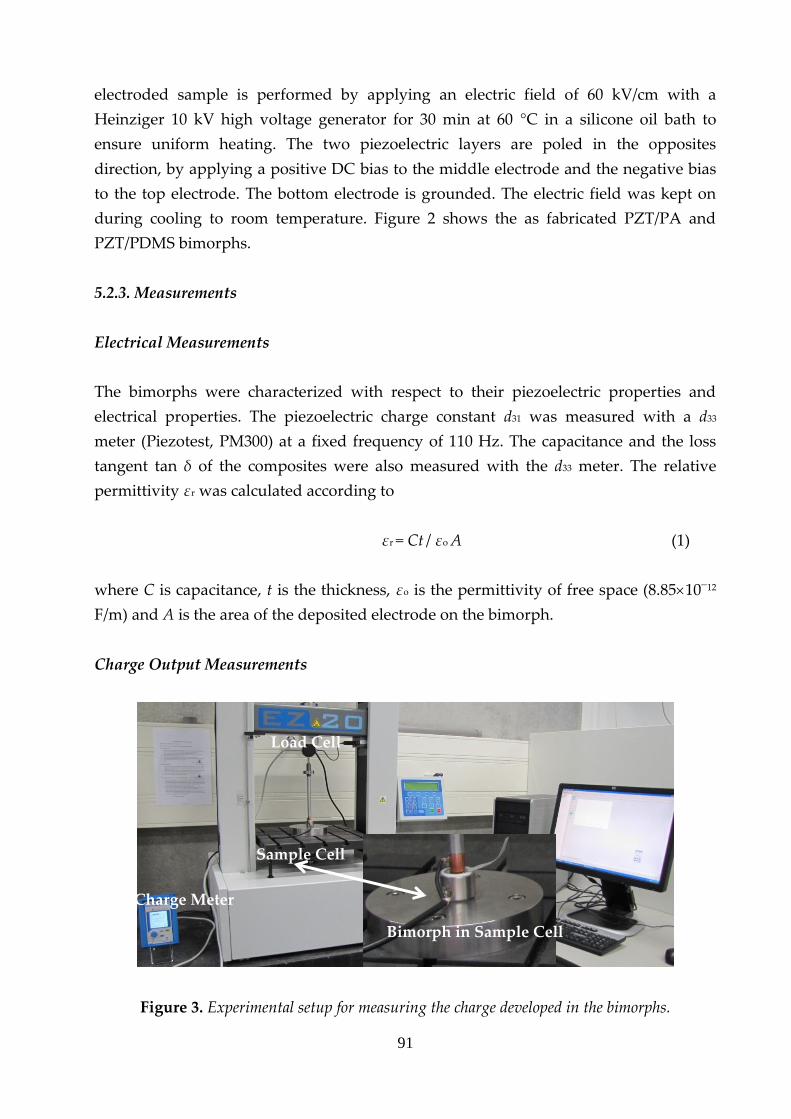
91
electroded sample is performed by applying an electric field of 60 kV/cm with a
Heinziger 10 kV high voltage generator for 30 min at 60 °C in a silicone oil bath to
ensure uniform heating. The two piezoelectric layers are poled in the opposites
direction, by applying a positive DC bias to the middle electrode and the negative bias
to the top electrode. The bottom electrode is grounded. The electric field was kept on
during cooling to room temperature. Figure 2 shows the as fabricated PZT/PA and
PZT/PDMS bimorphs.
5.2.3. Measurements
Electrical Measurements
The bimorphs were characterized with respect to their piezoelectric properties and
electrical properties. The piezoelectric charge constant d31 was measured with a d33
meter (Piezotest, PM300) at a fixed frequency of 110 Hz. The capacitance and the loss
tangent tan δ of the composites were also measured with the d33 meter. The relative
permittivity εr was calculated according to
εr = Ct / εo A (1)
where C is capacitance, t is the thickness, εo is the permittivity of free space (8.851012
F/m) and A is the area of the deposited electrode on the bimorph.
Charge Output Measurements
Figure 3. Experimental setup for measuring the charge developed in the bimorphs.
Load Cell
Sample Cell
Charge Meter
Bimorph in Sample Cell
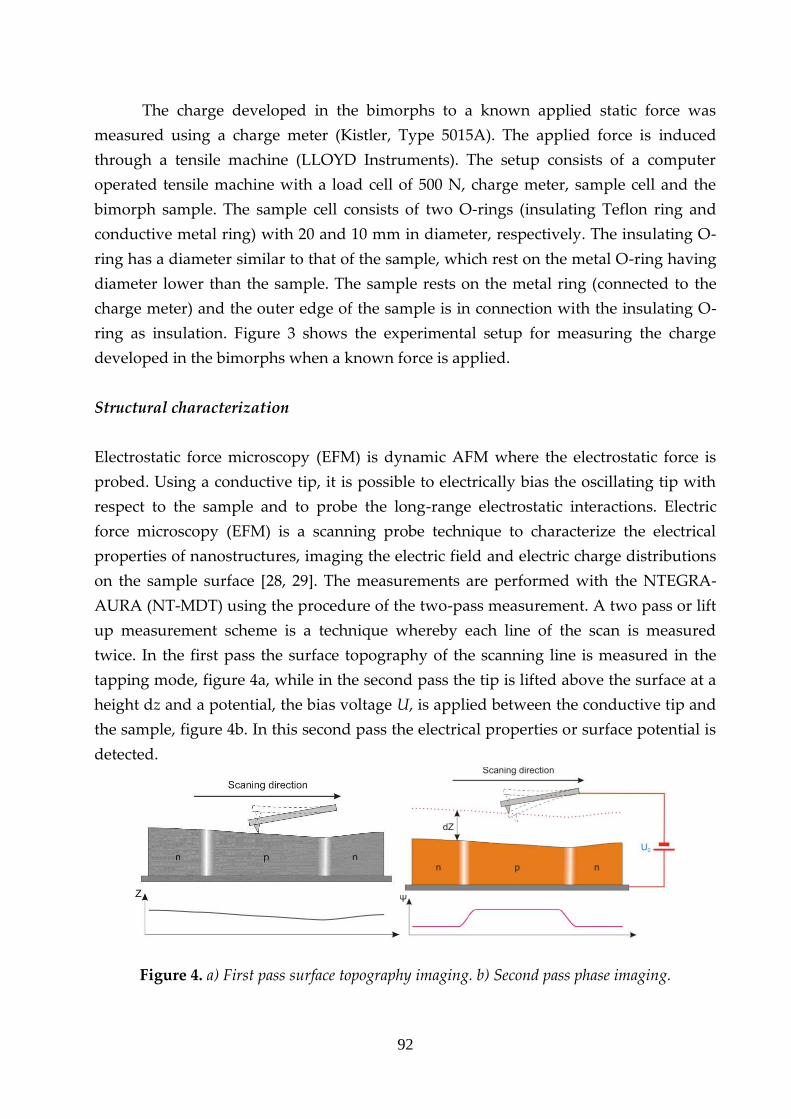
92
The charge developed in the bimorphs to a known applied static force was
measured using a charge meter (Kistler, Type 5015A). The applied force is induced
through a tensile machine (LLOYD Instruments). The setup consists of a computer
operated tensile machine with a load cell of 500 N, charge meter, sample cell and the
bimorph sample. The sample cell consists of two O-rings (insulating Teflon ring and
conductive metal ring) with 20 and 10 mm in diameter, respectively. The insulating O-
ring has a diameter similar to that of the sample, which rest on the metal O-ring having
diameter lower than the sample. The sample rests on the metal ring (connected to the
charge meter) and the outer edge of the sample is in connection with the insulating O-
ring as insulation. Figure 3 shows the experimental setup for measuring the charge
developed in the bimorphs when a known force is applied.
Structural characterization
Electrostatic force microscopy (EFM) is dynamic AFM where the electrostatic force is
probed. Using a conductive tip, it is possible to electrically bias the oscillating tip with
respect to the sample and to probe the long-range electrostatic interactions. Electric
force microscopy (EFM) is a scanning probe technique to characterize the electrical
properties of nanostructures, imaging the electric field and electric charge distributions
on the sample surface [28, 29]. The measurements are performed with the NTEGRA-
AURA (NT-MDT) using the procedure of the two-pass measurement. A two pass or lift
up measurement scheme is a technique whereby each line of the scan is measured
twice. In the first pass the surface topography of the scanning line is measured in the
tapping mode, figure 4a, while in the second pass the tip is lifted above the surface at a
height dz and a potential, the bias voltage U, is applied between the conductive tip and
the sample, figure 4b. In this second pass the electrical properties or surface potential is
detected.
Figure 4. a) First pass surface topography imaging. b) Second pass phase imaging.
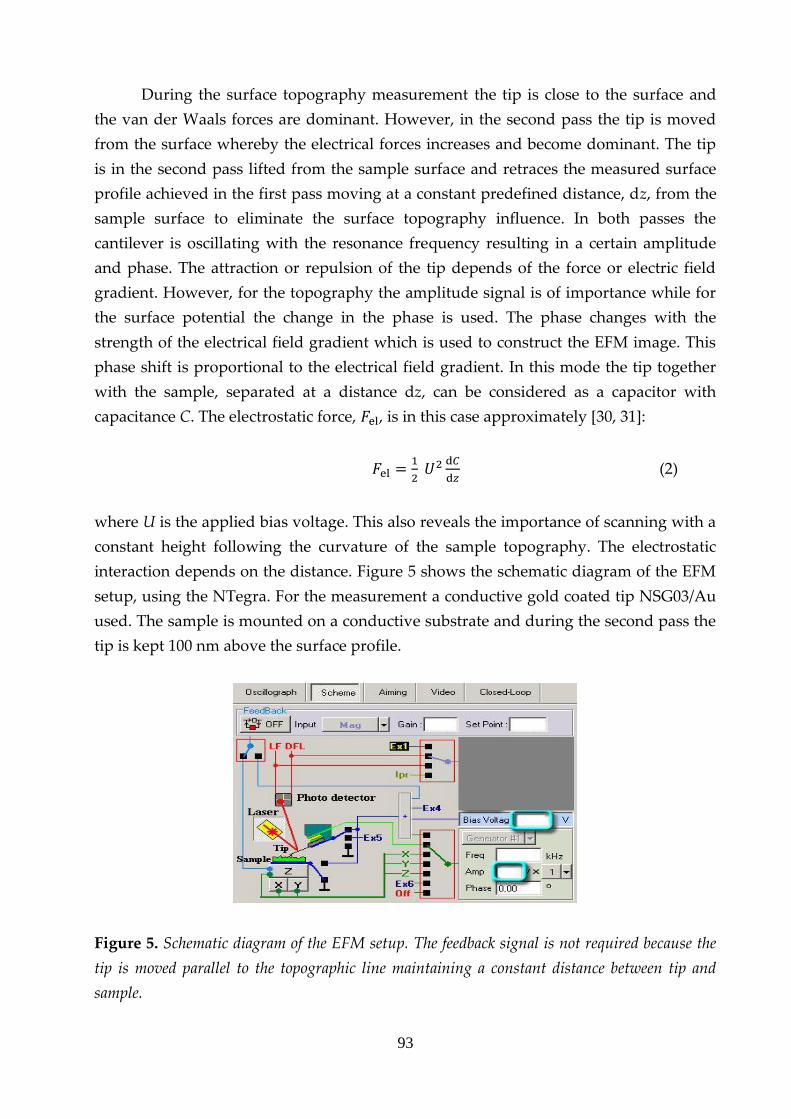
93
During the surface topography measurement the tip is close to the surface and
the van der Waals forces are dominant. However, in the second pass the tip is moved
from the surface whereby the electrical forces increases and become dominant. The tip
is in the second pass lifted from the sample surface and retraces the measured surface
profile achieved in the first pass moving at a constant predefined distance, dz, from the
sample surface to eliminate the surface topography influence. In both passes the
cantilever is oscillating with the resonance frequency resulting in a certain amplitude
and phase. The attraction or repulsion of the tip depends of the force or electric field
gradient. However, for the topography the amplitude signal is of importance while for
the surface potential the change in the phase is used. The phase changes with the
strength of the electrical field gradient which is used to construct the EFM image. This
phase shift is proportional to the electrical field gradient. In this mode the tip together
with the sample, separated at a distance dz, can be considered as a capacitor with
capacitance C. The electrostatic force, , is in this case approximately [30, 31]:
(2)
where U is the applied bias voltage. This also reveals the importance of scanning with a
constant height following the curvature of the sample topography. The electrostatic
interaction depends on the distance. Figure 5 shows the schematic diagram of the EFM
setup, using the NTegra. For the measurement a conductive gold coated tip NSG03/Au
used. The sample is mounted on a conductive substrate and during the second pass the
tip is kept 100 nm above the surface profile.
Figure 5. Schematic diagram of the EFM setup. The feedback signal is not required because the
tip is moved parallel to the topographic line maintaining a constant distance between tip and
sample.
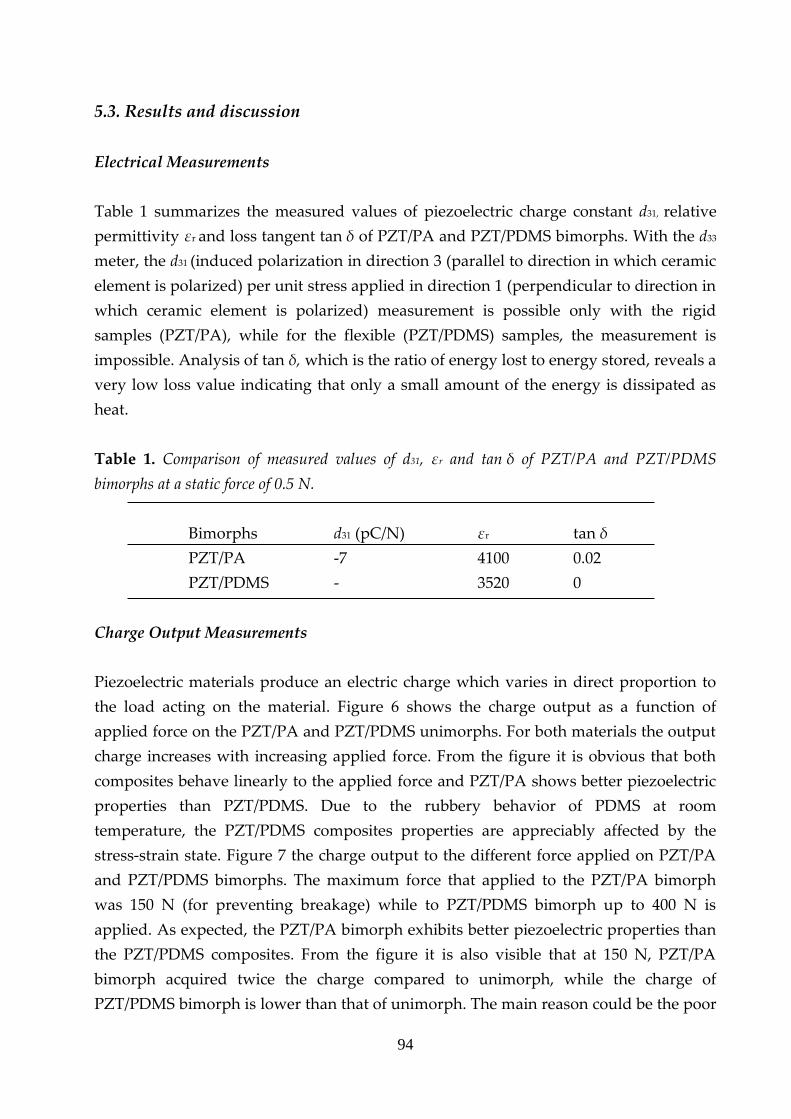
94
5.3. Results and discussion
Electrical Measurements
Table 1 summarizes the measured values of piezoelectric charge constant d31, relative
permittivity εr and loss tangent tan δ of PZT/PA and PZT/PDMS bimorphs. With the d33
meter, the d31 (induced polarization in direction 3 (parallel to direction in which ceramic
element is polarized) per unit stress applied in direction 1 (perpendicular to direction in
which ceramic element is polarized) measurement is possible only with the rigid
samples (PZT/PA), while for the flexible (PZT/PDMS) samples, the measurement is
impossible. Analysis of tan δ, which is the ratio of energy lost to energy stored, reveals a
very low loss value indicating that only a small amount of the energy is dissipated as
heat.
Table 1. Comparison of measured values of d31, εr and tan δ of PZT/PA and PZT/PDMS
bimorphs at a static force of 0.5 N.
Bimorphs d31 (pC/N) εr tan δ
PZT/PA -7 4100 0.02
PZT/PDMS - 3520 0
Charge Output Measurements
Piezoelectric materials produce an electric charge which varies in direct proportion to
the load acting on the material. Figure 6 shows the charge output as a function of
applied force on the PZT/PA and PZT/PDMS unimorphs. For both materials the output
charge increases with increasing applied force. From the figure it is obvious that both
composites behave linearly to the applied force and PZT/PA shows better piezoelectric
properties than PZT/PDMS. Due to the rubbery behavior of PDMS at room
temperature, the PZT/PDMS composites properties are appreciably affected by the
stress-strain state. Figure 7 the charge output to the different force applied on PZT/PA
and PZT/PDMS bimorphs. The maximum force that applied to the PZT/PA bimorph
was 150 N (for preventing breakage) while to PZT/PDMS bimorph up to 400 N is
applied. As expected, the PZT/PA bimorph exhibits better piezoelectric properties than
the PZT/PDMS composites. From the figure it is also visible that at 150 N, PZT/PA
bimorph acquired twice the charge compared to unimorph, while the charge of
PZT/PDMS bimorph is lower than that of unimorph. The main reason could be the poor
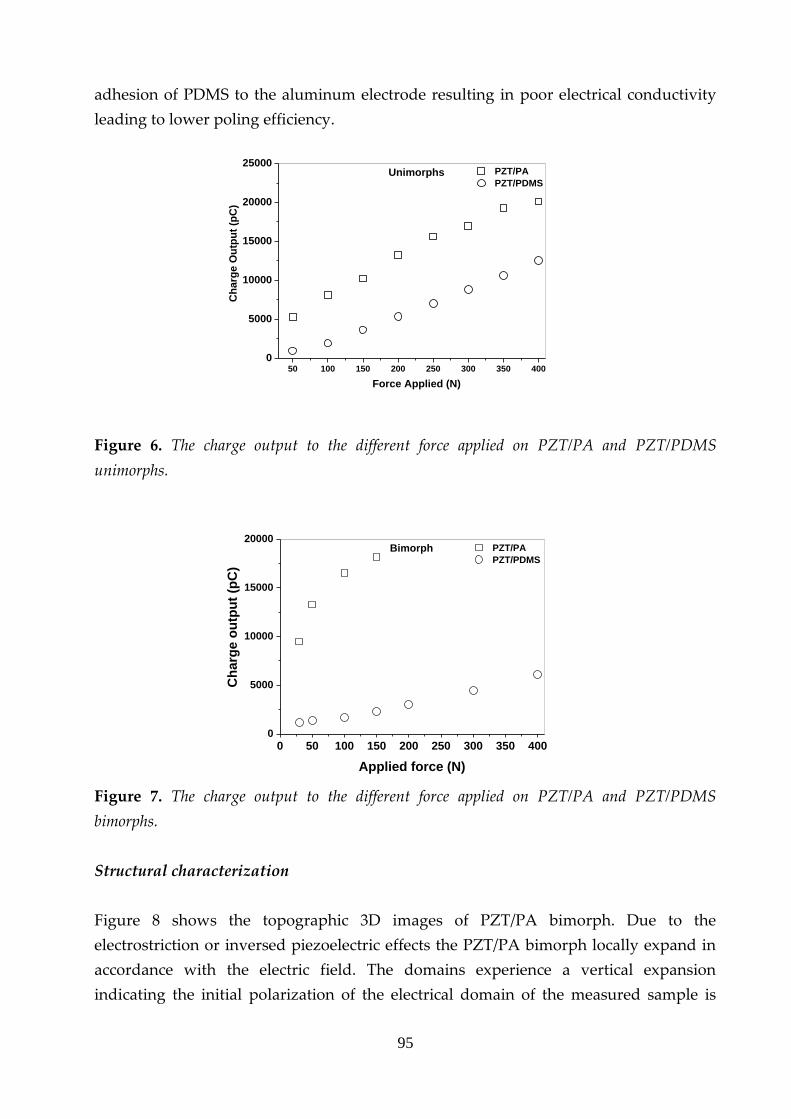
95
adhesion of PDMS to the aluminum electrode resulting in poor electrical conductivity
leading to lower poling efficiency.
50 100 150 200 250 300 350 400
0
5000
10000
15000
20000
25000 PZT/PA
PZT/PDMS
Ch
arg
e O
utp
ut
(pC
)
Force Applied (N)
Unimorphs
Figure 6. The charge output to the different force applied on PZT/PA and PZT/PDMS
unimorphs.
0 50 100 150 200 250 300 350 4000
5000
10000
15000
20000 PZT/PA
PZT/PDMS
Ch
arg
e o
utp
ut
(pC
)
Applied force (N)
Bimorph
Figure 7. The charge output to the different force applied on PZT/PA and PZT/PDMS
bimorphs.
Structural characterization
Figure 8 shows the topographic 3D images of PZT/PA bimorph. Due to the
electrostriction or inversed piezoelectric effects the PZT/PA bimorph locally expand in
accordance with the electric field. The domains experience a vertical expansion
indicating the initial polarization of the electrical domain of the measured sample is
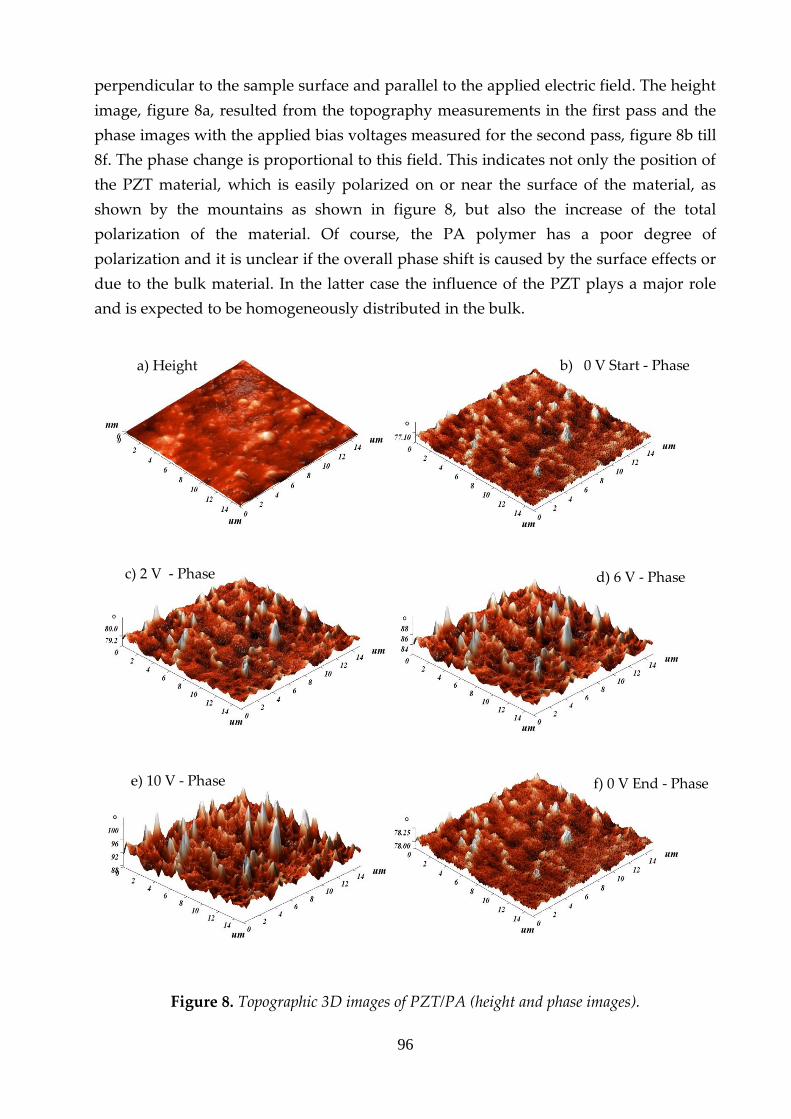
96
perpendicular to the sample surface and parallel to the applied electric field. The height
image, figure 8a, resulted from the topography measurements in the first pass and the
phase images with the applied bias voltages measured for the second pass, figure 8b till
8f. The phase change is proportional to this field. This indicates not only the position of
the PZT material, which is easily polarized on or near the surface of the material, as
shown by the mountains as shown in figure 8, but also the increase of the total
polarization of the material. Of course, the PA polymer has a poor degree of
polarization and it is unclear if the overall phase shift is caused by the surface effects or
due to the bulk material. In the latter case the influence of the PZT plays a major role
and is expected to be homogeneously distributed in the bulk.
Figure 8. Topographic 3D images of PZT/PA (height and phase images).
b) 0 V Start - Phase
c) 2 V - Phase d) 6 V - Phase
e) 10 V - Phase f) 0 V End - Phase
a) Height
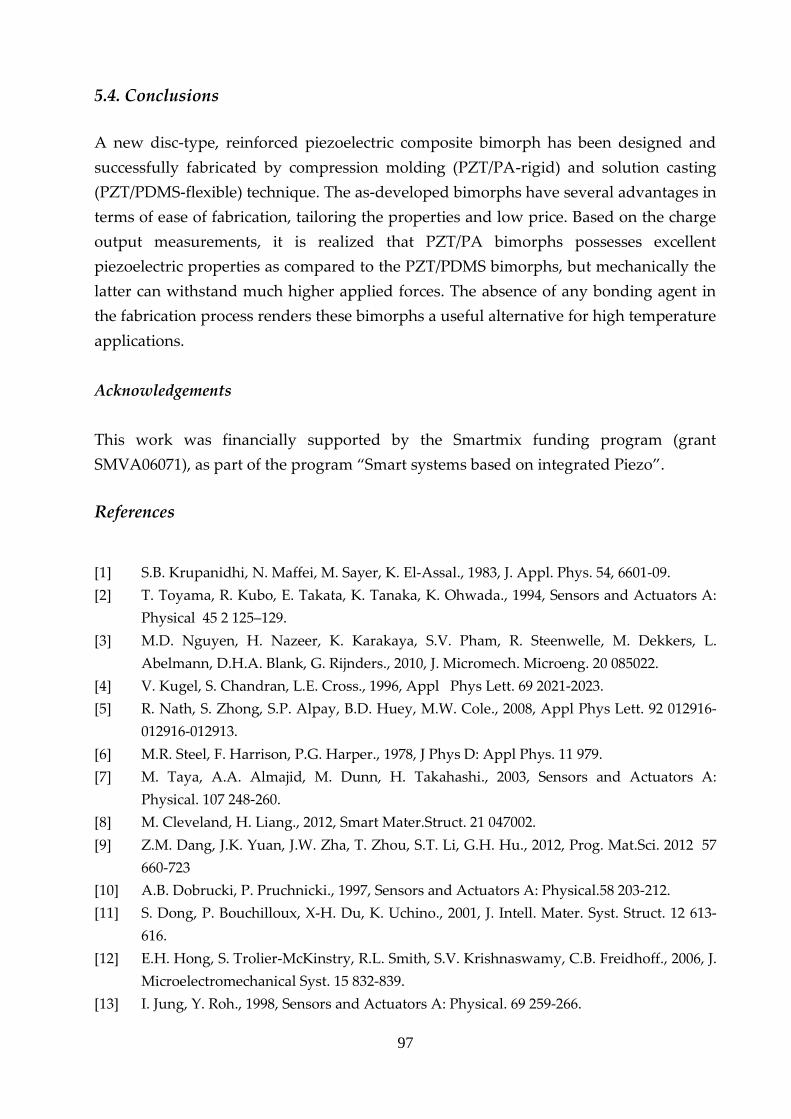
97
5.4. Conclusions
A new disc-type, reinforced piezoelectric composite bimorph has been designed and
successfully fabricated by compression molding (PZT/PA-rigid) and solution casting
(PZT/PDMS-flexible) technique. The as-developed bimorphs have several advantages in
terms of ease of fabrication, tailoring the properties and low price. Based on the charge
output measurements, it is realized that PZT/PA bimorphs possesses excellent
piezoelectric properties as compared to the PZT/PDMS bimorphs, but mechanically the
latter can withstand much higher applied forces. The absence of any bonding agent in
the fabrication process renders these bimorphs a useful alternative for high temperature
applications.
Acknowledgements
This work was financially supported by the Smartmix funding program (grant
SMVA06071), as part of the program “Smart systems based on integrated Piezo”.
References
[1] S.B. Krupanidhi, N. Maffei, M. Sayer, K. El-Assal., 1983, J. Appl. Phys. 54, 6601-09.
[2] T. Toyama, R. Kubo, E. Takata, K. Tanaka, K. Ohwada., 1994, Sensors and Actuators A:
Physical 45 2 125–129.
[3] M.D. Nguyen, H. Nazeer, K. Karakaya, S.V. Pham, R. Steenwelle, M. Dekkers, L.
Abelmann, D.H.A. Blank, G. Rijnders., 2010, J. Micromech. Microeng. 20 085022.
[4] V. Kugel, S. Chandran, L.E. Cross., 1996, Appl Phys Lett. 69 2021-2023.
[5] R. Nath, S. Zhong, S.P. Alpay, B.D. Huey, M.W. Cole., 2008, Appl Phys Lett. 92 012916-
012916-012913.
[6] M.R. Steel, F. Harrison, P.G. Harper., 1978, J Phys D: Appl Phys. 11 979.
[7] M. Taya, A.A. Almajid, M. Dunn, H. Takahashi., 2003, Sensors and Actuators A:
Physical. 107 248-260.
[8] M. Cleveland, H. Liang., 2012, Smart Mater.Struct. 21 047002.
[9] Z.M. Dang, J.K. Yuan, J.W. Zha, T. Zhou, S.T. Li, G.H. Hu., 2012, Prog. Mat.Sci. 2012 57
660-723
[10] A.B. Dobrucki, P. Pruchnicki., 1997, Sensors and Actuators A: Physical.58 203-212.
[11] S. Dong, P. Bouchilloux, X-H. Du, K. Uchino., 2001, J. Intell. Mater. Syst. Struct. 12 613-
616.
[12] E.H. Hong, S. Trolier-McKinstry, R.L. Smith, S.V. Krishnaswamy, C.B. Freidhoff., 2006, J.
Microelectromechanical Syst. 15 832-839.
[13] I. Jung, Y. Roh., 1998, Sensors and Actuators A: Physical. 69 259-266.
98
[14] C. Liu, S. Hu, S. Shen., 2012, Smart Mater.Struct. 21 115024.
[15] C.W. Lim, L.H. He, A.K. Soh., 2001, Int. J. Solids. Struct. 38 2833-2849.
[16] Q.M. Wang, Q. Zhang, B. Xu, R. Liu, L.E. Cross., 1999, J Appl Phys. 86 3352-3360.
[17] B. Xu, Q.M. Zhang, V.D. Kugel, Q. Wang, L.E. Cross., 1996, Proc.Spie 271 217-220.
[18] I. Chilibon, C. Dias, P. Inacio, J. Marat-mendes., 2007, J. Optoelectronics and advanced
materials 9 6 1939-1943.
[19] D. J. Cappelleri, M.I. Frecker, T.W. Simpson, A. Snyder., 2002, Transactions of the ASME
124 354-357.
[20] Q. Wang, Q. Zhang, B. Xu, R. Liu, L.E. Cross., 1999, J.App Phy.86 3352- 3360.
[21] J.G. Smits, S.I. Dalke, T.K. Cooney, 1991, Sensors and Actuators A: Physical. 28 41 01991.
[22] J.G. Smits, W. Choi., 1991, IEEE Trans. Ultrason. Ferroelectr. Freq. Control 38 256.
[23] A.C.C. Esteves, J. Brokken-Zijp, J. Laven, G. de With., 2010, Progr.Org.Coat. 68 12-18.
[24] T.S. Low, W. Guo., 1995, J. MEMS 4(4)230-237.
[25] I. Babu, D. van den Ende, G. de With., 2010, J Phys D: Appl Phys. 43 425402.
[26] A.C.C. Esteves, J. Brokken-Zijp, J. Laven, H.P. Huinink, N.J.W. Reuvers, M.P. Van, et al.,
2009, Polymer 50(16):3955-3966.
[27] I. Babu, G. de With., 2013, Comp. Sci. Tech. Submitted.
[28] T. Burnett, R. Yakimova, O. Kazakova., 2011, Nano Lett. 11 2324-2328.
[29] E. Tevaarwerk, D.G. Keppel, P. Rugheimer, M.G. Lagally, M.A. Eriksson., 2005, Rev Sci
Instrum. 76 053707-053707-053705.
[30] P. Girard., 2001, Nanotechnology. 12 485-490.
[31] Y. Minjun., 2006, Doctoral Thesis University of Notre Dame, Notre Dame, Indiana.
99
Chapter 6
Accurate measurements of the piezoelectric charge
coefficient*
To realize proper measurements of the piezoelectric charge constant d33 of
materials a certain mechanical load is required. This results in a
contribution of the electric field dependence of the strain, i.e. dx/dE, to the
experimentally determined d33. While for stiff materials this contribution
is negligible, it is shown that for compliant materials, such as composites
using a low modulus matrix, a considerable contribution can arise and
thus the experimental data should be corrected accordingly.
*This chapter has been submitted for publication as: I. Babu and G. de With, " Accurate measurements of
the piezoelectric charge coefficient,” Applied Physics Letters (2013).

100
101
6.1. Introduction
The development of microelectromechanical systems (MEMS) pushed the physical
limits of miniaturization of electronic devices creating a new frontier for research. These
devices use the piezoelectric, electrostatic, thermal or electromagnetic properties of
materials [1]. The piezoelectric effect provides the ability to use these “smart materials”
as both sensor and actuator. The piezoelectric effect exists in several crystalline
materials due to the polarity of the unit cells within the material. This polarity leads to
the production of electric dipoles in the material which give rise to the piezoelectric
properties. When these smart materials get strained an electric polarization is
developed which is proportional to the magnitude and sign of the strain and refers to
direct effect. Conversely, the indirect effect refers to the generation of a strain in a
material due to the application of an electric field.
Both the direct and converse piezoelectric effects can be described mathematically
through the piezoelectric constitutive equations. Accordingly the established linear
constitutive equations in the reduced-matrix form [2] to describe the electromechanical
interaction within a piezoelectric material are,
{D} = [εT]{E} + [d]{T} Direct effect (1)
{S} = [sE]{T} + [d]{E} Converse effect (2)
The piezoelectric charge constant is defined by,
d33 = (D3/T3)E + E(εT/T3)E = (D3/T3)E + T(sE/E)T (3)
The constitutive equations are expressed in terms of the dielectric displacement D
[C/m2], mechanical stress and strain T [N/m2] and S [-], applied electrical field E [V/m]
through the dielectric permittivity ε [F/m], piezoelectric charge constant d [C/N] and the
compliance s [m2/N].
The piezoelectric activity of the material is defined by the piezoelectric charge
coefficient dij, the subscript denotes the direction of the electric quantity (polarization or
the electric field) and the mechanical quantity (stress or strain). The piezoelectric effect
strongly depends on the polarization direction. In accordance with the IEEE standard
on piezoelectricity [3], the three-dimensional behavior of the piezoelectric material
(electric, elastic and piezoelectric) are based on an orthogonal coordinate system.
Conventionally there are various techniques to measure the piezoelectric effect.
Accurate knowledge of the piezoelectric charge coefficient dij is essential to understand
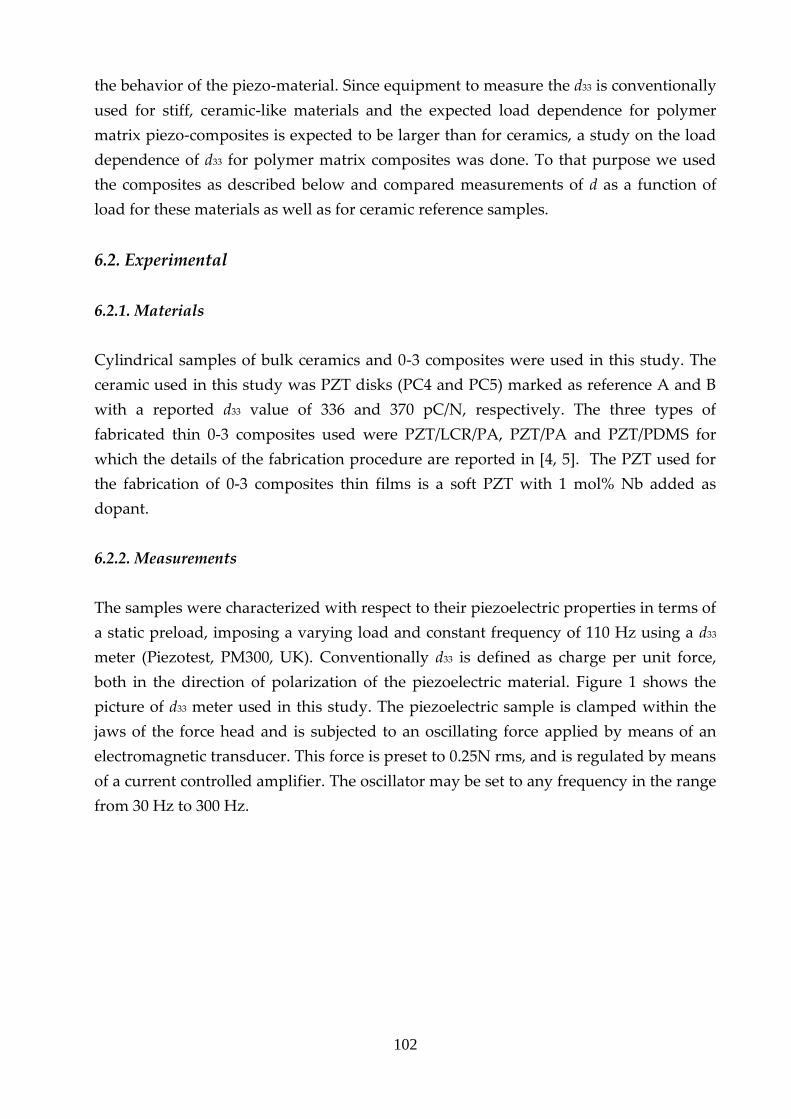
102
the behavior of the piezo-material. Since equipment to measure the d33 is conventionally
used for stiff, ceramic-like materials and the expected load dependence for polymer
matrix piezo-composites is expected to be larger than for ceramics, a study on the load
dependence of d33 for polymer matrix composites was done. To that purpose we used
the composites as described below and compared measurements of d as a function of
load for these materials as well as for ceramic reference samples.
6.2. Experimental
6.2.1. Materials
Cylindrical samples of bulk ceramics and 0-3 composites were used in this study. The
ceramic used in this study was PZT disks (PC4 and PC5) marked as reference A and B
with a reported d33 value of 336 and 370 pC/N, respectively. The three types of
fabricated thin 0-3 composites used were PZT/LCR/PA, PZT/PA and PZT/PDMS for
which the details of the fabrication procedure are reported in [4, 5]. The PZT used for
the fabrication of 0-3 composites thin films is a soft PZT with 1 mol% Nb added as
dopant.
6.2.2. Measurements
The samples were characterized with respect to their piezoelectric properties in terms of
a static preload, imposing a varying load and constant frequency of 110 Hz using a d33
meter (Piezotest, PM300, UK). Conventionally d33 is defined as charge per unit force,
both in the direction of polarization of the piezoelectric material. Figure 1 shows the
picture of d33 meter used in this study. The piezoelectric sample is clamped within the
jaws of the force head and is subjected to an oscillating force applied by means of an
electromagnetic transducer. This force is preset to 0.25N rms, and is regulated by means
of a current controlled amplifier. The oscillator may be set to any frequency in the range
from 30 Hz to 300 Hz.
103
Figure 1. Picture of d33 meter used in this study.
6.3. Results and Discussion
Figure 2a and 2b shows the effect of static preload on the d33 value of bulk ceramics and
0-3 composites thin films. Two different trends are observed in the figures indicating
the nature of PZT material used. The bulk ceramics shows an increasing trend with
load, as reported for hard PZT [6]. The thin films (PZT/PA and PZT/LCR/PA) show a
decreasing trend with load since we used a soft PZT material as piezo-filler and for soft
PZT d33 decreases with load [7].
From figure 1a, showing the d-dependence on applied force F for the ceramic
reference samples, a rather linear increase with load can be observed. Nevertheless, a
second order polynomial was fitted but the R-test [8] showed that this fit is not
significantly better at the 5% significance level. Hence the parameters a and b for a
linear fit d = a + bF are given in table 1. The recommended value to measure d is given as
10 N and the calibration values are given in table 1 as well [9]. Also indicated are the
values of d at F = 10 [N]. From table 1 it is clear that the differences are small, about
1.5%; nevertheless for an accurate determination of d the load dependence should be
taken in to account. Actually figure 1a shows a small change in slope at about 5 N for
both reference samples. However, fitting only the range from 5 to 20 N does not change
the value for a significantly. This change is probably due to a somewhat less good
contact between the measuring force head and the (rather stiff) ceramic reference
sample at a load less than 5 N.
From figure 1b, showing the d-dependence on applied force F for the composite
samples, also a rather linear increase with load can be observed. Similarly as for the
Force head
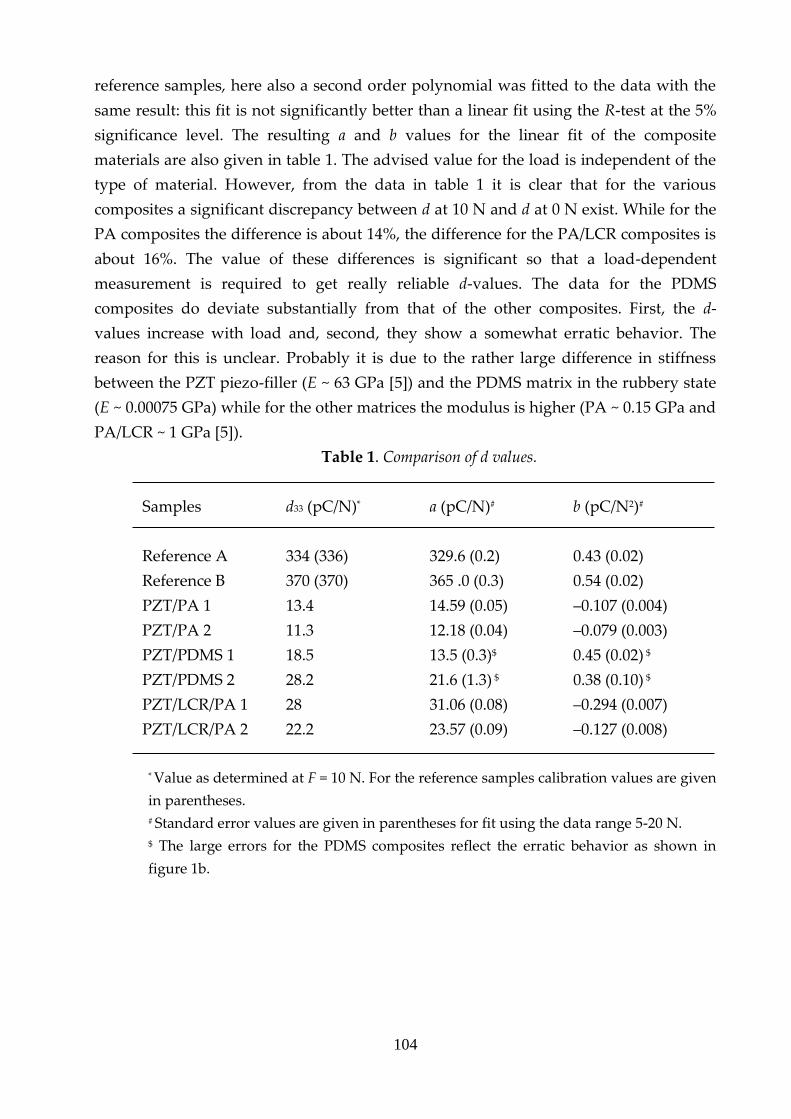
104
reference samples, here also a second order polynomial was fitted to the data with the
same result: this fit is not significantly better than a linear fit using the R-test at the 5%
significance level. The resulting a and b values for the linear fit of the composite
materials are also given in table 1. The advised value for the load is independent of the
type of material. However, from the data in table 1 it is clear that for the various
composites a significant discrepancy between d at 10 N and d at 0 N exist. While for the
PA composites the difference is about 14%, the difference for the PA/LCR composites is
about 16%. The value of these differences is significant so that a load-dependent
measurement is required to get really reliable d-values. The data for the PDMS
composites do deviate substantially from that of the other composites. First, the d-
values increase with load and, second, they show a somewhat erratic behavior. The
reason for this is unclear. Probably it is due to the rather large difference in stiffness
between the PZT piezo-filler (E ~ 63 GPa [5]) and the PDMS matrix in the rubbery state
(E ~ 0.00075 GPa) while for the other matrices the modulus is higher (PA ~ 0.15 GPa and
PA/LCR ~ 1 GPa [5]).
Table 1. Comparison of d values.
Samples d33 (pC/N)* a (pC/N)# b (pC/N2)#
Reference A 334 (336) 329.6 (0.2) 0.43 (0.02)
Reference B 370 (370) 365 .0 (0.3) 0.54 (0.02)
PZT/PA 1 13.4 14.59 (0.05) –0.107 (0.004)
PZT/PA 2 11.3 12.18 (0.04) –0.079 (0.003)
PZT/PDMS 1 18.5 13.5 (0.3)$ 0.45 (0.02) $
PZT/PDMS 2 28.2 21.6 (1.3) $ 0.38 (0.10) $
PZT/LCR/PA 1 28 31.06 (0.08) –0.294 (0.007)
PZT/LCR/PA 2 22.2 23.57 (0.09) –0.127 (0.008)
* Value as determined at F = 10 N. For the reference samples calibration values are given
in parentheses.
# Standard error values are given in parentheses for fit using the data range 5-20 N.
$ The large errors for the PDMS composites reflect the erratic behavior as shown in
figure 1b.
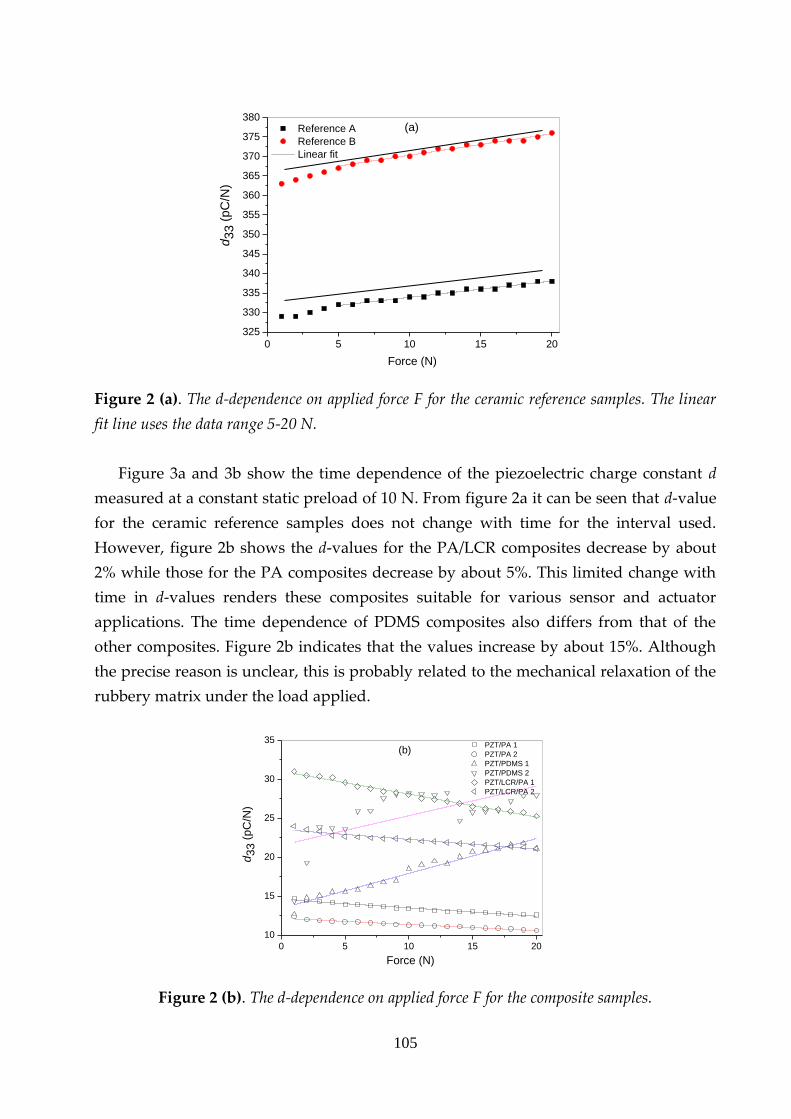
105
0 5 10 15 20
325
330
335
340
345
350
355
360
365
370
375
380
Force (N)
d33 (
pC
/N)
Reference A
Reference B
Linear fit
(a)
Figure 2 (a). The d-dependence on applied force F for the ceramic reference samples. The linear
fit line uses the data range 5-20 N.
Figure 3a and 3b show the time dependence of the piezoelectric charge constant d
measured at a constant static preload of 10 N. From figure 2a it can be seen that d-value
for the ceramic reference samples does not change with time for the interval used.
However, figure 2b shows the d-values for the PA/LCR composites decrease by about
2% while those for the PA composites decrease by about 5%. This limited change with
time in d-values renders these composites suitable for various sensor and actuator
applications. The time dependence of PDMS composites also differs from that of the
other composites. Figure 2b indicates that the values increase by about 15%. Although
the precise reason is unclear, this is probably related to the mechanical relaxation of the
rubbery matrix under the load applied.
0 5 10 15 20
10
15
20
25
30
35 PZT/PA 1
PZT/PA 2
PZT/PDMS 1
PZT/PDMS 2
PZT/LCR/PA 1
PZT/LCR/PA 2
Force (N)
d33 (
pC
/N)
(b)
Figure 2 (b). The d-dependence on applied force F for the composite samples.
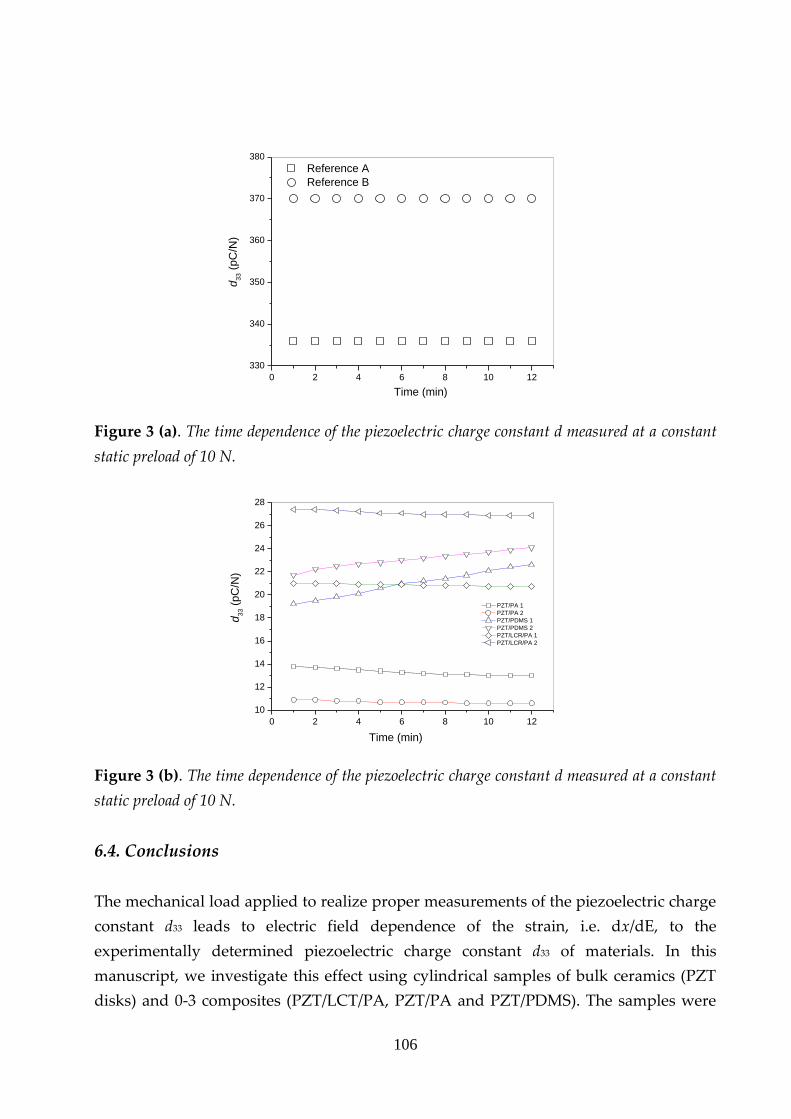
106
0 2 4 6 8 10 12
330
340
350
360
370
380
Reference A
Reference B
d33 (
pC
/N)
Time (min)
Figure 3 (a). The time dependence of the piezoelectric charge constant d measured at a constant
static preload of 10 N.
0 2 4 6 8 10 12
10
12
14
16
18
20
22
24
26
28
PZT/PA 1
PZT/PA 2
PZT/PDMS 1
PZT/PDMS 2
PZT/LCR/PA 1
PZT/LCR/PA 2
Time (min)
d33 (
pC
/N)
Figure 3 (b). The time dependence of the piezoelectric charge constant d measured at a constant
static preload of 10 N.
6.4. Conclusions
The mechanical load applied to realize proper measurements of the piezoelectric charge
constant d33 leads to electric field dependence of the strain, i.e. dx/dE, to the
experimentally determined piezoelectric charge constant d33 of materials. In this
manuscript, we investigate this effect using cylindrical samples of bulk ceramics (PZT
disks) and 0-3 composites (PZT/LCT/PA, PZT/PA and PZT/PDMS). The samples were
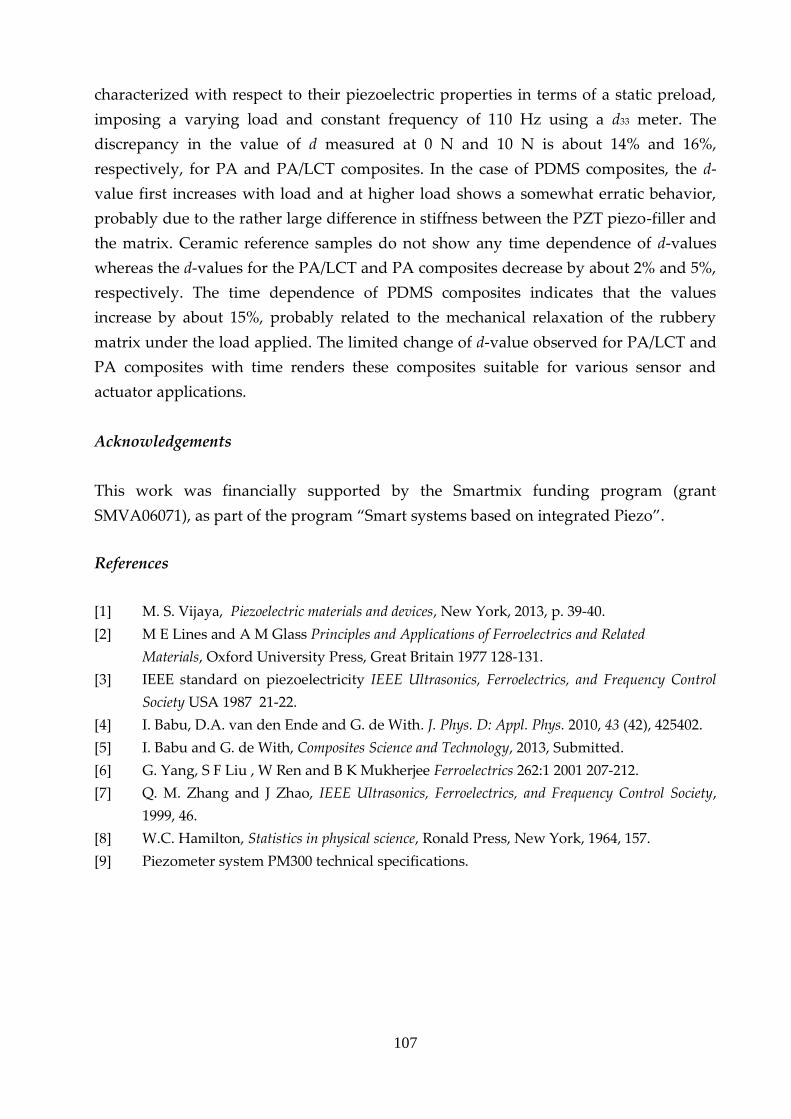
107
characterized with respect to their piezoelectric properties in terms of a static preload,
imposing a varying load and constant frequency of 110 Hz using a d33 meter. The
discrepancy in the value of d measured at 0 N and 10 N is about 14% and 16%,
respectively, for PA and PA/LCT composites. In the case of PDMS composites, the d-
value first increases with load and at higher load shows a somewhat erratic behavior,
probably due to the rather large difference in stiffness between the PZT piezo-filler and
the matrix. Ceramic reference samples do not show any time dependence of d-values
whereas the d-values for the PA/LCT and PA composites decrease by about 2% and 5%,
respectively. The time dependence of PDMS composites indicates that the values
increase by about 15%, probably related to the mechanical relaxation of the rubbery
matrix under the load applied. The limited change of d-value observed for PA/LCT and
PA composites with time renders these composites suitable for various sensor and
actuator applications.
Acknowledgements
This work was financially supported by the Smartmix funding program (grant
SMVA06071), as part of the program “Smart systems based on integrated Piezo”.
References
[1] M. S. Vijaya, Piezoelectric materials and devices, New York, 2013, p. 39-40.
[2] M E Lines and A M Glass Principles and Applications of Ferroelectrics and Related
Materials, Oxford University Press, Great Britain 1977 128-131.
[3] IEEE standard on piezoelectricity IEEE Ultrasonics, Ferroelectrics, and Frequency Control
Society USA 1987 21-22.
[4] I. Babu, D.A. van den Ende and G. de With. J. Phys. D: Appl. Phys. 2010, 43 (42), 425402.
[5] I. Babu and G. de With, Composites Science and Technology, 2013, Submitted.
[6] G. Yang, S F Liu , W Ren and B K Mukherjee Ferroelectrics 262:1 2001 207-212.
[7] Q. M. Zhang and J Zhao, IEEE Ultrasonics, Ferroelectrics, and Frequency Control Society,
1999, 46.
[8] W.C. Hamilton, Statistics in physical science, Ronald Press, New York, 1964, 157.
[9] Piezometer system PM300 technical specifications.

108
Chapter 7
Summary and Outlook*
In this chapter a summary of the results and conclusions are given. An
outlook to future developments is presented, which offer transducer
characteristics with possibilities for new markets in the form of novel
materials and processing techniques, related to existing polymer based
composite processing techniques.
*Part of this chapter has been submitted for publication as: I. Babu, N. Meis, G. de With, "Review of
piezoelectric composites,” Journal of Materials Chemistry (2013).

110
111
7.1 Summary
The design and fabrication of 0-3 piezoelectric composites (three types of unimorphs
and two type of bimorphs) developed with improve material properties and to obtain
integrated structures such as self-standing films are described. The development of soft
flexible elastomeric piezocomposites like PZT/PDMS composite, proved to be the
newest candidate novel materials which will offering oppourtunities for sensor and
actuator applications in all fields. The above mentioned piezocomposites can break up
the limitation for the application at high temperature, by avoiding bonding agents to be
used in application.
In chapter 2 we report on the processing and characterization of new series of
fairly flexible 0-3 PZT/LCT/PA (Lead Zirconate Titanate Pb(Zr1-xTix)O3/Liquid crystalline
thermosets/Polyamide) piezoelectric composites with high permittivity and
piezoelectric charge constant by incorporating PZT5A4 into a matrix of LCT and
polyamide (PA11). Commercially available PZT powder was calcined at different
temperatures for the optimization of the composite properties. The phase formation
during calcination of the powder was studied by X-ray diffraction and the particle size
by light scattering and scanning electron microscopy. X-ray diffraction indicated that
for the PZT powder used, calcination at 1100 °C shows the maximum intensity for the
single phase tetragonal perovskite peaks. The obtained d33 and g33 values from PZT/PA
composites are also the highest for the PZT calcined at 1100 °C, supporting the above
conclusion. The relative permittivity εr, piezoelectric charge constant d33, electrical
conductivity and elastic modulus E of the composites were found to increase with
increasing ceramic volume fraction φ. Good agreement was found between the
experimental data of relative permittivity and piezoelectric constants with several
theoretical models (Jayasundere, Yamada and Lichtenecker) of 0-3 composites. The
experimental data for εr agree quite well with the Lichtenecker model for PZT volume
fraction up to 50%, while the Yamada and Jayasundere model underestimate the
experimental data. The experimental data for the piezoelectric constants agree well with
the Yamada model, suggesting an elongated particle shape and confirmed by
independent image analysis. Moreover, the addition of PA11 to PZT/LCT composites
leads to a lower elastic modulus providing more flexibility to the materials.
In chapter 3 we report on the realization of highly flexible piezoelectric
composites with excellent functional properties which opens new ways to ‘soft touch’
applications in a variety of transducer and sensor applications. Highly flexible
piezoelectric composites with 0-3 connectivity, filler volume fractions up to 50 vol. %
and having hardly any pores are realized by solution casting of dispersions of
(Pb(ZrxTi1-x)O3 (PZT) in poly-(dimethylsiloxane) (PDMS). SEM analysis of the

112
composites shows a homogeneous distribution of PZT particles in the polymer matrix
without any porosity. The relative permittivity and piezoelectric charge constant
increase with the increasing contribution of PZT, meanwhile maintaining a low ac
conductivity. The experimental results were compared with theoretical models and we
note that the Yamada model can either describe the piezoelectric charge constant d33
well meanwhile describing poorly the permittivity εr or vice versa, albeit in both cases
with unrealistically high shape factors, but not both. Results obtained from static and
dynamic mechanical analysis show that the present composites are highly compliant
with a Young’s modulus only a few times higher than for pure PDMS. The Yamada
model underestimates the Young’s moduli E significantly, though, as compared with
the experimental data. Excellent piezoelectric properties (permittivity r up to ~ 40,
piezoelectric charge constant d33 up to 25 pC/N, piezoelectric voltage coefficient g33 up to
75 mV.m/N), electrical properties (conductivity about 110-6 S/m at 1000 Hz) and
mechanical properties (storage modulus E up to 10 MPa, loss modulus E less than
0.5 MPa, limited creep and stress relaxation) have been realized. The good combination
of the material properties, i.e. a decent value for permittivity, piezoelectric charge and
voltage constant combined with low electrical conductivity, low elastic stiffness and
very limited creep and stress relaxation, promotes the development of prototypes for
transducer and sensors applications.
In chapter 4 we present a simple fabrication procedure for highly dense
piezoelectric composites with a combination of high dielectric constant and low
dielectric loss and demonstrate the enhancement of electromechanical properties by
incorporating carbon nanotubes (CNT) and carbon black (CB) into 0-3 PZT/PDMS (lead
zirconate titanate - poly dimethyl siloxane) composites. Composites were fabricated by
solution casting technique using a constant PZT/PDMS ratio of 40/60 and conductive
fillers ranging from 0 to 0.5 vol.%. Impedance measurements proved that a small
addition of conductive fillers sufficiently enhanced the electrical conductivity to lead to
improved poling efficiency. For too high volume fractions (and consequently too high
conductivity), poling becomes impossible. For the optimum PZT/PDMS/0.125CNT a
relative permittivity r ~ 50 and conductivity ~ 2.8106 S/m was obtained while for the
optimum PZT/PDMS/0.125CB r ~ 35 and ~ 1.9106 S/m have been realized. The
piezoelectric charge constant d33 of the PZT/PDMS/0.125CNT and PZT/PDMS/0.125CB
composites were 25 and 18 pC/N, respectively. Dynamic mechanical analysis (DMA)
showed better performance for PZT/PDMS/CB with lower volume fraction conductive
fillers than for the PZT/PDMS/CNT composites. The excellent (di-)electrical properties
and the relatively simple fabrication procedure of these composites make them
promising candidates in piezoelectric sensors, actuators and high efficiency capacitors.
113
In chapter 5 we investigated the design, fabrication and performance analysis of
two new disc-type types of composite bimorphs with series connection by compression
molding (PZT/PA-rigid) and solution casting (PZT/PDMS-flexible) technique. The
charge developed at an applied force of 150 N is 18150 pC (PZT/PA) and 2310 pC
(PZT/PDMS), respectively. Charge output measurement demonstrates that PZT/PA
bimorphs possesses excellent piezoelectric properties as compared to the PZT/PDMS
bimorphs, but mechanically the latter can withstand much higher applied forces. A
clear inverse piezoelectric effect was observed when the bimorphs were subjected to an
electric field stepped up through 2, 6 and 10 V, indicating the net polarization direction
of the different ferroelectric domains. The as-developed bimorphs have the basic
structure of a sensor and actuator and since they do not use any bonding agent for
bonding, they can provide a valuable alternative to the present bimorphs where
bonding processes required for their realization, can limit the application at high
temperature. Furthermore, these new bimorphs offer several advantages in terms of
ease of fabrication, tailoring the properties and low price.
In chapter 6 we describe contribution of the electric field dependence of the
strain, i.e. dx/dE, to the experimentally determined d33. This issue is arising because
certain mechanical load is required to realize proper measurements of the piezoelectric
charge constant d33 of materials. While for stiff reference materials this contribution is
small, ~ 1.5%, for the compliant composite materials it is about 15%. Hence for an
accurate determination of the d-value the experimental data extrapolated to load zero.
Since equipment to measure the d33 is conventionally used for stiff, ceramic-like
materials and the expected load dependence for polymer matrix piezo-composites is
expected to be larger than for ceramics, a study on the load dependence of d33 for
polymer matrix composites was done. We used the composites as described and
compared measurements as a function of load for these materials as well as for ceramic
reference samples.
7.2 Outlook
In the last few decades piezomaterials gained much importance due to their high
potential as “smart materials”. The emergence of new processing technologies continue
to enlarge the performance of piezo composites and the results of this research suggest
several promising directions for future investigations. The development of novel
piezoelectric materials and processing technologies has great potential for further
developments and creates a fertile ground for fundamental research. However, further
developments and fundamental research are required in translating it into for sensing
114
applications with higher reliability. The integration of composite into a sensing device
and its performance analysis in relation to demonstrator applications under its normal
operating conditions will translate the outcome of this research into the next phase of
development. The good combination of the material properties, i.e. a decent value for
permittivity, piezoelectric charge and voltage constant combined with low electrical
conductivity, low elastic stiffness and very limited creep and stress relaxation, promotes
the development of prototypes for transducer and sensors applications. It is highly
likely that other piezoelectric oxide particles can be incorporated into PDMS matrix
without having any porosity in a similar easy way, thereby increasing the applicability
range.

115
Samenvatting
Het ontwerp en de fabricage van 0-3 piëzo-elektrische polymeer composieten (drie
soorten unimorphs en twee soorten bimorphs), ontwikkeld om materiaaleigenschappen
te verbeteren en om geïntegreerde structuren zoals op zichzelf staande films te
verkrijgen, zijn beschreven. De ontwikkeling van zachte flexibele elastomeer
piezocomposieten, zoals PZT / PDMS, zijn de nieuwste kandidaten van onbekende
materialen die mogelijkheden bieden voor sensor- en actuator -toepassingen op allerlei
gebieden. De bovengenoemde piezocomposieten kunnen de beperking voor de
toepassing bij hoge temperatuur doorbreken omdat lijmen vermeden wordt.
In hoofdstuk 2 rapporteren we over de verwerking en karakterisering van
nieuwe, redelijk flexibele 0-3 PZT / LCT / PA ( Loodzirkoontitanaat Pb(Zr1-xTix)O3 /
vloeibare kristallijne thermoharders / Polyamide) piëzo-elektrische composieten met
een hoge diëlektrische constante en piëzo-elektrische ladingsconstante door het
opnemen van PZT5A4 in een matrix van LCT en polyamide (PA11). Commercieel
verkrijgbaar PZT poeder werd gecalcineerd bij verschillende temperaturen voor het
optimaliseren van de composieteigenschappen. De fasevorming tijdens het calcineren
van het poeder werd bestudeerd met behulp van Röntgendiffractie en de
deeltjesgrootte door middel van lichtverstrooiing en scanning elektronenmicroscopie.
Röntgendiffractie laat zien dat het gebruikte PZT poeder, gecalcineerd bij 1100 °C, de
maximale intensiteit van de pieken voor éénfase tetragonaal perovskiet geeft. De
verkregen d33 en g33 waarden voor de PZT / PA composieten zijn ook het hoogst voor
PZT gecalcineerd bij 1100 ° C, hetgeen de bovenstaande conclusie ondersteunt. De
relatieve diëlektrische constante εr, de piëzo-elektrische ladingsconstante d33, de
geleidbaarheid en de elasticiteitsmodulus E van de composieten bleken toe te nemen
met toenemende keramische volumefractie φ. Goede overeenkomst werd gevonden
tussen de experimentele data voor de relatieve diëlektrische constante en piëzo-
elektrische constanten met diverse theoretische modellen (Jayasundere, Yamada en
Lichtenecker) voor 0-3 composieten. De experimentele gegevens voor εr komen goed
overeen met het Lichtenecker model voor PZT met een volume fractie tot 50%, terwijl
het Yamada en Jayasundere model de experimentele waarden onderschatten. De
experimentele gegevens voor de piëzo-elektrische constanten komen overeen met het
Yamada model en suggereren een langgerekte deeltjesvorm, zoals bevestigd door de
resultaten van onafhankelijke beeldanalyse. Bovendien leidt de toevoeging van PA11
116
aan PZT / LCT composieten tot een lagere elasticiteitsmodulus die meer flexibiliteit
geeft aan de materialen.
In hoofdstuk 3 beschrijven we de realisatie van flexibele piëzo-elektrische
composieten met uitstekende functionele eigenschappen hetgeen nieuwe wegen opent
naar 'soft touch' toepassingen voor een verscheidenheid van transducer en sensor
toepassingen. Zeer flexibele piëzo-elektrische composieten met 0-3 connectiviteit, met
vulmiddel volume fracties tot 50% en vrijwel zonder poriën werden gerealiseerd door
gieten van dispersies (met wat extra oplosmiddel) van (Pb(ZrxTi1 - x)O3 (PZT) in poly-
(dimethylsiloxaan) (PDMS). SEM analyse van de composieten laat een homogene
verdeling van de PZT deeltjes in de polymeermatrix zien, wederom vrijwel zonder
enige porositeit. De toename van de relatieve diëlektrische constante en piëzo-
elektrische ladingsconstante met toenemende PZT fractie leidt niet tot een hogere AC
elektrische geleidbaarheid. De experimentele resultaten werden vergeleken met
theoretische modellen. Opgemerkt wordt dat het Yamada model ofwel de piëzo-
elektrische ladingsconstante d33 goed beschrijft en de diëlektrische constante εr slecht,
of vice versa, hoewel in beide gevallen met onrealistisch hoge vormfactoren, maar niet
beide grootheden tegelijkertijd. Resultaten verkregen uit statische en dynamische
mechanische analyse tonen aan dat de composieten zeer een zeer lage stijfheid bezitten
met een Young's modulus maar enkele malen hoger dan voor puur PDMS. Het Yamada
model onderschat de Young's modulus E aanzienlijk vergeleken met de experimentele
data. Uitstekende piëzo-elektrische eigenschappen (diëlektrische r tot ~ 40, piëzo-
elektrische ladingsconstante d33 tot 25 pC/N, piëzo-elektrische spanning coëfficiënt g33
tot 75 mVm/N), elektrische eigenschappen (geleidbaarheid ongeveer 110-6 S/m bij
1000 Hz en mechanische eigenschappen (opslagmodulus E tot 10 MPa, verliesmodulus
E minder dan 0,5 MPa, beperkte kruip en spanningsrelaxatie) zijn gerealiseerd. De
goede combinatie van de eigenschappen van het materiaal, dat wil zeggen een goede
waarde voor de diëlektrische constante, piëzo-elektrische lading en spanning constante
in combinatie met een lage elektrische geleidbaarheid, lage elastische stijfheid en zeer
beperkte kruip en spanningsrelaxatie, maken een verdere ontwikkeling van prototypen
voor transducer en sensoren toepassingen mogelijk.
In hoofdstuk 4 presenteren we een eenvoudige fabricage procedure voor zeer
dichte piëzoelektrische composieten met een combinatie van hoge diëlektrische
constante en lage diëlektrische verliezen. Tevens tonen we de verbetering van de
elektromechanische eigenschappen door het opnemen van koolstof nanotubes (CNT)
en koolzwart (CB) in 0-3 PZT / PDMS (loodzirkonaat titanate - poly dimethylsiloxaan)
composieten. De composieten werden gefabriceerd door eerder genoemde giettechniek
met een constante PZT / PDMS -verhouding van 40 / 60 en de geleidende vulstoffen van
0 tot 0,5 vol%. Impedantiemetingen geven aan dat een kleine toevoeging van
117
geleidende vulstoffen de elektrische geleidbaarheid voldoende verhoogt om een
verbeterde efficiency voor polen te realiseren. Voor te hoge volume fracties (en dus te
hoge geleidbaarheid) wordt polen onmogelijk. Voor de optimale samenstelling
PZT/PDMS/0.125CNT werd een relatieve diëlektrische constante r ~ 50 en
geleidbaarheid ~ 2,8 10 6 S/m verkregen, terwijl voor de optimale samenstelling
PZT/PDMS/0.125CB r ~ 35 en ~ 1,9 10 6 S/m werd gerealiseerd. De piëzo-elektrische
ladingsconstante d33 van de PZT/PDMS/0.125CNT en PZT/PDMS/0.125CB composieten
zijn, respectievelijk, 25 en 18 pC/N. Dynamische mechanische analyse (DMA) toonde
betere prestaties voor PZT / PDMS / CB met een lagere volume fractie geleidende
vulstoffen dan voor de PZT / PDMS / CNT composieten. De voortreffelijke (di-)
elektrische eigenschappen en de relatief eenvoudige fabricage werkwijze van deze
composieten maken dat ze veelbelovende kandidaten voor piëzoelektrische sensoren,
actuatoren en hoge efficiency condensatoren zijn.
In hoofdstuk 5 wordt het ontwerp, de fabricage en de prestatie van twee nieuwe
disc-types van composiet bimorphs met serieschakeling verkregen door persen (PZT /
PA - rigide) en gieten (PZT / PDMS - flexibel) techniek onderzocht. De ontwikkelde
lading bij een aangebrachte kracht van 150 N is, respectievelijk, 18150 pC (PZT / PA) en
2310 pC (PZT / PDMS). De gegenereerde lading toont aan dat PZT / PA bimorphs
betere piëzoelektrische eigenschappen bezitten dan de PZT / PDMS bimorphs, maar dat
de laatste veel hogere mechanisch krachten kan weerstaan. Een duidelijk invers piëzo-
elektrisch effect werd waargenomen wanneer de bimorphs werden onderworpen aan
een elektrisch veld door middel van het aanbrengen van 2, 6 en 10 V bij EFM metingen,
waarbij de netto polarisatierichting van de ferroelektrische domeinen zichtbaar wordt.
De ontwikkelde bimorphs hebben de basisstructuur van een sensor en actuator en
omdat zij geen lijm gebruiken kunnen zij een waardevol alternatief zijn voor de
bimorphs waar lijmprocessen nodig zijn voor de realisatie, hetgeen de toepassing bij
hoge temperaturen kan beperken. Bovendien bieden deze nieuwe bimorphs verdere
voordelen in termen van gemak van de fabricage, het afstemmen van de eigenschappen
en de lage prijs .
In hoofdstuk 6 beschrijven we de bijdrage van het elektrische veld afhankelijk
van de rek x, namelijk dx/dE, aan de experimenteel bepaalde waarde van d33. Deze
bijdrage ontstaat omdat een bepaalde mechanische belasting nodig is om een correcte
meting van de piëzo-elektrische ladingsconstante d33 van de materialen te kunnen doen.
Voor een nauwkeurige bepaling van de d-waarde werden de experimentele gegevens
geëxtrapoleerd naar een mechanische belasting van 0 N. Aangezien apparatuur voor de
bepaling van d33 gewoonlijk gebruikt wordt voor stijve, keramische materialen en het
verwachte effect voor polymeermatrix piëzo-composieten hoger is dan voor keramiek,
werd een studie van de afhankelijkheid van de mechanische belasting voor d33 van
118
polymeermatrix composieten uitgevoerd. We gebruikten de samenstellingen zoals
beschreven en vergeleken metingen als functie van de belasting voor deze materialen
en voor keramische referentiemonsters. Terwijl voor stijve referentiematerialen de
bijdrage van dx/dE klein is, ~ 1,5%, is deze voor de composietmaterialen ongeveer 15%.
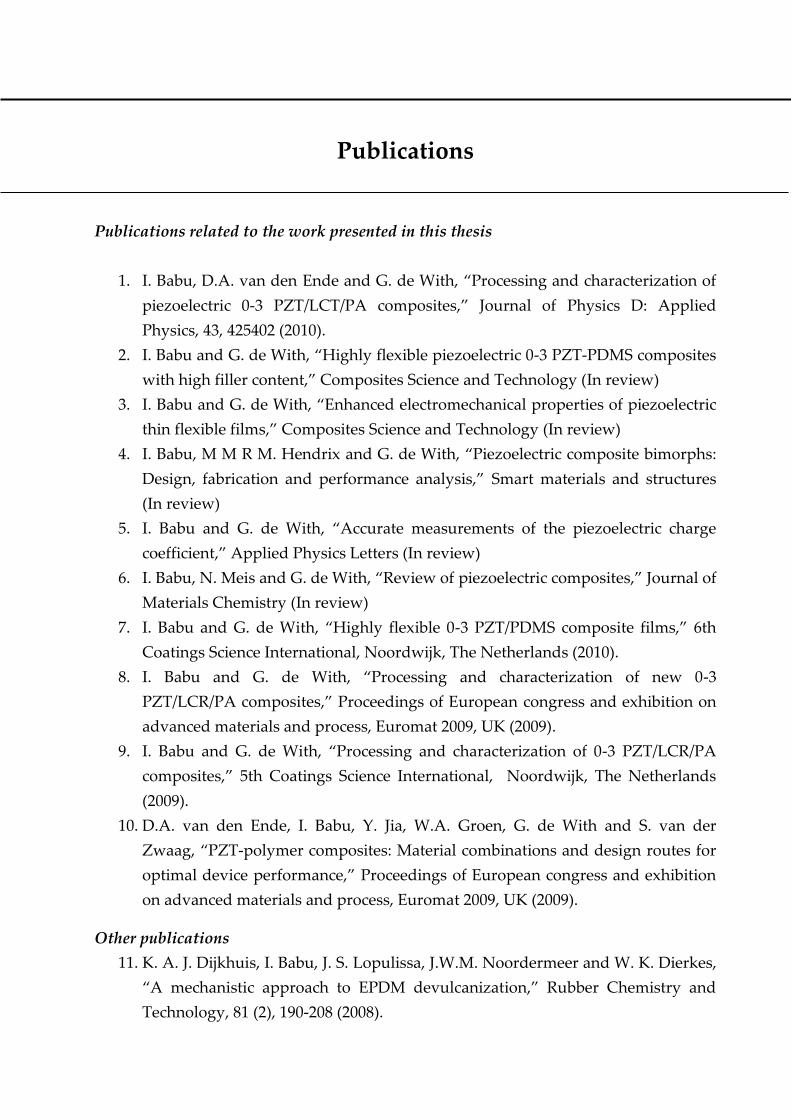
Publications
Publications related to the work presented in this thesis
1. I. Babu, D.A. van den Ende and G. de With, “Processing and characterization of
piezoelectric 0-3 PZT/LCT/PA composites,” Journal of Physics D: Applied
Physics, 43, 425402 (2010).
2. I. Babu and G. de With, “Highly flexible piezoelectric 0-3 PZT-PDMS composites
with high filler content,” Composites Science and Technology (In review)
3. I. Babu and G. de With, “Enhanced electromechanical properties of piezoelectric
thin flexible films,” Composites Science and Technology (In review)
4. I. Babu, M M R M. Hendrix and G. de With, “Piezoelectric composite bimorphs:
Design, fabrication and performance analysis,” Smart materials and structures
(In review)
5. I. Babu and G. de With, “Accurate measurements of the piezoelectric charge
coefficient,” Applied Physics Letters (In review)
6. I. Babu, N. Meis and G. de With, “Review of piezoelectric composites,” Journal of
Materials Chemistry (In review)
7. I. Babu and G. de With, “Highly flexible 0-3 PZT/PDMS composite films,” 6th
Coatings Science International, Noordwijk, The Netherlands (2010).
8. I. Babu and G. de With, “Processing and characterization of new 0-3
PZT/LCR/PA composites,” Proceedings of European congress and exhibition on
advanced materials and process, Euromat 2009, UK (2009).
9. I. Babu and G. de With, “Processing and characterization of 0-3 PZT/LCR/PA
composites,” 5th Coatings Science International, Noordwijk, The Netherlands
(2009).
10. D.A. van den Ende, I. Babu, Y. Jia, W.A. Groen, G. de With and S. van der
Zwaag, “PZT-polymer composites: Material combinations and design routes for
optimal device performance,” Proceedings of European congress and exhibition
on advanced materials and process, Euromat 2009, UK (2009).
Other publications
11. K. A. J. Dijkhuis, I. Babu, J. S. Lopulissa, J.W.M. Noordermeer and W. K. Dierkes,
“A mechanistic approach to EPDM devulcanization,” Rubber Chemistry and
Technology, 81 (2), 190-208 (2008).
120
12. K.A.J. Dijkhuis, I. Babu, J.S. Lopulissa, J.W.M. Noordermeer and W.K. Dierkes,
“A Mechanistic Approach to EPDM Devulcanization,” Kautschuk Gummi
Kunststoffe (2007).
13. K.A.J. Dijkhuis, I. Babu, J.S. Lopulissa, J.W.M. Noordermeer and W.K. Dierkes,
“A Mechanistic Approach to EPDM Devulcanization,” The fall 172nd Technical
Meeting of the American Chemical Society Rubber Division, Cleveland, USA
(2007).
14. W. K. Dierkes, K.A.J. Dijkhuis, I. Babu and J.W.M. Noordermeer, “Study on the
reversibility of EPDM Vulcanization,” Salvador, Brazil (2007).

121
Acknowledgements
The research presented in this thesis is the result of my work conducted at the Materials
and Interface Chemistry group of Technical University of Eindhoven. During this
period, I have been fortunate to be accompanied, supported and inspired by several
people professionally as well as personally, to whom I would like to express my sincere
acknowledgements here.
First of all, I would like to express my profound respect and gratitude to my
promotor Bert de With. It’s my great pleasure and privilege to have you as my daily
supervisor. You were always there with a smiling face for discussion. Dear Bert, thank
you very much for your invaluable suggestions, affectionate advices and for all the
support throughout the years, which helped me in completing this thesis. Hartelijk
bedankt Bert!
I would like to thank my co-promoter Rolf van Benthem for his support. I really
appreciate your open minded constructive remarks and suggestions about my thesis.
Thank you for being a friendly professor.
The contribution of the promotion committee constituted probably the most
feedback from the outside. I acknowledge Prof. J.C. Schouten, Prof. J.Th.M. de Hosson,
Prof. S.J. Picken and Prof. C.W.M. Bastiaansen for their valuable comments and for
being the committee members of my defense.
This work was financially supported by the Smartmix funding program (grant
SMVA06071), as part of the program “Smart systems based on integrated Piezo
(SmartPIE)”. I wish to express my sincere gratitude to Jan Peters (Chairman of the
Applied Piezo foundation), Prof. Sybrand van der Zwaag (Delft University), Dr. Pim
Groen (TNO, Eindhoven), Dr. Daan van den Ende (TNO, Eindhoven), Dr .Yan Min Jia
(Delft University) and Benjamin for their interest and for the fruitful discussions.
Special thanks to Jos Laven and Catarina for being significant sources of support
individually and also in the technical progress of this project. You were always willing
to help me in all possible ways and with a smiling face.
I wish to acknowledge Huub van der Palen (always ready to help me) and Marco
Hendrix (bedankt voor de samenvatting) for their technical assistance and for their
interest in this project. Thank you very much for being so helpful !
I had a great time during this period at my research group. My room mates
Camille (thanks for being my paranimfen and a nice friend), Marcos and Yvvone are
acknowledged for creating a very friendly working atmosphere. I am indebted to all the

122
past and present members of the SMG group: Leendert, Nico, Heiner, Frank Peters,
Gunter, Sasha, Niek, Paul, Mark, Beulah (thanks for being my paranimfen), Kangboo,
Baris, Dina, Katya, Yogesh, Vladimir, Isabelle, Maarten, Qingling, Beryl, Marcel, Koen,
Cem, Jos, Karthik, Niels, Delei, Gokhan, Hesam, Maurizio and all the new members for
their creative ideas and support. Special thanks to Imanda for her support and for
making all the administrative work very smooth.
I extend my heartfelt gratitude to all my Indian friends for making my life in
Netherlands so memorable. Thanks to Ajin, Abraham-Denny, Arbind-Selina, Biju-
Reshmi, Berni-Kamalamma, Chetan-Poornima, Hrudya, Jincy, Kiran-Kavitha,
Musthafa-Shahina, Rajesh-Sheba, Sandeep-Jalaja, Seshan-Jayanthi, Shaji-Mercy,
Shaneesh-Rashija, Tony-Sheril, Vinay-Uma, Vipin-Tintu for making me feel at home.
Thanks to Alberto-Ilaria, Ben-Lidi, Elena and Natallia for the nice evening
gatherings.
I express my hearty thanks to my loving parents-in-law for their affection,
constant support and prayers extended to me. Thank you so much for always being
very supportive and helpful. Many thanks to my brother-in-law’s and sister-in-law’s:
Jose-Sheeba, Poly-Treesa, Francis-Lissy, Babu-Annie and Sabu for all their support and
wishes.
I express my hearty thanks to my sister Bindu and brother-in-law Joshy for their
love, continuous support and prayers.
My loving parents always gave great care and priority for me and for my studies.
It is with your sacrifices, support and prayers that I reached up to here. Without your
unconditional love and blessings, I would not have come so far and this thesis would
not have materialised. Thank you so much for always being with me.
Dear Iva (Ponnu), you are the most wonderful blessing in my life. Nothing is
comparable to the happiness of being your mother. You cherishes each and every
moment of my life. You don’t know how much I love you and how much I missed you
when I was busy with this thesis. Finally, I would like to thank the person without
whom this day would never have come ! Dear Babu, I am very fortunate to have you as
my partner. You have always provided steadfast support throughout the years. During
the most difficult times, you were always there to keep me happy and smiling with
your true affection and dedication that you always had towards me. Dear Babu, I owe
this thesis to you.
Above all, I thank God for the uncountable blessings showered upon me and I
lift my exuberant heart with utmost gratitude and honor.
Thank you all,
Indu Babu

123
Curriculum Vitae
Indu Babu was born in Trichur, Kerala, India. She obtained Bachelor of Science
(B.Sc.) degree in Chemistry from University of Calicut in 1998 and Master of Science
(M.Sc.) degree in Analytical Chemistry from Mahatma Gandhi University in 2001. As a
part of the M. Sc course she carried out a research project on the permeation of organic
vapors through Nylon/NBR polymer blends at School of Chemical Sciences, Mahatma
Gandhi University, India. Later, she worked as Research Assistant at Central
Instruments Laboratory, India during the period 2001-2004.
In 2004 she came to Netherlands for pursuing post-graduation in Material
Science and Technology and she received Masters in Chemical Engineering from
University of Twente in 2006. She carried out Masters research project on the
devulcanization of EPDM-Rubber vulcanizates at the Department of Elastomer
Technology and Engineering, University of Twente, The Netherlands and internship
project on the surface modification of X-Flow PES/PVP hollow fiber membranes to
control fouling at X-Flow, Norit, Enschede, The Netherlands. Later she worked (2007-
2008) as a Junior Researcher on magnetostrictive sensing materials at MESA+ Institute
of Nanotechnology, University of Twente, The Netherlands. In 2008 she started her PhD
research at Laboratory of Materials and Interface Chemistry, Department of Chemical
Engineering and Chemistry, Eindhoven University of Technology, The Netherlands
under the supervision of Prof. Dr. Gijsbertus de With. The topic of research was
“Processing and properties of piezoelectric polymer-ceramic composites for sensor
applications”. The results of this research project are presented in this thesis.