Piece by Piece Neighborhood Investment Conference Learning from Phoenix German Reyes VP, Community...
27
Piece by Piece Neighborhood Investment Conference Learning from Phoenix German Reyes VP, Community Stabilization
-
Upload
joella-mccormick -
Category
Documents
-
view
218 -
download
2
Transcript of Piece by Piece Neighborhood Investment Conference Learning from Phoenix German Reyes VP, Community...
Piece by PieceNeighborhood Investment
Conference
Learning from Phoenix
German Reyes
VP, Community Stabilization

Who is Chicanos Por La Causa (CPLC)?
501(c)3, Founded in 1969 Now one of the largest Hispanic Community Development Corporations in the United
States Approximately 750 employees
HQ in Phoenix; Operations in AZ, NV and NM Highly diverse nonprofit with 4 business “pillars”
Social Services Education Economic Development Housing
Housing Counseling Agency certified in Phoenix for 27 years Housing Counseling Agency in Las Vegas
Established in 2010 Freddie Mac Center

CPLC’s NSP2 National Program Consortium
1 of 4 National Consortiums as defined by HUD 13 Nonprofit agencies in 15 markets located in 8 states and D.C. $137M – largest grant ever to a Latino-based CDC CPLC Lead Agency due to capacity (compliance, legal, audit, F/A)
Focus on: Results! (Strict Expenditure Deadlines, and entirely affordable markets)
50% Expenditure in 24 months (Investor Activity a challenge led to “First Look”)
IMPACT – nearly 2500 “national objectives” (mostly SRF) to meet goal JOBS! Incredible “jobs” story being told as a result of housing
Strong National Relationships created to assist in REO/delinquent Asset Procurement Fannie Mae, NCST, HUD/FHA Numerous lenders, banking institutions

NSP II NATIONAL COALITION
CHISPA
NEW
CPLC
CRHDCDel Norte
El Paso CUSO
CDCBAHSTI
TRPNorrisSquare
Mi Casa
TDS
YES

NSP2 Performance
Gr 101013
• 3 Years are over – How have we done?

NATIONAL PERFORMANCE – RESULTS!!
*633 TOTAL GRANTEES*State Grantee Appropriation Grant Amount PI Drawn Total Drawn % Drawn
MI State of Michigan NSP2 $223,875,399 $8,515,929 $225,655,621 100.8%
AZ Chicanos Por La Causa, Inc. NSP2 $137,107,133 $51,518,806 $179,671,193 131.0%
CA State of California NSP1 $145,071,506 $39,503,051 $171,184,892 118.0%
GA Habitat for Humanity International Inc NSP2 $137,620,088 $0 $137,620,088 100.0%
OH State of Ohio NSP1 $116,859,223 $2,221,229 $118,768,063 101.6%
CA Los Angeles, CA NSP2 $100,000,000 $14,206,628 $112,249,389 112.2%
FL State of Florida NSP1 $91,141,478 $16,864,561 $103,899,771 114.0%
MA The Community Builders, Inc. NSP2 $78,617,631 $22,802,864 $101,420,494 129.0%
MI State of Michigan NSP1 $97,964,416 $5,619,335 $101,117,689 103.2%
IL Chicago, IL NSP2 $98,008,384 $857,141 $97,997,510 100.0%
FL NHS of South Florida, Inc. NSP2 $89,375,000 $2,547,031 $91,922,031 102.8%
IN State of Indiana - IHCDA NSP1 $83,757,048 $4,771,471 $88,528,509 105.7%
GA State of Georgia NSP1 $77,085,125 $23,015,102 $88,351,744 114.6%
TX State of Texas - TDHCA NSP1 $91,323,273 $3,547,816 $77,438,728 84.8%
CA Riverside County, CA NSP1 $48,567,786 $35,439,139 $75,962,368 156.4%
AZ Phoenix, AZ NSP2 $60,000,000 $13,788,691 $67,183,465 112.0%
FL Dade County, FL NSP1 $62,207,200 $2,632,179 $63,448,588 102.0%
PA State of Pennsylvania NSP1 $59,631,318 $6,876,454 $61,671,681 103.4%
CA Los Angeles NHS Inc. NSP2 $60,000,000 $15,228,747 $58,935,602 98.2%
Per HUD Weekly 9/9/2013
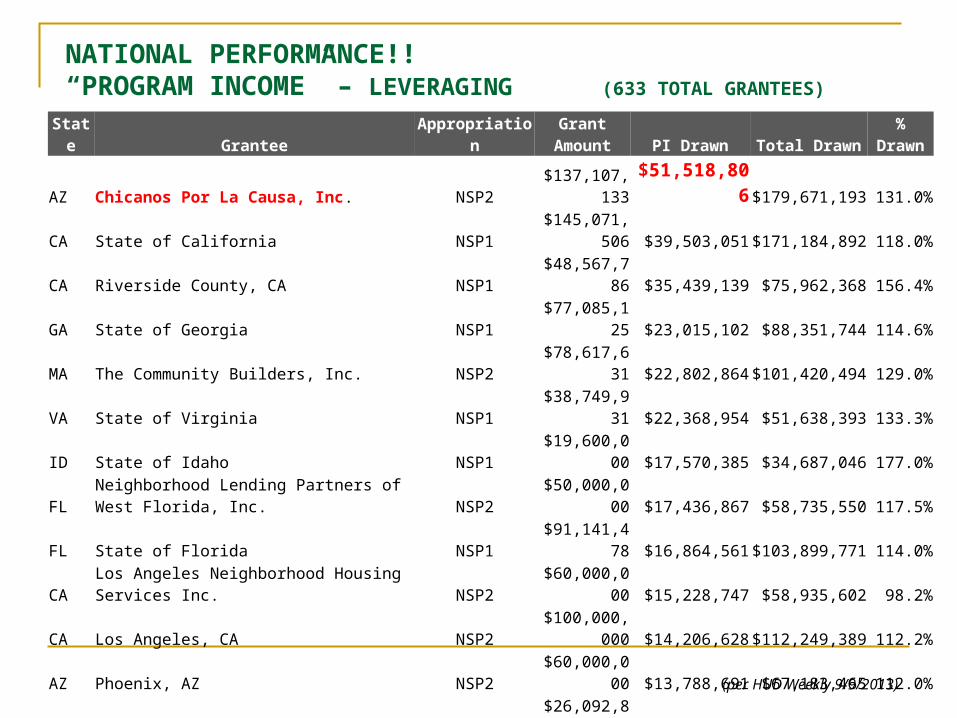
NATIONAL PERFORMANCE!! “PROGRAM INCOME” – LEVERAGING (633 TOTAL GRANTEES)
State Grantee AppropriationGrant
Amount PI Drawn Total Drawn % Drawn
AZ Chicanos Por La Causa, Inc. NSP2 $137,107,133 $51,518,806 $179,671,193 131.0%
CA State of California NSP1 $145,071,506 $39,503,051 $171,184,892 118.0%
CA Riverside County, CA NSP1 $48,567,786 $35,439,139 $75,962,368 156.4%
GA State of Georgia NSP1 $77,085,125 $23,015,102 $88,351,744 114.6%
MA The Community Builders, Inc. NSP2 $78,617,631 $22,802,864 $101,420,494 129.0%
VA State of Virginia NSP1 $38,749,931 $22,368,954 $51,638,393 133.3%
ID State of Idaho NSP1 $19,600,000 $17,570,385 $34,687,046 177.0%
FLNeighborhood Lending Partners of West Florida, Inc. NSP2 $50,000,000 $17,436,867 $58,735,550 117.5%
FL State of Florida NSP1 $91,141,478 $16,864,561 $103,899,771 114.0%
CA Los Angeles Neighborhood Housing Services Inc. NSP2 $60,000,000 $15,228,747 $58,935,602 98.2%
CA Los Angeles, CA NSP2 $100,000,000 $14,206,628 $112,249,389 112.2%
AZ Phoenix, AZ NSP2 $60,000,000 $13,788,691 $67,183,465 112.0%
MD Healthy Neighborhoods Inc. NSP2 $26,092,880 $12,316,489 $35,134,012 134.6%
CA Hsg Trust of Santa Clara County NSP2 $25,000,000 $11,354,019 $30,967,740 123.9%
MN State of Minnesota NSP1 $38,849,929 $11,036,129 $46,580,506 119.9%
(per HUD Weekly 9/9/2013)
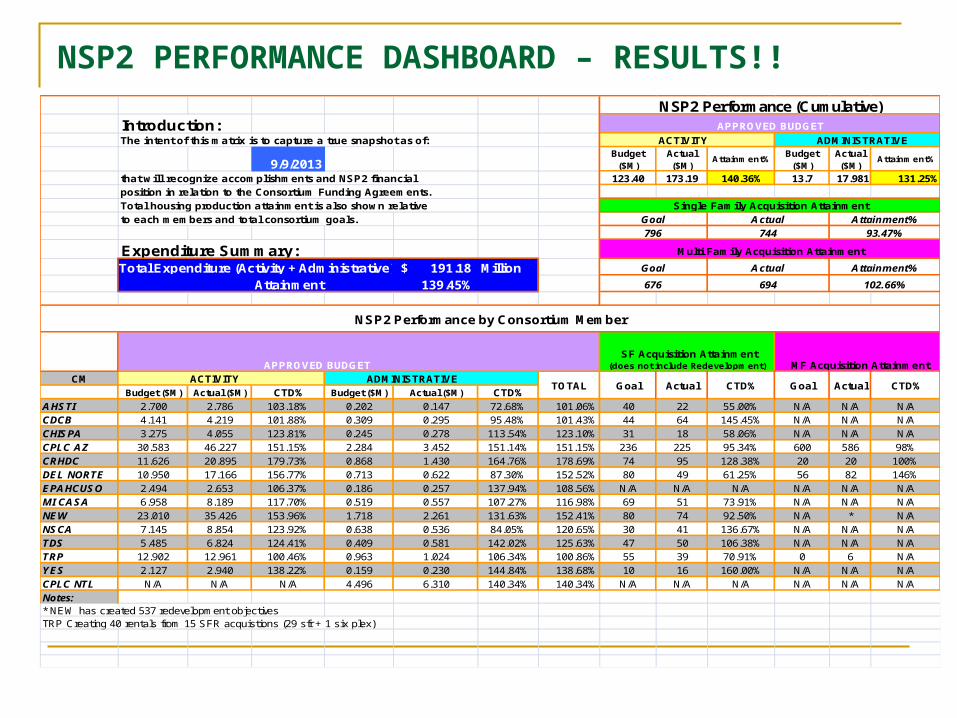
NSP2 PERFORMANCE DASHBOARD – RESULTS!!
Introduction:The intent of this matrix is to capture a true snapshot as of: ACTIVITY ADMINISTRATIVE
9/9/2013Budget
($M)Actual ($M)
Attainment%Budget
($M)Actual ($M)
Attainment%
that will recognize accomplishments and NSP2 financial 123.40 173.19 140.36% 13.7 17.981 131.25%position in relation to the Consortium Funding Agreements.Total housing production attainment is also shown relativeto each members and total consortium goals.
Expenditure Summary:191.18$ Million
Attainment 139.45%
APPROVED BUDGETCM ACTIVITY ADMINISTRATIVE
Budget ($M) Actual ($M) CTD% Budget ($M) Actual ($M) CTD%AHSTI 2.700 2.786 103.18% 0.202 0.147 72.68% 101.06% 40 22 55.00% N/A N/A N/ACDCB 4.141 4.219 101.88% 0.309 0.295 95.48% 101.43% 44 64 145.45% N/A N/A N/ACHISPA 3.275 4.055 123.81% 0.245 0.278 113.54% 123.10% 31 18 58.06% N/A N/A N/ACPLC AZ 30.583 46.227 151.15% 2.284 3.452 151.14% 151.15% 236 225 95.34% 600 586 98%CRHDC 11.626 20.895 179.73% 0.868 1.430 164.76% 178.69% 74 95 128.38% 20 20 100%DEL NORTE 10.950 17.166 156.77% 0.713 0.622 87.30% 152.52% 80 49 61.25% 56 82 146%EPAHCUSO 2.494 2.653 106.37% 0.186 0.257 137.94% 108.56% N/A N/A N/A N/A N/A N/AMI CASA 6.958 8.189 117.70% 0.519 0.557 107.27% 116.98% 69 51 73.91% N/A N/A N/ANEW 23.010 35.426 153.96% 1.718 2.261 131.63% 152.41% 80 74 92.50% N/A * N/ANSCA 7.145 8.854 123.92% 0.638 0.536 84.05% 120.65% 30 41 136.67% N/A N/A N/ATDS 5.485 6.824 124.41% 0.409 0.581 142.02% 125.63% 47 50 106.38% N/A N/A N/ATRP 12.902 12.961 100.46% 0.963 1.024 106.34% 100.86% 55 39 70.91% 0 6 N/AYES 2.127 2.940 138.22% 0.159 0.230 144.84% 138.68% 10 16 160.00% N/A N/A N/ACPLC NTL N/A N/A N/A 4.496 6.310 140.34% 140.34% N/A N/A N/A N/A N/A N/ANotes:* NEW has created 537 redevelopment objectivesTRP Creating 40 rentals from 15 SFR acquistions (29 sfr + 1 six plex)
796 744 93.47%
Total Expenditure (Activity + Administrative) Goal Actual Attainment%
NSP2 Performance (Cumulative)APPROVED BUDGET
Single Family Acquisition AttainmentGoal Actual Attainment%
Goal Actual CTD%
NSP2 Performance by Consortium Member
TOTAL Goal Actual CTD%
102.66%
Multi Family Acquisition Attainment
SF Acquisition Attainment (does not include Redevelopment) MF Acquisition Attainment
676 694

CPLC’s NSP2 National Program - Impact
CPLC has made significant efforts to measure local and national impact of NSP2.
Direct and induced impact is critical to the stabilization of communities
A few highlites for AZ Market: CPLC AZ received $32M in NSP2 grant monies (most in consortium) NSP2 is forecasted to add $66.33M in gross state product for the
period 2010-2013. This is DOUBLE the initial federal investment! NSP2 is forecasted to add nearly $40M in real disposable income in
the state of Arizona (2010-2013) Attribute success at National Level to our deep-rooted CDCs with
Housing Counseling Agencies
CPLC’s NSP2 National Program – Jobs!
Section 3 extremely important in strategy implementation Creating local job opportunities to individuals Creating local contract opportunities to contractors
Great success in creating and retaining jobs Created a measurable outcome illustrating the opportunity
of job creation and economic development using federal funds/stimulus…but something that can be replicated in open market

Learning from “NSP2” Phoenix
• Significant learning from single family REO development (acq, rehab and resale)
• Estimation of rehab critical• 25-30% of Acquisition Price was reasonable
• CPLC witnessed price increases over the last 2-3 years prior to frantic activity in Phx area• For example, early on, It was common to leave significant development
subsidy… TDC: $90,000 acquisition + $30000 rehab - sell for $100,000
• Approximately two years ago, values were rising fast: TDC: $100,000 acquisition + $30,000 rehab - appraised values were
greater than $130,000 Prices increases in excess of 30% when same property was re-sold
became common (market trend was noticeably positive) Effectively presented a value-proposition for investors

LEARNING FROM PHOENIX
Atlanta & Phoenix Markets
2/16/12

REAL ESTATE MARKET SNAPSHOT
Jan-1991Jan-1994Jan-1997Jan-2000Jan-2003Jan-2006Jan-2009Jan-20120
20
40
60
80
100
120
140
160
S&P/Case-Shiller GA-Atlanta Home Price Index
S&P/Case-Shiller GA-Atlanta Home Price Index

A Comparison of Markets
Gr 101013
Jan-1991Jan-1993Jan-1995Jan-1997Jan-1999Jan-2001Jan-2003Jan-2005Jan-2007Jan-2009Jan-2011Jan-20130
50
100
150
200
250
S&P/Case-Shiller GA-Atlanta Home Price Index
S&P/Case-Shiller GA-Phoenix Home Price Index

A Comparison of Markets
Gr 101013
Effective date
S&P/Case-Shiller GA-
Atlanta Home Price Index
S&P/Case-Shiller GA-Phoenix Home Price Index
Jun-2012 91.75 114.68
Jul-2012 94.15 117.22
Aug-2012 95.8 119.28
Sep-2012 96.06 120.65
Oct-2012 95.6 122.39
Nov-2012 95.68 124.16
Dec-2012 95.95 125.33
Jan-2013 96.98 126.69
Feb-2013 97.01 128.1
Mar-2013 98.25 130.29
Apr-2013 102.01 132.47
May-2013 105.51 134.97
Jun-2013 109.15 137.36
Jul-2013 111.54 139.36
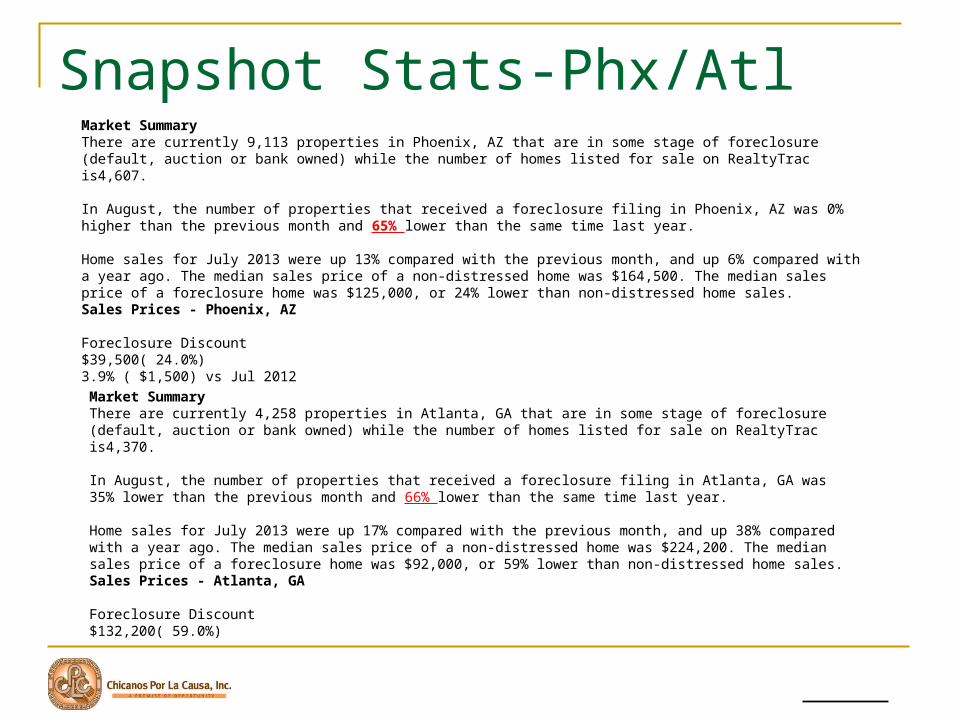
Snapshot Stats-Phx/Atl
www.cplc.org
Market SummaryThere are currently 9,113 properties in Phoenix, AZ that are in some stage of foreclosure (default, auction or bank owned) while the number of homes listed for sale on RealtyTrac is4,607.
In August, the number of properties that received a foreclosure filing in Phoenix, AZ was 0% higher than the previous month and 65% lower than the same time last year.
Home sales for July 2013 were up 13% compared with the previous month, and up 6% compared with a year ago. The median sales price of a non-distressed home was $164,500. The median sales price of a foreclosure home was $125,000, or 24% lower than non-distressed home sales. Sales Prices - Phoenix, AZ
Foreclosure Discount$39,500( 24.0%)3.9% ( $1,500) vs Jul 2012
Market SummaryThere are currently 4,258 properties in Atlanta, GA that are in some stage of foreclosure (default, auction or bank owned) while the number of homes listed for sale on RealtyTrac is4,370.
In August, the number of properties that received a foreclosure filing in Atlanta, GA was 35% lower than the previous month and 66% lower than the same time last year.
Home sales for July 2013 were up 17% compared with the previous month, and up 38% compared with a year ago. The median sales price of a non-distressed home was $224,200. The median sales price of a foreclosure home was $92,000, or 59% lower than non-distressed home sales. Sales Prices - Atlanta, GA
Foreclosure Discount$132,200( 59.0%)
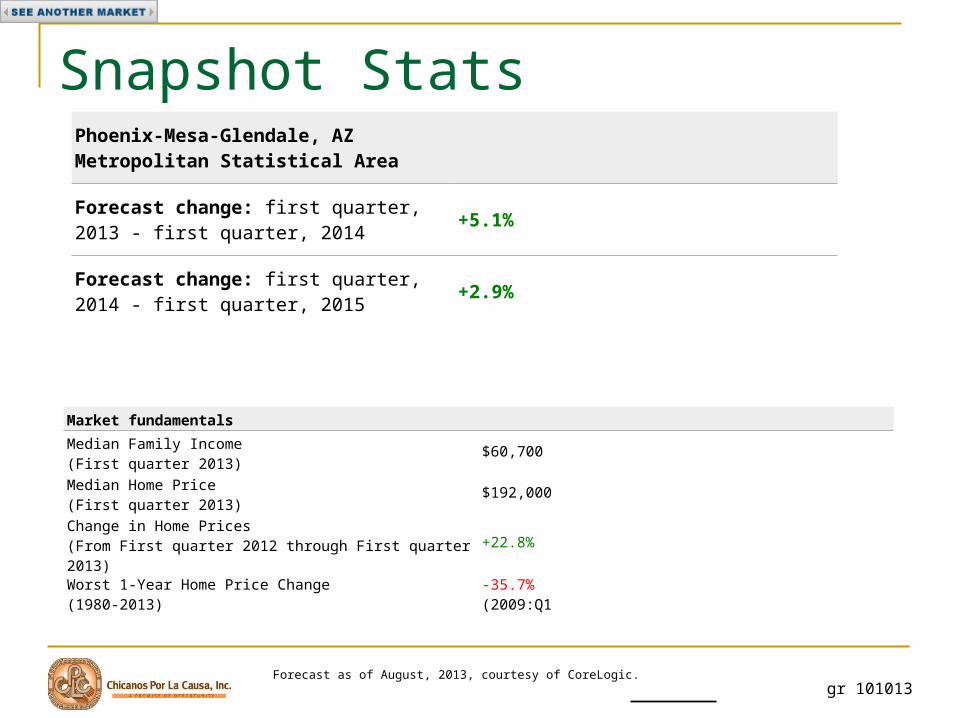
Snapshot Stats
gr 101013
Phoenix-Mesa-Glendale, AZ Metropolitan Statistical Area
Forecast change: first quarter, 2013 - first quarter, 2014
+5.1%
Forecast change: first quarter, 2014 - first quarter, 2015
+2.9%
Market fundamentals
Median Family Income(First quarter 2013) $60,700
Median Home Price(First quarter 2013) $192,000
Change in Home Prices(From First quarter 2012 through First quarter 2013) +22.8%
Worst 1-Year Home Price Change(1980-2013)
-35.7%(2009:Q1
Forecast as of August, 2013, courtesy of CoreLogic.

Snapshot Stats
gr 101013
Atlanta-Sandy Springs-Marietta, GA Metropolitan Statistical Area
Forecast change: first quarter, 2013 - first quarter, 2014
+4.9%
Forecast change: first quarter, 2014 - first quarter, 2015
+3.3%
Market fundamentals
Median Family Income(First quarter 2013)
$66,200
Median Home Price(First quarter 2013)
$146,000
Change in Home Prices(From First quarter 2012 through First quarter 2013)
+19.2%
Worst 1-Year Home Price Change(1980-2013)
-17.6%(2012:Q1
Forecast as of August, 2013, courtesy of CoreLogic.

www.cplc.org
•More than half of the markets in the index, 14, were down by 20% or more compared to March of 2006 and
•Las Vegas was down in excess of 53%.•Markets in California and the sand states of Florida, Nevada and Arizona
were down by the largest amounts despite frenzied investor purchases.

NUMBER OF PROPERTIES PER ESTIMATED MARKET
HIGHEST AVAILABILITY
$100-200K/7,552 PROPERTIES
Realtytrac2013

• THE NATIONAL HOMEOWNERSHIP RATE PEAKED AT 69% IN 2004, BUT FELL FOUR PERCENTAGE POINTS TO 65% IN THE 2ND QUARTER OF 2013.
DESPITE HAVING EXPERIENCED THE LARGE NUMBER OF FORECLOSURES IN CALIFORNIA AND FLORIDA, THOSE STATES ARE NOT AMONG THE TOP FIVE STATES IN TERMS OF CHANGE IN HOMEOWNERSHIP, THOUGH NEVADA IS.
National Association of Realtors
Markets with the Largest Change in Homeownership RateNevada Homeownership rate = 53.3% 2nd QTR 2013

Investor Activity (buy vs rent) If I’m an investor, do I continue to buy? It’s all about location What is the Area Median Income? What is the Median
Home Price for the area? Maximum ratios used to compute housing expense
For example: $60,000 = AMI for a family of 4 (Phx AMI = $60,700) Equates to $5000 gross / month Equates to $1500 / mo as a Housing Expense (per 30% ratio) M*I = $1200 if T&I&HOA, etc = $300/mo (approx 20%) At 3.5% DP, a 30 year, 5.5% mortgage allows a family to purchase:
$219,000! P&I payment = $1199.94

Investor Activity In Phoenix, recall:
Median Home Price = $192,000 “Affordable” Price point = $219,000 Represents an upside of: $27,000 or 14%
In Atlanta, recall: Median Home Price = $146,000 Area Median Income = $66,200 Using similar approach, P&I = $1320 (Housing Expense Max) This represents an “Affordable Price” = $241,000 Represents an upside of: $95,000 or 65%!
Note: Housing Expense Max is also related to maximum lease/rent amount! So analyzing Fair Market Rents provides a rental strategy as well.
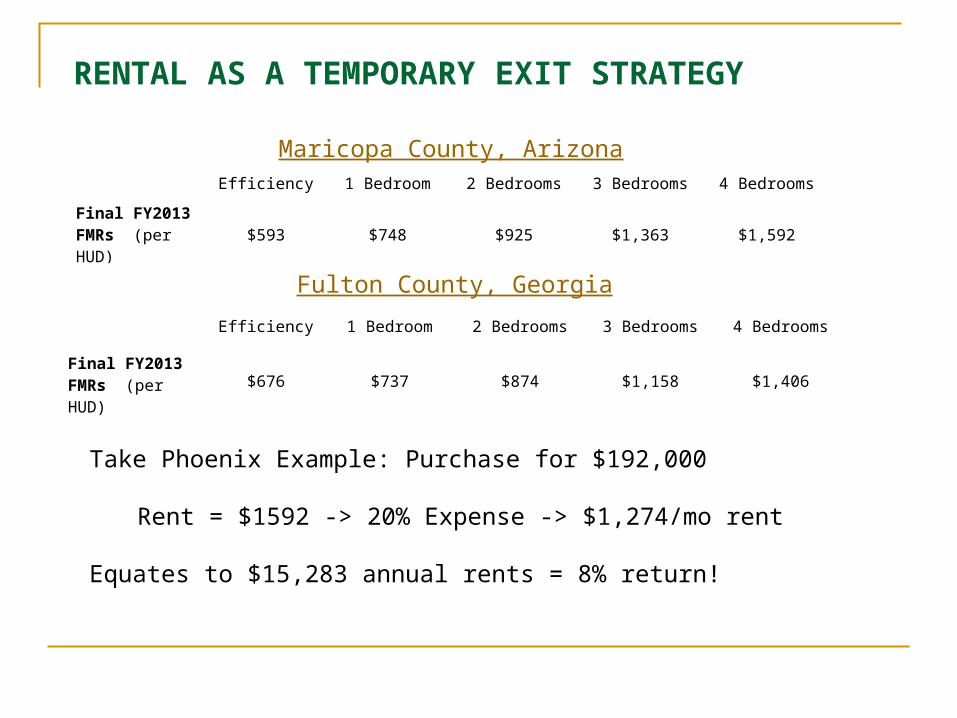
RENTAL AS A TEMPORARY EXIT STRATEGY
Maricopa County, ArizonaEfficiency 1 Bedroom 2 Bedrooms 3 Bedrooms 4 Bedrooms
Final FY2013 FMRs (per HUD)
$593 $748 $925 $1,363 $1,592
Take Phoenix Example: Purchase for $192,000
Rent = $1592 -> 20% Expense -> $1,274/mo rent
Equates to $15,283 annual rents = 8% return!
Fulton County, Georgia
Efficiency 1 Bedroom 2 Bedrooms 3 Bedrooms 4 Bedrooms
Final FY2013 FMRs (per HUD)
$676 $737 $874 $1,158 $1,406

Investor Activity Is it good? Is it stabilizing neighborhoods?
Yes, certainly initially. Investments spurs confidence if capital infused in economic development, jobs, etc. Begins to create a bottom to local housing prices Neighborhood “Confidence”
Long term – if left as rental, perhaps not so good Where is the wealth? Especially for disproportionately affected communities predominantly Latino or African
American? Investors strip wealth from communities. So what’s the balance?
Neighborhood Homeownership typically preferred over rentership. Why?
Assume “pride of ownership” when you own vs rent Homeowners are vested in their community (schools, church, etc)
Renters – are they preferable to vacancy? If Pride of Ownership exists with tenants – yes. If not, maybe vacancy preferred if property is
maintained by owner Why lease with option to buy makes sense…tenant has a vested interest in the property
Constrained Demand Creates Opportunity for new construction
In submarkets, Investors can drive the market Certain areas may be prone to downward pressure if investors “dump” their inventory Can we create a “hybrid” model where Investors incorporate non profit developers into their model?

A Happy Medium? How do we (ie. Non profits) work with investors? Offer them a channel to procure qualified homebuyers or:
Lease to own tenants/buyers Counseling/HBE incredibly important for potential homeowners, especially
FTHB Exit strategy for the investor?
Sell underperforming assets to local nonprofits?
Make them “socially-minded” Walk the talk
Investors “say” they are mindful of markets, etc. Clear that they are purchasing ‘commodities’ when they make decisions
Set aside a portion of their homes for low income?!? Creative strategy for investors as they look to bid/win large FHA pools
Certain Submarkets may present a very effective partnership as other subsidies may be inserted by the non profit Non profit can effectively assist in hedging an investor’s “downside”

MUCHAS GRACIAS!