Phillips 66 Third-Quarter Earnings Conference Call
42
PHILLIPS 66 THIRD QUARTER CONFERENCE CALL October 30, 2015
-
Upload
investorphillips66 -
Category
Investor Relations
-
view
168 -
download
0
Transcript of Phillips 66 Third-Quarter Earnings Conference Call

PHILLIPS 66 THIRD QUARTER CONFERENCE CALL October 30, 2015

This presentation contains certain forward-looking statements within the meaning of Section 27A of the Securities Act of 1933, as amended, and
Section 21E of the Securities Exchange Act of 1934, as amended, which are intended to be covered by the safe harbors created thereby. Words and
phrases such as “is anticipated,” “is estimated,” “is expected,” “is planned,” “is scheduled,” “is targeted,” “believes,” “intends,” “objectives,” “projects,”
“strategies” and similar expressions are used to identify such forward-looking statements. However, the absence of these words does not mean that a
statement is not forward-looking. Forward-looking statements relating to Phillips 66’s operations (including joint venture operations) are based on
management’s expectations, estimates and projections about the company, its interests and the energy industry in general on the date this
presentation was prepared. These statements are not guarantees of future performance and involve certain risks, uncertainties and assumptions that
are difficult to predict. Therefore, actual outcomes and results may differ materially from what is expressed or forecast in such forward-looking
statements. Factors that could cause actual results or events to differ materially from those described in the forward-looking statements include
fluctuations in NGL, crude oil and natural gas prices, and petrochemical and refining margins; unexpected changes in costs for constructing, modifying
or operating our facilities; unexpected difficulties in manufacturing, refining or transporting our products; lack of, or disruptions in, adequate and
reliable transportation for our NGL, crude oil, natural gas and refined products; potential liability from litigation or for remedial actions, including
removal and reclamation obligations, under environmental regulations; limited access to capital or significantly higher cost of capital related to
illiquidity or uncertainty in the domestic or international financial markets; and other economic, business, competitive and/or regulatory factors
affecting Phillips 66’s businesses generally as set forth in our filings with the Securities and Exchange Commission. Phillips 66 is under no obligation
(and expressly disclaims any such obligation) to update or alter its forward-looking statements, whether as a result of new information, future events or
otherwise.
This presentation includes non-GAAP financial measures. You can find the reconciliations to comparable GAAP financial measures at the end of the
presentation materials or in the “Investors” section of our website.
CAUTIONARY STATEMENT
2
3
EXECUTING STRATEGY

4
OVERVIEW 3Q 2015
Adjusted Earnings $1.6 B
Adjusted EPS $3.02
Operating cash flow excluding working capital $1.5 B
Capital expenditures and investments $1.0 B
Shareholder distributions $673 MM
Adjusted net debt-to-capital ratio 12%
Annualized adjusted YTD ROCE 15%
Shareholder distributions include dividends and share repurchases
Adjusted net debt-to-capital ratio excludes the impacts of PSXP

1,002
1,647
43
(23)
448
162 15
2Q 2015
Adjusted
Earnings
Midstream Chemicals Refining Marketing
& Specialties
Corporate
& Other
3Q 2015
Adjusted
Earnings
3Q 2015 Adjusted Earnings
$MM
91 (112) 1,052 272 344
ADJUSTED EARNINGS 3Q 2015 VS. 2Q 2015
5

6
MIDSTREAM OVERVIEW 3Q 2015
Transportation Higher volumes, lower operating costs
NGL Strong margins
PSXP Distributions up 7%
DCP Midstream Improved marketing margins
ROCE 5%
ROCE is annualized adjusted YTD

48
91
12
24
7
2Q 2015
Adjusted
Earnings
Transportation NGL DCP
Midstream
3Q 2015
Adjusted
Earnings
$MM
MIDSTREAM 3Q 2015 VS. 2Q 2015
77 32 (18)
3Q 2015 Adjusted Earnings 7

8
CHEMICALS OVERVIEW 3Q 2015
Olefins & Polyolefins Higher volumes and lower costs
Specialties, Aromatics & Styrenics Lower margins and volumes
ROCE 21%
ROCE is annualized adjusted YTD

295 272
(6)(21)
4
2Q 2015
Adjusted
Earnings
Olefins &
Polyolefins
Specialties,
Aromatics &
Styrenics
Other 3Q 2015
Adjusted
Earnings
$MM
CHEMICALS 3Q 2015 VS. 2Q 2015
9
3Q 2015 Adjusted Earnings
261 (6) 17

10
REFINING OVERVIEW 3Q 2015
Realized refining margin $13.96/BBL
Worldwide market capture 72%
Refining crude utilization 96%
Clean product yield 84%
ROCE 21%
ROCE is annualized adjusted YTD

604
1,052
103
202
156
(13)
2Q 2015
Adjusted
Earnings
Atlantic
Basin /
Europe
Gulf Coast Central
Corridor
Western /
Pacific
3Q 2015
Adjusted
Earnings
$MM
REFINING 3Q 2015 VS. 2Q 2015
11
193 372 285 202
3Q 2015 Adjusted Earnings

19.51
13.96
(4.14)
(2.47)
0.75 0.31
Market
3:2:1
Configuration Secondary
Products
Feedstock Other Realized
Margin
WORLDWIDE REFINING $/BBL
REFINING MARGINS – MARKET VS. REALIZED 3Q 2015
12
Avg Market Crude: $49.54/BBL 96% Crude Capacity Utilization 72% Market Capture

13
MARKETING AND SPECIALTIES OVERVIEW 3Q 2015
Marketing Higher global margins and volumes
Specialties Strong lubricants margins
ROCE 33%
ROCE is annualized adjusted YTD

182
344
157 5
2Q 2015
Adjusted
Earnings
Marketing
& Other
Specialties 3Q 2015
Adjusted
Earnings
$MM
MARKETING AND SPECIALTIES 3Q 2015 VS. 2Q 2015
14
291 53
3Q 2015 Adjusted Earnings

(127)(112)
6 36
2Q 2015
Adjusted
Net Loss
Net Interest
Expense
Corporate
Overhead Other
3Q 2015
Adjusted
Net Loss
$MM
CORPORATE AND OTHER 3Q 2015 VS. 2Q 2015
15

22.4 22.0
22.6
23.2
24.0
22.0 21.6 21.8
22.4
23.2
6.2
8.7 8.9 9.0 9.0
6.2
8.7 7.8 7.9 7.9
5.4 5.2 5.4 5.1 4.8 5.0 5.2 5.3 5.0 4.7
22%
28% 28% 28%27%
22%
29%
26%26% 25%
2013 2014 1Q 2015 2Q 2015 3Q 2015 2013 2014 1Q 2015 2Q 2015 3Q 2015
Equity $B Debt $B Cash & Cash Equivalents $B Debt-to-Capital
20%-30%
CAPITAL STRUCTURE 2013 – 3Q 2015
16
Consolidated PSX Excluding PSXP

5.2 4.8
4.1 0.1
1.5
(0.8)
(3.3)
(2.0)
December
2014 CashBalance*
CFO
(excludingworking
capital)
Working
Capital
PSXP Bond &
Equity Proceeds
Debt
Repayment
Capital
Expenditures& Investments
Shareholder
Distributions
September
2015 CashBalance*
$B
CASH FLOW YTD 2015
17
* Includes cash and cash equivalents

18
Global Olefins & Polyolefins utilization Mid-90%
Refining crude utilization Mid-90%
2015 full year consolidated capital expenditures $4.3 B
Effective income tax rate Mid-30%
Corporate & Other costs (after-tax) $110 MM - $120 MM
OUTLOOK 4Q 2015
Refining turnaround expenses (pre-tax) ~$150 MM
DCP equity contribution $1.5 B

PHILLIPS 66 THIRD QUARTER 2015 CONFERENCE CALL
Questions and Answers

PHILLIPS 66 THIRD QUARTER 2015 CONFERENCE CALL
Appendix

ESTIMATED SENSITIVITIES 2015
21 Sensitivities shown above are independent and are only valid within a limited price range
Annual Net Income $MM
Midstream - DCP (net to Phillips 66)
10¢/Gal Increase in NGL price 30
$1/MMBtu Increase in Natural Gas price 25
$10/BBL Increase in WTI price 15
Chemicals - CPChem (net to Phillips 66)
1¢/Lb Increase in Chain Margin (Ethylene, Polyethylene, NAO) 35
Worldwide Refining
$1/BBL Increase in Gasoline Margin 220
$1/BBL Increase in Distillate Margin 200
$1/BBL Widening LLS / Maya Differential (LLS less Maya) 50
$1/BBL Widening WTI / WCS Differential (WTI less WCS) 40
$1/BBL Widening WTI / WTS Differential (WTI less WTS) 15
$1/BBL Widening LLS / Medium Sour Differential (LLS less Medium Sour) 15
$1/BBL Widening ANS / WCS Differential (ANS less WCS) 10
10¢/MMBtu Increase in Natural Gas price (10)
Impacts due to Actual Crude Feedstock Differing from Feedstock Assumed in Market Indicators:

18.32
10.27
(3.96)(1.14)
(2.06)(0.89)
Market
3:2:1
Configuration Secondary
Products
Feedstock Other Realized
Margin
ATLANTIC BASIN / EUROPE $/BBL
REFINING MARGINS – MARKET VS. REALIZED 3Q 2015
22
Market 3:2:1 – Dated Brent / Gasoline 83.7 RBOB NYH / Diesel 15ppm NYH
Brent: $50.26/BBL 97% Crude Capacity Utilization 56% Market Capture

13.34
10.72
(3.07)
(3.26)
2.00
1.71
Market
3:2:1
Configuration Secondary
Products
Feedstock Other Realized
Margin
GULF COAST $/BBL
REFINING MARGINS – MARKET VS. REALIZED 3Q 2015
23
Market 3:2:1 – LLS / Gasoline 85 CBOB / Diesel 61 8ppm
LLS: $50.13/BBL 100% Crude Capacity Utilization 80% Market Capture

22.03 20.97
(2.91)
(2.18)
1.10
2.93
Market
3:2:1
Configuration Secondary
Products
Feedstock Other Realized
Margin
CENTRAL CORRIDOR $/BBL
REFINING MARGINS – MARKET VS. REALIZED 3Q 2015
24
Market 3:2:1 – WTI / Gasoline Unl Sub Octane Group 3 / ULSD Group 3
WTI: $46.37/BBL 91% Crude Capacity Utilization 95% Market Capture
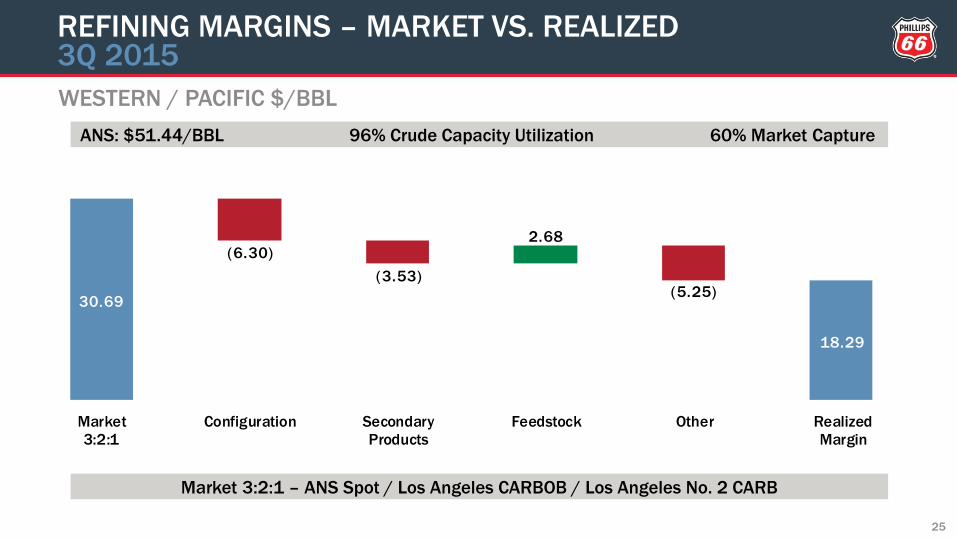
30.69
18.29
(6.30)
(3.53)
2.68
(5.25)
Market
3:2:1
Configuration Secondary
Products
Feedstock Other Realized
Margin
WESTERN / PACIFIC $/BBL
REFINING MARGINS – MARKET VS. REALIZED 3Q 2015
25
Market 3:2:1 – ANS Spot / Los Angeles CARBOB / Los Angeles No. 2 CARB
ANS: $51.44/BBL 96% Crude Capacity Utilization 60% Market Capture

1,140
1,647
(24) (27)
494 85
(21)
3Q 2014
Adjusted
Earnings
Midstream Chemicals Refining Marketing
& Specialties
Corporate
& Other
3Q 2015
Adjusted
Earnings
3Q 2015 Adjusted Earnings
$MM
91 (112) 1,052 272 344
ADJUSTED EARNINGS 3Q 2015 VS. 3Q 2014
26

115 91
19 6
(49)
3Q 2014
Adjusted
Earnings
Transportation NGL DCP
Midstream
3Q 2015
Adjusted
Earnings
$MM
MIDSTREAM 3Q 2015 VS. 3Q 2014
27
77 32 (18)
3Q 2015 Adjusted Earnings

299 272
2
(29) 0
3Q 2014
Adjusted
Earnings
Olefins &
Polyolefins
Specialties,
Aromatics &
Styrenics
Other 3Q 2015
Adjusted
Earnings
$MM
CHEMICALS 3Q 2015 VS. 3Q 2014
28
261 (6) 17
3Q 2015 Adjusted Earnings

558
1,052
53
219 44
178
3Q 2014
Adjusted
Earnings
Atlantic
Basin /
Europe
Gulf
Coast
Central
Corridor
Western /
Pacific
3Q 2015
Adjusted
Earnings
$MM
REFINING 3Q 2015 VS. 3Q 2014
29
193 372 285 202
3Q 2015 Adjusted Earnings

259
344
75 10
3Q 2014
Adjusted
Earnings
Marketing
& Other
Specialties 3Q 2015
Adjusted
Earnings
$MM
MARKETING AND SPECIALTIES 3Q 2015 VS. 3Q 2014
30
291 53
3Q 2015 Adjusted Earnings
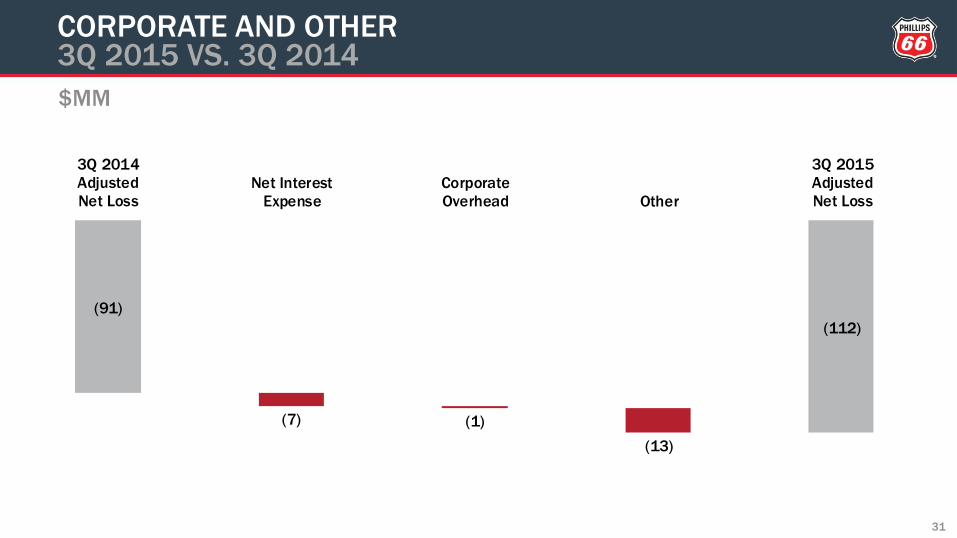
(91)
(112)
(7) (1)
(13)
3Q 2014
Adjusted
Net Loss
Net Interest
Expense
Corporate
Overhead Other
3Q 2015
Adjusted
Net Loss
$MM
CORPORATE AND OTHER 3Q 2015 VS. 3Q 2014
31

5.1 4.8
0.0
1.5
(1.0)
(0.7) (0.1)
June 30
CashBalance*
CFO
(excludingworking
capital)
Working
Capital
Capital
Expenditures&
Investments
Shareholder
Distributions
Other September 30
CashBalance*
$B
CASH FLOW 3Q 2015
32
* Includes cash and cash equivalents

33
NON-GAAP RECONCILIATIONS
Sep YTD 3Q 2Q Sep YTD 3Q
Phillips 66
Net Income (Loss) Attributable to Phillips 66 3,577$ 1,578$ 1,012$ 3,615$ 1,180$
Adjustments:
Asset dispositions (265) (18) (132) (109) (109)
Pension settlement expense 46 46 - - -
Impairments by equity affiliates 148 22 126 69 69
Pending claims and settlements (23) 19 (4) - -
Discontinued Operations - - - (706) -
Adjusted Net Income (Loss) Attributable to Phillips 66 3,483$ 1,647$ 1,002$ 2,869$ 1,140$
Net Income (Loss) Attributable to Phillips 66 Per Share of Common Stock (dollars) 6.52$ 2.90$ 1.84$ 6.28$ 2.09$
Adjusted Net Income (Loss) Attributable to Phillips 66 Per Share of Common Stock (dollars) 6.34$ 3.02$ 1.83$ 4.98$ 2.02$
Millions of Dollars
Except as Indicated
2015 2014

34
NON-GAAP RECONCILIATIONS
Sep YTD 3Q 2Q Sep YTD 3Q
Midstream
Net Income (Loss) Attributable to Phillips 66 90$ 101$ (78)$ 411$ 115$
Adjustments:
Pension settlement expense 6 6 - - -
Impairments by equity affiliates 128 2 126 - -
Asset dispositions (18) (18) - - -
Adjusted Net Income (Loss) Attributable to Phillips 66 206$ 91$ 48$ 411$ 115$
Chemicals
Net Income (Loss) Attributable to Phillips 66 750$ 252$ 295$ 870$ 230$
Adjustments:
Impairments by equity affiliates 20 20 - 69 69
Adjusted Net Income (Loss) Attributable to Phillips 66 770$ 272$ 295$ 939$ 299$
Millions of Dollars
Except as Indicated
2015 2014
35
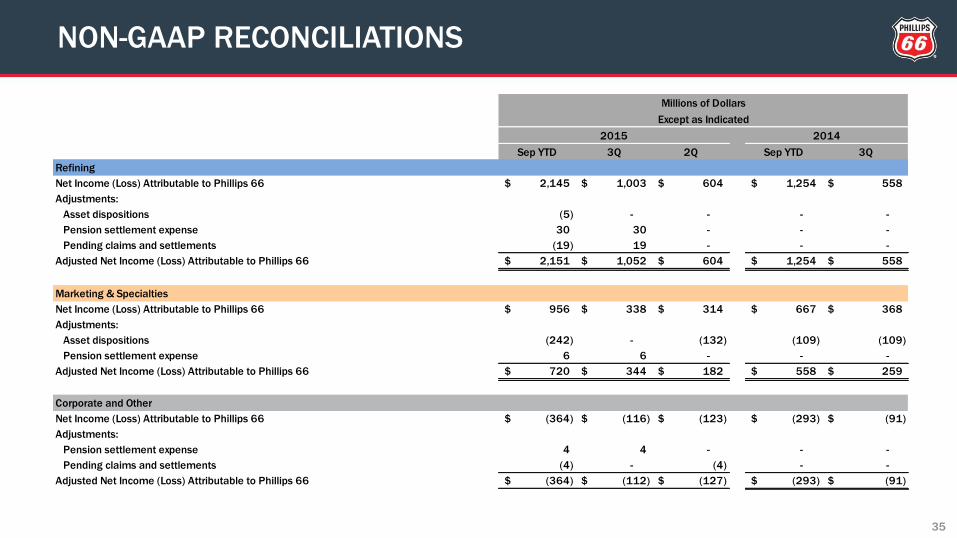
NON-GAAP RECONCILIATIONS
Sep YTD 3Q 2Q Sep YTD 3Q
Refining
Net Income (Loss) Attributable to Phillips 66 2,145$ 1,003$ 604$ 1,254$ 558$
Adjustments:
Asset dispositions (5) - - - -
Pension settlement expense 30 30 - - -
Pending claims and settlements (19) 19 - - -
Adjusted Net Income (Loss) Attributable to Phillips 66 2,151$ 1,052$ 604$ 1,254$ 558$
Marketing & Specialties
Net Income (Loss) Attributable to Phillips 66 956$ 338$ 314$ 667$ 368$
Adjustments:
Asset dispositions (242) - (132) (109) (109)
Pension settlement expense 6 6 - - -
Adjusted Net Income (Loss) Attributable to Phillips 66 720$ 344$ 182$ 558$ 259$
Corporate and Other
Net Income (Loss) Attributable to Phillips 66 (364)$ (116)$ (123)$ (293)$ (91)$
Adjustments:
Pension settlement expense 4 4 - - -
Pending claims and settlements (4) - (4) - -
Adjusted Net Income (Loss) Attributable to Phillips 66 (364)$ (112)$ (127)$ (293)$ (91)$
2015 2014
Millions of Dollars
Except as Indicated

36
NON-GAAP RECONCILIATIONS
Sep YTD 3Q 2Q Sep YTD 3Q
Midstream - Transportation
Net Income (Loss) Attributable to Phillips 66 207$ 77$ 65$ 180$ 58$
Adjustments:
Adjusted Net Income (Loss) Attributable to Phillips 66 207$ 77$ 65$ 180$ 58$
Midstream - NGL
Net Income (Loss) Attributable to Phillips 66 48$ 26$ 8$ 84$ 26$
Adjustments:
Pension settlement expense 6 6 - - -
Adjusted Net Income (Loss) Attributable to Phillips 66 54$ 32$ 8$ 84$ 26$
Midstream - DCP Midstream
Net Income (Loss) Attributable to Phillips 66 (165)$ (2)$ (151)$ 147$ 31$
Adjustments:
Impairments by equity affiliates 128 2 126 - -
Asset dispositions (18) (18) - - -
Adjusted Net Income (Loss) Attributable to Phillips 66 (55)$ (18)$ (25)$ 147$ 31$
Millions of Dollars
Except as Indicated
2015 2014
37
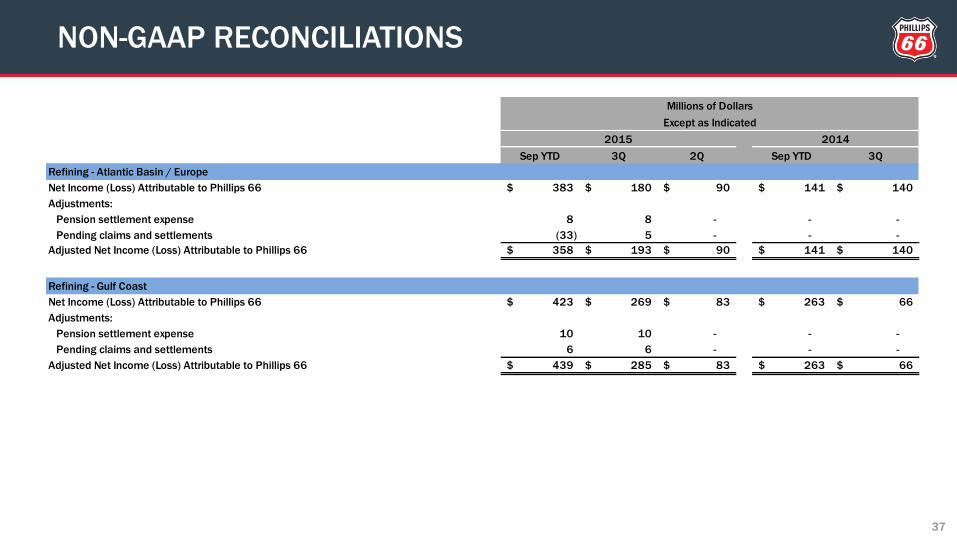
NON-GAAP RECONCILIATIONS
Sep YTD 3Q 2Q Sep YTD 3Q
Refining - Atlantic Basin / Europe
Net Income (Loss) Attributable to Phillips 66 383$ 180$ 90$ 141$ 140$
Adjustments:
Pension settlement expense 8 8 - - -
Pending claims and settlements (33) 5 - - -
Adjusted Net Income (Loss) Attributable to Phillips 66 358$ 193$ 90$ 141$ 140$
Refining - Gulf Coast
Net Income (Loss) Attributable to Phillips 66 423$ 269$ 83$ 263$ 66$
Adjustments:
Pension settlement expense 10 10 - - -
Pending claims and settlements 6 6 - - -
Adjusted Net Income (Loss) Attributable to Phillips 66 439$ 285$ 83$ 263$ 66$
Millions of Dollars
Except as Indicated
2015 2014

38
NON-GAAP RECONCILIATIONS
Sep YTD 3Q 2Q Sep YTD 3Q
Refining - Central Corridor
Net Income (Loss) Attributable to Phillips 66 771$ 360$ 216$ 785$ 328$
Adjustments:
Pension settlement expense 7 7 - - -
Pending claims and settlements 5 5 - - -
Adjusted Net Income (Loss) Attributable to Phillips 66 783$ 372$ 216$ 785$ 328$
Refining - Western / Pacific
Net Income (Loss) Attributable to Phillips 66 568$ 194$ 215$ 65$ 24$
Adjustments:
Pension settlement expense 5 5 - - -
Pending claims and settlements 3 3 - - -
Asset dispositions (5) - - - -
Adjusted Net Income (Loss) Attributable to Phillips 66 571$ 202$ 215$ 65$ 24$
Millions of Dollars
Except as Indicated
2015 2014

39
NON-GAAP RECONCILIATIONS
Sep YTD 3Q 2Q Sep YTD 3Q
Marketing & Specialties - Marketing & Other
Net Income (Loss) Attributable to Phillips 66 805$ 285$ 266$ 537$ 325$
Adjustments:
Asset dispositions (242) - (132) (109) (109)
Pension settlement expense 6 6 - - -
Adjusted Net Income (Loss) Attributable to Phillips 66 569$ 291$ 134$ 428$ 216$
Marketing & Specialties - Specialties
Net Income (Loss) Attributable to Phillips 66 151$ 53$ 48$ 130$ 43$
Adjustments:
Adjusted Net Income (Loss) Attributable to Phillips 66 151$ 53$ 48$ 130$ 43$
Millions of Dollars
Except as Indicated
20142015

2015 YTD Phillips 66 Midstream Chemicals RefiningMarketing
& Specialties
Numerator ($MM)
Net Income 3,614 132 750 2,145 956
After-tax interest expense 153 - - - -
GAAP ROCE earnings 3,767 132 750 2,145 956
Special Items (94) 116 20 6 (236)
Adjusted ROCE earnings 3,673 248 770 2,151 720
Denominator ($MM)
GAAP average capital employed* 31,853 6,104 4,883 13,637 2,933
2015 Annualized Adjusted YTD ROCE 15% 5% 21% 21% 33%
2015 Annualized GAAP YTD ROCE 16% 3% 20% 21% 43%
40 * Total equity plus total debt
NON-GAAP RECONCILIATIONS

41
NON-GAAP RECONCILIATIONS
Phillips 66
Consolidated
Phillips 66
Partners
Adjusted
Phillips 66
Total Debt 8,951$ 1,100$ 7,851$
Total Equity 24,032$ 805$ 23,227$
Debt-to-Capital Ratio 27% 25%
Total Cash 4,822$ 73$ 4,749$
Net-Debt-to-Capital Ratio 15% 12%
2015
3Q
Millions of Dollars

42
NON-GAAP RECONCILIATIONS
Millions of Dollars
2015
3Q
Effective Tax Rates
Income before taxes 2,359$
Special items 99$
Adjusted income before taxes 2,458$
Provision for taxes 767$
Special items 30$
Adjusted provision for taxes 797$
GAAP effective tax rate 33%
Adjusted effective tax rate 32%