Pharmaceuticals in the aquatic environment of the Baltic Sea...
121
International Hydrological Programme United Nations Educational, Scientific and Cultural Organization I n te r n a t i o n a l I n i t i a t i v e o n W a t e r Q u a l i ty Pharmaceuticals in the aquatic environment of the Baltic Sea region A status report 1 EMERGING POLLUTANTS IN WATER SERIES
Transcript of Pharmaceuticals in the aquatic environment of the Baltic Sea...

Phar
mac
euti
cals
in th
e aq
uati
c en
viro
nmen
t of t
he B
alti
c Se
a re
gion
EMER
GING
POLL
UTAN
TS IN
WAT
ER
International Hydrological Programme
United NationsEducational, Scientific and
Cultural Organization
International Initiative on Water Quality
Pharmaceuticals in the aquatic
environment of the Baltic Sea region
A status report
International Initiative on Water Quality – IIWQ
The International Initiative on Water Quality (IIWQ) was established by the official endorsement by the Intergovernmental Council of the International Hydrological Programme (IHP) of UNESCO at its 20th session in 2012 (Resolution XX-4), following recommendations of IHP Regional Consultation Meetings on Water Quality.
The IIWQ supports Member States in protecting, enhancing and sustainably managing the quality of the world’s freshwater resources by mobilizing, generating and disseminating scientific knowledge, providing policy advice and advocacy, promoting international scientific cooperation and raising awareness on water quality. It implements activities and projects focusing on specific water quality issues in both developing and developed countries to respond to global water quality challenges in a holistic interdisciplinary, participatory and cooperative way towards ensuring water security for sustainable development.
For more information: http://en.unesco.org/waterquality-iiwq
http://en.unesco.org/emergingpollutants
This publication is published in the framework of UNESCO Project on Emerging Pollutants in Wastewater Reuse in Developing Countries,
funded by the Government of Sweden.
International Hydrological Programme
United NationsEducational, Scientific and
Cultural Organization
InternationalInitiative onWater Quality 9 789231 002137
1
1 EMERGING POLLUTANTS IN WATER SERIES
International Initiative on Water Quality
International Hydrological Programme
United NationsEducational, Scientific and
Cultural Organization
EMERGING POLLUTANTS IN WATER SERIES
Pharmaceuticals in the aquatic
environment of the Baltic Sea region
A status report
1

Emerging Pollutants in Water SeriesEditor-in-Chief: Sarantuyaa Zandaryaa, UNESCO
Volume No.1 • Pharmaceuticals in the aquatic environment of the Baltic Sea region – A status report
Writing and editorial teamReport writing and data compilation Niina Vieno (Law and Water Ltd.), Pär Hallgren and Petra Wallberg (Sweco Environment AB)Editors Minna Pyhälä (GreenWords) and Sarantuyaa Zandaryaa (UNESCO)
ContributorsEstonia Eda Andresmaa, Margus Korsjukov and Rene Reisner, Ministry of the EnvironmentDenmark Susanne Boutrup, Danish Centre for Environment and Energy, Aarhus University National Focal Point for point sources, Danish Agency for Water and Nature ManagementFinland Päivi Fjäder, Jukka Mehtonen and Lauri Äystö, Finnish Environment Institute – SYKEGermany Arne Hein, Anette Küster and Ulrike Pirntke, German Environment AgencyPoland Magdalena Kaminska, Chief Inspectorate for Environmental Protection Aleksandra Orlita and Marta Rybka, Institute of Meteorology and Water Management, National Research Institute GdyniaSweden Jenny Hedman and Maria Linderoth, Swedish Environmental Protection AgencyHELCOM Secretariat Dmitry Frank-Kamenetsky and Ulla Li Zweifel, HELCOM SecretariatUNESCO Sarantuyaa Zandaryaa, Division of Water Sciences – International Hydrological Programme (IHP)
This report is a case study in the framework of UNESCO Emerging Pollutants in Water Series under UNESCO‑IHP’s International Initiative on Water Quality (IIWQ) Project on ‘Emerging Pollutants in Wastewater Reuse in Developing Countries’. It was developed jointly by the Baltic Marine Environment Protection Commission – Helsinki Commission (HELCOM) and Policy Area (PA) Hazards of the European Union Strategy for the Baltic Sea Region (EUSBSR). The case study was funded by UNESCO, HELCOM and PA Hazard. UNESCO thanks all contributors to the publication.
Published in 2017 by
The United Nations Educational, Scientific and Cultural Organization7, place de Fontenoy, 75352 Paris 07 SP, FranceandHELCOM
© UNESCO 2017ISBN 978-92-3-100213-7HELCOM, Baltic Sea Environment Proceedings No. 149, ISSN 0357-2994
This publication is available in Open Access under the Attribution-ShareAlike 3.0 IGO (CC-BY-SA 3.0 IGO) license (http://creativecommons.org/licenses/by-sa/3.0/igo/). By using the content of this publication, the users accept to be bound by the terms of use of the UNESCO Open Access Repository (http://www.unesco.org/open-access/terms-use-ccbysa-en).
The designations employed and the presentation of material throughout this publication do not imply the expression of any opinion whatsoever on the part of UNESCO concerning the legal status of any country, territory, city or area or of its authorities, or concerning the delimitation of its frontiers or boundaries. The ideas and opinions expressed in this publication are those of the authors; they are not necessarily those of UNESCO and do not commit the Organization.
Suggested citation: UNESCO and HELCOM. 2017. Pharmaceuticals in the aquatic environment of the Baltic Sea region – A status report. UNESCO Emerging Pollutants in Water Series – No. 1, UNESCO Publishing, Paris.
Cover photo: © Tomasz Wozniak, Shutterstock. Graphic design: Corinne HayworthPrinted in France by: UNESCO CLD. SC/HYD/IIWQ/2017/1 CLD 291.17

3
TABLE OF CONTENTS
Table of contentsList of acronyms and abbreviations . . . . . . . . . . . . . . . . . . . . . . . . . . . . . . . . . . . . . . . . . . . 10
Glossary . . . . . . . . . . . . . . . . . . . . . . . . . . . . . . . . . . . . . . . . . . . . . . . . . . . . . . . . . . . . . . . . . . . . . . 11
Executive summary . . . . . . . . . . . . . . . . . . . . . . . . . . . . . . . . . . . . . . . . . . . . . . . . . . . . . . . . . . . . 13Main results 14Data gaps 14Recommendations 15
1. Introduction . . . . . . . . . . . . . . . . . . . . . . . . . . . . . . . . . . . . . . . . . . . . . . . . . . . . . . . . . . . . . . . . 161.1 Policy setting 161.2 Pharmaceuticals in the environment 18
2. Scope of the report . . . . . . . . . . . . . . . . . . . . . . . . . . . . . . . . . . . . . . . . . . . . . . . . . . . . . . . . . . . 19
3. Data collection methodology and data availability . . . . . . . . . . . . . . . . . . . . . . . . . . 163.1 Data collection methodology 163.2 Reported data 163.3 Major data gaps 18
4. Overview of existing frameworks for monitoring pharmaceuticalsin the freshwater and marine environment . . . . . . . . . . . . . . . . . . . . . . . . . . . . . . . . . 24
5. Production, consumption and handling of pharmaceutical wastes . . . . . . . . . . . 265.1 Pharmaceutical production 265.2 Consumption of pharmaceuticals 26
Human consumption 26Veterinary consumption 27
5.3 Handling of pharmaceutical wastes 28
6. Inputs of pharmaceuticals into the Baltic Sea . . . . . . . . . . . . . . . . . . . . . . . . . . . . . . . . 306.1 Sources and pathways 306.2 Concentrations of pharmaceuticals in wastewater, sludge and river water 31
7. Concentrations and effects of pharmaceuticals in the marine environment . . 357.1 Concentrations of pharmaceuticals in the marine environment 36
Anti-inflammatory and analgesics 37Antimicrobials and antidotes 38Cardiovascular agents 39Central nervous system agents 40Chemotherapeutic agents and X-ray contrast media 41Dermatological agents 41Hormones and hormone antagonists 42Metabolic and gastrointestinal agents 43
7.2 Pharmaceuticals detected in marine biota 437.3 Effects of pharmaceuticals in the Baltic Sea marine environment 46

4
EMERGING POLLUTANTS IN WATER SERIES 1 Pharmaceuticals in the aquatic environment of the Baltic Sea region
8. Conclusions and recommendations . . . . . . . . . . . . . . . . . . . . . . . . . . . . . . . . . . . . . . . . . 478.1 Overview of main results and data compilation 478.2 Recommendations for improving scientific knowledge and data 488.3 Potential measures for further consideration to reduce inputs of pharmaceuticals into the environment 49
9. References . . . . . . . . . . . . . . . . . . . . . . . . . . . . . . . . . . . . . . . . . . . . . . . . . . . . . . . . . . . . . . . . . . 51
Annex 1. Description of data collection and analytical methods . . . . . . . . . . . . . . . . 54 1.1 Data collection 541.2 Overview of reported data 55 Measurements in MWWTP influents, effluents, sludge and river water 55 Measurements in the marine environment 59
Annex 2. The use of pharmaceuticals . . . . . . . . . . . . . . . . . . . . . . . . . . . . . . . . . . . . . . . . . . 61Human consumption 61Sales of veterinary pharmaceuticals 65
Annex 3. Data on samples from MWWTPs influent, effluent, sludge and river water by therapeutic groups . . . . . . . . . . . . . . . . . . . . . . . . . . . . . . . . . . . . 68
Methodology for statistical and visual presentation of data 68Anti-inflammatory and analgesics 69Antimicrobial (antibiotic, antifungal, antiviral, antiparasitic, disinfectant, antiseptic) and antidote 74Cardiovascular agents (blood pressure, diuretics, anticoagulants, antihistamine) 79Central nervous system agents (psychotherapeutic, antiepileptic, antiparkinson, muscle relaxant) 84Chemotherapeutic agents and X-ray contrast media 89Hormones and hormone antagonists 91Metabolic agents and gastrointestinal agents 96
Annex 4. Data on samples from the marine environment . . . . . . . . . . . . . . . . . . . . . . 99Methodology for statistical and visual presentation of data 99Anti-inflammatory and analgesics 99Antimicrobial (antibiotic, antifungal, antiviral, antiparasitic, disinfectant, antiseptic) and antidote 105Cardiovascular agents (blood pressure, diuretics, anticoagulants, antihistamine) 108Central nervous system agents (psychotherapeutic, antiepileptic, antiparkinson, muscle relaxant) 110Chemotherapeutic agents and X-ray contrast media 112Dermatological agents 113Hormones and hormone antagonists 113Metabolic agents and gastrointestinal agents 115
Annex 5. Overview of studies carried out on effects of pharmaceuticals on Baltic biota . . . . . . . . . . . . . . . . . . . . . . . . . . . . . . . . . . . . . . . . . . . . . . . . . . . . . . . 117

5
TABLE OF CONTENTS
List of figuresFigure 1. Number of data points for different sample matrices. . . . . . . . . . . . . . . . . . . . . . . . . . . . . . . . . . . . . . . . . . . 22
Figure 2. The top 20 most sold pharmaceuticals . . . . . . . . . . . . . . . . . . . . . . . . . . . . . . . . . . . . . . . . . . . . . . . . . . . . . . . . 27
Figure 3. Main sources and pathways of pharmaceuticals to the environment . . . . . . . . . . . . . . . . . . . . . . . . . . . 30
Figure 4. The top 20 pharmaceuticals measured in highest concentrations in MWWTP influents . . . . . . . . . 31
Figure 5. The top 20 pharmaceuticals measured in highest concentrations in treated wastewater (MWWTP effluents) . . . . . . . . . . . . . . . . . . . . . . . . . . . . . . . . . . . . . . . . . . . . . . . . . . . . . . . . . . . . . . . . . . . . . . . . . . . 32
Figure 6. Number of pharmaceuticals removed in MWWTPs at different removal rates . . . . . . . . . . . . . . . . . . 32
Figure 7. The top 20 pharmaceuticals measured in highest concentrations in untreated sewage sludge . . . . . . . . . . . . . . . . . . . . . . . . . . . . . . . . . . . . . . . . . . . . . . . . . . . . . . . . . . . . . . . . . . . 33
Figure 8. Average concentrations of pharmaceuticals in untreated, digested and composted sludge . . . . 33
Figure 9. The top 20 pharmaceuticals measured in highest concentrations in river water samples . . . . . . . 34
Figure 10. Overview of all 3,647 water samples in the compiled data set . . . . . . . . . . . . . . . . . . . . . . . . . . . . . . . . . . 35
Figure 11. Overview of all 114 sediment samples in the compiled data set . . . . . . . . . . . . . . . . . . . . . . . . . . . . . . . . 36
Figure 12. Overview of all 839 biota samples in the compiled data set . . . . . . . . . . . . . . . . . . . . . . . . . . . . . . . . . . . . 36
Figure 13. Sample locations for the compiled data on diclofenac . . . . . . . . . . . . . . . . . . . . . . . . . . . . . . . . . . . . . . . . . 37
Figure 14. Sample locations for the compiled data on ibuprofen (including ibuprofen-OH and ibuprofen-COOH) . . . . . . . . . . . . . . . . . . . . . . . . . . . . . . . . . . . . . . . . . . . . . . . . . . . . . . . . . . . . . . . . . . . . . . . . . . . . . 37
Figure 15. Sample locations for the compiled data on phenazone . . . . . . . . . . . . . . . . . . . . . . . . . . . . . . . . . . . . . . . . 38
Figure 16. Anti-inflammatory and analgesics. Concentrations in Baltic Sea water . . . . . . . . . . . . . . . . . . . . . . . . . 38
Figure 17. Antimicrobial (antibiotic, antifungal, antiviral, antiparasitic, disinfectant, antiseptic) and antidote. Concentrations in Baltic Sea water . . . . . . . . . . . . . . . . . . . . . . . . . . . . . . . . . . . . . . . . . . . . . . 39
Figure 18. Sample locations for the compiled data on sulfamethoxazole . . . . . . . . . . . . . . . . . . . . . . . . . . . . . . . . . 39
Figure 19. Cardiovascular agents (blood pressure, diuretics, anticoagulants, anti-histamine). Concentrations in Baltic Sea water . . . . . . . . . . . . . . . . . . . . . . . . . . . . . . . . . . . . . . . . . . . . . . . . . . . . . . . . . . . . . 39
Figure 20. Sample locations for the compiled data on metoprolol . . . . . . . . . . . . . . . . . . . . . . . . . . . . . . . . . . . . . . . . 40
Figure 21. Sample locations for the compiled data on bisoprolol . . . . . . . . . . . . . . . . . . . . . . . . . . . . . . . . . . . . . . . . . 40
Figure 22. Sample locations for the compiled data on sotalol . . . . . . . . . . . . . . . . . . . . . . . . . . . . . . . . . . . . . . . . . . . . . 41
Figure 23. Central nervous system agents (psychotherapeutic, antiepileptic, antiparkinson, muscle relaxant). Concentrations in Baltic Sea water . . . . . . . . . . . . . . . . . . . . . . . . . . . . . . . . . . . . . . . . . . . 41
Figure 24. Sample locations for the compiled data on carbamazepine . . . . . . . . . . . . . . . . . . . . . . . . . . . . . . . . . . . . 42
Figure 25. Sample locations for the compiled data on primidone . . . . . . . . . . . . . . . . . . . . . . . . . . . . . . . . . . . . . . . . . 42
Figure 26. Sample locations for the compiled data on oxazepam . . . . . . . . . . . . . . . . . . . . . . . . . . . . . . . . . . . . . . . . . 43
Figure 27. Ciprofloxacin in Atlantic cod (Gadus morhua) . . . . . . . . . . . . . . . . . . . . . . . . . . . . . . . . . . . . . . . . . . . . . . . . . 43
Figure 28. Detected pharmaceuticals in blue mussel (Mytilus edulis trossulus) . . . . . . . . . . . . . . . . . . . . . . . . . . . . 44
Figure 29. Detected pharmaceuticals in bile from European perch (Perca fluviatilis). . . . . . . . . . . . . . . . . . . . . . . 44
Figure 30. Detected pharmaceuticals in flounder (Platichthys flesus) . . . . . . . . . . . . . . . . . . . . . . . . . . . . . . . . . . . . . 45
Figure 31. Detected pharmaceuticals in eel (Anguilla anguilla) . . . . . . . . . . . . . . . . . . . . . . . . . . . . . . . . . . . . . . . . . . . 45

6
EMERGING POLLUTANTS IN WATER SERIES 1 Pharmaceuticals in the aquatic environment of the Baltic Sea region
Figure A2.1 Sales of veterinary pharmaceuticals in Finland . . . . . . . . . . . . . . . . . . . . . . . . . . . . . . . . . . . . . . . . . . . . . . . . 66
Figure A2.2 Sales of veterinary pharmaceuticals in Germany . . . . . . . . . . . . . . . . . . . . . . . . . . . . . . . . . . . . . . . . . . . . . . 67
Figure A3.1 The average and maximum concentrations of anti-inflammatory and analgesics in MWWTP influents . . . . . . . . . . . . . . . . . . . . . . . . . . . . . . . . . . . . . . . . . . . . . . . . . . . . . . . . . . . . . . . . . . . . . . . . . . 70
Figure A3.2 The average and maximum concentrations of anti-inflammatory and analgesics in MWWTP effluent . . . . . . . . . . . . . . . . . . . . . . . . . . . . . . . . . . . . . . . . . . . . . . . . . . . . . . . . . . . . . . . . . . . . . . . . . . . 71
Figure A3.3 The average and maximum concentrations of anti-inflammatory and analgesics in untreated sludge . . . . . . . . . . . . . . . . . . . . . . . . . . . . . . . . . . . . . . . . . . . . . . . . . . . . . . . . . . . . . . . . . . . . . . . . . . . 72
Figure A3.4 The average concentrations of anti-inflammatory and analgesics in untreated, digested and composted sludge . . . . . . . . . . . . . . . . . . . . . . . . . . . . . . . . . . . . . . . . . . . . . . . . . . . . . . . . . . . . . . 72
Figure A3.5 The average and maximum concentrations of anti-inflammatory and analgesics in river water samples . . . . . . . . . . . . . . . . . . . . . . . . . . . . . . . . . . . . . . . . . . . . . . . . . . . . . . . . . . . . . . . . . . . . . . . . 73
Figure A3.6 The average and maximum concentrations of antimicrobial and antidote in MWWTP influents . . . . . . . . . . . . . . . . . . . . . . . . . . . . . . . . . . . . . . . . . . . . . . . . . . . . . . . . . . . . . . . . . . . . . . . . . . 76
Figure A3.7 The average and maximum concentrations of antimicrobial and antidote in MWWTP effluents . . . . . . . . . . . . . . . . . . . . . . . . . . . . . . . . . . . . . . . . . . . . . . . . . . . . . . . . . . . . . . . . . . . . . . . . . . 76
Figure A3.8 The average and maximum concentrations of antimicrobial and antidote in untreated sludge . . . . . . . . . . . . . . . . . . . . . . . . . . . . . . . . . . . . . . . . . . . . . . . . . . . . . . . . . . . . . . . . . . . . . . . . . . . 77
Figure A3.9 The average concentrations of antimicrobial and antidote in untreated, digested and composted sludge . . . . . . . . . . . . . . . . . . . . . . . . . . . . . . . . . . . . . . . . . . . . . . . . . . . . . . . . . . . . . . . . . . . . . . . 78
Figure A3.10 The average and maximum concentrations of antimicrobial and antidote in river water samples . . . . . . . . . . . . . . . . . . . . . . . . . . . . . . . . . . . . . . . . . . . . . . . . . . . . . . . . . . . . . . . . . . . . . . . . 78
Figure A3.11 The average and maximum concentrations of cardiovascular agents in MWWTP influents . . . . . . . . . . . . . . . . . . . . . . . . . . . . . . . . . . . . . . . . . . . . . . . . . . . . . . . . . . . . . . . . . . . . . . . . . . 80
Figure A3.12 The average and maximum concentrations of cardiovascular agents in MWWTP effluents . . . . . . . . . . . . . . . . . . . . . . . . . . . . . . . . . . . . . . . . . . . . . . . . . . . . . . . . . . . . . . . . . . . . . . . . . . 81
Figure A3.13 The average and maximum concentrations of cardiovascular agents in untreated sludge . . . . . . . . . . . . . . . . . . . . . . . . . . . . . . . . . . . . . . . . . . . . . . . . . . . . . . . . . . . . . . . . . . . . . . . . . . . 82
Figure A3.14 The average concentrations of cardiovascular agents in untreated, digested and composted sludge . . . . . . . . . . . . . . . . . . . . . . . . . . . . . . . . . . . . . . . . . . . . . . . . . . . . . . . . . . . . . . . . . . . . . . . 82
Figure A3.15 The average and maximum concentrations of cardiovascular agents in river water samples . . . . . . . . . . . . . . . . . . . . . . . . . . . . . . . . . . . . . . . . . . . . . . . . . . . . . . . . . . . . . . . . . . . . . . . . 83
Figure A3.16 The average and maximum concentrations of central nervous system agents in MWWTP influents . . . . . . . . . . . . . . . . . . . . . . . . . . . . . . . . . . . . . . . . . . . . . . . . . . . . . . . . . . . . . . . . . . . . . . . . . . 86
Figure A3.17 The average and maximum concentrations of central nervous system agents in MWWTP effluents . . . . . . . . . . . . . . . . . . . . . . . . . . . . . . . . . . . . . . . . . . . . . . . . . . . . . . . . . . . . . . . . . . . . . . . . . . 86
Figure A3.18 The average and maximum concentrations of central nervous systems agents in untreated sludge . . . . . . . . . . . . . . . . . . . . . . . . . . . . . . . . . . . . . . . . . . . . . . . . . . . . . . . . . . . . . . . . . . . . . . . . . . . 88
Figure A3.19 The average concentrations of central nervous system agents in untreated, digested and composted sludge . . . . . . . . . . . . . . . . . . . . . . . . . . . . . . . . . . . . . . . . . . . . . . . . . . . . . . . . . . . . . . . . . . . . . . . 88
Figure A3.20 The average and maximum concentrations of central nervous system agents in river water samples . . . . . . . . . . . . . . . . . . . . . . . . . . . . . . . . . . . . . . . . . . . . . . . . . . . . . . . . . . . . . . . . . . . . . . . . 89
Figure A3.21 The average and maximum concentrations of X-ray contrast media agents in river water samples . . . . . . . . . . . . . . . . . . . . . . . . . . . . . . . . . . . . . . . . . . . . . . . . . . . . . . . . . . . . . . . . . . . . . . . . 90
Figure A3.22 The average and maximum concentrations of hormones and hormone antagonists in MWWTP influents . . . . . . . . . . . . . . . . . . . . . . . . . . . . . . . . . . . . . . . . . . . . . . . . . . . . . . . . . . . . . . . . . . . . . . . . . . 92

7
TABLE OF CONTENTS
Figure A3.23 The average and maximum concentrations of hormones and hormone antagonists in MWWTP effluents . . . . . . . . . . . . . . . . . . . . . . . . . . . . . . . . . . . . . . . . . . . . . . . . . . . . . . . . . . . . . . . . . . . . . . . . . . 93
Figure A3.24 The average and maximum concentrations of hormones and hormone antagonists in untreated sludge . . . . . . . . . . . . . . . . . . . . . . . . . . . . . . . . . . . . . . . . . . . . . . . . . . . . . . . . . . . . . . . . . . . . . . . . . . 94
Figure A3.25 The average concentrations of hormones and hormone antagonists in untreated, digested and composted sludge . . . . . . . . . . . . . . . . . . . . . . . . . . . . . . . . . . . . . . . . . . . . . . . . . . . . . . . . . . . . . . 94
Figure A3.26 The maximum concentrations of hormones and hormone antagonists in river water samples . . . . . . . . . . . . . . . . . . . . . . . . . . . . . . . . . . . . . . . . . . . . . . . . . . . . . . . . . . . . . . . . . . . . . . . . 95
Figure A3.27 The average and maximum concentrations of metabolic agents and gastrointestinal agents in MWWTP influents . . . . . . . . . . . . . . . . . . . . . . . . . . . . . . . . . . . . . . . . . . . . . . 97
Figure A3.28 The average and maximum concentrations of metabolic agents and gastrointestinal agents in MWWTP effluents . . . . . . . . . . . . . . . . . . . . . . . . . . . . . . . . . . . . . . . . . . . . . . 97
Figure A3.29 The average and maximum concentrations of metabolic agents and gastrointestinal agents in river water samples . . . . . . . . . . . . . . . . . . . . . . . . . . . . . . . . . . . . . . . . . . . . 98
Figure A4.1 Sample locations for the compiled data of naproxen . . . . . . . . . . . . . . . . . . . . . . . . . . . . . . . . . . . . . . . . . 101
Figure A4.2 Sample locations for the compiled data of erythromycin, clarithromycin and azithromycin . . . . . . . . . . . . . . . . . . . . . . . . . . . . . . . . . . . . . . . . . . . . . . . . . . . . . . . . . . . . . . . . . . . . . . . . . . . . 106
Figure A4.3 Sample locations for the compiled data of amidotrizoic acid . . . . . . . . . . . . . . . . . . . . . . . . . . . . . . . . . . 112
Figure A4.4 Sample locations for the compiled data of 17a-ethinylestradiol, 17b-estradiol and estrone . . . . . . . . . . . . . . . . . . . . . . . . . . . . . . . . . . . . . . . . . . . . . . . . . . . . . . . . . . . . . . . . . . . . . . . . . . . . . . . . . . 114
Figure A4.5 Sample locations for the compiled data of clofibric acid . . . . . . . . . . . . . . . . . . . . . . . . . . . . . . . . . . . . . . 116

8
EMERGING POLLUTANTS IN WATER SERIES 1 Pharmaceuticals in the aquatic environment of the Baltic Sea region
List of tablesTable 1. An overview of data provided in response to a HELCOM questionnaire on occurrence,
sources and pathways of pharmaceuticals in the Baltic Sea region . . . . . . . . . . . . . . . . . . . . . . . . . . . . . 21
Table 2. ‘Watch list’ of pharmaceuticals for EU-wide monitoring . . . . . . . . . . . . . . . . . . . . . . . . . . . . . . . . . . . . . . . . 24
Table 3. Swedish assessment criteria for specific pollutants in coastal waters and transitional waters . . . 25
Table 4. 17 pharmaceuticals suggested for monitoring by a Swedish stakeholder working group in addition to the substances on the WFD ‘watch list’ . . . . . . . . . . . . . . . . . . . . . . . . . . . . . . . . . . . . . . . . . . 25
Table 5. Amounts of pharmaceutical waste collected in Estonia, Finland and Sweden . . . . . . . . . . . . . . . . . . 28
Table A1.1 Total number of data on pharmaceuticals detection in wastewater, sludge and river water in the Baltic Sea region from 2003 to 2014 . . . . . . . . . . . . . . . . . . . . . . . . . . . . . . . . . . . . . . . . . . . . . . . . . . . . . 55
Table A1.2 Number of pharmaceuticals detections in MWWTP influent samples . . . . . . . . . . . . . . . . . . . . . . . . . . 57
Table A1.3 Number of pharmaceuticals detections in MWWTP effluent samples . . . . . . . . . . . . . . . . . . . . . . . . . . 57
Table A1.4 Number of pharmaceuticals detections in untreated sludge samples . . . . . . . . . . . . . . . . . . . . . . . . . . 57
Table A1.5 Number of pharmaceuticals detections in digested sludge samples . . . . . . . . . . . . . . . . . . . . . . . . . . . 58
Table A1.6 Number of pharmaceuticals detections in composted sludge samples . . . . . . . . . . . . . . . . . . . . . . . . 58
Table A1.7 Number of pharmaceuticals detections in river water samples . . . . . . . . . . . . . . . . . . . . . . . . . . . . . . . . 58
Table A1.8 Total number of data on pharmaceuticals detection in the marine environment of the Baltic Sea from 2003 to 2014 . . . . . . . . . . . . . . . . . . . . . . . . . . . . . . . . . . . . . . . . . . . . . . . . . . . . . . . . . . . 59
Table A2.1 Use of anti-inflammatory and analgesics in Baltic Sea countries (2014, kg/year) . . . . . . . . . . . . . . . 62
Table A2.2 Use of antimicrobial pharmaceuticals in Baltic Sea countries (2014, kg/year) . . . . . . . . . . . . . . . . . . . 62
Table A2.3 Use of cardiovascular agents in Baltic Sea countries (2014, kg/year) . . . . . . . . . . . . . . . . . . . . . . . . . . . 63
Table A2.4 Use of central nervous system agents in Baltic Sea countries (2014, kg/year) . . . . . . . . . . . . . . . . . . . 64
Table A2.5 Use of metabolic agents and gastrointestinal agents in Baltic Sea countries (2014, kg/year) . . . . 64
Table A2.6 Use of other pharmaceuticals in Baltic Sea countries (2014, kg/year) . . . . . . . . . . . . . . . . . . . . . . . . . . . 65
Table A3.1 Anti-inflammatory and analgesics detected in MWWTP influents, effluents, sludge and river water in Baltic Sea countries . . . . . . . . . . . . . . . . . . . . . . . . . . . . . . . . . . . . . . . . . . . . . . . . . . . . . . . . . 69
Table A3.2 Removal rates of anti-inflammatory and analgesics in MWWTPs . . . . . . . . . . . . . . . . . . . . . . . . . . . . . . . 71
Table A3.3 Antimicrobial and antidote detected in MWWTP influents, effluents, sludge and rivers in Baltic Sea countries . . . . . . . . . . . . . . . . . . . . . . . . . . . . . . . . . . . . . . . . . . . . . . . . . . . . . . . . . . . . . . 74
Table A3.4 Removal rates of antimicrobial and antidote in MWWTPs . . . . . . . . . . . . . . . . . . . . . . . . . . . . . . . . . . . . . 77
Table A3.5 Cardiovascular agents detected in MWWTP influents, effluents, sludge and river water in Baltic Sea countries . . . . . . . . . . . . . . . . . . . . . . . . . . . . . . . . . . . . . . . . . . . . . . . . . . . . . . . . . 79
Table A3.6 Removal rates of cardiovascular agents in MWWTPs . . . . . . . . . . . . . . . . . . . . . . . . . . . . . . . . . . . . . . . . . . . 81
Table A3.7 Central nervous systems agents detected in MWWTP influents, effluents, sludge and river water in Baltic Sea countries . . . . . . . . . . . . . . . . . . . . . . . . . . . . . . . . . . . . . . . . . . . . . . . . . . . . . . . . . 85
Table A3.8 Removal rates of central nervous system agents in MWWTPs . . . . . . . . . . . . . . . . . . . . . . . . . . . . . . . . . . 87
Table A3.9 Chemotherapeutic agents and X-ray contrast media detected in MWWTP influents, effluents, sludge and river water in Baltic Sea countries . . . . . . . . . . . . . . . . . . . . . . . . . . . . . . . . . . . . . . . 89
9
TABLE OF CONTENTS
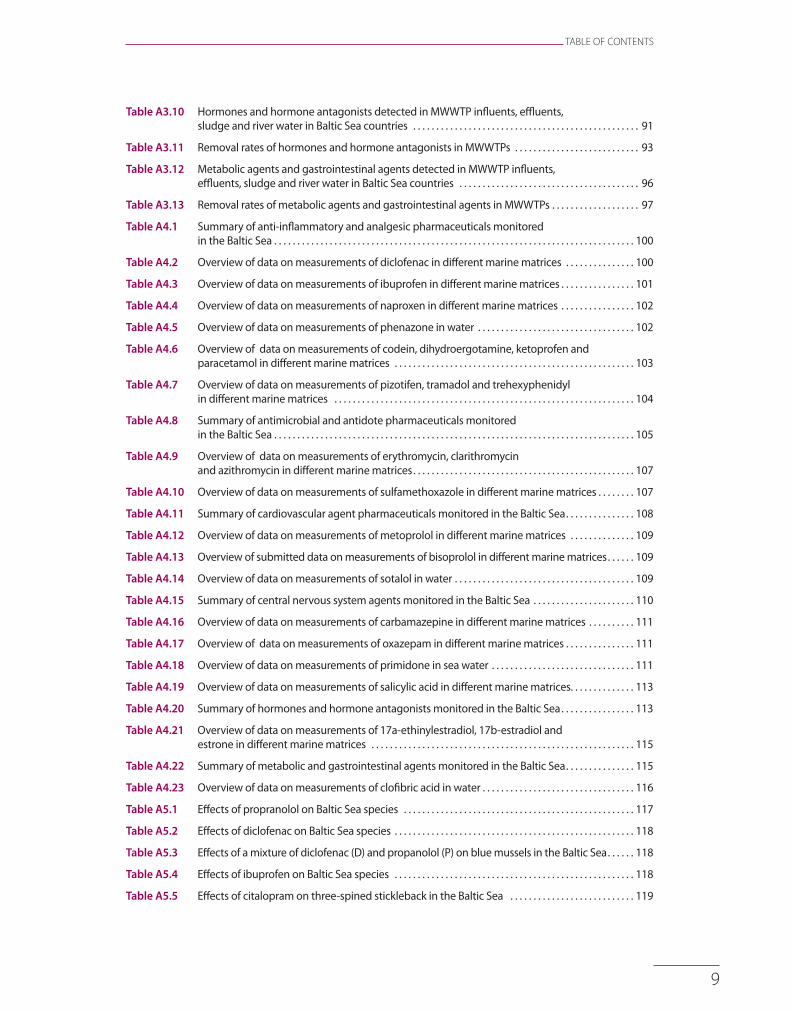
Table A3.10 Hormones and hormone antagonists detected in MWWTP influents, effluents, sludge and river water in Baltic Sea countries . . . . . . . . . . . . . . . . . . . . . . . . . . . . . . . . . . . . . . . . . . . . . . . . . 91
Table A3.11 Removal rates of hormones and hormone antagonists in MWWTPs . . . . . . . . . . . . . . . . . . . . . . . . . . . 93
Table A3.12 Metabolic agents and gastrointestinal agents detected in MWWTP influents, effluents, sludge and river water in Baltic Sea countries . . . . . . . . . . . . . . . . . . . . . . . . . . . . . . . . . . . . . . . 96
Table A3.13 Removal rates of metabolic agents and gastrointestinal agents in MWWTPs . . . . . . . . . . . . . . . . . . . 97
Table A4.1 Summary of anti-inflammatory and analgesic pharmaceuticals monitored in the Baltic Sea . . . . . . . . . . . . . . . . . . . . . . . . . . . . . . . . . . . . . . . . . . . . . . . . . . . . . . . . . . . . . . . . . . . . . . . . . . . . . . 100
Table A4.2 Overview of data on measurements of diclofenac in different marine matrices . . . . . . . . . . . . . . . 100
Table A4.3 Overview of data on measurements of ibuprofen in different marine matrices . . . . . . . . . . . . . . . . 101
Table A4.4 Overview of data on measurements of naproxen in different marine matrices . . . . . . . . . . . . . . . . 102
Table A4.5 Overview of data on measurements of phenazone in water . . . . . . . . . . . . . . . . . . . . . . . . . . . . . . . . . . 102
Table A4.6 Overview of data on measurements of codein, dihydroergotamine, ketoprofen and paracetamol in different marine matrices . . . . . . . . . . . . . . . . . . . . . . . . . . . . . . . . . . . . . . . . . . . . . . . . . . . . 103
Table A4.7 Overview of data on measurements of pizotifen, tramadol and trehexyphenidyl in different marine matrices . . . . . . . . . . . . . . . . . . . . . . . . . . . . . . . . . . . . . . . . . . . . . . . . . . . . . . . . . . . . . . . . . 104
Table A4.8 Summary of antimicrobial and antidote pharmaceuticals monitored in the Baltic Sea . . . . . . . . . . . . . . . . . . . . . . . . . . . . . . . . . . . . . . . . . . . . . . . . . . . . . . . . . . . . . . . . . . . . . . . . . . . . . . 105
Table A4.9 Overview of data on measurements of erythromycin, clarithromycin and azithromycin in different marine matrices . . . . . . . . . . . . . . . . . . . . . . . . . . . . . . . . . . . . . . . . . . . . . . . . 107
Table A4.10 Overview of data on measurements of sulfamethoxazole in different marine matrices . . . . . . . . 107
Table A4.11 Summary of cardiovascular agent pharmaceuticals monitored in the Baltic Sea . . . . . . . . . . . . . . . 108
Table A4.12 Overview of data on measurements of metoprolol in different marine matrices . . . . . . . . . . . . . . 109
Table A4.13 Overview of submitted data on measurements of bisoprolol in different marine matrices . . . . . . 109
Table A4.14 Overview of data on measurements of sotalol in water . . . . . . . . . . . . . . . . . . . . . . . . . . . . . . . . . . . . . . . 109
Table A4.15 Summary of central nervous system agents monitored in the Baltic Sea . . . . . . . . . . . . . . . . . . . . . . 110
Table A4.16 Overview of data on measurements of carbamazepine in different marine matrices . . . . . . . . . . 111
Table A4.17 Overview of data on measurements of oxazepam in different marine matrices . . . . . . . . . . . . . . . 111
Table A4.18 Overview of data on measurements of primidone in sea water . . . . . . . . . . . . . . . . . . . . . . . . . . . . . . . 111
Table A4.19 Overview of data on measurements of salicylic acid in different marine matrices. . . . . . . . . . . . . . 113
Table A4.20 Summary of hormones and hormone antagonists monitored in the Baltic Sea . . . . . . . . . . . . . . . . 113
Table A4.21 Overview of data on measurements of 17a-ethinylestradiol, 17b-estradiol and estrone in different marine matrices . . . . . . . . . . . . . . . . . . . . . . . . . . . . . . . . . . . . . . . . . . . . . . . . . . . . . . . . . 115
Table A4.22 Summary of metabolic and gastrointestinal agents monitored in the Baltic Sea . . . . . . . . . . . . . . . 115
Table A4.23 Overview of data on measurements of clofibric acid in water . . . . . . . . . . . . . . . . . . . . . . . . . . . . . . . . . 116
Table A5.1 Effects of propranolol on Baltic Sea species . . . . . . . . . . . . . . . . . . . . . . . . . . . . . . . . . . . . . . . . . . . . . . . . . . 117
Table A5.2 Effects of diclofenac on Baltic Sea species . . . . . . . . . . . . . . . . . . . . . . . . . . . . . . . . . . . . . . . . . . . . . . . . . . . . 118
Table A5.3 Effects of a mixture of diclofenac (D) and propanolol (P) on blue mussels in the Baltic Sea . . . . . . 118
Table A5.4 Effects of ibuprofen on Baltic Sea species . . . . . . . . . . . . . . . . . . . . . . . . . . . . . . . . . . . . . . . . . . . . . . . . . . . . 118
Table A5.5 Effects of citalopram on three-spined stickleback in the Baltic Sea . . . . . . . . . . . . . . . . . . . . . . . . . . . 119
10
EMERGING POLLUTANTS IN WATER SERIES 1 Pharmaceuticals in the aquatic environment of the Baltic Sea region
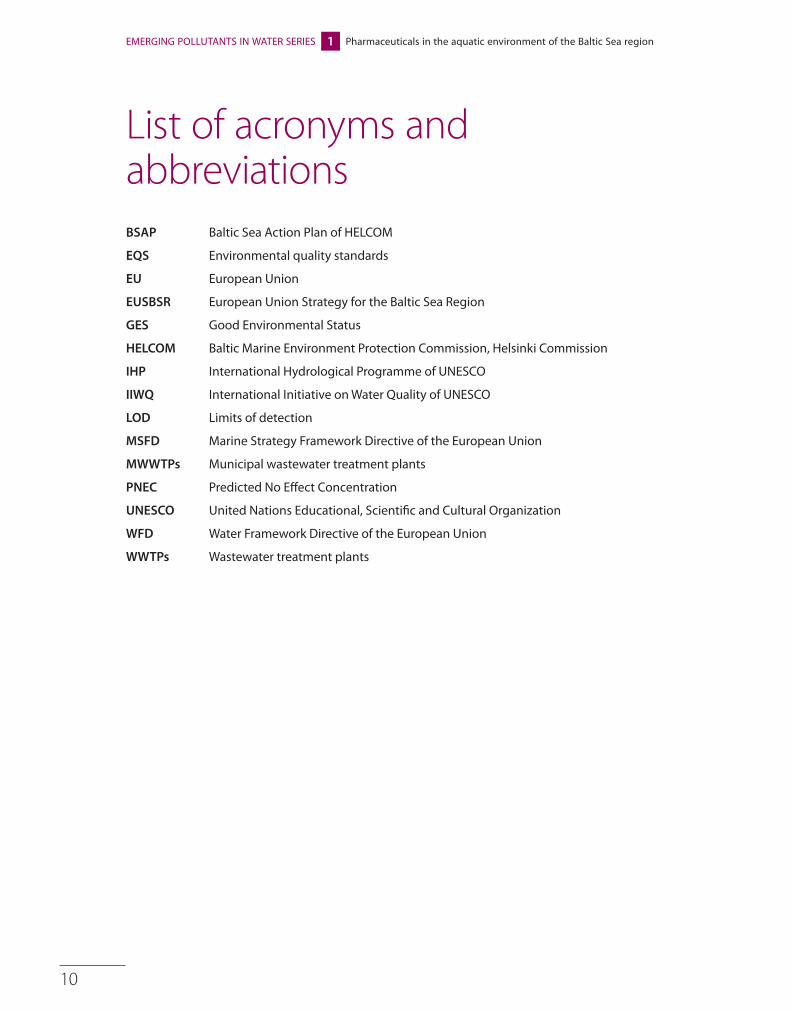
List of acronyms and abbreviationsBSAP Baltic Sea Action Plan of HELCOM
EQS Environmental quality standards
EU European Union
EUSBSR European Union Strategy for the Baltic Sea Region
GES Good Environmental Status
HELCOM Baltic Marine Environment Protection Commission, Helsinki Commission
IHP International Hydrological Programme of UNESCO
IIWQ International Initiative on Water Quality of UNESCO
LOD Limits of detection
MSFD Marine Strategy Framework Directive of the European Union
MWWTPs Municipal wastewater treatment plants
PNEC Predicted No Effect Concentration
UNESCO United Nations Educational, Scientific and Cultural Organization
WFD Water Framework Directive of the European Union
WWTPs Wastewater treatment plants

11
GLOSSARY
GlossaryAdsorption Adhesion of atoms, ions, or molecules from a gas, liquid, or dissolved solid
to a solid or liquid surface without involving a chemical reaction
Analgesic A drug that relieves pain
Anticoagulants A substance that prevents blood from forming clots
Antidote A substance that stops the harmful effects of a poison
Antihistamine A drug that is used to treat allergic reactions and colds
Biodegradation Decomposition of organic matter by aerobic or anaerobic microorganisms
Biota The plant and animal life of a region
Diuretics Drugs that increase the excretion of water from bodies
d.w. Dry weight
Effluent (treated) Wastewater flowing out of a treatment plant.
Emerging pollutants
Any synthetic or naturally occurring chemical or any microorganism that is not commonly monitored in the environment but has the potential to enter the environment and cause known or suspected adverse ecological and/or human health effects
HELCOM Contracting Parties
The Contracting Parties of HELCOM are Denmark, Estonia, the European Union, Finland, Germany, Latvia, Lithuania, Poland, Russia and Sweden
HELCOM sub‑basin
For HELCOM assessment purposes the Baltic Sea is divided into different sub-basins as defined in Attachment 4 of the HELCOM Monitoring and Assessment Strategy (HELCOM 2013b)
Hormone A naturally-occurring or synthetic substance with a similar effect to that of an animal or plant hormone that inhibit the function of hormones upon their specific antagonists sites
Influent Sewage entering a wastewater treatment plant
Leaching Process of removal of soluble and colloidal substances by water percolating downwards through soil layers
Limit of detection (LOD)
In analytical chemistry, the limit of detection is the lowest quantity of a substance that can be distinguished from the absence of that substance (a blank value) within a stated confidence limit (generally 1%)
Load The amount of pollution entering the environment (i.e. input)
Nanofiltration A membrane filtration-based method that uses nanometer sized cylindrical through pores
Ozonation Ozonation (also referred to as ozonization) is a chemical water treatment technique based on the infusion of ozone into water

12
EMERGING POLLUTANTS IN WATER SERIES 1 Pharmaceuticals in the aquatic environment of the Baltic Sea region
Photodegradation The alteration of materials by light
Pollution The result of substances/contaminants entering water bodies and thereby degrading the quality of water. Water pollution can have natural causes due to environmental causes (i.e. arsenic) or by anthropogenic activities (i.e. emerging pollutants).
Removal rates The rate of removal of a substance through wastewater treatment
Retentate That which is retained, for example by a filter or porous membrane
Sewage Wastewater and excrement (blackwater) conveyed in sewers
Sludge The residual, semi-solid material that is produced as a by-product during sewage treatment of industrial or municipal wastewater
Therapeutic group Classification of pharmaceuticals according to their therapeutic effects
Wastewater Water containing waste liquid or solid matter discharged after various uses
w.w. Wet weight

13
EXECUTIVE SUMMARY
Executive summaryEmerging pollutants present a new global water quality challenge with potentially-serious threats to human health and ecosystems. Pharmaceuticals represent a major group of emerging pollutants found in freshwater and coastal waters.
Pharmaceuticals are essential for human health and well-being. However, the growing use of pharmaceuticals resulting from e.g. population growth and aging has become a new environmental concern due to their potential negative effects on humans and ecosystems. Not insignificant quantities of unmetabolized and unused pharmaceuticals and their byproducts are discharged into freshwater systems with untreated wastewater and effluents from wastewater treatment plants, as well as direct discharges from use within animal husbandry and aquaculture. These pollutants reach coastal and sea waters, as ultimate sinks.
The occurrence of pharmaceutical substances in the environment is of global concern and the extent of their risks and impacts on human health and biota is largely unknown. This publication presents the first regional report with a comprehensive overview of the occurrence, concentrations and pathways of pharmaceuticals into the environment in the Baltic Sea region.
The publication provides a comprehensive compilation of available data and information on the occurrence of pharmaceuticals in the Baltic Sea freshwater and marine environment and of their main sources and pathways collected through national reporting by the Contracting Parties to the Convention on the Protection of the Marine Environment of the Baltic Sea Area (Helsinki Convention).
The report also presents estimates of sales and consumption of drugs as well as information on handling of household pharmaceutical waste in some of the Baltic Sea countries.
Compiled data include concentrations of pharmaceuticals in river water, wastewater and Baltic coastal and open seas, as well as in Baltic Sea biota and sediment. The concentrations are compared to threshold values, when such information is available. Information about the environmental effects of pharmaceuticals in the Baltic Sea is also provided.
Data were provided by Denmark, Estonia, Finland, Germany, Poland, Russia and Sweden. The data presented in the report cover the period 2003-2014 and include 47,600 data points on sources and pathways of pharmaceuticals (i.e., measurements in wastewater influents and effluents, sludge and river water) and 4,600 individual data points on concentrations of pharmaceuticals in the coastal, open sea and transitional areas of the Baltic Sea marine environment. The report includes data on 167 pharmaceutical substances measured in the marine environment and 156 pharmaceutical substances and 2 metabolites sampled in surface freshwater systems and in influents, effluents and sludge of municipal wastewater treatment plants (MWWTPs) situated in Denmark, Estonia, Finland, Germany, Russia (St. Petersburg) and Sweden.
This report is a case study in the framework of UNESCO Emerging Pollutants in Water Series under UNESCO-IHP’s International Initiative on Water Quality (IIWQ) Project on ‘Emerging Pollutants in Wastewater Reuse in Developing Countries’. It was developed jointly by the Baltic Marine Environment Protection Commission - Helsinki Commission (HELCOM) and Policy Area Hazards of the European Union Strategy for the Baltic Sea Region, and serves as a follow up to the commitments of the 2010 and 2013 HELCOM Ministerial Declarations to assess the pharmaceuticals contamination in the aquatic environment.

14
EMERGING POLLUTANTS IN WATER SERIES 1 Pharmaceuticals in the aquatic environment of the Baltic Sea region
Main resultsBased on the collected data, the main sources of pharmaceuticals in the freshwater and marine environment in the Baltic Sea region appear to be the excretion of active substances consumed by humans and animals through their urine and faeces. The main pathway of pharmaceuticals into the freshwater and marine environment, according to the collected data, is via the discharges of MWWTPs effluents. According to a rough estimate, MWWTPs release into the environment about 1.8 thousand tons of pharmaceuticals per year. Only nine out of 118 assessed pharmaceuticals were removed from wastewater during the treatment processes with an efficiency over 95% and nearly half of the compounds were removed only partially with an efficiency of less than 50%.
The available data indicate that the most frequently measured substances in the Baltic Sea marine environment belong to the therapeutic groups of anti-inflammatory and analgesics, cardiovascular and central nervous system agents. The most frequently detected pharmaceutical substances belong to the therapeutic groups of metabolic and gastrointestinal agents, e.g., clofibric acid (detected in 83 of 128 samples), and central nervous system agents, e.g., primidone (detected in all 51 samples) and carbamazepine (detected in 136 of 266 samples). In biota, the largest number of different pharmaceutical substances and the highest concentrations were found in blue mussels.
Data gapsAlthough the reported data provide the most comprehensive overview at the regional level of the magnitude of inputs of several pharmaceutical substances to the Baltic Sea, as well as their concentrations in freshwater systems and the marine environment, there are data gaps that need to be addressed in order to carry out a more complete assessment of the extent of contamination by pharmaceuticals.
More data from the whole region are needed on:
• sales and consumption of pharmaceuticals, and pharmaceutical waste management
• concentrations of pharmaceuticals in MWWTP influents and effluents, as well as in rivers
• the occurrence and fate of metabolites in freshwater, wastewater, and sea water
• concentrations of pharmaceuticals in sewage sludge and soil
• emissions of pharmaceuticals to the environment via other pathways such as solid waste disposal and agricultural runoff
• sales and consumption of veterinary pharmaceuticals, and their sources, pathways and loading to soils, surface and groundwater systems and the aquatic environment (including aquaculture)
• analytical methods used for measuring concentrations and their sensitivity
The results on concentrations of pharmaceuticals in the freshwater and marine environment in the Baltic Sea region presented in this report might be underestimated since the analytical methods used by many laboratories were at times not sensitive enough to detect substances at the level of the environmental quality standards for ‘good status’. There is, therefore, a need to improve the analytical methods used for measuring concentrations of pharmaceuticals in the environment. There is also lack of information on pharmaceuticals’ concentrations in biota, as well as on their biological effects.

15
EXECUTIVE SUMMARY
RecommendationsThe wide variety of pharmaceuticals detected in the wastewater, freshwater and marine environment in the Baltic Sea region indicate a need to reduce emissions of pharmaceuticals into the environment. But further information on the effects and risks of pharmaceuticals in the environment is needed to support the prioritization of measures for reducing inputs of specific substances.
Based on the data compiled in the report, the following recommendations aim to reduce the emissions of pharmaceuticals into the environment.
Recommendations for improving scientific knowledge and data
Data are essential to address specific sources and pathways of pharmaceuticals’ emissions into freshwater systems and the environment to help identify priority measures. Monitoring data from rivers and in effluents from MWWTPs are needed from every Baltic Sea country. In particular, research and data are needed on concentrations of pharmaceuticals in sewage sludge, soil and groundwater. Specific attention needs to be put on filling the data gap on veterinary pharmaceuticals, including their sales, consumption, sources, pathways and loading to soils, groundwater and the aquatic environment. Furthermore, research and data are needed to assess the effects and risks of pharmaceuticals and their byproducts on the ecosystem in order to provide scientific evidence for the prioritization of measures for reducing inputs of specific substances. Particularly, concentrations of pharmaceuticals in biota and their occurrence in the food chain should be more thoroughly investigated. Analytical methods of a higher resolution should be used for measuring concentrations of pharmaceuticals in the freshwater and marine environment.
Potential measures for reducing inputs of pharmaceuticals into the environment
Measures to reduce the inputs of pharmaceuticals to the environment should be taken at all stages of the product lifecycle, from manufacturing to consumption to waste management. Technical solutions can be applied in MWWTPs, mainly as tertiary advanced treatment methods. Oxidation, adsorption and filtration technologies could also be used for the pre-treatment of raw wastewater from hospital and manufacturing facilities prior to discharging it to municipal sewer. Take-back of unused medicines by pharmacies should be applied, or developed, in countries, where such systems are not yet in place or are inefficient, in order to reduce the disposal of unused pharmaceuticals via solid waste and sewers. Sustainable consumption of pharmaceuticals also need to be promoted in order to reduce their loading to sewage. Awareness on environmental impacts of pharmaceuticals need to be raised both for consumers as well as for doctors and pharmacists.

16
EMERGING POLLUTANTS IN WATER SERIES 1 Pharmaceuticals in the aquatic environment of the Baltic Sea region
1. IntroductionEmerging pollutants present a new global water quality challenge with potentially-serious threats to human health and ecosystems. Pharmaceuticals represent a major group of emerging pollutants found in freshwater and coastal waters.
Pharmaceuticals are an important element of modern society and their beneficial effects on human and animal health are widely acknowledged. However, their undesired occurrence and potential effects in the environment are a global emerging concern. Residual and unused pharmaceuticals and their byproducts are discharged into freshwater systems with untreated wastewater and effluents from wastewater treatment plants (WWTPs). These pollutants reach coastal and open sea waters, as ultimate sinks. Residues of various types of pharmaceuticals (hormones, painkillers, antibiotics, etc.) have been detected in several environmental compartments in different regions of the world, including the Baltic Sea (Weber et al, 2014).
The occurrence of pharmaceutical substances in the environment is of global concern and the extent of their impacts on human health and biota is largely unknown. A number of regional and global projects have been carried out with the purpose of gathering data on the occurrence of medical substances in the environment as well as on harmful effects of these substances on particular species.
This publication is the first attempt to compile a regional report with a comprehensive overview of the occurrence, concentrations and environmental pressures of pharmaceuticals in the freshwater and marine environment in the Baltic Sea region, based on data available at the national level. The report also includes regional level data on sales and consumption of pharmaceuticals, identifies sources and pathways of pharmaceuticals into the freshwater and marine environment of the Baltic Sea and collects information on effects of pharmaceuticals on aquatic and marine biota.
The report is a case study of the UNESCO Project on ‘Emerging Pollutants in Wastewater Reuse in Developing Countries’ and part of the UNESCO’s International Initiative on Water Quality (IIWQ) technical and policy case study series on emerging pollutants (UNESCO, 2016). It provides scientific data, information and knowledge on pharmaceuticals in freshwater and wastewater systems and their occurrence in the marine ecosystem. It was prepared jointly by the Baltic Marine Environment Protection Commission Helsinki Commission (HELCOM) and the Policy Area (PA) Hazards of the European Union Strategy for the Baltic Sea Region (EUSBSR). The Report was reviewed by national experts from two HELCOM Working Groups ‘State and Conservation’ and ‘Pressure’ and adopted by the meeting of Heads of HELCOM delegations.
1.1 Policy settingIn the 2010 HELCOM Ministerial Declaration, the Contracting Parties to the Helsinki Convention agreed to ’ fur ther assess the environmentally negative impacts of pharmaceuticals and other substances that are not monitored regularly, with the aim as a first step to assess in a coordinated manner their occurrence in the Baltic Sea and evaluate their impacts on the Baltic biota’ (HELCOM 2010).
The commitment was followed up by the 2013 Ministerial Declaration, in which the Contracting Parties agreed ‘to collect more information and assess the state of contamination with pharmaceuticals and their degradation products of the aquatic environment’ (HELCOM 2013a).

17
1. INTRODUCTION
The European Union (EU) Directive 2013/39/EU considers the contamination of water with pharmaceutical residues as an emerging environmental concern (European Commission 2013). Diclofenac, 17-beta-estradiol (E2), 17-alpha-ethinylestradiol (EE2) and estrone (E1), a breakdown product of E2, and three macrolide antibiotics erythromycin, clar ithromycin and azithromycin are included on the first ‘watch list’ under the EU Directive 2013/39/EU, with the aim to gather monitoring data on the aquatic environment from EU Member States for the purpose of facilitating the determination of appropriate measures to address the risk posed by these substances (European Commission 2015).
The EUSBSR PA Hazards has decided to give increased attention to the topic of pharmaceuticals in the Baltic environment during the years 2015-2017. The decision was based on the general growing concern over potential environmental impacts of pharmaceutical substances and the current policy movements within the EU, HELCOM region and globally. Furthermore, a specific objective related to decreased discharges of hazardous substances ( including pharmaceuticals) in the Interreg Baltic Sea Region Programme 2014-2020 opens up possibilities for financial support for new projects within this area.
Scientific evidence and information on the occurrence, fate and effects of emerging pollutants, including pharmaceuticals, in the environment is scarce, especially in developing countries. There is a need to improve scientific understanding and knowledge on pharmaceuticals in the environment. To respond to this need, UNESCO has launched a global project on ‘Emerging Pollutants in Wastewater Reuse in Developing Countries’ (2014-2018), which aims to support UNESCO Member States to strengthen their scientific, technical and policy capacities to manage human health and environmental risks caused by emerging pollutants in water resources and wastewater. Better scientific knowledge and information on the occurrence, fate and effects of pharmaceuticals in the environment will
contribute to improved water quality and wastewater management for the protection of aquatic and marine ecosystems, and ultimately to enhanced water and food security at all levels.
At the global level, particular attention is placed on reducing the release of emerging pollutants, including pharmaceuticals, into the environment. In particular, the 2030 Agenda’s Sustainable Development Goals (SDGs) emphasize the need to reduce pollution by chemicals and hazardous substances and their effects on human health and the environment:
• SDG 6 (clean water and sanitation) Target 6.3 • Improve water quality by
reducing pollution, eliminating dumping and minimizing release of hazardous chemicals and materials, halving the proportion of untreated wastewater and substantially increasing recycling and safe reuse globally
• SDG 3 (health) Target 3.9 • Substantially reduce the
number of deaths and illnesses from hazardous chemicals and air, water and soil pollution and contamination
• SDG 12 (responsible consumption and production)
Target 12.4 • Achieve the environmentally sound management of chemicals and all wastes throughout their life cycle, in accordance with agreed international frameworks, and significantly reduce their release to air, water and soil in order to minimize their adverse impacts on human health and the environment
• SDG 14 (oceans and seas) Target 14.1 • Prevent and significantly reduce
marine pollution of all kinds, in particular from land-based activities, including marine debris and nutrient pollution
Target 14.2 • Sustainably manage and protect marine and coastal ecosystems to avoid significant adverse impacts, including by strengthening their resilience, and take action for their restoration in order to achieve healthy and productive oceans.

18
EMERGING POLLUTANTS IN WATER SERIES 1 Pharmaceuticals in the aquatic environment of the Baltic Sea region
1.2 Pharmaceuticals in the environmentPharmaceuticals enter the environment during various stages of the product lifecycle from their production and consumption to disposal. Freshwater and marine pollution is of concern because pharmaceutical compounds and their bioactive metabolites are continually introduced to the aquatic environment via various pathways. Main pathways, in general, are discharges of untreated and treated wastewater.
In the Baltic Sea region, emissions from manufacturing facilities are generally assumed to be very low compared to inputs occurring during the consumption phase (EEA 2010). However, there might be exceptions to this rule, and in other regions of the world emissions from production may be very high. The main pathway of human consumed pharmaceuticals to the marine environment is via direct discharges of effluents from municipal wastewater treatment plants (MWWTPs) in coastal areas as well as via rivers carrying effluents from inland MWWTPs. Other sources include land application of sewage sludge, whereby pharmaceuticals may leach into surface and ground waters. Pharmaceuticals also enter the environment via agriculture, aquaculture and veterinary practices.
Awareness is growing that pharmaceuticals may have harmful effects for wildlife. Two well-documented global examples of pharmaceuticals adversely affecting wildlife are the hormone 17a-ethinylestradiol and the anti-inflammatory drug diclofenac (e.g. EEA 2010, Kidd et al 2007). The hormone 17a-ethinylestradiol has been reported to be responsible for the feminization of male fish at concentrations that can be found in surface waters downstream of sewage treatment plants and the use of diclofenac for veterinary purposes has nearly wiped-out vulture populations in Southeast Asia. Psychotherapeutic drugs such as oxazepam (Brodin et al 2013) and citalopram (Kellner et al 2015) have also been reported to alter the behavior of fish.
The Baltic Sea ecosystem is particularly sensitive to pharmaceutical pollution because of its low biodiversity, with low functional redundancy and many species experiencing an increased physiological stress due to the brackish water environment. The water exchange rate in the Baltic Sea is slow, meaning that there is a long retention time for persistent substances. This makes the Baltic Sea ecosystem more susceptible to hazardous substances in comparison with other marine areas.

19
2. SCOPE OF THE REPORT
2. Scope of the reportThe scope of this report is to provide a comprehensive regional overview of the extent of inputs of pharmaceuticals to the freshwater and marine environment in the Baltic Sea region, as well as to estimate contamination of the marine environment. The evaluation is based on data and information compiled within the framework of HELCOM and the Policy Area Hazards of the EU Strategy for the Baltic Sea Region.
The data presented in the report comprise a regional overview of available information on the following pressures to the Baltic Sea environment:
• The use of pharmaceuticals for both human veterinary purposes in Baltic Sea countries;
• Pathways of pharmaceuticals to the freshwater and marine environment in the Baltic Sea region;
• Concentrations of pharmaceuticals in river water;
• Concentrations of pharmaceuticals in untreated and treated municipal wastewater (MWWTP influents and effluents) as well as sewage sludge;
• The handling and management of household pharmaceutical waste in Baltic Sea countries.
The estimation of the contamination of the Baltic Sea environment by pharmaceuticals is based on measured concentrations of pharmaceutical substances in Baltic coastal and offshore areas, primarily in sea water, sediment and biota. The concentrations are compared to threshold values, or Predicted No Effect Concentration (PNEC) values, where such information is available.
20
EMERGING POLLUTANTS IN WATER SERIES 1 Pharmaceuticals in the aquatic environment of the Baltic Sea region
3. Data collection methodology and data availability
The data collection and compilation was carried out by the HELCOM Secretariat and PA Hazards as a follow up to the commitment of the 2010 and 2013 Ministerial Declarations of HELCOM Contracting Parties to assess the pharmaceuticals contamination in the aquatic environment.
Two HELCOM working groups contributed to the report: (1) the Working Group on the State of the Environment and Nature Conservation (State and Conser vat ion) regarding concentration of pharmaceuticals in the environment and (2) the Working Group on Reduction of Pressures from the Baltic Sea Catchment Area (Pressure) regarding inputs and pathways of pharmaceuticals to the sea.
3.1 Data collection methodologyData collection was carried out in two stages based on national reporting by HELCOM Contracting Parties through HELCOM Working Groups.
In the first stage, the HELCOM groups State and Conservation and Pressure were asked to report on the availability of data regarding occurrence of pharmaceutical substances in the marine environment as well as on their sources and pathways. Information on data availability was provided by Denmark, Finland, Germany, Poland, Russia and Sweden. All the reports, complemented by published data, were compiled into a summary of data availability.
In the second stage, a questionnaire was circulated to national contacts of the HELCOM groups State and Conservation and Pressure. The questionnaire (together with reporting
guidelines) was elaborated based on the information collected during the first phase and sent out in late August 2015. Filled in templates were submitted to the HELCOM Secretariat by October 2015. In addition to the data on measured concentrations of pharmaceuticals, countries were asked to provide data on sales, prescriptions, consumption of drugs in recent years, as well as information on national systems for managing (handling) pharmaceutical waste.
The data were evaluated by experts and compiled into two background reports of which one focused on concentrations of pharmaceuticals in the environment (Hallgren and Wallberg 2015) and the other on information on sources and pathways of these substances into the environment (Vieno 2015). This publication is a compilation of these two background reports.
3.2 Reported dataThe reported data were divided into two groups. One group included all measurements related to sources and pathways of pharmaceuticals into the environment, including sales and consumption of
pharmaceuticals, their concentrations in freshwater and wastewater systems (river water, MWWTP influents and effluents, sludge), and household pharmaceutical waste handling.

21
3. DATA COLLECTION METHODOLOGY AND DATA AVAILABILITY
The other group included data on concentrations of pharmaceuticals observed in compartments of the marine and coastal environment such as water, sediments and biota.
The majority of reported data on sources and pathways was on concentrations in influents and effluents of MWWTPs as well as observations in rivers. Some data on sales and consumption of drugs available through national statistics as well as information on collection and handling of unused medical substances were also reported.
The measured pharmaceuticals belong to seven therapeutic groups: anti-inflammatory and analgesics; antimicrobial (antibiotic, antifungal, antiviral, antiparasitic, disinfectant, antiseptic) and antidote; cardiovascular agents; central nervous system agents; chemotherapeutic agents and X-ray contrast media; hormones and hormone antagonists; metabolic agents and gastrointestinal agents.
An overview of the data and information reported by countries is presented in Table 1. All HELCOM Contracting Parties except Latvia and Lithuania reported at least some data.
The information received from countries inc luded nat ional monitor ing data , screening data, and results of scientific and commissioned studies. Many data have been published in national reports (in national languages) and some are available in national databases.
In total 47,621 data points from the period 2003-2014 were included in the data set (Figure 1) on sources and pathways of pharmaceuticals (i.e. monitoring of wastewater influent and effluents, sludge and river water).
• In wastewater influents and effluents, 156 different pharmaceuticals and 2 metabolites were analysed, of which 142 pharmaceuticals and 2 metabolites were detected.
• In sewage sludge, 60 different pharmaceuticals were monitored, of which 51 were detected.
• In rivers, 111 different pharmaceuticals were monitored, of which 58 were detected.
Table 1. An overview of data provided in response to a HELCOM questionnaire on occurrence, sources and pathways of pharmaceuticals in the Baltic Sea region. Source: Original data.
Country Production & waste Sales, Consumption Monitoring data
Production Waste management
Human Veterinary WWTPs Sludge Rivers Sea water
Sediments Biota
Denmark
Estonia
Finland
Germany
Poland
Russia
Sweden

22
EMERGING POLLUTANTS IN WATER SERIES 1 Pharmaceuticals in the aquatic environment of the Baltic Sea region
Figure 1. Number of data points for different sample matricesSource: Original data.
A more detailed overview of reported data from MWWTP influents, effluents, sludge and river water is presented in Annex 1.2. The compiled results are presented in Annex 3.
Data on concentrations of pharmaceuticals in the marine environment were reported for the time period 2003-2014 and included 4,600 individual data points from coastal, open sea and transitional areas.
• 167 different pharmaceuticals were measured, of which 74 were found in at least one of the matrices (water, sediment, biota)
• 51 different pharmaceuticals were detected in water (of 148 measured)
• 9 different pharmaceuticals were detected in sediment samples (of 25 measured)
• 35 different pharmaceuticals were detected in biota samples (of 116 measured).
A more detailed overview of reported data on concentrations of pharmaceuticals in the marine environment is presented in Annex 1.2. The compiled results are presented in Annex 4.
3.3 Major data gapsAlthough the report provides the most comprehensive data at the regional level of the magnitude of inputs of several pharmaceutical substances to the Baltic Sea, as well as their concentrations in freshwater systems and the marine environment, there are data gaps that need to be addressed in order to carry out a more complete assessment of the extent of contamination by pharmaceuticals.
Data were provided by the following Baltic Sea countries: Denmark, Estonia, Finland, Germany, Poland, Russia and Sweden. No data were received from Latvia and Lithuania.
The data provided by Poland did not include information on the occurrence of pharmaceuticals in freshwater and wastewater systems, for which reason it was difficult to assess in detail the loads of pharmaceuticals
into the Baltic Sea since Poland has the largest portion of the Baltic Sea catchment area, as well as half of its population.
Data on pharmaceuticals sales and consumption were received only from Estonia, Finland, Germany and Sweden. The total sales and consumption of pharmaceuticals in Baltic Sea region therefore could not be assessed. Statistical reports contain information on the amount of pharmaceuticals sold, of which not all might be used.
No data were received on the occurrence of veterinary pharmaceuticals in manure or in the environment. Thus, the assessment of the contribution of veterinary pharmaceuticals to the freshwater and marine pollution is incomplete.
MWWTP in�uent
MWWTP e�uent
Untreated, digested or composted sludge
River
33 238
4 629
8 202
1 552

23
3. DATA COLLECTION METHODOLOGY AND DATA AVAILABILITY
No data were received on the occurrence of pharmaceuticals in the sediments of inland freshwater bodies or in the soil; thus, the assessment of the role of these compartments as a source and pathway of pharmaceuticals into the Baltic Sea is incomplete.
No data were available for assessing inputs of pharmaceuticals via agriculture and aquaculture.
Information about medical and household pharmaceutical waste handling was received only from Estonia, Finland, Germany, Sweden and partially from Russia. Therefore, the estimation of the threat to the environment via disposal of unused medical substances is incomplete.
No information was collected on biological effects pharmaceuticals on aquatic and marine organisms.
More data from the whole region are needed on:
• sales and consumption ofpharmaceuticals, and householdpharmaceutical waste management
• concentrations of pharmaceuticals inMWWTP influents and effluents, as wellas in rivers
• emissions of pharmaceuticals to theenvironment
• the occurrence and fate of metabolitesin freshwater, wastewater, coastal andsea waters
• concentrations of pharmaceuticals in sewage sludge and soil
• sales and consumption of veterinary pharmaceuticals, and their sources, pathways and loading to soils, surface and groundwater systems and the aquatic environment (including aquaculture)
• analytical methods used for measuring concentrations and their sensitivity.
With regard to specific substances, currently there are no monitoring data on many highly consumed pharmaceuticals, especially on the following substances:
• Allopurinol
• Gabapentin
• Levetiracetam
• Mesalazin
• Valsartan
T h e r e s u l t s o n c o n c e n t r a t i o n s o f pharmaceuticals in the freshwater and marine environment in the Baltic Sea region presented in this report might be underestimated since the analytical methods used by many laboratories were at times not sensitive enough to detect substances at the level of the environmental quality standards for ‘good status’. There is, therefore, a need to improve the analytical methods used for measuring concentrations of pharmaceuticals in the environment. There is also lack of information on pharmaceuticals’ concentrations in biota, as well as on their biological effects.
24
EMERGING POLLUTANTS IN WATER SERIES 1 Pharmaceuticals in the aquatic environment of the Baltic Sea region
4. Overview of existing frameworks for monitoring pharmaceuticals in the freshwater and marine environment
The HELCOM Baltic Sea Action Plan (BSAP) sets out assessment requirements for following progress towards reaching good environmental status (GES) by 2021, whereby the status is to be assessed for a set of ecological objectives. The HELCOM strategic goals and objectives are to a large extent comparable to the descriptors and criteria of the EU Marine Strategy Framework Directive (MSFD) (2008/56/EC), which stipulates that GES is to be achieved by 2020. HELCOM core indicators are used to follow up on the progress made to reach the goals of both policies within the Baltic Sea, by measuring the progress towards a BSAP objective and/or a MSFD criteria. Work has been initiated within HELCOM to develop core indicators for diclofenac and estrogenic-effects; these will be further developed using input from this assessment.
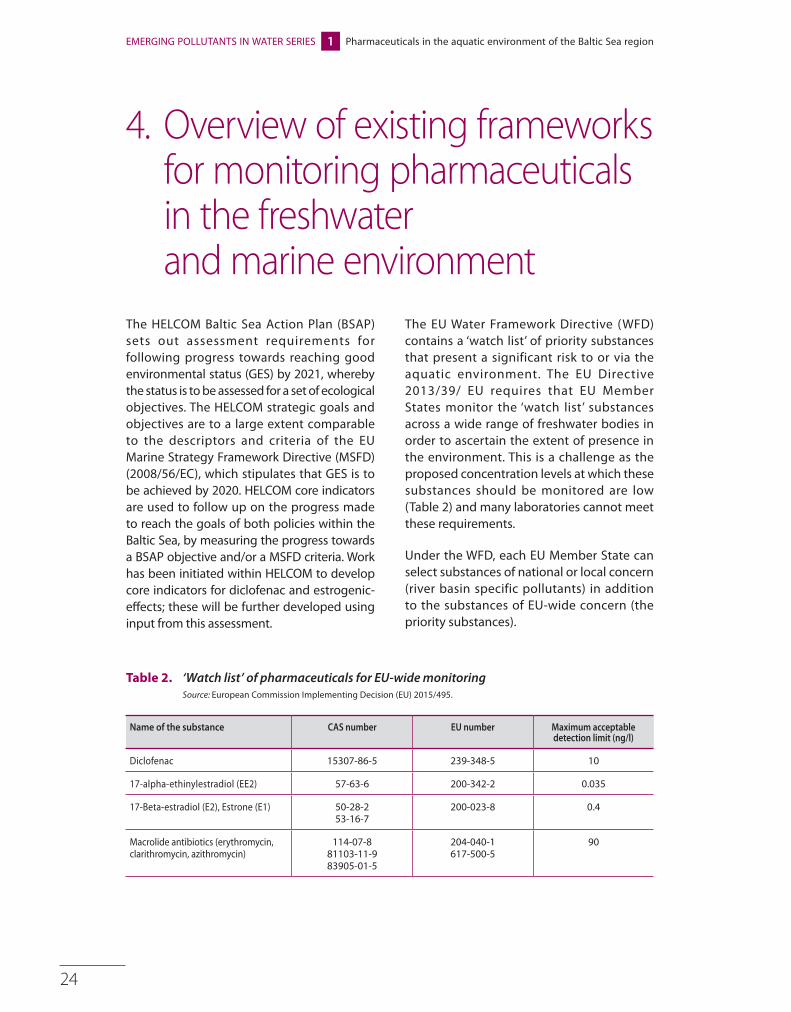
The EU Water Framework Directive (WFD) contains a ‘watch list’ of priority substances that present a significant risk to or via the aquatic environment. The EU Directive 2013/39/ EU requires that EU Member States monitor the ‘watch list’ substances across a wide range of freshwater bodies in order to ascertain the extent of presence in the environment. This is a challenge as the proposed concentration levels at which these substances should be monitored are low (Table 2) and many laboratories cannot meet these requirements.
Under the WFD, each EU Member State can select substances of national or local concern (river basin specific pollutants) in addition to the substances of EU-wide concern (the priority substances).
Table 2. ‘Watch list’ of pharmaceuticals for EU-wide monitoringSource: European Commission Implementing Decision (EU) 2015/495.
Name of the substance CAS number EU number Maximum acceptable detection limit (ng/l)
Diclofenac 15307-86-5 239-348-5 10
17-alpha-ethinylestradiol (EE2) 57-63-6 200-342-2 0.035
17-Beta-estradiol (E2), Estrone (E1) 50-28-2 53-16-7
200-023-8 0.4
Macrolide antibiotics (erythromycin, clarithromycin, azithromycin)
114-07-881103-11-983905-01-5
204-040-1617-500-5
90

25
4. OVERVIEW OF EXISTING FRAMEWORKS FOR MONITORING PHARMACEUTICALS IN THE FRESHWATER AND MARINE ENVIRONMENT
Table 3. Swedish assessment criteria for specific pollutants in coastal waters and transitional watersSource: HVMFS 2013.
Name of the substance Good status Annual Average (ng/l)
Diclofenac 10
17-alpha-ethinylestradiol (EE2) 0.007
17-beta-estradiol (E2) 0.08
In Sweden, for example, three pharmaceuticals are listed as specific pollutants (Table 3).
In September 2015, a Swedish national working group, coordinated by the Swedish Medical Products Agency and consisting of a large number of national agencies within the health
and medical sector and a representative from the industry, presented a list of substances that was suggested should be monitored in the environment on a regular basis (MPA 2015). In addition to the substances included on the WFD ‘watch list’, 17 pharmaceuticals were suggested (Table 4).
Table 4. 17 pharmaceuticals suggested for monitoring by a Swedish stakeholder working group in addition to the substances on the WFD ‘watch list’Source: MPA 2015.
Name Justification by Swedish MPA (2015)
Ciprofloxacin Persistent and demonstrated resistance development in the environment.
Citalopram Has been detected in fish and drinking water. PBTproperties. Relatively large usage.
Fluconazol Has been detected in drinking water, surface water and sludge.
Ibuprofen Large usage and has been detected in surface water.
Carbamazepin Has been detected in drinking water and surface water.
Cetoconazol Has been detected in sludge.
Levonorgestrel PBTwproperties.
Losartan Large usage.
Metoprolol Large usage and has been detected in drinking water, surface water and sludge.
Metotrexat Unknown environmental effects and presence. A chemotherapy that is used by the households.
Naproxen Has been detected in drinking water and surface water. Increased usage as it is often used as a replacer for diclofenac.
Oxazepam Has been detected in fish, surface water and drinking water. Toxic at environmental relevant concentration.
Sertralin Has been detected in surface water, fish and sludge.
Sulfametoxazol Has been detected in surface water, fish and sludge.
Tramadol Has been detected in surface water and drinking water.
Trimetroprim Large usage. Has been detected in drinking water, surface water and sludge.
Zolpidem Has been detected in drinking water, surface water and sludge.

26
EMERGING POLLUTANTS IN WATER SERIES 1 Pharmaceuticals in the aquatic environment of the Baltic Sea region
5. Production, consumption and handling of pharmaceutical wastes
5.1 Pharmaceutical productionData about pharmaceutical production were received only from Finland. The Finnish Medicines Agency, Fimea, grants licenses for facilities producing medicinal products. Currently, pharmaceuticals are produced by at least eight companies in at least twelve manufacturing plants in Finland.
Although the contribution of manufacturing facilities to emissions of medicinal products and/or their residues is generally considered to be negligible in the EU, there is no comprehensive information about pharmaceutical production facilities and their potential emissions of pharmaceutical substances in the region. Information on pharmaceutical production in other countries in the region would be useful for mapping potential hot spots for releases of pharmaceuticals.
5.2 Consumption of pharmaceuticalsThe consumption phase is considered to be the biggest contributor to the emissions of pharmaceuticals into the environment, mainly through excretions and incorrect disposal of unused medicines into sinks and toilets. Between 30 to 90% of the orally administered dose is generally excreted as active substance in the urine of humans and animals, with the nature and amount of medicinal residues mainly dependent on the volumes and nature of the administered substances, the mode of administration and metabolization rates (BIO Intelligence Service 2013).
Human consumption
Four countries (Estonia, Germany, Finland and Sweden, some data also from Russia) provided information on human consumption of pharmaceuticals, mainly based on data on sold amounts. The magnitude of consumption was calculated for the most frequently prescribed
pharmaceuticals as well as for those that were often found in the environment (e.g., metoprolol, carbamazepine, diclofenac). Consumption data were available for 76 pharmaceuticals in total, but data from all four countries were available for only 16 pharmaceutical substances.
About 21 million people live in the area from where data were available (compared to the 85 million residing in the entire Baltic Sea catchment), therefore, the presented figures are not representative of the total consumption of pharmaceuticals in the Baltic Sea region.
Figure 2 shows the annual consumption of the top 20 most sold pharmaceuticals. According to the available data, anti-inflammatory drug paracetamol was the most consumed pharmaceutical with a total annual sales volume of more than 520,000 kg.

27
5. PRODUCTION, CONSUMPTION AND HANDLING OF PHARMACEUTICAL WASTES
The annual sales of antidiabetic drug metformin, constipation drug macrogol and anti-inflammatory drug ibuprofen all exceeded 100,000 kg. In 2014, about 1,600 tons of the top 20 pharmaceuticals were sold in the four countries from which data were available. Per inhabitant, this amounts to about 80 g per person per year. If the consumption patterns are similar throughout the region (for the entire Baltic Sea catchment), then the volume of the top 20 most sold pharmaceuticals would be about 6,800 tons per year. More data on sales of pharmaceuticals are presented in Annex 2.
Veterinary consumptionDue to very limited data reported on veterinary consumption of pharmaceuticals, it is difficult to estimate the total amount of veterinary pharmaceuticals used in the Baltic Sea catchment area. A very rough estimation, by extrapolating from the available data from Finland and Germany, would result in annual sales and consumption of about 900 tons. This figure only includes antimicrobial drugs, since no data were reported on the sales and consumption of pharmaceuticals in other therapeutic groups. More data on the use of pharmaceuticals in veterinary are presented in Annex 2.
Figure 2. The top 20 most sold pharmaceuticalsSource: Data were received from Estonia, Finland, Germany (only Mecklenburg-Vorpommern and Schleswig-Holstein – which are within the catchment area of the Baltic Sea) and Sweden. For diclofenac, also Russian (St. Petersburg) data are included. Metamizole was only prescribed in Germany. For ampicillin, furosemide, tramadol and naproxen, data were available from Estonia, Finland and Sweden.
529,935
346,888
273,687
180,208
41,966
33,650
27,454
25,274
24,091
22,533
18,663
18,027
15,453
13,152
12,062
10,759
9,139
7,949
6,910
5,570
1 10 100 1,000 10,000 100,000 1,000,000
Paracetamol
Metformin
Macrogol
Ibuprofen
Mesalazine
Metamizole
Metoprolol
Valproic acid
Naproxen
Gabapentin
Levetiracetam
Amoxicillin
Allopurinol
Carbamazepine
Diclofenac
Simvastatin
Valsartan
Furosemide
Tramadol
Ampicillin
kg/a

28
EMERGING POLLUTANTS IN WATER SERIES 1 Pharmaceuticals in the aquatic environment of the Baltic Sea region
5.3 Handling of household pharmaceutical wastesThe improvement of take-back schemes for unused medical products represents one of the simplest ways for reducing inputs of pharmaceutical products into the environment. EU medicinal legislation has required take-back schemes for unused and expired human medicinal products since 2004 (Directive 2004/27/EC) to 'ensure that appropriate collection systems are in place for human medicinal products that are unused or have expired' (European Commission 2004).
Only Estonia, Finland and Sweden provided information on the amounts of pharmaceutical waste collected (Table 5) and on procedures for handling pharmaceutical waste.
In Estonia, all pharmaceuticals are classified as hazardous waste and should therefore be collected.
In Finland, all pharmaceuticals are classified as hazardous waste and should therefore be collected. The collection of pharmaceutical waste is most commonly arranged through cooperat ion with local pharmacies. Pharmacies accept medicines and mercury thermometers returned by customers at no cost. The municipality provides the pharmacy with collection containers and transports the waste to a toxic waste disposal plant for proper disposal.
Table 5. Amounts of pharmaceutical waste collected in Estonia, Finland and SwedenSource: Original data.
Estonia (in 2014)
Finland (in 2006)
Sweden (in 2011)
89,190 kgAll waste pharmaceuticals collected
185,000 kgPharmaceuticals returned to the pharmacies
1,500,000 kgEstimate of the total amount involved in take-back schemes
33,000 kgIncorrectly disposed via solid waste
800,000 kgPharmaceuticals returned to the pharmacies
28,000 kgIncorrectly disposed via sewers
250,000 kgEnding up in the mixed waste from households
10,000 kgFrom the public to municipalities recycling centers
50,000 kgDiscarded by the internal operations of the pharmacies
250,000 kgDiscarded by the internal operations of the wholesale trades
100,000 kgDiscarded in hospital healthcare
According to surveys carried out by the Finnish University Pharmacy in 2009, the proportion of people returning medical waste properly has grown in recent years. A survey carried out in 2009 showed that about one in ten Finns admitted having thrown medicines into mixed waste or to have flushed them into the sewers. In a similar survey in 2006,
the same figure was three in every ten Finns. The most common reported reason for improper disposal of medical waste was that people did not know how to treat them. Other reasons mentioned in the survey were indifference, hurry, long distances and that the amount of the medicine was small or that it was thought harmless.
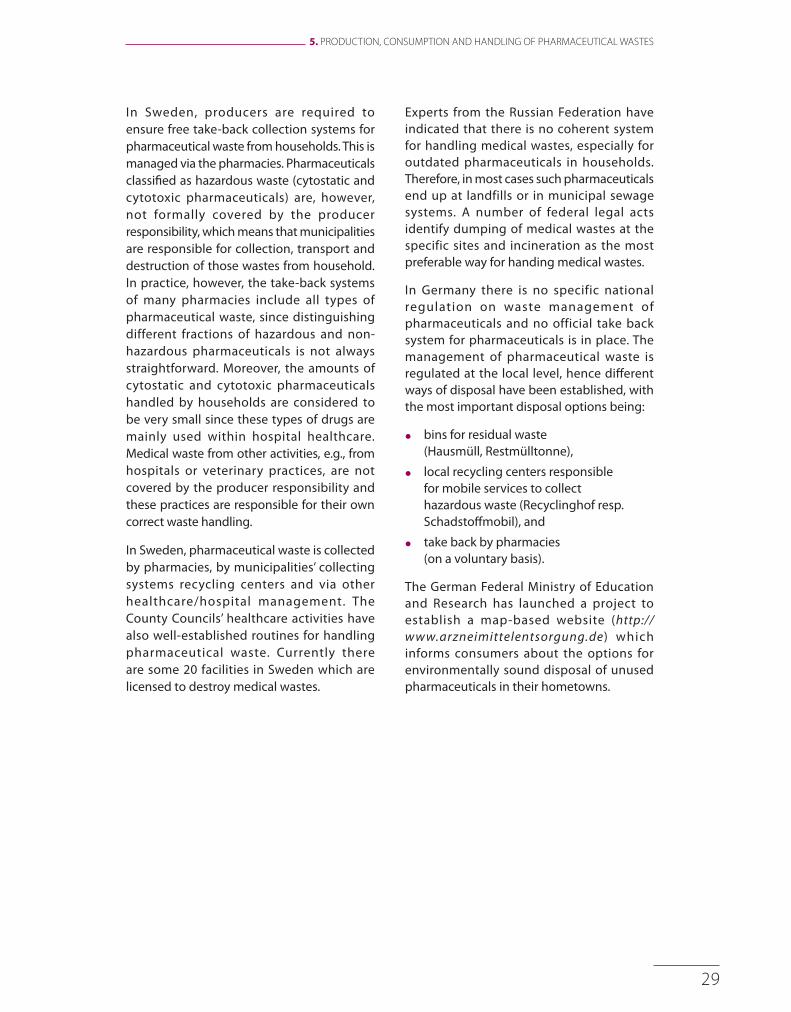
29
5. PRODUCTION, CONSUMPTION AND HANDLING OF PHARMACEUTICAL WASTES
In Sweden, producers are required to ensure free take-back collection systems for pharmaceutical waste from households. This is managed via the pharmacies. Pharmaceuticals classified as hazardous waste (cytostatic and cytotoxic pharmaceuticals) are, however, not formally covered by the producer responsibility, which means that municipalities are responsible for collection, transport and destruction of those wastes from household. In practice, however, the take-back systems of many pharmacies include all types of pharmaceutical waste, since distinguishing different fractions of hazardous and non-hazardous pharmaceuticals is not always straightforward. Moreover, the amounts of cytostatic and cytotoxic pharmaceuticals handled by households are considered to be very small since these types of drugs are mainly used within hospital healthcare. Medical waste from other activities, e.g., from hospitals or veterinary practices, are not covered by the producer responsibility and these practices are responsible for their own correct waste handling.
In Sweden, pharmaceutical waste is collected by pharmacies, by municipalities’ collecting systems recycling centers and via other healthcare/hospital management. The County Councils’ healthcare activities have also well-established routines for handling pharmaceutical waste. Currently there are some 20 facilities in Sweden which are licensed to destroy medical wastes.
Experts from the Russian Federation have indicated that there is no coherent system for handling medical wastes, especially for outdated pharmaceuticals in households. Therefore, in most cases such pharmaceuticals end up at landfills or in municipal sewage systems. A number of federal legal acts identify dumping of medical wastes at the specific sites and incineration as the most preferable way for handing medical wastes.
In Germany there is no specific national regulation on waste management of pharmaceuticals and no official take back system for pharmaceuticals is in place. The management of pharmaceutical waste is regulated at the local level, hence different ways of disposal have been established, with the most important disposal options being:
• bins for residual waste (Hausmüll, Restmülltonne),
• local recycling centers responsible for mobile services to collect hazardous waste (Recyclinghof resp. Schadstoffmobil), and
• take back by pharmacies (on a voluntary basis).
The German Federal Ministry of Education and Research has launched a project to establish a map-based website (http://www.arzneimittelentsorgung.de) which informs consumers about the options for environmentally sound disposal of unused pharmaceuticals in their hometowns.

30
EMERGING POLLUTANTS IN WATER SERIES 1 Pharmaceuticals in the aquatic environment of the Baltic Sea region
6. Inputs of pharmaceuticals into the Baltic Sea
6.1 Sources and pathwaysPharmaceuticals are released into the environment during various stages of the product lifecycle (manufacturing, consumption and waste disposal). In the Baltic Sea region, the main sources of pharmaceuticals are the excretion of active substances consumed by humans and animals (via urine and faeces) as well as the incorrect disposal of unused medical products into toilets and sinks. Figure 3 illustrates the main sources and pathways of pharmaceuticals into the environment.
Since the majority of the population in the Baltic Sea region is connected to municipal wastewater treatment plants, MWWTPs are considered a major pathway of pharmaceuticals into the environment. Pharmaceuticals are directly released into
the Baltic Sea via the effluents of coastal MWWTPs and indirectly by the rivers which carry effluents from inland MWWTPs. In some areas, the pharmaceutical industry and hospitals may be important sources of pharmaceuticals that end up in the sewage system.
Other pathways of pharmaceuticals to the Baltic Sea include emissions from scattered dwellings not connected to centralized sewage systems, runoff/leaching from land where manure or sewage sludge has been applied and landfill leachate, if medical waste is incorrectly disposed of via solid waste. It is not possible to assess the significance of these other pathways with the presently available data.
Figure 3. Main sources and pathways of pharmaceuticals to the environment
USAGE
LAND SURFACE WATERGROUND WATER
metabolism
Biological and chemical degradation
metabolism manure spreading
HUMAN USE
TOILET
INDUSTRY, HOSPITALS
SINK/TOILET
HOUSEHOLD WASTEPHARMACY
FARMS
WASTE WATER TREATMENT
LANDFILL
LEACHATE TREATMENT
DISPOSAL

31
6. INPUTS OF PHARMACEUTICALS INTO THE BALTIC SEA
6.2 Concentrations of pharmaceuticals in wastewater, sludge and river water
Analytical data were available for 156 pharmaceuticals and 2 metabolites sampled in wastewater and sludge from MWWTPs situated in Denmark, Estonia, Finland, Germany, Russia (St. Petersburg) and Sweden.
Figure 4 presents the top 20 pharmaceuticals present at the highest concentrations in MWWTP influents. The highest average concentration of 83 µg/l was measured for anti-inflammatory drug paracetamol. The highest concentration of 1,300 µg/l was measured for diuretic drug furosemide (in Denmark).
Figure 5 shows the top 20 pharmaceuticals with highest concentrations in MWWTP effluent (i.e., treated wastewater). The highest average concentration of 22.3 µg/l was measured for diuretic drug furosemide and the highest measured concentration of 360 µg/l was for anti-inflammatory drug paracetamol (in Denmark). In general, those compounds that were present in the influents at highest concentrations and which were the least
removed during the treatment were detected in the effluents at the highest concentrations.
Removal rates in MWWTPs were calculated for 118 pharmaceuticals by comparing the reported influent and effluent concentrations (Figure 6). It should be noted, that the removal rates consider only the removal of pharmaceuticals from the aqueous phase. Removal rates were not calculated for pharmaceuticals that were not detected in influent waters.
Only nine out of 118 pharmaceuticals were efficiently (> 95%) removed during the wastewater treatment process. Nearly half of the compounds were removed with efficiencies lower than 50%. For 16 pharmaceuticals, higher concentrations were reported in effluents than in influents, which may be due to analytical errors or the release of parent compounds from β-glucuronated pharmaceuticals that were excreted by the human body.
Figure 4. The top 20 pharmaceuticals measured in highest concentrations in MWWTP influents indicates the average concentration of the measurements and indicates the maximum measured concentration.
Source: Original data.
0.1
1
10
100
1,000
10,000μg/l
Max detected Average detected
Para
ceta
mol
Ca�e
ine
Furo
sem
ide
Telm
isarta
n
2-hy
drox
yibup
rofe
n
Salic
ylic a
cid
Ibup
rofe
n
Dipy
ridam
ole
Napr
oxen
Met
opro
lol
Sulfa
met
hiaz
ol
Tram
adol
Sota
lol
Clar
ithro
myc
in
Cita
lopr
am
Doxy
cycli
ne
Keto
prof
en
Aten
olol
Code
ine
Diclo
fena
c

32
EMERGING POLLUTANTS IN WATER SERIES 1 Pharmaceuticals in the aquatic environment of the Baltic Sea region
Figure 5. The top 20 pharmaceuticals measured in highest concentrations in treated wastewater (MWWTP effluents)
indicates the average concentration of the measurements and indicates the maximum measured concentration. Maximum detected concentrations for iopamidol, iohexol and iomeprol are not included since only mean concentrations were reported. Source: Original data.
0.1
1
10
100
1,000μg/l
Max detected Average detected
Furo
sem
ide
Ca�e
ine
X-ra
y con
trast
med
ia
Gaba
pent
in
2-hy
drox
yibup
rofe
n
Telm
isarta
n
Iopa
mid
ol
Para
ceta
mol
Iohe
xol
Met
opro
lol
Iom
epro
l
Tram
adol
Ibup
rofe
n
Diclo
fena
c
Carb
amaz
epin
e
Sota
lol
Sulfa
met
hiaz
ol
Clar
ithro
myc
in
Benz
a�br
at
Salic
ylic a
cid
Furthermore, in activated sludge, E. coli secrete β-glucuronidase enzyme, which is capable of deconjugating glucuronated metabolites and can result in releases of the active pharmaceutical into the wastewater. Additionally, two of the compounds that were identified in higher concentrations in the effluent than the influent were metabolites of ibuprofen that are formed during the biological degradation of the parent compound.
Significantly fewer data were reported for sludge samples than for influent and effluent samples, and only from Finland and Sweden. Data for composted sludge were only received from Finland. More data should be gathered on the presence of pharmaceuticals in sewage sludge as well as the fate of the compounds during sludge treatment. The top 20 pharmaceuticals (highest concentrations) in untreated sludge are presented in Figure 7. The highest average concentration of 3.3 mg/kg d.w. was measured for the antibiotic ciprofloxacin. Also the highest measured concentration was for ciprofloxacin at 8.8 mg/kg d.w. (in Finland).
Figure 6. Number of pharmaceuticals removed in MWWTPs at different removal ratesRemoval rates were estimated by comparing concentrations in influents and effluents.Source: Original data.
Concentration increased
<20 %
20 –50 %
50 –75 %
75–95 %
>95 %
16
13
2829
23
9

33
6. INPUTS OF PHARMACEUTICALS INTO THE BALTIC SEA
Figure 7. The top 20 pharmaceuticals measured in highest concentrations in untreated sewage sludge
indicates the average concentration of the measurements and indicates the maximum measured concentration. Source: Original data.
Figure 8. Average concentrations of pharmaceuticals in untreated, digested and composted sludge
Source: Original data.
0.01
0.1
1
10μg/l
Max detected Average detected
Cipr
o�ox
acin
Tetra
cycli
ne
Ca�e
in
Nor�
oxac
in
Keto
kona
zole
Cita
lopr
am
Doxy
cycli
ne
Para
ceta
mol
O�ox
acin
Ibup
rofe
n
Napr
oxen
Prog
este
rone
Enta
capo
ne
Furo
sem
ide
Met
opro
lol
Diclo
fena
c
Oxyt
etra
cycli
ne
Carb
amaz
epin
e
Hydr
ochl
orth
iazid
e
Fend
enda
zole
0.001
0.01
0.1
1
10mg/kg d.w.
Untreated Digested Composted
Cipr
o�ox
acin
Tetra
cycli
ne
Ca�e
ine
Nor�
oxac
in
Keto
kona
zole
Doxy
cycli
ne
Para
ceta
mol
O�ox
acin
Ibup
rofe
n
Cita
lopr
am
Napr
oxen
Prog
este
rone
Enta
capo
ne
Furo
sem
ide
Carb
amaz
epin
e
Diclo
fena
c
Oxyt
etra
cycli
ne
Met
opro
lol
Hydr
ochl
orth
iazid
e
Fend
enda
zole

34
EMERGING POLLUTANTS IN WATER SERIES 1 Pharmaceuticals in the aquatic environment of the Baltic Sea region
Average concentrations of pharmaceuticals in untreated, digested and composted sludge are presented in Figure 8. Concentrations of some pharmaceuticals are reduced through digestion and/or composting, however, certain compounds, such as antibiotics, seem to be fairly resistant to degradation during sludge treatment. More research is needed on the fate of pharmaceuticals in sludge treatment.
Data were reported for 111 pharmaceuticals in river water samples. Figure 9 presents the top 20 pharmaceuticals occurring at highest concentrations in sampled river water. The highest average concentration of 0.92 µg/l was measured for X-ray contrast media iopamidol. Iopamidol was also the pharmaceutical measured at the highest concentration of 20.8 µg/l (Pampower Graben, Germany). In general, the average concentrations were lower than 0.1 µg/l, however, for twelve compounds the highest concentrations exceeded 1 µg/l.
Figure 9. The top 20 pharmaceuticals measured in highest concentrations in river water samples indicates the average concentration of the measurements and indicates the maximum measured concentration.
Source: Original data.
1
10
100
1,000
10,000
100,000μg/l
Max detected Average detected
Iopa
mid
ol
Florfe
nico
l
Hydr
ochl
orot
hiaz
ide
Amid
otriz
oic a
cid
Prop
ofol
Tram
adol
Furo
sem
ide
Carb
amaz
epin
e
Met
opro
lol
Roxit
hrom
ycin
Diclo
fena
c
Telm
isarta
n
Sulfa
diaz
ine
Losa
rtan
Eryt
hrom
ycin
Aten
olol
Sulfa
met
hoxa
zole
Para
ceta
mol
Fluco
nazo
le
Trim
etho
prim

35
7. CONCENTRATIONS AND EFFECTS OF PHARMACEUTICALS IN THE MARINE ENVIRONMENT
7. Concentrations and effects of pharmaceuticals in the marine environment
Six Contracting Parties reported data on the concentrations of pharmaceuticals in the Baltic Sea environment for the period from 2003 to 2014. In total, 4,600 observations in water, sediments and biota were reported. Presence of pharmaceuticals was detected in 640 of these samples. One hundred and sixty-seven different pharmaceuticals were measured and 74 of these were found in at least one of the matrices (water, sediment or biota).
The presented overview of concentrations of pharmaceuticals in the environment is based on data reported by the Contracting Parties, i.e. it does not contain information on all compounds that have been detected in the Baltic Sea environment. No data on biological effects were received from the Contracting Parties, however, data from scientific studies on the effects of pharmaceuticals on Baltic biota have been included. Additional information on methods, collected samples and concentrations of the individual pharmaceuticals are presented in Annex 4. An overview of all data submitted by the Contracting Parties, including references, is presented in Annex 1.2.
Maps and figures give an overview of sampling sites, sampling matrices and the number of samples above the detection limit. The geographical distribution of all water, sediment and biota samples are presented in Figures 10 to Figure 12, respectively. For regional monitoring and assessment purposes within HELCOM, the Baltic Sea is divided into subbasins (referred to as Level 3 in the map legend) and coastal areas (see HELCOM 2013b).
Figure 10. Overview of all 3,647 water samples in the compiled data set Source: Data submitted by Denmark, Estonia, Finland, Germany, Poland, and Sweden.

36
EMERGING POLLUTANTS IN WATER SERIES 1 Pharmaceuticals in the aquatic environment of the Baltic Sea region
Figure 11. Overview of all 114 sediment samples in the compiled data set Source: Data submitted Estonia, Finland, and Sweden.
Figure 12. Overview of all 839 biota samples in the compiled data setSource: Data submitted by Sweden only.
7.1 Concentrations of pharmaceuticals in the marine environment
The main results are presented by grouping pharmaceuticals according to their general clinical use (therapeutic group). Maps and figures present information about selected substances belonging to each therapeutic group. More detailed information is presented in Annex 4.
The figures, presenting concentrations of individual pharmaceuticals, intend to visualize the variability in the sensitivity of the analytical methods used; referred to as LOD (limit of detection) in the figures.
The highest reported limit of detection (High-LOD) in the data set represents the least sensitive analytical method used, while the Low-LOD represents the most sensitive method used. However, LOD was not reported in all data sets. Therefore, in some cases the lowest reported measured concentration is presented as a proxy for the Low-LOD, representing a worst case scenario. The LOD indicator is missing when no sufficient data on LOD were reported. The LODs presented in the figures are thus indicative.

37
7. CONCENTRATIONS AND EFFECTS OF PHARMACEUTICALS IN THE MARINE ENVIRONMENT
Anti-inflammatory and analgesics
Of all monitored pharmaceuticals in the category anti-inflammatory and analgesics, 11 out of 26 (42%) substances were detected in environmental samples (water, sediment or biota). The most frequently detected substances were diclofenac (79 out of 322 samples; 25%) (Figure 13) and ibuprofen (38 out of 260 samples; 15%) (Figure 14).
Paracetamol was detected in all eight reported samples of water and sediments in which the substance was analyzed. Phenazone was observed in only five out of 137 water samples (4%) (Figure 15). Tramadol was detected in two out of four and trihexyphenidyl in three out of four biota samples (Table A4.7). The maximum concentrations measured in water samples were 54 ng/l for diclofenac, 159 ng/l for ibuprofen, 360 ng/l for paracetamol and 504 ng/l for phenazone (Figure 16).
Figure 13. Sample locations for the compiled data on diclofenacEach presented data point might conceal several measurements conducted at the exact same location. Source: Original data.
Figure 14. Sample locations for the compiled data on ibuprofen (including ibuprofen-OH and ibuprofen-COOH)Each presented data point might conceal several measurements conducted at the exact same location. Source: Original data.

38
EMERGING POLLUTANTS IN WATER SERIES 1 Pharmaceuticals in the aquatic environment of the Baltic Sea region
Figure 15. Sample locations for the compiled data on phenazoneEach presented data point might conceal several measurements conducted at the exact same location. Source: Original data.
Diclofenac is on the Directive 2013/39/EU (WFD) ‘watch list’ of pharmaceuticals to be monitored EU-wide, and has a proposed annual average environmental quality standard (proposed AA-EQS) of 10 ng/l. This value was exceeded in six out of 257 (2.3%) samples. For 187 samples, the result was <LOD for diclofenac. In 30% of these samples (56 out of 187) the reported LOD was 20 ng/l or higher, indicating that diclofenac might be more frequently detected if more sensitive analytical methods were applied.
Figure 16. Anti-inflammatory and analgesics. Concentrations in Baltic Sea waterIbuprofen* includes ibuprofen-OH and ibuprofen-COOH. Source: Original data.
Antimicrobials and antidotes
Of all monitored pharmaceuticals in the category of antimicrobial agents (antibiotic, antifungal, antiviral, antiparasitic, disinfectant, antiseptic) and antidote, 11 out of 30 (37%) substances were detected in environmental samples (water, sediment or biota). Concentrations of antimicrobial agents in seawater are indicated in Figure 17. Claritromycin was detected in two out of 126 water samples and on one occasion in biota. However, the reported analytical limits of detection (LODs) for some substances are above the highest value reported in other studies.
Sulfamethoxazole was detected in all matrices. In water, this compound was detected in 12 out of 140 (9%) samples; in sediments in four out of eight (50%); and on one occasion out of four this compound was detected in biota samples (Figure 18). The highest measured concentration of this compound in water was 33 ng/l, with a median concentration of about 16 ng/l.
0.00001
0.0001
0.001
0.01
0.1
1µg/l
Diclo
fena
c
Ibup
rofe
n*
Keto
prof
en
Napr
oxen
Para
ceta
mol
Phen
azon
e
Tram
adol
Max detected
Median of detected High-LOD
Low-LOD

39
7. CONCENTRATIONS AND EFFECTS OF PHARMACEUTICALS IN THE MARINE ENVIRONMENT
Figure 17. Antimicrobial (antibiotic, antifungal, antiviral, antiparasitic, disinfectant, antiseptic) and antidote. Concentrations in Baltic Sea water Source: Original data.
Figure 18. Sample locations for the compiled data on sulfamethoxazoleEach presented data point might conceal several measurements conducted at the exact same location. Source: Original data.
0.0001
0.001
0.01
0.1
1µg/l
Clar
ithro
myc
in
Clin
dam
ycin
Clot
rimaz
ole
Sulfa
met
hoxa
zole
Trim
etho
prim
Max detected
Median of detected High-LOD
Low-LOD
Figure 19. Cardiovascular agents (blood pressure, diuretics, anticoagulants, anti-histamine). Concentrations in Baltic Sea waterSource: Original data.
Cardiovascular agentsFourteen out of 25 (56%) cardiovascular a g e n t s w e r e d e t e c t e d i n w a t e r (concentrations in sea water are indicated in Figure 19). Only bisoprolol was also detected in a biota sample. Metaprolol was detected in 23 out of 144 (16%) water samples (Figure 20) with the highest measured concentration of 55 ng/l; bisoprolol was found in 33 out of 144 (23%) water samples (Figure 21) with the highest measured concentration of 128 ng/l; and sotanol was detected in five out of 139 (4%) water samples (Figure 22) with the highest measured concentration of 24 ng/l.
0.0001
0.001
0.01
0.1
1
Met
opro
lol
Biso
prol
ol
Dipy
ridam
ole
Irbes
arta
n
Sota
lol
Max detected
Median of detected High-LOD
Low-LOD
µg/l

40
EMERGING POLLUTANTS IN WATER SERIES 1 Pharmaceuticals in the aquatic environment of the Baltic Sea region
Figure 20. Sample locations for the compiled data on metoprololEach presented data point might conceal several measurements conducted at the exact same location. Source: Original data.
Figure 21. Sample locations for the compiled data on bisoprololEach presented data point might conceal several measurements conducted at the exact same location. Source: Original data.
Central nervous system agents
Twenty-one out of 44 (48%) monitored central ner vous system agents were detected in water and biota (concentrations in sea water are indicated in Figure 23). The compounds carbamazepine (Figure 24) and primidone (Figure 25) were detected on several occasions (Annex tables A4.16 and A4.18). Oxazepam (Figure 26) was detected in several cases, but its median concentration only slightly exceeded the lowest LOD, which indicates that the compound might be detected more frequently if more sensitive analytical methods were applied.
Carbamazepine was detected in more than 60% of reported water samples (135 out of 218), almost all around the Baltic Sea. This compound was detected in biota on one occasion. The highest measured concentration reached 73 ng/l . S ince the median concentration of carbamazepine falls in the interval between the highest and lowest LOD, it indicates that the compound possibly occurs more frequently. Primidone was detected in all 51 reported water samples taken in almost all sub-basins of the Baltic Sea. The highest measured concentration was 58 ng/l.

41
7. CONCENTRATIONS AND EFFECTS OF PHARMACEUTICALS IN THE MARINE ENVIRONMENT
Figure 22. Sample locations for the compiled data on sotalolEach presented data point might conceal several measurements conducted at the exact same location. Source: Original data.
Figure 23. Central nervous system agents (psychotherapeutic, antiepileptic, antiparkinson, muscle relaxant). Concentrations in Baltic Sea water Source: Original data.
0.0001
0.001
0.01
0.1
1µg/l
Carb
amaz
epin
e
Cita
lopr
am
Oxaz
epam
Sertr
alin
e
Venl
afax
ine
Prim
idon
e
Max detected
Median of detected High-LOD
Low-LOD
Chemotherapeutic agents and X-ray contrast mediaThree different pharmaceuticals of the therapeutic group chemotherapeutic agents and X-ray contrast media were measured in water. Amidotrizoic acid was detected in 16 out of 137 (12%) water samples from Germany. The highest recorded concentration of amidotrizoic acid was 0.125 µg/l and the median among the detected samples was 0.047 µg/l. Iopamidol was detected in two out of 137 (2%) samples from Germany, with the highest concentration being 0.09 µg/l. Capecitabine was measured, but not detected, in two water samples from Denmark.
Dermatological agents
Data on salicylic acid were available for water and sediment samples from Sweden, where the substance was detected in four out of eight (50%) water samples and in all four sediment samples. None of six biota samples indicated presence of this compound. The highest reported concentration was 14 ng/l, with a median of 12 ng/l.

42
EMERGING POLLUTANTS IN WATER SERIES 1 Pharmaceuticals in the aquatic environment of the Baltic Sea region
Figure 24. Sample locations for the compiled data on carbamazepineEach presented data point might conceal several measurements conducted at the exact same location. Source: Original data.
Figure 25. Sample locations for the compiled data on primidoneEach presented data point might conceal several measurements conducted at the exact same location. Source: Original data.
Hormones and hormone antagonists
Of all monitored hormones and hormone antagonists, five out of 15 (33%) substances were detected in environmental samples (water, sediment or biota). Estradiol and 17a-ethinylestradiol were detected in only three water samples out of 228 reported samples taken from water, sediments and biota. The highest concentration detected for estradiol was 1.1 ng/l. For the synthetic estrogen 17a-ethinylestradiol, the minimum acceptable detection limit, as well as the proposed EQS, according to the EU ‘watch list’ (Table 2) is 0.035 ng/l.
For 105 out of 107 water samples the result was reported as being <LOD. In 90% of these cases (95 of 105) the reported LOD was 0.1 ng/l or higher, indicating that monitoring of these substances is problematic since in general the analytical methods are not sensitive enough.

43
7. CONCENTRATIONS AND EFFECTS OF PHARMACEUTICALS IN THE MARINE ENVIRONMENT
Figure 26. Sample locations for the compiled data on oxazepamEach presented data point might conceal several measurements conducted at the exact same location. Source: Original data.
Metabolic and gastrointestinal agents
Of the metabolic agents and gastrointestinal agents six out of 14 (43%) substances were detected in environmental samples. Clofibric acid concentrations were very low. Nonetheless, the compound was detected in 83 out of 128 (65%) open sea water samples all around the Baltic Sea. The maximum detected concentration was 0.4 ng/l. The fact that the median concentration is lower than the highest LOD means that the compound might be more frequently present in water bodies than can be concluded from detected samples.
7.2 Pharmaceuticals detected in marine biotaAll reported biota samples were collected in Sweden and of a total of 839 measurements, 77 (9%) had concentrations of pharmaceutical substances that were above the detection limit. All results on detected pharmaceuticals in biota (grouped by species) are presented in Figure 27 to Figure 31. It should be noted that information on type of tissue sampled (e.g., fish muscle or bile) was sometimes missing in the reported data.
The results indicate that the largest number of different pharmaceutical substances and the highest concentrations are found in blue mussels (Figure 28).
Figure 27. Ciprofloxacin in Atlantic cod (Gadus morhua)Location a) Kalmar, Western Gotland Basin (HELCOM sub-basin 10). Location b) Gothenburg, Kattegat (HELCOM sub-basin 1) – 2 samples. Source: Original data.
0
1
2
3
4
5
6
7
8
9
Cipr
o�ox
acin
Loca
tion a
Cipr
o�ox
acin
Loca
tion b
, sam
ple 1
Cipr
o�ox
acin
Loca
tion b
, sam
ple 2
µg/kg ww

44
EMERGING POLLUTANTS IN WATER SERIES 1 Pharmaceuticals in the aquatic environment of the Baltic Sea region
Figure 28. Detected pharmaceuticals in blue mussel (Mytilus edulis trossulus)Location a) Askeröfjorden, north of Gothenburg, Kattegat (north of HELCOM sub-basin 1). Location b) Älvsborgsfjorden, Gothenburg, Kattegat (HELCOM sub-basin 1).Source: Original data.
Figure 29. Detected pharmaceuticals in bile from European perch (Perca fluviatilis)Individual samples. Location a) Käppala (MWWTP), Stockholm, Northern Baltic Proper (HELCOM sub-basin 12). Location b) Gällnö (archipelago), Stockholm, Northern Baltic Proper (HELCOM sub-basin 12).Source: Original data.
0
20
40
60
80
100
120
140
160
180
200µg/kg ww
Biso
prol
ol a)
Brom
ocrip
tine a
)Ca
rbam
azep
ine b
)Ci
lazap
ril a)
Clon
azep
am b
)Cy
proh
epta
dine
a)Di
phen
hydr
amin
e b)
Dipy
ridam
ole b
)Du
loxe
tine a
)Ep
rosa
rtan
a)Er
ythr
omyc
in b
)Et
onog
estre
l a)
Felo
dipi
ne b
)Flu
tam
ide b
)Irb
esar
tan
a)Ke
toco
nazo
l a)
Lope
ram
ide b
)M
apro
tilin
e b)
Mian
serin
b)
Mico
nazo
l a)
Mirt
azap
ine a
)No
r�ox
acin
a)Ra
nitid
ine b
)Ra
nitid
ine a
)Se
rtrali
ne b
)Tr
amad
ol b
)Tr
amad
ol a)
Trih
exyp
heni
dyl b
)Tr
ihex
yphe
nidy
l a)
Zolp
idem
b)
Zolp
idem
a)
Diclo
fena
c a)
Diclo
fena
c a)
Diclo
fena
c a)
Diclo
fena
c a)
Diclo
fena
c a)
Ibup
rofe
n a)
Oxaz
epam
a)
Oxaz
epam
a)
Oxaz
epam
b)
Oxaz
epam
a)
Oxaz
epam
a)
Oxaz
epam
b)
Oxaz
epam
b)
Oxaz
epam
a)
Sertr
alin
e a)0
1
2
3
4
5
6µg/kg ww

45
7. CONCENTRATIONS AND EFFECTS OF PHARMACEUTICALS IN THE MARINE ENVIRONMENT
Figure 30. Detected pharmaceuticals in flounder (Platichthys flesus)All samples are from the location Askeröfjorden, north of Gothenburg, Kattegat (north of HELCOM sub-basin 1).Source: Original data.
Figure 31. Detected pharmaceuticals in eel (Anguilla anguilla)All samples are from the location Askeröfjorden, north of Gothenburg, Kattegat (north of HELCOM sub-basin 1).Source: Original data.
0
10
20
30
40
50
60
70
80
90µg/kg ww
Alfu
zosin
Chlo
rpro
maz
ine
Clot
rimaz
ole
Code
ine
Dicy
clove
rine
Felo
dipi
ne
Halo
perid
ol
Keto
cona
zol
Map
rotil
ine
Paro
xetin
e
Sulfa
met
hoxa
zole
Tam
oxife
n
Trih
exyp
heni
dyl
µg/kg ww
Alfu
zosin
Alpr
azol
am
Ator
vast
atin
Clem
astin
e
Dicy
clove
rine
Dihy
droe
rgot
amin
e
Done
pezil
Fluox
etin
e
Irbes
arta
n
Mem
antin
e
Orph
enad
rine
Oxaz
epam
Pizo
tifen
Venl
afax
ine
Zolp
idem
0
5
10
15
20
25
30
35
40
45
50

46
EMERGING POLLUTANTS IN WATER SERIES 1 Pharmaceuticals in the aquatic environment of the Baltic Sea region
7.3 Effects of pharmaceuticals in the Baltic Sea marine environment
An overview of the results of different studies concerning the effects of pharmaceutical substances on Baltic Sea species is presented in Annex 5. Studies where the combined effects of pharmaceuticals and other contaminants were studied have been excluded (e.g., Turja et al 2015) since it was not within the scope of this report to assess such results.
In summary, several publications reported on effects of the β-blocker propranolol as well as the anti-inflammatory drugs diclofenac and ibuprofen on the littoral organisms blue mussel (Mytilus edulis trossulus), macroalgae (Fucus vesiculosus or Ceramium tenuicorne) and amphipod crustacean (Gammarus spp) (Ericson et al. 2010, Eriksson Wiklund et al 2011, Oskarsson et al 2012, Oskarsson et al 2014, Kumblad et al 2015). One study reported effects of the antidepressant drug citalopram on fish behavior (Gasterosteus aculeatus) (Kellner et al 2015). Propranolol showed effects on all the tested littoral organisms, of which the macroalgae Fucus vesiculosus was the most sensitive species (Kumblad et al 2015). Ibuprofen and diclofenac only showed effects on blue mussels. In a microcosm study the blue mussel was the most sensitive species.
47
8. CONCLUSIONS AND RECOMMENDATIONS
8. Conclusions and recommendations
8.1 Overview of main results and data compilationPharmaceuticals are released into the environment during various stages of the product lifecycle (manufacturing, consumption and waste disposal).
In the Baltic Sea region, the main sources of pharmaceuticals in the freshwater and marine environment are believed to be the excretion of bioactive substances consumed by humans and animals (via urine and faeces) as well as the incorrect disposal of unused medical products. The main pathway of pharmaceuticals into the aquatic environment, according to the collected data, is via discharges of wastewater from MWWTPs.
The top 20 pharmaceuticals found in highest concentrations in MWWTP influents, effluents, sewage sludge and river water belong to various therapeutic groups (see Chapter 6.2). For example, the diuretic furosemide had the highest average concentration measured in MWWTP effluents at 22.3 µg/l, and the highest single concentration measurement was for the anti-inflammatory drug paracetamol at 360 µg/l (measured in Denmark). No measurements were reported of furosemide in the Baltic Sea environment.
The overall removal rate of pharmaceuticals in MWWTPs was low for most of the compounds. Only nine out of 118 assessed pharmaceuticals were efficiently removed (> 95%) from wastewater during wastewater treatment processes. Nearly half of the compounds were removed with an efficiency lower than 50% in MWWTPs.
According to the repor ted data on concentrations of pharmaceuticals in the Baltic Sea environment, the substances of greatest concern belong to the therapeutic groups of anti-inflammatory and analgesics, cardiovascular and central nervous system agents and antimicrobials. This conclusion is based on the detection frequency and does not take into account potential impacts of the substances on the ecosystem (see Chapter 8.2). The most frequently detected anti-inflammatory and analgesics pharmaceuticals were diclofenac, ibuprofen and paracetamol, which were detected in almost all compartments of the Baltic Sea environment. Sulfamethoxazole was the most frequently detected antimicrobial substance and was detected in all matrices. Cardiovascular agents were detected mainly in seawater samples. The most confident data were obtained for metoprolol, bisoprolol and sotalol. Bisoprolol was also detected in a biota sample. The central nervous system agents carbamazepine and primidone were frequently detected in seawater, where the latter was detected in all samples where it was measured. Carbamazepine was detected also in biota. Pharmaceuticals, which belong to the other therapeutic groups such as silicic and clofibric acids, were also detected in many samples. Hormones were only found in a few samples, possibly explained by the use of analytical methods with high detection limits.
The data on concentrations of pharmaceutically active compounds in marine biota indicate that the largest number of different substances and the highest concentrations are found in blue mussels.

48
EMERGING POLLUTANTS IN WATER SERIES 1 Pharmaceuticals in the aquatic environment of the Baltic Sea region
The report provides the most comprehensive compilation of existing data on pharmaceuticals in the freshwater and marine environment at the national and regional levels in the Baltic Sea region. However, there are data gaps (see Chapter 3.3) that need to be addressed in order to carry out a more complete assessment of the extent of contamination by pharmaceuticals.
More data from the whole region are needed on:
• sales and consumption of pharmaceuticals, and household pharmaceutical wastes management
• concentrations of pharmaceuticals in wastewater, notably in MWWTP influents and effluents, and in sewage sludge
• concentrations of pharmaceuticals in freshwater such as surface waters (river water) and groundwater
• the occurrence and fate of metabolites in freshwater, wastewater, and sea water
• sales and consumption of veterinary pharmaceuticals, and their sources, pathways and loading to soils, surface and groundwater systems and the aquatic environment (including agriculture and aquaculture)
• emissions of pharmaceuticals to the environment via other pathways such as solid waste disposal
• analytical methods used for measuring concentrations and their sensitivity
The results of monitoring of pharmaceuticals’ concentrations in the Baltic Sea marine environment likely underestimate occurrence and impacts since the analytical methods used in some cases are not sensitive enough and in some cases exceed the levels at which harmful biological effects take place.
8.2 Recommendations for improving scientific knowledge and data
Although the reported data provide an overview of the magnitude of inputs of several pharmaceutical substances to the Baltic Sea, as well as their concentrations in the freshwater systems and marine environment, there is a need to improve scientific knowledge and data in order to get a more complete and accurate assessment of the extent of contamination by pharmaceuticals.
Data are essential to address specific sources and pathways of pharmaceuticals’ emissions into freshwater systems and the environment to help identify priority measures.
More monitoring data on pharmaceuticals in river water and wastewater (e.g., MWWTPs influents and effluents) are needed from every Baltic Sea country. Especially data from Poland are needed since it has the largest portion of the catchment area and population of the Baltic Sea region.
There is a need for data for many highly-consumed pharmaceuticals, on which monitoring data are missing currently, and especially for the following substances:
• Allopurinol
• Gabapentin
• Levetiracetam
• Mesalazin
• Valsartan
R e s e a rc h a n d d at a a re n e e d e d o n concentrations of pharmaceuticals in sewage sludge and soil. The fate of pharmaceuticals in sewage sludge needs further research in order to assess the risk of emerging of pharmaceuticals in soils and their possible runoff to surface waters and infiltration to groundwater.
Monitoring data and research are needed on the occurrence and fate of metabolites in freshwater systems and marine environment.

49
8. CONCLUSIONS AND RECOMMENDATIONS
It was noted in this study that the metabolites of ibuprofen often occurred at higher concentrations than the parent compound. The role of metabolites should be studied in more detail, especially for easily biodegradable compounds.
D a t a o n s a l e s a n d c o n s u m p t i o n pharmaceuticals are needed from all Baltic Sea countries. At present, data are missing from Latvia, Lithuania, Poland and Russia. Detailed sales and consumption data are needed in order to fully estimate the priority pharmaceuticals in the region as well as to target monitoring efforts.
Specific attention needs to be put on filling the data gap on veterinary pharmaceuticals, including data on their sales, consumption, sources, pathways and loading to soils, groundwater and the aquatic environment. The ver y scarce data on sales and consumption of pharmaceutical substances in veterinary use indicate that the annual turnover is comparable to the amount used in human medicine. Taking into account that manure is applied on the agricultural lands as fertilizer, agriculture could be a significant pathway of medical compounds to the environment.
A n a l y t i c a l m e t h o d s o f a h i g h e r resolution should be used for measuring concentrations of pharmaceuticals in the freshwater and marine environment. The analytical methods currently used by many laboratories are at times not sensitive enough to detect substances at the level of the proposed environmental quality standards or the threshold values (see Chapter 7 and Annex 4).
More sensitive analytical methods should therefore be used to measure substances at lower concentrations.
M o r e s t u d i e s o n t h e i m p a c t s o f pharmaceuticals on the freshwater and marine ecosystems should be carried out. There is limited knowledge of the effects of pharmaceuticals in the environment, especially considering that aquatic organisms are continually exposed to many different pharmaceutical substances, and of their potential combined effects. For many pharmaceutical substances, there is a lack of scientific evidence and information concerning their toxicity (i.e., base data to derive reliable threshold, or PNEC values), persistence and bioaccumulation in the environment, making it difficult to assess the potential impacts and consequences of these substances in the environment. Application of a concept of using known human therapeutic doses to assess effect on biota could be considered.
Concentrations of pharmaceuticals in freshwater and marine biota and their occurrence in the food chain should be studied through more interdisciplinary research. In a recent non-target screening conducted in Norway, a relatively large number of pharmaceuticals were found in sea birds (Miljødirektoratet, 2013). This suggests that pharmaceuticals may be transferred in aquatic food chains up to seabirds. These results, together with the results presented on pharmaceuticals in blue mussels in the Baltic Sea (see Chapter 7), suggest that it should be of interest to include sea birds, such as Common Eider, that primarily feed on blue mussels, in future monitoring studies for pharmaceuticals.
8.3 Potential measures for further consideration to reduce inputs of pharmaceuticals into the environment
With pharmaceuticals being emerging pollutants that need to be addressed, it is necessary to take measures to reduce the inputs of these substances to the environment.
Also, further information on the effects and risks of pharmaceuticals in the environment is needed to support the prioritization of measures for reducing inputs of specific substances.
50
EMERGING POLLUTANTS IN WATER SERIES 1 Pharmaceuticals in the aquatic environment of the Baltic Sea region
M e a s u r e s t o r e d u ce t h e i n p u t s o f pharmaceuticals should address all stages of the product lifecycle from manufacturing to consumption to waste management. Measures can include both technical and policy solutions, as well as educational and awareness raising initiatives.
Technical solutions to remove pharmaceuticals from wastewater can be applied in MWWTPs, mainly as tertiary treatment of wastewater. At present, there are a few MWWTPs in the Baltic Sea catchment area that apply advanced techniques to enhance the removal of pharmaceuticals from wastewater. Two MWWTPs in Sweden are planning to apply ozonation to enhance wastewater treatment. O ther ter t iar y treatment methods that could be used to enhance the removal of pharmaceuticals include oxidative processes (e.g., advanced oxidation, photocatalysis, Fenton-based and pulsed corona discharge), adsorptive methods (e.g., activated carbon) and membrane filtration (e.g., nanofiltration, reverse osmosis, etc.). It should be stressed that oxidative treatment methods produce byproducts, especially of those pharmaceuticals that are not easily oxidized; thus, removal of these byproducts is necessary before discharging the treated wastewater to the environment. Adsorptive methods transfer the pharmaceuticals from water to the solid phase (e.g., sludge), therefore the sewage sludge also needs to be treated and properly disposed. The improved tertiary treatment of wastewater does not affect the quality of sludge. In membrane filtration, pharmaceuticals remain in the retentate (or the concentrate), which needs to be further treated or properly disposed.
Oxidation, adsorption and filtration methods could also be used for the pre-treatment of raw wastewater from hospital and manufacturing facilities prior to discharging it to the sewer. However, the quality of water from these facilities differs from the municipal wastewater, therefore pre-treatment of these waters is most probably needed before applying further treatment methods. Oxidative treatments may be suitable since
the byproducts that are formed during these processes may be effectively removed during the biological treatment process at MWWTPs.
Policy and educational solutions for reducing inputs of pharmaceuticals to wastewater and further to the environment need to include awareness raising of doctors and consumers concerning possible harmful effects of pharmaceuticals in the environment.
Take -back of unused medicines by pharmacies should be applied or developed in countries where such systems are not yet in place or are inefficient, in order to reduce the disposal of unused medicines via solid waste or sewers. Awareness raising and educational campaigns on human health and environmental impacts of pharmaceuticals in the environment and on the correct disposal of household pharmaceutical wastes should be carried out for the public, as well as for doctors and pharmacists.
A certification system, indicating degree of potential environmental impac ts of pharmaceuticals, can help doctors, pharmacists and consumers to consider environmental aspects when choosing a medication. In Sweden, for example, the FASS database (www.fass.se) includes environmental data about pharmaceuticals, and information booklets are distributed to doctors to encourage the consideration of environmental aspects when prescribing medication. This system could be applied also in other Baltic Sea countries.
Promotion of sustainable consumption of pharmaceuticals also reduces inputs of unused medicine to wastewater. Measures to reduce the disposal of unused medicines to the environment could include educating the public on proper use of medicines and promoting medication packaging and dispensing systems suitable to prescribed quantities. Furthermore, when doctors prescribe a new medication, a small-sized trial package could be used to reduce household pharmaceutical waste generation if the medication is not suitable for the patient.

51
9. REFERENCES
9. ReferencesAgra‑Europe. 2014. Antibiotikaabgabenmengenerfassung 2013. Agra-Europe 40/14,
29 September 2014. (In German).
Andersson, H., Magnér, J. and Wallberg, P. 2013. Self-declarations of environmental classification in www.fass.se. IVL report, B2124.
BIO Intelligence Service. 2013. Study on the environmental risks of medicinal products. Final Report prepared for Executive Agency for Health and Consumers. Available at: http://ec.europa.eu/health/files/environment/study _environment.pdf.
Brodin, T., Fick, J., Jonsson, M. and Klaminder, J. 2013. Dilute concentrations of a psychiatric drug alter behaviour of fish from natural populations. Science, Vol. 339, pp. 814-815.
BVL. 2014. Dritte Datenerhebung zur Antibioticaabgabe in der Tiermedizin. Bundesamt für Verbraucherschutz und Lebensmittelsicherheit. Available at: www.bvl.bund. de. (In German).
EEA. 2010. Pharmaceuticals in the environment. European Environmental Agency EEA Technical report 1/2010. Available at: http://www.eea.europa.eu/publications/ pharmaceuticals-in-the-environment-result-of-an-eea-workshop.
Ericson, H., Thorsén, G. and Kumblad, L. 2010. Physiological effects of diclofenac, ibuprofen and propranolol on Baltic Sea blue mussels. Aquatic Toxicology, Vol. 99, pp. 223-231.
Eriksson Wiklund, A.‑K., Oskarsson, H., Thorsén, G. and Kumblad, L. 2011. Behavioural and physiological responses to pharmaceutical exposure in macroalgae and grazers from a Baltic Sea littoral community. Aquatic Biology, Vol. 14, pp. 29-39.
European Commission. 2004. Directive 2004/27/EC of the European Parliament and of the Council of 31 March 2004 amending Directive 2001/83/EC on the Community code relating to medicinal products for human use. OJ L Vol. 136, pp. 34-57.
European Commission. 2008. Directive 2008/105/EC of the European Parliament and of the Council of 16 December 2008 on environmental quality standards in the field of water policy, amending and subsequently repealing Council Directives 82/176/ EEC, 83/513/EEC, 84/156/EEC, 84/491/EEC, 86/280/EEC and amending Directive 2000/60/EC of the European Parliament and of the Council. OJ L, Vol. 348, pp. 84-97.
European Commission. 2008. Directive 2008/56/EC of the European Parliament and of the Council of 17 June 2008 establishing a framework for community action in the field of marine environmental policy (Marine Strategy Framework Directive). OJ L, Vol. 164, pp. 19–40.
European Commission. 2013. Directive 2013/39/EU of the European Parliament and of the Council of 12 August 2013 amending Directives 2000/60/EC and 2008/105/EC as regards priority substances in the field of water policy. OJ L, Vol. 226, pp. 1–17.
European Commission. 2015. Commission Implementing Decision (EU) 2015/495 of 20 March 2015 establishing a watch list of substances for Union-wide monitoring in the field of water policy pursuant to Directive 2008/105/EC of the European Parliament and of the Council. OJ L, Vol. 78, pp. 40–42.

52
EMERGING POLLUTANTS IN WATER SERIES 1 Pharmaceuticals in the aquatic environment of the Baltic Sea region
Hallgren, P. and Wallberg, P. 2015. Background report on pharmaceutical concentrations and effects in the Baltic Sea. Policy Area Hazards of the EU Strategy for the Baltic Sea Region.
HVMFS. 2013. Havsoch vattenmyndighetens föreskrifter om klassificering och miljökvalitetsnormer avseende ytvatten. [Swedish Agency for Marine and Water Management regulations on classification and quality standards regarding surface water]. HVMFS 2013: 19. (In Swedish).
HELCOM. 2007. HELCOM Baltic Sea Action Plan. Adopted 15 November 2007 in Krakow, Poland.
HELCOM. 2010. Moscow Ministerial Declaration on the implementation of the HELCOM Baltic Sea Action Plan. Adopted 20 May 2010 in Moscow, Russia.
HELCOM. 2013a. HELCOM Copenhagen Ministerial Declaration: Taking Further Action to Implement the Baltic Sea Action Plan Reaching Good Environmental Status for a healthy Baltic Sea. Adopted on 3 October 2013 in Copenhagen, Denmark.
HELCOM. 2013b. HELCOM monitoring and assessment strategy. Available at: http://www. helcom.fi/action-areas/monitoring-and-assessment/monitoring-and-assessmentstrategy.
Kellner, M., Porseryd, T., Porsch‑Hallström, I. and Hansen, S. 2015. Environmentally relevant concentrations of citalopram partially inhibit feeding in the three-spine stickleback (Gasterosteus aculeatus). Aquatic Toxicology, Vol. 158, pp. 165-170.
Kidd, K. A., Blanchfield, P. J., Mills, K. H., Palace, V. P., Evand, R. E., Lazorchak, J. M. and Flick, R.W. 2007. Collapse of a fish population after exposure to a synthetic estrogen. PNAS, Vol. 104, pp. 8897-8901.
Kumblad, L., Oskarsson, H., Palmer, C. and Eriksson Wiklund, A.‑K. 2015. Response and recovery of Baltic Sea blue mussels from exposure to pharmaceuticals. Marin. Ecol. Prog. Ser., Vol. 526, pp. 89–100.
Miljødirektoratet. 2013. Non-target screening – A powerful tool for selecting environmental pollutants. Rapport M-27.
MPA. 2015. Miljöindikatorer inom ramen för nationella läkemedelsstrategin (NLS). [Environmental indicators under the national drugs strategy (NLS)] Report of CBL’s Office, Läkemedelsverket [MPA] 2015-09-07. (In Swedish).
Oskarsson, H., Eriksson Wiklund, A.‑K., Lindh, K. and Kumblad, L. 2012. Effect studies of human pharmaceuticals on Fucus vesiculosus and Gammarus spp. Marine Environmental Research, Vol. 74, pp. 1-8.
Oskarsson, H., Eriksson Wiklund, A.‑K., Thorsén, G., Danielsson, G. and Kumblad, L. 2014. Community Interactions Modify the Effects of Pharmaceutical Exposure: A Microcosm Study on Responses to Propranolol in Baltic Sea Coastal Organisms. PLoS ONE, Vol. 9, No. 4, e93774. doi:10.1371/journal.pone.0093774.
Ravimiamet. 2015. Statistics on veterinary medicines in Estonia 11.03.2015. State Agency of medicines. Available at: http://www.ravimiamet.ee/en/statistics-veterinary- medicines.
Tema Nord. 2012. PPCP monitoring in the Nordic Countries – Status report. doi:10.6027/09086692.

53
9. REFERENCES
Turja, R., Lehtonen, K. K., Meierjohann, A., Brozinski, J. M., Vahtera, E., Soirinsuo, A., Sokolov, A., Snoeijs, P., Budzinski, H., Devier, M. H,, Peluhet, L., Pääkkönen, J.P., Viitasalo, M. and Kronberg, L. 2015. The mussel caging approach in assessing biological effects of wastewater treatment plant discharges in the Gulf of Finland (Baltic Sea). Mar. Pollut. Bull., Vol. 97, pp.135-49. doi: 10.1016/j.marpolbul.2015.06.024.
UNESCO. 2016. Emerging Pollutants in Water and Wastewater. UNESCO Project on “Emerging Pollutants in Wastewater Reuse in Developing Countries”, UNESCO-IHP International Initiative on Water Quality (IIWQ). http://en.unesco.org/emergingpollutants.
Vieno, N. 2015. Status report on pharmaceuticals in the Baltic Sea background information on consumption, sources and pathways of pharmaceutical substances into the Baltic Sea.
Weber, F.‑A., aus der Beek, T., Bergmann, A., Carius, A., Grüttner, G., Hickmann, S., Ebert, I., Hein, A., Küster, A., Rose, J., Koch‑Jugl, J., and Stolzenberg, H.‑C. 2014. Pharmaceuticals in the environment – the global perspective Occurrence, effects, and potential cooperative action under SAICM. German Federal Environmental Agency (UBA). Available at: https://www.umweltbundesamt.de/en/database-pharmaceuticals-in-the-environment-0.
54
EMERGING POLLUTANTS IN WATER SERIES 1 Pharmaceuticals in the aquatic environment of the Baltic Sea region
Annex 1. Description of data collection and analytical methods
Annex 1.1. Data collection
Data collection was carried out using a stepwise approach and coordinated via relevant HELCOM working groups.
First phase – A review of availability and sources of data was carried out. The aim was to also identify sources of relevant data with restricted access (e.g. commercial data, data which require anonymizing etc.). No data collection was carried out during this phase. An overview of the following information was gathered via the HELCOM Working Group on the State of the Environment and Nature Conservation (State and Conservation) and the Working Group on Reduction of Pressures from the Baltic Sea Catchment Area (Pressure):
• National sources of data on concentrations of pharmaceutical substances in all compartments of the environment (e.g. programme, project, reference to data source, etc.):
- s t a te a n d l o c a l e nv i ro n m e n t a l monitoring and screening programmes
- regulated monitoring, e.g. sewage treatment plants, industry
- projects/screening studies
- scientific studies
- commissioned studies
• National sources of data on sales and consumption/use of pharmaceuticals by user group (e.g. human use, agriculture, veterinary):
- authorities (environmental, health care, veterinary, agricultural etc.)
- professional associations
- projects/studies
• National sources of data on pathways of pharmaceuticals into the environment, such as concentrations in wastewater, sludge, manure, etc.:
- authorities
- professional associations
- projects/studies
• Information on accessibility to existing data, e.g.:
- open access data (e.g. database)
- reports
- restricted data and information
- Contact persons [likely a number of contact persons in different authorities/institutions]
Second phase – A template for data collection (a questionnaire), together with reporting guidelines, was prepared based on the results from the first phase. Available data were collected according to the following categories:1. Environmental concentrations of pharma
ceuticals in the coastal and open water areas of the Baltic Sea (e.g. water, biota, sediment)
2. Effects of pharmaceuticals on Baltic Sea biota
3. Sources and pathways of pharmaceuticals to the environment (concentration of these substances in wastewater, sludge, manure, etc.), as well as information on production, sales, consumption and waste management of pharmaceuticals.

55
ANNEXES
Further, appropriate metadata were collected, such as geographical coordinates for sampling points, analytical methods, detection limits, data quality, etc.
The data submitted via national reporting through the HELCOM working groups were compiled and analyzed by experts (Vieno 2015, Hallgren and Wallberg 2015; listed in the main report reference list).
Annex 1.2. Overview of reported data
Measurements in MWWTP influents, effluents, sludge and river water
Table A1.1 Total number of data on pharmaceuticals detection in wastewater, sludge and river water in the Baltic Sea region from 2003 to 2014Note: Due to differences in limits of detection (LOD) and the nature of reported data (which integrates both individual measurements and averaged values), differences in detection frequencies between countries cannot always be interpreted as clear indicators of the level of pharmaceutical contamination.
Source: Original data.
Number of detections/number of reported samples
References Total MWWTP influent
MWWTP effluent Sludge* River water
Denmark [23] – [25] 2,907/5,698 (51%) 1,297/1,861 1,382/2,901 124/240 104/696
Estonia [26] 173/540 (32%) 58/135 52/135 63/270
Finland [1] – [9] 1,031/1,613 (64%) 275/301 247/306 377/804 132/202
Germany [21, 22] 579/1,199 (48%) 972/1,253 6,126/31,943
Russia [10] 3,030/5,656 (54%) 374/603 205/596
Sweden [11] – [20] 14,818/47,819 (31%) 882/1,729 1,795/3,266 307/534 46/127
Total 7,098/33,196 (21%) 2,886/4,629 4,653/8,457 808/1,575 6,471/33,158
*raw, digested and composted sludge
References
[1] Lindholm-Lehto, P., Knuutinen, J., Herve, S. and Ahkola, H. 2015. Lääkeaineet jäteveden puhdistamolla ja vesistössä. Ympäristö ja terveys 3/2015: 38 - 43.
[2] Munne, P. and Äystö, L. 2015. Eräiden lääkeaineiden ja triklosaanin esiintyminen puhdistamolietteissä sekä käyttäytyminen suomalaisilla maatalousmailla. Ympäristö ja terveys 4/2015: 34 - 39.
[3] Äystö, L., Mehtonen, J., and Mannio, J. 2015. Lääkeaineet Etelä-Suomen pintavesissä ja puhdistetussa jätevedessä. Ympäristö ja terveys 4/2015: 40 - 46.
[4] Vieno N. 2007. Occurrence of Pharmaceuticals in Finnish Sewage Treatment Plants, Surface Waters, and Their Elimination in Drinking Water Treatment Processes. Tampere University of Technology, Publication 666.
[5] Vieno N. 2014. Hazardous substances at wastewater treatment plants - project report. Vesilaitosyhdistyksen monistesarja nro 34.
[6] Vieno N. 2015. Haitta-aineet puhdistamoja hajalietteissä. Vantaanjoen ja Helsingin seudun vesiensuojeluyhdistys ry, julkaisu 73/2015.
56
EMERGING POLLUTANTS IN WATER SERIES 1 Pharmaceuticals in the aquatic environment of the Baltic Sea region
[7] Vieno N. M., Tuhkanen, T., and Kronberg, L. 2006. Analysis of neutral and basic pharmaceuticals in sewage treatment plants and in recipient rivers using solid phase extraction and liquid chromatography-tandem mass spectrometry detection. Journal of Chromatography A, 1134 (2006): 101 - 111.
[8] Vieno, N.M., Härkki, H., Tuhkanen, T., and Kronberg, L. 2007. Occurence of Pharmaceuticals in River Water and Their Elimination in a Pilot-scale Drinking Water Treatment Plant. Environmental Science & Technology 41(14): 5077 - 5084.
[9] Perkola, N., Juntunen, J., Tuominen, S., Nysten, T., Rosendahl, K., Huttula, T., Pitkänen, T., Kauppinen, A., Kusnetsov, J., Hokajärvi, A.-M., Meriläinen, P., Miettinen, I. T., and Happonen, M. 2015. Kuluttajakemikaalit ja mikrobit Kokemäenjoen vesistössä. Ympäristö ja terveys 3/2015: 50 - 55.
[10] HELCOM. 2014. BASE project 2012-2014: Pilot activity to identify sources and flow patterns of pharmaceuticals in St. Petersburg to the Baltic Sea.
[11] Haglund, P. and Olofsson, U. 2007. Miljöövervakning av slam. Redovisning av resultat från 2004, 2005 och 2006 års provtagningar. Kemiska institutionen vid Umeå universitet på uppdrag av Naturvårdsverket.
[12] Haglund, P. and Olofsson, U. 2008. Kemiska institutionen vid Umeå universitet på uppdrag av Naturvårdsverket. Miljöövervakning av slam. Redovisning av resultat från 2007 års provtagning.
[13] Haglund, P. and Olofsson, U. 2010. Miljöövervakning av slam. Redovisning av resultat från 2008 års provtagning (inklusive en sammanfattning av åren 2004-2008). Kemiska institutionen vid Umeå universitet på uppdrag av Naturvårdsverket.
[14] Haglund, P. and Olofsson, U. 2011a. Miljöövervakning av slam. Redovisning av resultat från 2009 års provtagning (inklusive en sammanfattning av åren 2004-2009). Kemiska institutionen vid Umeå universitet på uppdrag av Naturvårdsverket.
[15] Haglund, P. and Olofsson, U. 2011b. Miljöövervakning av utgående vatten & slam från svenska avloppsreningsverk. Resultat från år 2010 och en sammanfattning av slamresultaten för åren 2004-2010. Kemiska institutionen vid Umeå universitet på uppdrag av Naturvårdsverket.
[16] Haglund, P. and Olofsson, U. 2013. Miljöövervakning av utgående vatten & slam från svenska avloppsreningsverk. Resultat från år 2011 och en sammanfattning av slamresultaten för åren 2004-2011. Kemiska institutionen vid Umeå universitet på uppdrag av Naturvårdsverket.
[17] Haglund, P. and Olofsson, U. 2014. Miljöövervakning av utgående vatten & slam från svenska avloppsreningsverk. Resultat från år 2012 och 2013 och en sammanfattning av slamresultaten för åren 2004-2013. Kemiska institutionen vid Umeå universitet på uppdrag av Naturvårdsverket.
[18] Johansson, M., Lindberg, R., Wennberg, P. and Tysklind, M. 2003. Redovisning från nationell miljöövervakning 2003. Screening av antibiotika i avloppsvatten, slam och fisk under 2002/2003. Miljökemi, Umeå Universitet, på uppdrag av Naturvårdsverket.
[19] Löfgren, H. and Gottby, L. 2012. Miljögifter i Gävleborg, resultat från verifieringar 2009 – 2011. Rapport 2012:4, Länsstyrelsen Gävleborg.
[20] IVL. 2015. Miljöövervakningsdata. Screening av miljögifter. Naturvårdsverket. Database in screening of environmental pollutants. Available at: http://dvss.ivl.se/ DataSelect.aspx.
[21] Data provided by the State Agency of Environment, Nature Protection and Geology Mecklenburg-Vorpommern.
[22] Data provided by the State Agency of Agriculture, Environment and Rural Areas Schleswig-Holstein.
[23] Naturstyrelsen. 2015. Punktkilder 2014. Miljøog Fødevareministeriet, Naturstyrelsen.
[24] Naturstyrelsen. 2015. NOVANA-screeningsundersøgelse for humane lægemidler i vandmiljøet. Miljøministeriet, Naturstyrelsen.
[25] Mogensen, B., Bossi, R., Kjær, J., Juhler, R. & Boutrup, S. 2007. Lægemidler og triclosan i punktkilder og vandmiljøet. Faglig rapport fra DMU nr. 638, 2007.
[26] Pharmaceuticals screening (2014-2015), Ministry of the Environment, Estonia.

57
ANNEXES
Table A1.2 Number of pharmaceuticals detections in MWWTP influent samples Source: Original data.
Number of detections/Total number of samplesTherapeutic group Denmark Estonia Finland Germany Russia Sweden TotalAnti-inflammatory and analgesics 520/602 18/27 81/82 0/0 66/77 218/364 903/1,152
Antimicrobial 325/489 20/39 53/63 0/0 167/309 136/233 701/1,133
Cardiovascular agents 197/223 17/30 84/84 0/0 57/62 126/169 481/568Central nervous system agents 33/36 3/12 34/35 0/0 31/31 292/698 393/812
Chemotherapeutic agents and X-ray contrast media
9/18
Hormones and hormone antagonists 183/378 0/27 10/24 28/31 54/176 275/636
Metabolic agents and gastrointestinal agents 30/115 13/13 25/93 56/89 124/310
Total 1,297/1,861 58/135 275/301 0/0 374/603 882/1,729 2,886/4,629
Table A1.3 Number of pharmaceuticals detections in MWWTP effluent samples Source: Original data.
Number of detections/Total number of samples
Therapeutic group Denmark Estonia Finland Germany Russia Sweden TotalAnti-inflammatory and analgesics 477/876 14/27 72/84 234/290 48/77 667/962 1,512/2,316
Antimicrobial 442/693 19/39 43/63 108/132 93/309 156/364 861/1,600
Cardiovascular agents 250/291 16/30 84/84 166/290 30/62 183/278 729/1,035Central nervous system agents 3/12 35/36 195/213 6/31 459/1,045 698/1,337
Chemotherapeutic agents and X-ray contrast media
269/328 269/328
Hormones and hormone antagonists 155/585 0/27 1/26 3/24 158/469 317/1,131 275/636
Metabolic agents and gastrointestinal agents 58/183 12/13 25/93 82/148 177/437 56/89 124/310
Total 1,382/2,901 52/135 247/306 972/1,253 205/596 1,795/3,266 4,653/8,457
Table A1.4 Number of pharmaceuticals detections in untreated sludge samplesSource: Original data.
Number of detections/Total number of samples
Therapeutic group Denmark Finland Sweden TotalAnti-inflammatory and analgesics 25/80 29/30 43/44 97/154
Antimicrobial 34/64 132/210 95/212 261/486
Cardiovascular agents 32/48 46/78 78/126
Central nervous system agents 32/32 31/36 63/68
Chemotherapeutic agents and X-ray contrast media 1/16 0/30 1/46
Hormones and hormone antagonists 1/12 11/53 12/65
Other 0/6 0/6
Total 124/240 239/402 149/309 512/921

58
EMERGING POLLUTANTS IN WATER SERIES 1 Pharmaceuticals in the aquatic environment of the Baltic Sea region
Table A1.5 Number of pharmaceuticals detections in digested sludge samples Source: Original data.
Number of detections/Total number of samples
Therapeutic group Finland Sweden TotalAnti-inflammatory and analgesics 7/20 7/20
Antimicrobial 36/56 158/225 194/281
Cardiovascular agents 16/52 16/52
Central nervous system agents 19/24 19/24
Chemotherapeutic agents and X-ray contrast media 0/20 0/20
Hormones and hormone antagonists 6/40 6/40
Other 0/16 0/16
Total 84/232 158/225 242/457
Table A1.6 Number of pharmaceuticals detections in composted sludge samplesSource: Original data.
Number of detections/Total number of samples
Therapeutic group Finland/TotalAnti-inflammatory and analgesics 6/15
Antimicrobial 19/42
Cardiovascular agents 7/39
Central nervous system agents 14/18
Chemotherapeutic agents and X-ray contrast media 0/15
Hormones and hormone antagonists 8/30
Other 0/12
Total 54/171
Table A1.7 Number of pharmaceuticals detections in river water samples Source: Original data.
Number of detections/Total number of samples
Therapeutic group Denmark Estonia Finland Germany Sweden TotalAnti-inflammatory and analgesics 40/104 17/60 55/75 992/6,875 9/19 1,113/7,133
Antimicrobial 26/364 26/78 7/41 413/7,948 9/17 481/8,448
Cardiovascular agents 26/108 16/66 57/67 2,262/10,352 11/29 2,372/10,622
Central nervous system agents 12/16 4/24 12/15 1,303/2,254 8/34 1,339/2,343Chemotherapeutic agents and X-ray contrast media 0/8 1,156/3,306 1,156/3,314
Hormones and hormone antagonists 0/16 0/42 1/2 0/1,208 7/15 8/1,283
Metabolic agents and gastrointestinal agents 2/13 2/13
Other 0/2 0/0 0/2
Total 1,382/2,901 52/135 247/306 972/1,253 1,795/3,266 4,653/8,457

59
ANNEXES
Measurements in the marine environment
Table A1.8 Total number of data on pharmaceuticals detection in the marine environment of the Baltic Sea from 2003 to 2014
The number of data posts with detected values is presented together with the total number of data posts. Source: Original data.
Number of detections/number of reported samples
References Total Water Sediment BiotaDenmark [13][23][24] 0/54 (0%) 0/54
Estonia [14] 2/75 (3%) 0/40 2/35
Finland [11] [12] 30/51 (59%) 19/27 11/24
Germany [9][25] 435/3,148 (14%) 435/3,148
Poland [1] [2] [3] [4] [5] [6] [7] [8] 0/18 (0%) 0/18
Sweden [10] [15] [16] [17] [18] [19] [20] 173/1,254 (14%) [21] [22] 78/360 18/55 77/839
Total 640/4,600 (14%) 532/3,647 31/114 77/839
References
[1] Migowska, Caban, Stepnowski, and Kumirska. 2012. Sci. Total Environ. 441, pp. 77–88.
[2] Caban, Czerwicka, Lukaszewicz, Migowska, Stepnowski, Kwiatkowski, et al. 2013. J.Chromatogr. A. 1301, pp. 215–24.
[3] Borecka, Bialk-Bielinska, Siedlewicz, Kornowska, Kumirska, Stepnowski, et al. 2013. J. Chromatogr. A. 1304, pp. 138–146.
[4] Kumirska, Migowska, Caban, Plenis, and Stepnowski. 2011. J. Chemom. 25, pp. 636–643.
[5] Nödler, Voutsa, and Licha. 2014. Mar. Pollut. Bull. 85 (1), pp. 50–9.
[6] Beck, Bruhn, Gandrass, and Ruck. 2005. J. Chromatogr. A. 1090, pp. 98–106.
[7] McEneff, G., Barron, L., Kelleher, B., Paull, B., and Quinn, B. 2014. Sci. Total Environ. 476-477, pp. 317–26.
[8] Stachel, U. Ehrhorn, O.-P. Heemken, P. Lepom, H. Reincke, G. Sawal, et al. 2003. Environ. Pollut. 124, pp. 497–507.
[9 BSH Bundesamt für Seeschifffahrt und Hydrographie.
[10] Karlsson, M. and Viktor, T. 2014. Miljöstörande ämnen i fisk från Stockholmsregionen 2013. Report B2214 from the Swedish Environmental Research Institute IVL.
[11] Muziasari, W. I., Managaki, S., Pärnänen, K., Karkman, A., Lyra, C., Tamminen, M., Suzuki, S., and Virta, M. 2014. Sulphonamide and Trimethoprim Resistance Genes Persist in Sediments at Baltic Sea Aquaculture Farms but Are Not Detected in the Surrounding Environment.
[12] Turja R., Lehtonen, K.K., Meierjohann, A., Brozinski, J.-M., Vahtera, E., Soirinsuo, A., Sokolov, A., Snoeijs, P., Budzinski, H., Devier, M.-H., Peluhe,t L., Pääkkönen, J.-P., Viitasalo, M., and Kronberg L. 2015. Marine Pollution Bulletin 97(1-2), pp. 135-49.
[13] Miljøministeriet, Naturstyrelsen. 2015. NOVANA-Screeningsundersøgelse for humane lægemidler i vandmiljøet.
[14] Estonian Environmental Research Centre. 2012. Euroopa Liidu prioriteetsete ainete nimekirja potentsiaalsete uute ainete esinemise uuring Eesti pinnaveekogudes II.
[15] Fick, J., Lindberg, R.H., Kaj, L. and Brorström-Lundén, E. 2011. Results from the Swedish national screening programme 2010. Sub-report 3: Pharmaceuticals. Report B2014 from the Swedish Environmental Research Institute IVL.

60
EMERGING POLLUTANTS IN WATER SERIES 1 Pharmaceuticals in the aquatic environment of the Baltic Sea region
[16] Löfgren, H. and Gottby, L. 2012. Miljögifter i Gävleborg, resultat från verifieringar 2009 – 2011. Rapport 2012:4, Länsstyrelsen Gävleborg.
[17] Johansson, M., Lindberg, R., Wennberg, P. and Tysklind, M. 2003. Redovisning från nationell miljöövervakning 2003. Screening av antibiotika i avloppsvatten, slam och fisk under 2002/2003. Miljökemi, Umeå Universitet, på uppdrag av Naturvårdsverket.
[18] Törneman, N., Hallgren, P. and Bjarke M. 2014. Screening Report 2013. Occurrence of additional WFD priority substances in Sweden. Sweco Environment AB, on assignment from the Swedish Environmental Protection Agency.
[19] Andersson, J., Woldegiorgis, A., Remberger, M., Kaj, L., Ekheden, Y., Dusan, B., Svenson, A., Brorström-Lundén, E., Dye, C. and Schlabach, M. 2006. Results from the Swedish national screening programme 2005. Subreport 1: Antibiotics, anti-inflammatory.
[20] Remberger, M., Wiklund, P., Woldegiorgis, A., Viktor, T., Kaj, L. and Brorström-Lundén, E. 2009. Anti-inflammatory and analgesic drugs in WWTP influent and effluent streams and the occurrence in the aquatic environment. Report B1810 from the Swedish Environmental Research Institute IVL.
[21] Woldegiorgis, A., Green, J., Remberger, M., Kaj, L., Brorström-Lundén, E., Dye, C. and Schlabach, M. 2007. Results from the Swedish screening 2006. Sub-report 4: Pharmaceuticals. Report B1751 from the Swedish Environmental Research Institute IVL.
[22] Johansson, M., Lindberg, R., Wennberg, P. and Tysklind, M. 2003. Redovisning från nationell miljöövervakning 2003. Screening av antibiotika i avloppsvatten, slam och fisk under 2002/2003. Miljökemi, Umeå Universitet.
[23] Naturstyrelsen. 2015. Punktkilder 2014. Miljøog Fødevareministeriet, Natursty-relsen.
[24] Mogensen, B., Bossi, R., Kjær, J., Juhler, R. and Boutrup, S. 2007. Lægemidler og triclosan i punktkilder og vandmiljøet. Faglig rapport fra DMU nr. 638, 2007.
[25] State Agency of Environment, Nature Protection and Geology of Mecklenburg-Vorpommern.

61
ANNEXES
Annex 2. The use of pharmaceuticals
Human consumption
T h e e v a l u a t i o n o f co n s u m p ti o n o f pharmaceuticals is mainly based on data on sold amounts. Data on sales of human pharmaceuticals were received from Finland, Sweden, Estonia, Germany and Russia (only for diclofenac in St. Petersburg area). From Germany, data were received only for those pharmaceuticals that were prescribed at the highest amounts in Mecklenburg-Vorpommern and Schleswig-Holstein (the states within the Baltic Sea catchment area) in 2013 and 2014. German data were provided by GKV-Arzneimittelindex im Wissenschaftlichen Institut der AOK (WIdO) as tons per year. From Estonia, Finland and Sweden, data on pharmaceutical sales were received from the following sources in the form of statistics on the most frequently prescribed pharmaceuticals:
• Sweden: Swedish National Board of Health and Welfare, Statistikdatabas för läkemedel (2014) (www.socialstyrelsen.se/statistik/statistikdatabas/lakemedel)
• Finland: Fimea, Finnish Statistics on Medicines 2014 (http://www.fimea.fi/web/en/about_us/publications)
• Estonia: State Agenc y of medicines, Statistical Yearbook of the State Agency of Medicines 2015.
• Denmark: (http://www.medstat.dk/da)
The available national statistics report sold amounts of pharmaceuticals as DDD/1,000 inhabitants/day where DDD (defined daily
dose) is based on the ATC/DDD (anatomical therapeutic chemical/defined daily dose) classification system developed by the World Health Organization Collaborating Centre for Drug Statistics Methodology. The reported figures indicate how many persons per 1,000 inhabitants may in theory have received the standard daily dose of a pharmaceutical. From the reported values, the annual consumption of a pharmaceutical can be calculated using the following formula:
It was beyond the scope of this repor t to calculate the consumption of all the pharmaceuticals reported in the statistics. Therefore, consumption was calculated only for the most frequently prescribed pharmaceuticals as well as for those that were most often found in the monitoring studies.
Data on the use of pharmaceuticals by therapeutic group are given in Table A2.1 to Table A2.6. If a pharmaceutical was not sold in a country, it is indicated in the tables as “0”. If no data were received or calculated for a pharmaceutical, it is indicated in the tables as an empty cell. All the volumes are given in kilograms per year. The most recent available data (for the year 2014) are given. If 2014 data are not available, then data for the previous year are used.
Consumption (kg/a)
DDD (g) × DDD/1,000 inh/day × Population × 3651,000,000
=

62
EMERGING POLLUTANTS IN WATER SERIES 1 Pharmaceuticals in the aquatic environment of the Baltic Sea region
Table A2.1 Use of anti-inflammatory and analgesics in Baltic Sea countries (2014, kg/year) Source: Original data.
Compound Finland Estonia Germany
(Mecklenburg-Vorpommern)
Germany (Schleswig-
Holstein)Russia Sweden
Acetylsalicylic acid 2,110 2,780
Allopurinol 2,770 700 3,750 4,080 4,160
Buprenorphine 3.4 0.006 3
Codeine 1,800 155 60
Diclofenac 1,050 593 940 700 8,800
Fentanyl 1.2 0.02 2.1
Ibuprofen 119,000 15,100 11,900 20,000 14,400
Irbesartan 0 0 850 880 1,095
Ketoprofen 470 100 1,511
Naproxen 6,200 210 17,690
Paracetamol 173,582 16,950 618 778 338,007
Tramadol 1,756 321 4,833
Table A2.2 Use of antimicrobial pharmaceuticals in Baltic Sea countries (2014, kg/year)Source: Original data.
Compound Finland Estonia Germany
(Mecklenburg-Vorpommern)
Germany (Schleswig-Holstein) Sweden
Amoxicillin 9,300 2,250 570 3,270 2,630
Ampicillin 80 225 5,300
Azithromycin 300 80 95
Cefadroxil 0 245 840
Cefuroxime 615 290 560 775 0
Ciprofloxacin 1,200 370
Clarithromycin 240 445 110
Clindamycin 16 4 420
Doxycycline 640 75 390
Erythromycin 120 0 125
Fluconazole 140 15
Metronidazol 1,800 80
Miconazol 40
Norfloxacin 95 100 30
Ofloxacin 25 6
Phenoxymethylpenicillin 970
Roxithromycin 125 10
Sulfamethoxazole 470 1,700
Sulfasalazine 730 990
Tetracycline 1,700 25 350
Trimethoprim 850 100 210

63
ANNEXES
Table A2.3 Use of cardiovascular agents in Baltic Sea countries (2014, kg/year) Source: Original data.
Compound Finland Estonia Germany
(Mecklenburg-Vorpommern)
Germany (Schleswig-
Holstein)Sweden
Acebutolol 0 0 0
Alfuzosin 75 6 245
Amlodipine 485 80 810
Atenolol 445 35 2,860
Atorvastatin 1,330 135 2,450
Bisoprolol 740 5 310
Cilazapril
Colestyramine 1,200
Diltiazem 570 11 680
Dipyridamole 660*
Enalapril 530 135 1,830
Enalaprilat
Eprosartan 600 6 105
Felodipine 90 13 470
Furosemide 3,000 95 4,880
Hydrochlorothiazide 330 475 955 1,475 445
Metformin 125,500 18,800 30,300 37,400 135,000
Metoprolol 4,550 1,670 2,120 5,340 13,800
Nebivolol 13 45 0
Propranolol 645 38 890
Ramipril 345 74 245
Rosuvastatin 260 120 190
Simvastatin 3,080 100 1,280 1,430 4,870
Sotalol 200 130 520
Telmisartan 590 400 53
Torasemide 0 77 3.7
Trimetazidine 0 200 0
Valsartan 1,760 215 3,500 3,000 665
Warfarin 235 30 300
Verapamil 370 410 870
*data from 2013 (no data from 2014)

64
EMERGING POLLUTANTS IN WATER SERIES 1 Pharmaceuticals in the aquatic environment of the Baltic Sea region
Table A2.4 Use of central nervous system agents in Baltic Sea countries (2014, kg/year)Source: Original data.
Compound Finland Estonia Germany
(Mecklenburg-Vorpommern)
Germany (Schleswig-
Holstein)Sweden
Carbamazepine 3,530 1,090 1,350 1,331 5,860
Clonazepam 14 3 6
Fluoxetine 170 29 370
Gabapentin 5,860 575 2,420 2,690 11,000
Levetiracetam 5,600 185 2,780 3,840 6,300
Levodopa 1,060 1,510
Metamizole 0 11,800 21,850 0
Paroxetine 105 21 205
Piracetam 900
Pregabalin 710 800
Quetiapine 720
Sertraline 690 68 4,160
Tilidine 640
Valproic acid 11,200 1,050 1,880 2,550 8,600
Zopiclone 275 57 605
Table A2.5 Use of metabolic agents and gastrointestinal agents in Baltic Sea countries (2014, kg/year)
Source: Original data.
Compound Finland Estonia Germany
(Mecklenburg-Vorpommern)
Germany (Schleswig-
Holstein)Sweden
Bezafibrate 95 335
Drotaverin 215
Macrogol 154,500 980 22,300 41,500 54,400
Mesalazine 18,000 685 2,530 3,840 17,100
Omeprazole 565 240 3,420
Pantoprazole 1,440 1,770
Ranitidine 740 450 830
Sitagliptin 670*
* data from 2013 (no data from 2014)

65
ANNEXES
Table A2.6 Use of other pharmaceuticals in Baltic Sea countries (2014, kg/year) Source: Original data.
Compound Finland Estonia Germany
(Mecklenburg-Vorpommern)
Germany (Schleswig-
Holstein)Russia Sweden
Hormones and hormone antagonistsFinasteride 66 120
Levothyroxine sodium 0 1.1 13
Tamoxifen 42 6 105
Respiratory systemAcetylcysteine 540* 790*
Terbutaline 6
Xylomeazoline 6 864 0
Theophylline 780 780*
Musculoskeletal systemMethocarbamol 650* 1,020
*year 2013 (no data from 2014)
Sales of veterinary pharmaceuticals
Data on the use of veterinary pharmaceuticals were received from Finland and Germany. Data on the use of veterinary pharmaceutical in Estonia are based on reports from wholesalers and presented only as turnovers (Ravimiamet 2015).
Finland provided data on the sales of veterinary pharma ceuticals for years 2001–2013 (Figure A2.1). The total use of veterinary pharmaceuticals varied between 12,600 and 17,000 kg/year. In 2013 it was around 13,600 kg/year. The most used antimicrobial drug was a betalactam antibiotic penicillin G, and its consumption in 2013 was 6,200 kg. Antimicrobials are the main pharmaceuticals used for treatment of animals in Finland. No data were reported on the use of other types of pharmaceuticals.
Similarly to Finland, Germany also reported the sales of antimicrobial veterinar y p h a r m a c e u t i c a l s ( B V L 2 0 1 4 ; A g r a -Europe 2014). No data were available for pharmaceuticals of other therapeutic groups. Data for the years 2011–2013 are presented in Figure A2.2. As in Finland, tetracycline and penicillin were the most sold veterinary pharmaceuticals in Germany. However, the total sale of veterinary pharmaceuticals in Germany was significantly higher than in Finland. The total sale of veterinary pharmaceuticals in Germany in 2013 was 1,450,000 kg, and there was significant geographical variation in their consumption. The total sale of veterinary pharmaceuticals in those areas that are relevant for the Baltic Sea (i.e. Mecklenburg-Vorpommern and Schleswig-Holstein) was 86,000 kg in 2013.

66
EMERGING POLLUTANTS IN WATER SERIES 1 Pharmaceuticals in the aquatic environment of the Baltic Sea region
Figure A2.1 Sales of veterinary pharmaceuticals in Finland Source: Original data.
0 2000 4000 6000 8000 10000 12000 14000 16000 18000
2013
2012
2011
2010
2009
2008
2007
2006
2005
2004
2003
2002
2001
year
kg/year
Tetracycline, doxycycline
Amfenicol Penicillin G Aminopenicillins
Cloxacillin Cefalosporins Sulphonamides Trimethoprim
Sum of sulphonamides and trimethoprim Aminoglycosides Fluoroquinolones Pleuromulines
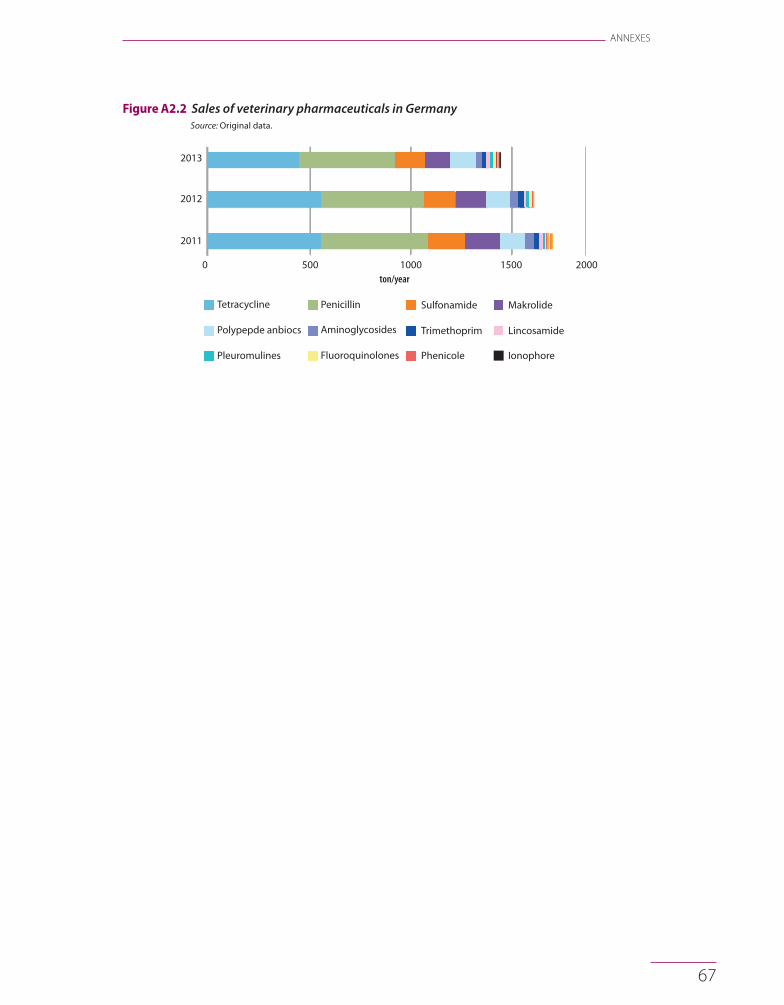
67
ANNEXES
Figure A2.2 Sales of veterinary pharmaceuticals in Germany Source: Original data.
2013
2012
2011
0 500 1000 1500 2000
Tetracycline Penicillin Sulfonamide Makrolide
Polypepde anbiocs Aminoglycosides Trimethoprim Lincosamide
Pleuromulines Fluoroquinolones Phenicole Ionophore
Cephalosporins
ton/year

68
EMERGING POLLUTANTS IN WATER SERIES 1 Pharmaceuticals in the aquatic environment of the Baltic Sea region
Annex 3. Data on samples from MWWTPs influent, effluent, sludge and river water by therapeutic groups
Methodology for statistical and visual presentation of data
When pharmaceuticals have been detected in MWWTP influent, effluent, sludge or river water, the average and maximum measured concentrations are presented in figures together with the sensitivity of the analytical methods.
Removal rates are presented in tables. Removal rates were calculated for the pharmaceuticals which were detected both in MWWTP influent and effluent. This rough estimation is based on the average of the concentrations of pharmaceutical substances in influents and effluents. It does not take into account technical parameters of particular wastewater treatment facilities, nor reflects variations of the removal rates between different MWWTP. The numbers of
detected pharmaceuticals used in averaging are given in Table A3.1, Table A3.3, Table A3.5, Table A3.7, Table A3.9, Table A3.10 and Table A3.12. Only removal from the aqueous phase is considered. Negative values indicate a higher average concentration of a pharmaceutical substance in effluent than in influent, which might be interpreted as an increase in the concentration during the wastewater treatment. This could be e.g. a result of liberation of the substance during decomposing of other pharmaceuticals in the treatment process. The results are presented by grouping pharmaceuticals according to their therapeutic groups.

69
ANNEXES
Anti-inflammatory and analgesics
A n o ve r v i e w o f re p o r t e d d a t a o n pharmaceuticals belonging to the therapeutic
group anti-inflammatory and analgesics is presented in Table A3.1.
Table A3.1 Anti-inflammatory and analgesics detected in MWWTP influents, effluents, sludge and river water in Baltic Sea countries Source: Original data.
Sampled/detected Not detected, number of samples
Pharmaceutical Influent Effluent Sludge River Pharmaceutical Influent Effluent Sludge River
Azelastine 8/2 13/4 1/0 Beclomethasone 17 31 1
Buprenorphine 11/8 16/13 8/2 Budenoside 2
Codeine 60/50 65/37 15/14 Dextropropoxyphene 23 32
Diclofenac 96/95 387/365 33/20 1,696/690 Norfentanyl 23 32
Dihydroergotamine 8/1 13/0 2/0 Norpropoxyphene 23 32
Fentanyl 52/8 66/12 14/0 Orphenadrine 1
Ibuprofen 193/193 397/268 33/9 1,716/127
2-hydroxyibuprofen 119/119 194/182
Ibuprofen-COOH 4/4 11/9
Indometacin 20/4 16/0
Ketoprofen 99/93 234/194 33/16 50/11
Naproxen 68/68 203/182 33/17 236/37
Paracetamol 128/97 201/55 6/6 9/6
Phenazone 20/17 1,661/204
Propyphenazone 1,645/4
Pizotifen 8/7 13/10 0/0
Salicylic acid 121/86 205/38 20/0
Tramadol 29/29 34/34 16/10 16/10
Trihexyphenidyl 8/7 13/13 0/0
In total 27 pharmaceuticals in this category were monitored, out of which 21 (78%) were detected in MWWTP influent, MWWTP effluent, sludge or river water samples. The average and maximum measured concentrations measured in MWWTP influents and effluents are presented in Figure A3.1 and Figure A3.2, respectively. Removal rates of pharmaceuticals in MWWTPs are presented in Table A3.2.
Sludge monitoring results are presented in Figure A3.3 and Figure A3.4 and river water results in Figure A3.5. For the majority of pharmaceuticals, the reported analytical LOD in MWWTP influent and effluent samples were low enough to detect these substances in wastewater samples. For salicylic acid, the highest reported LOD was higher than the
values reported in other studies and thus more frequent detection could be anticipated for this pharmaceutical when more sensitive methods are used.
In MWWTP influents, the highest average (83 mg/l) and maximum (1,300 mg/l) concentrations were measured for paracetamol. Additionally, 2-hydroxyibuprofen (metabolite of ibuprofen), ibuprofen and salicylic acid were detected in influents at average concentrations of >10 mg/l. Similar to the influents, paracetamol was measured at the highest concentration (360 mg/l) in effluents. The highest average concentration (4.4 mg/l) in effluents was measured for the metabolite 2-hydroxyibuprofen. Additionally, ibuprofen and tramadol were detected in effluents at average concentrations of >1 mg/l.

70
EMERGING POLLUTANTS IN WATER SERIES 1 Pharmaceuticals in the aquatic environment of the Baltic Sea region
Removal rates of >70% were calculated for eight out of 17 compounds (i.e. buprenorphine, codeine, dihydroergotamine, ibuprofen, ketoprofen, naproxen, paracetamol and salicylic acid). Removal rates of <20% (or even increase in concentrations during the treatment) were observed for seven compounds (i.e. azelastine, diclofenac, fentanyl, 2-hydroxyibuprofen, ibuprofen-COOH, propofol and tramadol). These compounds can be considered as being of concern from an environmental point of view due to low biodegradation potential in conventional MWWTPs. Two of these compounds were metabolites of ibuprofen, which is a very biodegradable pharmaceutical. In the future, the occurrence and fate of not only the parent compounds but also their metabolites should be more thoroughly investigated.
In untreated sludge samples, highest concentrations were reported for ibuprofen and paracetamol. However, in digested sludge diclofenac had the highest average concentration and in composted sludge diclofenac and naproxen had the highest average concentrations. Ibuprofen and paracetamol were not detected in composted sludge samples.
In river water, samples the highest average concentration was measured for tramadol (256 ng/l) and the highest maximum concentration (2,71 ng/l) for diclofenac. Additionally, ibuprofen, diclofenac and phenanzone were detected in river water samples at average concentrations of >50 ng/l.
It should be noted that no data on phenazone were reported from MWWTPs. Due to its presence in river water, this compound might be of interest to monitor in the future.
Figure A3.1 The average and maximum concentrations of anti-inflammatory and analgesics in MWWTP influents
Source: Original data.
2-hy
drox
yibu
prof
en
10,000
1,000
100
10
1
0.1
0.01
0.001
Max detected Average detected
Bupr
enor
phin
e
Code
ine
Diclo
fena
c
Ibup
rofe
n
Ibup
rofe
n-CO
OH
Keto
prof
en
Napr
oxen
Para
ceta
mol
Pizo
�fen
Salic
ylic
acid
Tram
adol
Trih
exyp
heni
dyl
μg/l
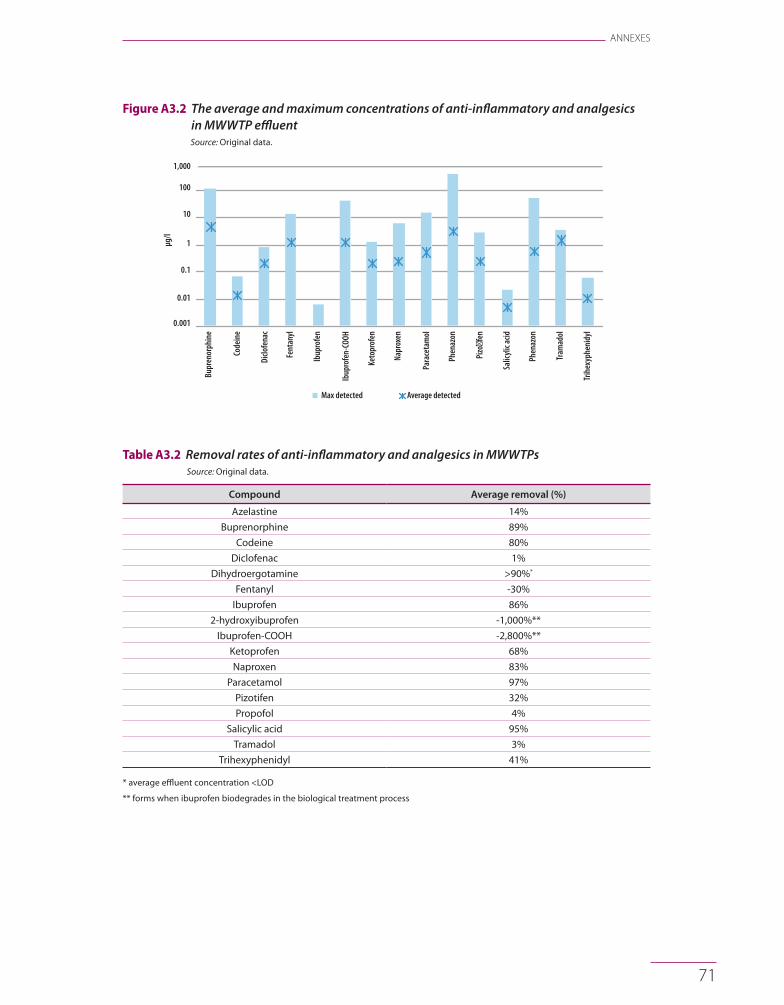
71
ANNEXES
Figure A3.2 The average and maximum concentrations of anti-inflammatory and analgesics in MWWTP effluent Source: Original data.
1,000
100
10
1
0.1
0.01
0.001
Max detected Average detected
Bupr
enor
phin
e
Code
ine
Diclo
fena
c
Fent
anyl
Ibup
rofe
n
Ibup
rofe
n-CO
OH
Keto
prof
en
Napr
oxen
Para
ceta
mol
Phen
azon
Pizo
�fen
Salic
ylic
acid
Phen
azon
Tram
adol
Trih
exyp
heni
dyl
μg/l
Table A3.2 Removal rates of anti-inflammatory and analgesics in MWWTPs Source: Original data.
Compound Average removal (%)
Azelastine 14%
Buprenorphine 89%
Codeine 80%
Diclofenac 1%
Dihydroergotamine >90%*
Fentanyl -30%
Ibuprofen 86%
2-hydroxyibuprofen -1,000%**
Ibuprofen-COOH -2,800%**
Ketoprofen 68%
Naproxen 83%
Paracetamol 97%
Pizotifen 32%
Propofol 4%
Salicylic acid 95%
Tramadol 3%
Trihexyphenidyl 41%
* average effluent concentration <LOD
** forms when ibuprofen biodegrades in the biological treatment process
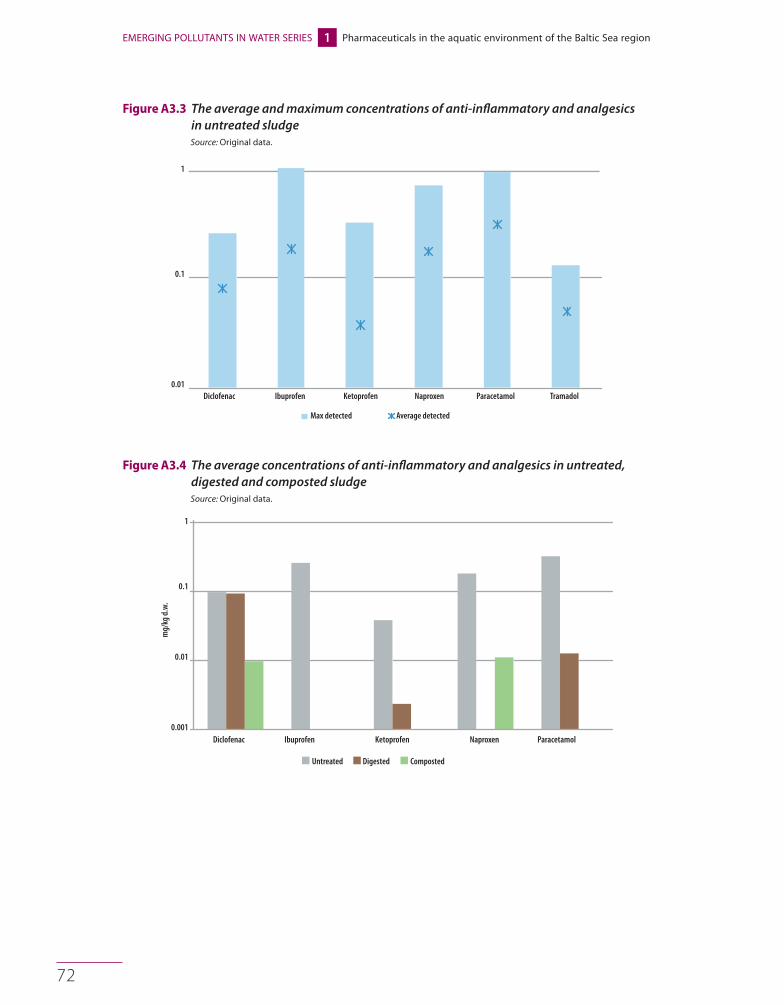
72
EMERGING POLLUTANTS IN WATER SERIES 1 Pharmaceuticals in the aquatic environment of the Baltic Sea region
Figure A3.3 The average and maximum concentrations of anti-inflammatory and analgesics in untreated sludge Source: Original data.
1
0.1
0.01
Max detected Average detected
Diclofenac Ibuprofen Ketoprofen Naproxen Paracetamol Tramadol
Figure A3.4 The average concentrations of anti-inflammatory and analgesics in untreated, digested and composted sludge Source: Original data.
1
0.1
0.01
0.001Diclofenac Ibuprofen Ketoprofen Naproxen Paracetamol
mg/
kg d
.w.
Untreated Digested Composted

73
ANNEXES
Figure A3.5 The average and maximum concentrations of anti-inflammatory and analgesics in river water samples Source: Original data.
Bupr
enor
phin
e
10,000
1,000
100
10
1
Code
ine
Diclo
fena
c
Ibup
rofe
n
Keto
prof
en
Napr
oxen
Para
ceta
mol
Phen
anzo
ne
Prop
yphe
nazo
ne
Tram
adol
μg/l
Max detected Average detected
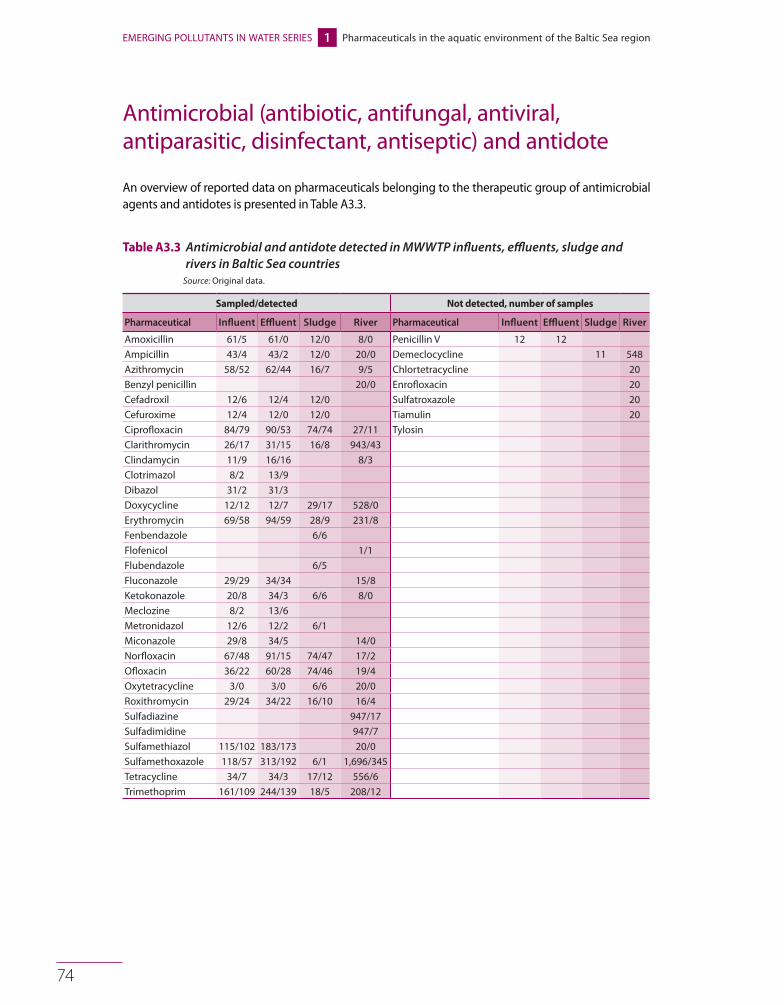
74
EMERGING POLLUTANTS IN WATER SERIES 1 Pharmaceuticals in the aquatic environment of the Baltic Sea region
Antimicrobial (antibiotic, antifungal, antiviral, antiparasitic, disinfectant, antiseptic) and antidote
An overview of reported data on pharmaceuticals belonging to the therapeutic group of antimicrobial agents and antidotes is presented in Table A3.3.
Table A3.3 Antimicrobial and antidote detected in MWWTP influents, effluents, sludge and rivers in Baltic Sea countries
Source: Original data.
Sampled/detected Not detected, number of samples
Pharmaceutical Influent Effluent Sludge River Pharmaceutical Influent Effluent Sludge River
Amoxicillin 61/5 61/0 12/0 8/0 Penicillin V 12 12
Ampicillin 43/4 43/2 12/0 20/0 Demeclocycline 11 548
Azithromycin 58/52 62/44 16/7 9/5 Chlortetracycline 20
Benzyl penicillin 20/0 Enrofloxacin 20
Cefadroxil 12/6 12/4 12/0 Sulfatroxazole 20
Cefuroxime 12/4 12/0 12/0 Tiamulin 20
Ciprofloxacin 84/79 90/53 74/74 27/11 Tylosin
Clarithromycin 26/17 31/15 16/8 943/43
Clindamycin 11/9 16/16 8/3
Clotrimazol 8/2 13/9
Dibazol 31/2 31/3
Doxycycline 12/12 12/7 29/17 528/0
Erythromycin 69/58 94/59 28/9 231/8
Fenbendazole 6/6
Flofenicol 1/1
Flubendazole 6/5
Fluconazole 29/29 34/34 15/8
Ketokonazole 20/8 34/3 6/6 8/0
Meclozine 8/2 13/6
Metronidazol 12/6 12/2 6/1
Miconazole 29/8 34/5 14/0
Norfloxacin 67/48 91/15 74/47 17/2
Ofloxacin 36/22 60/28 74/46 19/4
Oxytetracycline 3/0 3/0 6/6 20/0
Roxithromycin 29/24 34/22 16/10 16/4
Sulfadiazine 947/17
Sulfadimidine 947/7
Sulfamethiazol 115/102 183/173 20/0
Sulfamethoxazole 118/57 313/192 6/1 1,696/345
Tetracycline 34/7 34/3 17/12 556/6
Trimethoprim 161/109 244/139 18/5 208/12

75
ANNEXES
In total 38 pharmaceuticals in this category were monitored, out of which 31 (82%) were detected in MWWTP influent, MWWTP effluent, sludge or river water samples. The average and maximum concentrations measured in MW W TP inf luents and effluents are presented in Figure A3.6 and Figure A3.7, respectively. Removal rates of pharmaceuticals in MWWTPs are presented in Table A3.4. Sludge monitoring results are presented in Figure A3.8 and Figure A3.9 and river water results in Figure A3.10. For the majority of pharmaceuticals, the reported analytical LOD in MWWTP influent and effluent samples were low enough to detect these pharmaceuticals in wastewater samples. In the influents, the highest reported LOD was higher than the values reported in other studies for tetracycline and in effluents, for erythromycin, ketoconazole, norfloxacin and sulfamethoxazole. Thus, more frequent detection could be anticipated for these pharmaceuticals when more sensitive methods are used.
In MWWTP influents, the highest average concentration (1.85 mg/l) was measured for sulfamethiazol and the highest maximum concentration (29 mg/l) for sulfamethoxazole. Additionally, clarithromycin was detected in influents at average concentrations of >1 mg/l. Similar to the influents, sulfamethiazol was measured at the highest average concentration of 1 mg/l in effluents. The highest concentration (15 mg/l) was also measured for sulfamethiazol in effluents. Additionally, azithromycin, clarithromycin, doxycycline, erythromycin, fluconazole, metronizadole, norfloxacin, ofloxacin, roxithromycin and trimethoprim were detected in effluents at average concentrations of >0.1 mg/l.
Removal rates of >70% were observed for 12 out of 23 compounds. Increases in concentrations during the treatment were noted for three compounds (clindamycin, fluconazole and meclozine). These compounds can be considered as being of concern from the environmental point of view due to low removal potential in existing MWWTPs. For many antibiotics, adsorption to sludge seems to be an important fate in MWWTPs. Thus, the concentrations in sludge samples were relatively high. In untreated sludge samples, five out of 10 compounds were detected at concentrations higher than 1 mg/kg d.w. The highest average concentration of 3.3 mg/kg d.w. was also reported for ciprofloxacin. The highest observed concentration of 8.8 mg/kg d.w. was reported for ciprofloxacin. Many antibiotics were present at similar concentrations in untreated and digested sludge. Only trimethoprim was not detected in digested sludge samples. In composted sludge samples, the concentrations were lower but still detectable for all other compounds except flubendazole, oxytetracycline and trimethoprim. In the future, the fate of antimicrobials and antidotes should be more thoroughly studied, especially in sludge treatment and land application of sludge.
In river water samples, the highest average concentration (147 ng/l) was measured for roxithromycin and the highest maximum concentration (19,000 ng/l) for sulfadiazine. Ad-ditionally, erythromycin, fluconazole, sulfadimidine, sulfamethoxazole and trimethoprim were detected in river water samples at average concentrations of >50 ng/l.
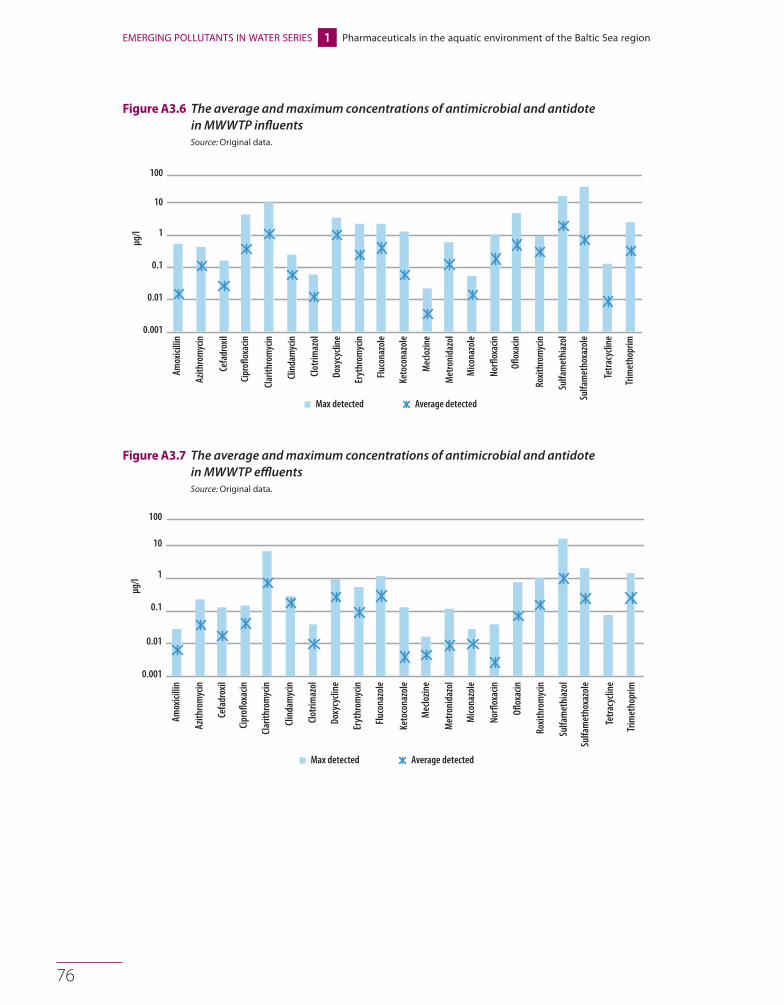
76
EMERGING POLLUTANTS IN WATER SERIES 1 Pharmaceuticals in the aquatic environment of the Baltic Sea region
Figure A3.6 The average and maximum concentrations of antimicrobial and antidote in MWWTP influents Source: Original data.
100
10
1
0.1
0.01
0.001
Max detected Average detected
Clot
rimaz
ol
Doxy
cycli
ne
Eryt
hrom
ycin
Fluc
onaz
ole
Keto
cona
zole
Mec
lozin
e
Met
roni
dazo
l
Mico
nazo
le
Norfl
oxac
in
Oflox
acin
Roxi
thro
myc
in
Sulfa
met
hiaz
ol
Sulfa
met
hoxa
zole
Tetra
cycli
ne
Trim
etho
prim
Amox
icilli
n
Cefa
drox
il
Azith
rom
ycin
Cipr
oflox
acin
Clar
ithro
myc
in
Clin
dam
ycin
μg/l
Figure A3.7 The average and maximum concentrations of antimicrobial and antidote in MWWTP effluents Source: Original data.
100
10
1
0.1
0.01
0.001
Clot
rimaz
ol
Doxy
cycli
ne
Eryt
hrom
ycin
Fluc
onaz
ole
Keto
cona
zole
Mec
lozin
e
Met
roni
dazo
l
Mico
nazo
le
Norfl
oxac
in
Oflox
acin
Roxi
thro
myc
in
Sulfa
met
hiaz
ol
Sulfa
met
hoxa
zole
Tetra
cycli
ne
Trim
etho
prim
Amox
icilli
n
Cefa
drox
il
Azith
rom
ycin
Cipr
oflox
acin
Clar
ithro
myc
in
Clin
dam
ycin
Max detected Average detected
μg/l

77
ANNEXES
Table A3.4 Removal rates of antimicrobial and antidote in MWWTPs Source: Original data.
Compound Average removal (%)
Amoxicillin >90%*
Ampicillin 62%
Azithromycin 73%
Cefadroxil 31%
Cefuroxime >90%*
Ciprofloxacin 89%
Clarithromycin 34%
Clindamycin -470%
Clotrimazol 19%
Doxycycline 74%
Erythromycin 91%
Fluconazole -39%
Ketokonazole 93%
Meclozine -24%
Metronidazol 93%
Miconazole 43%
Norfloxacin 99%
Ofloxacin 87%
Roxithromycin 47%
Sulfamethiazol 46%
Sulfamethoxazole 79%
Tetracycline >90%*
Trimethoprim 45%
* average effluent concentration <LOD
Figure A3.8 The average and maximum concentrations of antimicrobial and antidote in untreated sludge Source: Original data.
10
1
0.1
0.01
Max detected Average detected
Doxy
cycli
ne
Eryt
hrom
ycin
Flub
enda
zole
Keto
cona
zole
Norfl
oxac
in
Oflox
acin
Oxyt
etra
cycli
ne
Roxi
thro
myc
in
Tetra
cycli
ne
Trim
etho
prim
Fend
enda
zole
Azith
rom
ycin
Cipr
oflox
acin
Clar
ithro
myc
in
μg/l

78
EMERGING POLLUTANTS IN WATER SERIES 1 Pharmaceuticals in the aquatic environment of the Baltic Sea region
Figure A3.9 The average concentrations of antimicrobial and antidote in untreated, digested and composted sludge Source: Original data.
10
1
0.1
0.01
0.001
Cipr
oflox
acin
Doxy
cycli
ne
Fend
enda
zole
Flub
enda
zole
Keto
kona
zole
Norfl
oxac
in
Oflox
acin
Oxyt
etra
cycli
ne
Tetra
cycli
ne
Trim
etho
prim
mg/
kg d
.w.
Untreated Digested Composted
Figure A3.10 The average and maximum concentrations of antimicrobial and antidote in river water samples
Source: Original data.
100,000
10,000
1,000
100
10
1
Clin
dam
ycin
Eryt
hrom
ycin
Norfl
oxac
in
Norfl
oxac
in
Oflox
acin
Sulfa
dim
idin
e
Oxyt
etra
cycli
ne
Roxi
thro
myc
in
Tetra
cycli
ne
Trim
etho
prim
Fluc
onaz
ole
Azith
rom
ycin
Cipr
oflox
acin
Clar
ithro
myc
in
Sulfa
diaz
ine
Max detected Average detected
μg/l

79
ANNEXES
Cardiovascular agents (blood pressure, diuretics, anticoagulants, antihistamine)
An overview of reported data on pharmaceuticals belonging to the therapeutic group of cardiovascular agents is presented in Table A3.5.
Table A3.5 Cardiovascular agents detected in MWWTP influents, effluents, sludge and river water in Baltic Sea countries Source: Original data.
Sampled/detected Not detected, number of samples
Pharmaceutical Influent Effluent Sludge River Pharmaceutical Influent Effluent Sludge River
Acebutelol 21/21 21/21 11/10 Amiodarone 8 13
Amiloride 18/18 18/3 8/0 Amlodipine 11 20
Alfuzosin 11/8 16/13 8/0 Bendroflumethiazid 20
Atenolol 50/47 74/68 6/2 1,690/112 Felodipine Primidone 17 31
Benzafibrat 19/13 12/0 Sulfatroxazole 12
Bisoprolol 26/8 50/32 22/5 1,675/552
Cilazapril 11/7 16/6 8/0
Clemastine 8/2 13/6 2/0
Cyproheptadine 8/2 13/6
Desloratidin 8/8 13/13 2/0
Diltiazem 11/8 16/13 8/0
Diphenhydramine 8/8 13/13 2/0
Dipyridamole 8/8 13/0 2/0
Enalapril 31/30 31/10 6/5 20/0
Enalaprilat 31/27 31/20
Eprosartan 11/11 16/15 8/4
Fexofenadine 8/8 13/13 2/2
Flecainide 8/8 13/13
Furosemide 115/113 183/181 6/6 3/3
Gemfibrozil 20/1 203/0
Hydrochlorthiazide 6/6 2/2
Irbesartan 8/8 13/13 8/2
Losartan 18/18 12/3
Metoprolol 50/50 228/228 22/22 1,687/962
Promethazine 8/6 13/5
Propranolol 18/15 38/32 22/22 1,664/96
Simvastatatin 6/1
Sotalol 24/24 44/41 6/2 1,680/477
Telmisartan 11/8 16/12 7/4
Verapamil 11/10 16/11 8/0
Warfarin 6/15 208/12
Of all the monitored pharmaceuticals in this categor y, 31 out of 36 (86%) were detected in MWW TP influent, MWW TP effluent, sludge or river water samples. The average and maximum concentrations measured in MW W TP inf luent s and
effluents are presented in Figure A3.11 and Figure A3.12, respectively. Removal rates of pharmaceuticals in MWWTPs are presented in Table A3.6. Sludge monitoring results are presented in Figure A3.13 and Figure A3.14 and river water results in Figure A3.15. For all

80
EMERGING POLLUTANTS IN WATER SERIES 1 Pharmaceuticals in the aquatic environment of the Baltic Sea region
the pharmaceuticals, the reported analytical LOD in influent and effluent samples were low enough to detect these pharmaceuticals in wastewater samples.
In MWWTP influents, the highest average and maximum concentrations (52 mg/l and 1 ,800 mg/l , respec t ively) were measured for furosemide. Additionally, telmisartan was detected in influents at average concentrations of >10 mg/l and dipyridamole, metoprolol and sotalol at >1 mg/l. Similar to the influents, furosemide was measured at the highest average and maximum concentrations of 22mg/l and 110 mg/l, respectively, in effluents. Additionally, metoprolol , sotalol and telmisar tan were detected in effluents at an average concentration of >1 mg/l and acebutolol, atenolol, benzafibrat, bisoprolol, eprosartan, fexofenadine, flecainide, irbesartan and losartan at concentrations of >0.1 mg/l.
Removal rates of >70% were calculated for only three out of 23 compounds. For two compounds (alfuzosin and atenolol) the removal rates were <20% and for one
compound (clemastine) an increase in concentrations during the treatment was observed. Generally, due to relatively poor removal in MWWTPs, many compounds in this therapeutic group can be considered relevant from the point of view of the aquatic environment.
Concentrations in sludge samples were available for only six substances. Out of these six compounds, the highest maximum concentration (0.315 mg/kg d.w.) was reported for metoprolol. The highest average concentration (0.11 mg/kg d.w.) was reported for furosemide. Felodipine was not detected in digested sludge. Furosemide and propranolol were detected in the composted sludge samples at the highest concentrations.
In river water samples, the highest average concentration (670 ng/l) was measured for hydrochlorotiazide and the highest maximum concentration (3,810 ng/l) for bisoprolol. The maximum concentration of metoprolol and sotalol exceeded 1,000 ng/l and furosemide and telmisartan were detected in rivers at average concentrations of >100 ng/l.
Figure A3.11 The average and maximum concentrations of cardiovascular agents in MWWTP influents Source: Original data.
10,000
1,000
100
10
1
0.1
0.01
0.001
0.0001
Aceb
utol
ol
Alfu
zosin
Aten
olol
Biso
prol
ol
Cila
zapr
il
Clem
asne
Cypr
ohep
tadi
ne
Deslo
radi
n
Dila
zem
Diph
enhy
dram
ine
Dipy
ridam
ole
Enal
april
Enal
april
at
Epro
sart
an
Fexo
fena
dine
Flec
aini
de
Furo
sem
ide
Irbes
arta
n
Met
opro
lol
Prom
etha
zine
Prop
rano
lol
Sota
lol
Telm
isart
an
Vera
pam
il
Max detected Average detected
μg/l

81
ANNEXES
Figure A3.12 The average and maximum concentrations of cardiovascular agents in MWWTP effluents
Source: Original data.
1,000
100
10
1
0.1
0.01
0.001
Aceb
utol
ol
Alfu
zosin
Aten
olol
Biso
prol
ol
Cila
zapr
il
Clem
asne
Cypr
ohep
tadi
ne
Deslo
radi
n
Dila
zem
Diph
enhy
dram
ine
Dipy
ridam
ole
Enal
april
Enal
april
at
Epro
sart
an
Fexo
fena
dine
Flec
aini
de
Furo
sem
ide
Irbes
arta
n
Met
opro
lol
Prom
etha
zine
Prop
rano
lol
Sota
lol
Telm
isart
an
Vera
pam
il
Max detected Average detected
μg/l
Table A3.6 Removal rates of cardiovascular agents in MWWTPsSource: Original data.
Compound Average removal (%)
Acebutolol 59%
Alfuzosin 18%
Atenolol 29%
Bisoprolol 51%
Cilazapril 66%
Clemastine -214%
Cyproheptadine 50%
Desloratidin 38%
Diltiazem 50%
Diphenhydramine 46%
Dipyridamole >90%
Enalapril 92%
Enalaprilat 85%
Eprosartan 65%
Fexofenadine 49%
Flecainide 32%
Furosemide 57%
Irbesartan 49%
Losartan 82%
Metoprolol 26%
Promethazine 68%
Propofol 54%
Propranolol 8%
Sotalol 36%
Telmisartan 80%
Verapamil 62%

82
EMERGING POLLUTANTS IN WATER SERIES 1 Pharmaceuticals in the aquatic environment of the Baltic Sea region
Figure A3.13 The average and maximum concentrations of cardiovascular agents in untreated sludge
Source: Original data.
1
0.1
0.01Bisoprolol Felodipine Furosemide Hydrochlorthiazide Metoprolol Propranolol
Max detected Average detected
mg/
kg d
.w.
Figure A3.14 The average concentrations of cardiovascular agents in untreated, digested and composted sludge
Source: Original data.
1
0.1
0.01
0.001
Bisoprolol Felodipine Furosemide Hydrochlorthiazide Metoprolol Propranolol
mg/
kg d
.w.
Untreated Digested Composted

83
ANNEXES
Figure A3.15 The average and maximum concentrations of cardiovascular agents in river water samples
Source: Original data.
10,000
1000
100
10
1
0.1
Epro
sart
an
Furo
sem
ide
Irbes
arta
n
Losa
rtan
Met
opro
lol
Prop
rano
lol
Sota
lol
Telm
isart
an
Hydr
ochl
orot
hiaz
ide
Aceb
utol
ol
Aten
olol
Biso
prol
ol
Max detected Average detected
μg/l

84
EMERGING POLLUTANTS IN WATER SERIES 1 Pharmaceuticals in the aquatic environment of the Baltic Sea region
Central nervous system agents (psychotherapeutic, antiepileptic, antiparkinson, muscle relaxant)
A n ove r v i ew o f re p o r te d d at a o n p h a r m a c e u t i c a l s b e l o n gi n g to t h e therapeutic group of central nervous system agents is presented in Table A3.7.
In total 46 pharmaceuticals in this category were monitored, out of which 40 (87%) were detected in MWWTP influent, MWWTP effluent, sludge or river water samples. The average and maximum concentrations measured in MWWTP influents and effluents are presented in Figure A3.16 and Figure A3.17, respectively. Removal rates of pharmaceuticals in MWWTPs are presented in Table A3.8. Sludge monitoring results are presented in Figure A3.18 and Figure A3.19 and river water monitoring results in Figure A3.20.
In MWWTP influents, the highest average and maximum concentrations (62 and 150 mg/l, respectively) were measured for caffeine. Additionally, citalopram was detected in influents at average concentrations of >1 mg/l and carbamazepine, mirtazapine, oxazepam, propofol and venlafaxine at >0.1 mg/l. Similar to the influents, caffeine was measured at the highest average and maximum concentrations of 12 and 150 mg/l, respectively, in effluents. Additionally, carbamazepine and gabapentin were detected in effluents at average concentrations of >1 mg/l and citalopram, mirtazapine, oxazepam, primidone and venlafaxine at >0.1 mg/l.
Removal rates of >70% were calculated for only nine out of 35 compounds. For 11 compounds the removal rates were <20% or the concentrations were noted to increase during the treatment. Generally, due to relatively poor removal in MWWTPs, many compounds in this therapeutic group can be considered relevant from the point of view of the aquatic environment.
Data on concentrations in sludge were submitted for only six compounds. Out of these six, the highest average and maximum concentrations (1.46 and 7 mg/kg d.w., respectively) were reported for caffeine. All the six compounds were also detected in digested sludge samples and all, except entacapone, also in composted sludge samples.
Twenty central nervous systems agents were measured in river water, out of which eight were detected. The highest average and maximum concentrations (138 and 2,950 ng/l) were measured for carbamazepine. The average and maximum concentrations of other pharmaceuticals were <100 ng/l. More environmental monitoring data should be gathered for the pharmaceuticals that are present in the highest concentrations and are poorly removed in the MWWTP, such as oxazepam and mirtazapine.

85
ANNEXES
Table A3.7 Central nervous systems agents detected in MWWTP influents, effluents, sludge and river water in Baltic Sea countriesSource: Original data.
Sampled/detected Not detected, number of samples
Pharmaceutical Influent Effluent Sludge River Pharmaceutical Influent Effluent Sludge River
7-aminofluni-trazepam 22/1 32/1 Clozapine 23 32
Alprazolam 8/7 13/6 2/0 Diazepam 23 32 11 187
Amitryptiline 8/6 13/6 Levopromazine 8 13 1
Atracurium 8/8 13/13 N-demethyl-flunitrazepam 23 32
Biperiden 8/5 13/13 2/0 Thioridazine 23 32 12
Bromocriptine 31/3 45/1 2/0 Zopiclone 23 32
Bupropion 8/8 13/13
Caffeine 23/21 32/26 6/6
Carbamazepine 107/103 277/248 22/22 1,674/1,321
Chlorpromazine 8/4 13/1 2/0
Citalopram 49/36 63/62 22/22 10/8
Clomipramine 8/8 13/13
Clonazepam 11/0 16/1 7/0
Donepezil 8/8 13/12 2/0
Duloxetine 8/3 13/7 2/0
Entacapone 6/1
Flunitrazepam 31/1 45/0
Fluoxetine 34/9 48/20 6/6 6/0
Flupentixol 8/2 13/10
Fluphenazine 8/2 13/2
Gabapentin 15/15 12/6
Haloperidol 8/8 13/13
Hydroxyzine 8/8 13/13
Maprotiline 8/5 13/6
Memantine 8/8 13/13
Mianserin 8/8 13/13 2/0
Mirtazapin 8/8 13/13
Nefazodone 8/6 13/11
Nordiazepam 23/3 32/12
Orphenadrine 8/8 13/13
Oxazepam 31/29 45/45 189/3
Paroxetine 31/10 45/14 6/6 2/1
Perphenazine 8/1 13/3
Primidone 15/15
Propofol 51/36 66/50 16/12
Risperidone 31/12 45/16 2/0
Sertraline 43/14 66/17 8/0
Temazepam 187/2
Venlafaxine 8/8 13/13 2/2
Zolpidem 31/11 45/19 2/0
Zopiclone 23/1 32/1
N-oxide
Zuclopenthixol 2/0

86
EMERGING POLLUTANTS IN WATER SERIES 1 Pharmaceuticals in the aquatic environment of the Baltic Sea region
Figure A3.16 The average and maximum concentrations of central nervous system agents in MWWTP influents
Source: Original data.
1,000
100
10
1
0.1
0.01
0.001
Alpr
azol
am
Amitr
yplin
e
Atra
curiu
m
Bipe
riden
Bupr
opio
n
Caffe
ine
Carb
amaz
epin
e
Chlo
rpro
maz
ine
Cita
lopr
am
Clom
ipra
min
e
Done
pezil
Dulo
xene
Fluo
xene
Flup
enxo
l
Flup
hena
zine
Halo
perid
ol
Hydr
oxyz
ine
Map
rolin
e
Mem
anne
Mia
nser
in
Mirt
azap
ine
Nefa
zodo
ne
Nord
iaze
pam
Orph
enad
rine
Oxaz
epam
Paro
xene
Prop
ofol
Risp
erid
one
Venl
afax
ine
Max detected Average detected
μg/l
Figure A3.17 The average and maximum concentrations of central nervous system agents in MWWTP effluents
Source: Original data.
1,000
100
10
1
0.1
0.01
0.001
Alpr
azol
am
Amitr
yplin
e
Atra
curiu
m
Bipe
riden
Bupr
opio
n
Caffe
ine
Carb
amaz
epin
e
Cita
lopr
am
Clom
ipra
min
e
Done
pezil
Dulo
xene
Fluo
xene
Flup
enxo
l
Gapa
penn
Halo
perid
ol
Hydr
oxyz
ine
Map
rolin
e
Mem
anne
Mia
nser
in
Mirt
azap
ine
Nefa
zodo
ne
Nord
iaze
pam
Orph
enad
rine
Oxaz
epam
Paro
xene
Prim
idon
e
Prop
ofol
Risp
erid
one
Venl
afax
ine
Max detected Average detected
μg/l

87
ANNEXES
Table A3.8 Removal rates of central nervous system agents in MWWTPs Source: Original data.
Compound Average removal (%) 7-aminoflunitrazepam 77%
Alprazolam 68%
Amitryptiline 44%
Atracurium 15%
Biperiden 40%
Bromocriptine 93%
Bupropion 37%
Caffeine 81%
Carbamazepine -86%
Chlorpromazine 81%
Citalopram 78%
Clomipramine 50%
Donepezil 43%
Duloxetine -72%
Flunitrazepam >90%*
Fluoxetine -77%
Flupentixol -39%
Fluphenazine 89%
Haloperidol 53%
Hydroxyzine 45%
Maprotiline 44%
Memantine 14%
Mianserin -17%
Mirtazapine 31%
Nefazodone 70%
Nordiazepam -111%
Orphenadrine 50%
Oxazepam -9%
Paroxetine 35%
Perphenazine 71%
Propofol 51%
Risperidone 7%
Sertraline 67%
Venlafaxine 34%
Zolpidem 10%
Zopiclone N-oxide 72%
* average effluent concentration <LOD

88
EMERGING POLLUTANTS IN WATER SERIES 1 Pharmaceuticals in the aquatic environment of the Baltic Sea region
Figure A3.18 The average and maximum concentrations of central nervous systems agents in untreated sludge Source: Original data.
10
1
0.1
0.01
Max detected Average detected
Caffein Carbamazepine Citalopram Entacapone Fluoxene Paroxene
mg/
kg d
.w.
Figure A3.19 The average concentrations of central nervous system agents in untreated, digested and composted sludge
Source: Original data.
10
1
0.1
0.01
0.001Caffeine Carbamazepine Citalopram Entacapone Fluoxene Paroxene
mg/
kg d
.w.
Untreated Digested Composted

89
ANNEXES
Figure A3.20 The average and maximum concentrations of central nervous system agents in river water samples
Source: Original data.
10,000
1,000
100
10
1
0.1
Carb
amaz
epin
e
Cita
lopr
am
Gaba
penn
Oxaz
epam
Paro
xene
Prop
ofol
Tem
azep
am
Venl
afax
ine
Max detected Average detected
ng/l
Chemotherapeutic agents and X-ray contrast media
An overview of reported data on pharmaceuticals belonging to the therapeutic group of chemotherapeutic agents and X-ray contrast media is presented in Table A3.9.
Table A3.9 Chemotherapeutic agents and X-ray contrast media detected in MWWTP influents, effluents, sludge and river water in Baltic Sea countries Source: Original data.
Sampled/detected Not detected, number of samples
Pharmaceutical Influent Effluent Sludge River Pharmaceutical Influent Effluent Sludge River
Amidotrizoic 1,645/806 Cyclofosfamide 6
Capecitabin 18/15 18/0 16/1 8/0 Ifosfamide 6
Iohexol 4/0 Methotrexate 6
Iomeprol 5/5 4/0
Iopamidol 5/5 6/0 1,649/350
Iopromide 5/5 6/0 4/0
X-ray contrast media 308/249

90
EMERGING POLLUTANTS IN WATER SERIES 1 Pharmaceuticals in the aquatic environment of the Baltic Sea region
Data on X-ray contrast media were submitted only by Germany. In influent samples, only the chemotherapeutic agent capecitabin was analyzed and detected at average and maximum concentrations of 0.05 and 0.11 mg/l. The average removal rate for capecitabin was 49%. In MWWTP effluent samples, concentrations of X-ray contrast media compounds were partly reported as concentrations of individual compounds or as a total concentration of a therapeutic group. In the MWW TP effluents, X-ray contrast media compounds were detected at the average concentration of 7.4 mg/l and at the highest concentration of 78 mg/l.
Mean concentrations of iohexol, iomeprol, iopamidol and iopromide were reported as 2.31, 1.54, 3.44 and 0.09 mg/l, respectively.
Nearly all data on concentrations in sludge for X-ray contrast media or chemotherapeutic agents were under the detection limits. Only capecitabin was detected in sludge at a maximum concentration of 0.012 mg/kg d.w. In the river water samples submitted by Germany, the X-ray contrast media agents amidotrizoic acid, iomeprol and iopamidol were detected at average concentrations of 630, 36 and 920 ng/l, respectively (Figure A3.21).
Figure A3.21 The average and maximum concentrations of X-ray contrast media agents in river water samples For iomeprol, only the mean concentration was reported.
Source: Original data.
Max detected Average detected
1
10
100
1,000
10,000
100,000
Amidotrizoic acid Iopamidol
ng/l

91
ANNEXES
Hormones and hormone antagonists
An overview of reported data on pharmaceuticals belonging to the therapeutic group of hormones and hormone antagonists is presented in Table A3.10.
Table A3.10 Hormones and hormone antagonists detected in MWWTP influents, effluents, sludge and river water in Baltic Sea countries Source: Original data.
Sampled/detected Not detected, number of samples
Pharmaceutical Influent Effluent Sludge River Pharmaceutical Influent Effluent Sludge River
17a-ethinylestradiol 160/4 273/5 11/1 612/1 Medroxyprogesterone 13 1
17b-estradiol 157/89 270/34 11/0 405/1 Hydrocortisone 6
Estriol 26/4 64/10 11/1 1/1
Estrone 148/133 210/127 3/1
Etonogestrel 11/0 16/11 6/0
Finasterinde 11/4 16/5 7/0
Flutamide 11/4 16/2 7/0
Levonorgestrel 20/0 53/19 8/2
Megestrol 13/12 1/0
Mestranol 201/0
Methylprednisolone 6/1
Norethindrone 22/15 58/17 2/11
Norethisteron 18/3 18/0 8/0
Progesterone 23/18 77/66 7/9 7/0
Tamoxifen 29/3 34/9 6/0 8/0
Testosterone 3/6 208/12
Eighteen pharmaceuticals in this category were monitored, out of which 16 (89%) were detected in MWWTP influent, MWWTP effluent, sludge or river water samples. The average and maximum concentrations measured in MW W TP inf luents and effluents are presented in Figure A3.22 and Figure A3.23, respectively. Removal rates of pharmaceuticals in MWWTPs are presented in Table A3.11. Sludge monitoring results are presented in Figure A3.24 and Figure A3.25 and river water results in Figure A3.26. For 17a-ethinylestradiol, 17b-estradiol and estrone, the highest reported LOD were higher than the values reported in other studies
and thus more frequent detection could be anticipated for these pharmaceuticals if more sensitive methods were used.
In MWWTP influents, the highest average concentration (0.06 mg/l) was measured for estrone. The highest maximum concentration (1.3 mg/l) was measured for 17b-estradiol.
Addit ional ly, the highest maximum concentration of estrone exceeded 1 mg/l. In the effluents, estrone and etonogestrel were measured at the highest concentration (0.61 mg/l). The highest average concentration of 0.08 mg/l was measured for etonogestrel.
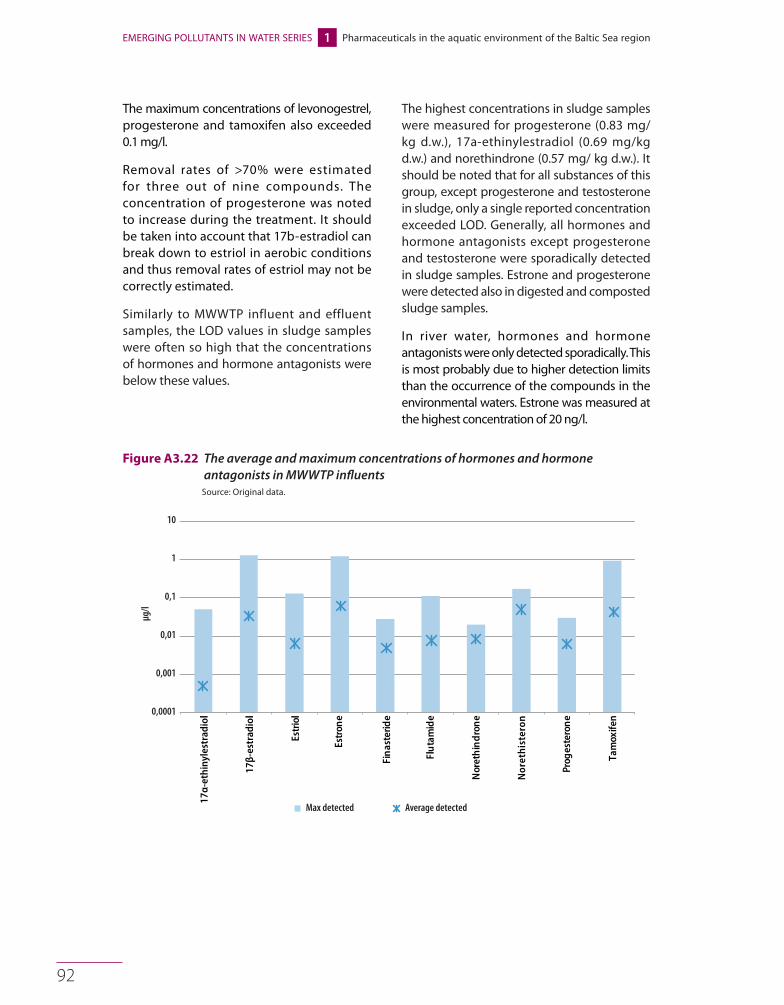
92
EMERGING POLLUTANTS IN WATER SERIES 1 Pharmaceuticals in the aquatic environment of the Baltic Sea region
The maximum concentrations of levonogestrel, progesterone and tamoxifen also exceeded 0.1 mg/l.
Removal rates of >70% were estimated for three out of nine compounds. The concentration of progesterone was noted to increase during the treatment. It should be taken into account that 17b-estradiol can break down to estriol in aerobic conditions and thus removal rates of estriol may not be correctly estimated.
Similarly to MWWTP influent and effluent samples, the LOD values in sludge samples were often so high that the concentrations of hormones and hormone antagonists were below these values.
The highest concentrations in sludge samples were measured for progesterone (0.83 mg/kg d.w.), 17a-ethinylestradiol (0.69 mg/kg d.w.) and norethindrone (0.57 mg/ kg d.w.). It should be noted that for all substances of this group, except progesterone and testosterone in sludge, only a single reported concentration exceeded LOD. Generally, all hormones and hormone antagonists except progesterone and testosterone were sporadically detected in sludge samples. Estrone and progesterone were detected also in digested and composted sludge samples.
In river water, hormones and hormone antagonists were only detected sporadically. This is most probably due to higher detection limits than the occurrence of the compounds in the environmental waters. Estrone was measured at the highest concentration of 20 ng/l.
Figure A3.22 The average and maximum concentrations of hormones and hormone antagonists in MWWTP influents
Source: Original data.
Max detected Average detected
0,0001
0,001
0,01
0,1
1
10
17α-
ethi
nyle
stra
diol
17β-
estr
adio
l
Estr
iol
Estr
one
Fin
aste
ride
Flu
tam
ide
Nor
ethi
ster
on
Nor
eth
ind
ron
e
Prog
este
ron
e
Tam
oxife
n
μg/l

93
ANNEXES
Figure A3.23 The average and maximum concentrations of hormones and hormone antagonists in MWWTP effluents Source: Original data.
1
0,1
0,01
0,001
0,0001
17α-
ethi
nyle
stra
diol
17β-
estra
diol
Estri
ol
Estro
ne
Eton
oges
trel
Fina
ster
ide
Flut
amid
e
Levo
norg
estre
l
Meg
estro
l
Nore
thin
dron
e
Prog
este
rone
Tam
oxife
n
Max detected Average detected
μg/l
Table A3.11 Removal rates of hormones and hormone antagonists in MWWTPs Source: Original data.
Compound Average removal (%)
17α-ethinylestradiol 59%
17β-estradiol 62%
Estriol 58%
Estrone 88%
Finasteride 33%
Flutamide 51%
Norethindrone 73%
Progesterone -60%
Tamoxifen 65%

94
EMERGING POLLUTANTS IN WATER SERIES 1 Pharmaceuticals in the aquatic environment of the Baltic Sea region
Figure A3.24 The average and maximum concentrations of hormones and hormone antagonists in untreated sludge For estriol, ethinylestradiol, hydrocortisone, methylprednisolone and norethindrone, only one reported concentration exceeded LOD and thus only the maximum value is displayed. Source: Original data.
1
0,1
0,01
0,001
Estri
ol
Ethi
nyle
stra
diol
Hydr
ocor
sone
Met
hylp
redn
isolo
ne
Nore
thin
dron
e
Prog
este
rone
Test
oste
rone
Max detected Average detected
ng/l
Figure A3.25 The average concentrations of hormones and hormone antagonists in untreated, digested and composted sludge Source: Original data.
0,001
0,01
0,1
17α-ethinylestradiol Estriol Estrone Hydrocortisone Methylprednisolone Norethindrone Progesterone Testosterone
mg/
kg d.
w.
Untreated Digested Composted
1

95
ANNEXES
Figure A3.26 The maximum concentrations of hormones and hormone antagonists in river water samples Source: Original data.
1
0.1
0.01Estradiol Estriol Estrone Ethinylestradiol Fulvestrant Levonorgestrel
Max detected Average detected
ng/l

96
EMERGING POLLUTANTS IN WATER SERIES 1 Pharmaceuticals in the aquatic environment of the Baltic Sea region
Metabolic agents and gastrointestinal agents
An overview of data reported on pharmaceuticals belonging to the therapeutic group of metabolic agents and gastrointestinal agents is presented in Table A3.12.
Table A3.12 Metabolic agents and gastrointestinal agents detected in MWWTP influents, effluents, sludge and river water in Baltic Sea countries Source: Original data.
Sampled/detected Not detected, number of samples
Pharmaceutical Influent Effluent Sludge River Pharmaceutical Influent Effluent Sludge River
Atorvastatin 8/3 13/2
Bezafibrate 44/14 44/13 6/0 135/1,661
Cimetidin 115/30 183/58
Dicycloverin 8/1 13/2 2/0
Drotaverin 31/20 31/23
Ezetimibe 8/1 13/0 2/0
Glimepiride 8/1 13/8 1/0
Loperamide 8/8 13/13
Metformin 17/11 31/15
Ranitidine 39/12 44/12 2/0
Repaglinide 8/8 13/13 2/0
Rosuvastatin 8/8 13/8 2/2
Twelve pharmaceuticals in this category were monitored and all 12 (100%) were detected in MWWTP influent, MWWTP effluent, sludge or river water samples. The average and maximum concentrations measured in MWWTP influents and effluents are presented in Figure A3.27 and Figure A3.28, respectively. Removal rates of pharmaceuticals in MWWTPs are presented in Table A3.13. River water monitoring results are presented in Figure A3.29. Sludge monitoring data were submitted only for bezafibrate and all the values were lower than the detection limits for the used methods. For the majority of pharmaceuticals, the reported analytical LOD in MWWTP influent and effluent samples were low enough to detect these pharmaceuticals in wastewater samples.
In MWWTP influents, the highest average and maximum concentrations (0.5 mg/l and 3.2 mg/l, respectively) were measured for bezafibrate. The highest maximum
concentration of metformin also exceeded 1 mg/l and the average concentrations of ranitidine and rosuvastatin exceeded 0.1 mg/l. In effluents, the highest average and maximum concentrations were measured for metformin (0.16 mg/l and 0.92 mg/l, respectively). The average concentration of bezafibrate exceeded 0.1 mg/l. Generally, the average concentrations of the compounds in effluents were <0.02 mg/l.
Removal rates of >70% were estimated for five out of 12 compounds. For cimetidine, the removal rate was <20 % and for dicycloverin, glimepiride and loperamide, the concentrations were noted to increase during treatment. In river water samples, only data for bezafibrate were submitted. The maximum detected concentration of bezafibrate was 290 ng/l and the average concentration was 53 ng/l.

97
ANNEXES
Figure A3.27 The average and maximum concentrations of metabolic agents and gastrointestinal agents in MWWTP influents Source: Original data.
10
1
0,1
0,01
0,001Bezafibrate Cimetidine Drotaverin Loperamide Metformin Ranitidine Repaglinide Rosuvastatin
Max detected Average detected
μg/l
Figure A3.28 The average and maximum concentrations of metabolic agents and gastrointestinal agents in MWWTP effluents Source: Original data.
1
0,1
0,01
0,001
Max detected Average detected
Bezafibrate Cimetidine Drotaverin Loperamide Metformin Ranitidine Repaglinide Rosuvastatin
μg/l
Table A3.13 Removal rates of metabolic agents and gastrointestinal agents in MWWTPsSource: Original data.
Compound Average removal (%)
Atorvastatin 77%
Bezafibrate 75%
Cimetidin 0%
Dicycloverin -37%
Drotaverin 74%
Ezetimibe > 90%*
Glimepiride -678%
Loperamide -24%
Metformin 51%
Ranitidine 93%
Repaglinide 62%
Rosuvastatin 60%
* average effluent concentration <LOD

98
EMERGING POLLUTANTS IN WATER SERIES 1 Pharmaceuticals in the aquatic environment of the Baltic Sea region
Figure A3.29 The average and maximum concentrations of metabolic agents and gastrointestinal agents in river water samples Source: Original data.
350
300
250
200
150
100
50
0Bezafibrate
Max detected Average detected
μg/l

99
ANNEXES
Annex 4. Data on samples from the marine environment
Methodology for statistical and visual presentation of data
For pharmaceuticals detected in the Baltic Sea water, the median and maximum concentrations are presented in graphs together with the sensitivity of the analytical methods used. For pharmaceuticals with a WFD assessment criterion detected in water, the assessment criterion has been included in the graphic presentation. Concentration data from Baltic Sea sediment and biota samples are not presented in graphs as these data are less suitable for comparison due to few data points and monitoring results being highly affected by choice of sampling method, analytical method, sampled species, age of species, sampled tissue etc.
Figures and maps have been elaborated for pharmaceuticals that are:
• on the EU WFD ‘watch list’ (Table 2 in main report) and have been detected
• of relevance for monitoring according to the Swedish Medical Products Agency (Table 4 in main report) and have been detected in >5 measurements
• none of the above but have been detected in >5 measurements
The presented maps give an overview of sampling sites, sampling matrices and samples above the detection limit.
An overview of all data submitted by the countries, including references, is presented in Annex 1.2.
For more information, see the Background report on pharmaceutical concentrations and effects in the Baltic Sea by Hallgren and Wallberg (2015).
Anti-inflammatory and analgesics
An overview of data on pharmaceuticals belonging to the therapeutic group of anti-inflammatory and analgesics is presented in Table A4.1. In total 26 pharmaceuticals in this category were monitored, out of which 11
(42%) were detected in water, sediment or biota samples.

100
EMERGING POLLUTANTS IN WATER SERIES 1 Pharmaceuticals in the aquatic environment of the Baltic Sea region
Table A4.1 Summary of anti-inflammatory and analgesic pharmaceuticals monitored in the Baltic Sea Pharmaceuticals detected in any sample of water, sediment or biota, are listed in the left column. Pharmaceuticals not detected in any media are listed to the right along with further information on number of samples analyzed for each media. Source: Original data.
Detected, details in tables and figures below Not detected, number of samples
Pharmaceutical
Detected, map
(*in main report)
Concentration, graph
(*in main report)
Detected, statistics Pharmaceutical Water Sediment Biota
Codein Table A4.6 Acetylsalicylic acid 8 4 6
Diclofenac Figure 13* Figure 16* Table A4.2 Azelastine 2 1 4
Dihydroergotamine Table A4.6 Beclomethasone 3 5
Ibuprofen Figure 14* Figure 16* Table A4.3 Biperiden 2 4
Ketoprofen Figure 16* Table A4.6 Bromocriptine 2 2
Naproxen Figure A4.1 Figure 16* Table A4.4 Budesonide 1 6
Paracetamol Figure 16* Table A4.6 Buprenorphine 2 2
Phenazone Figure 15* Figure 16* Table A4.5 Dextropropoxyphene 1 2
Pizotifen Table A4.7 Fenoprofen 4
Tramadol Figure 16* Table A4.7 Fentanyl 1
Trihexyphenidyl Table A4.7 Indomethacin 2
Norpropoxyphene 137
Propofol 1
Propyphenazone
Tolfenamic acid
* in main report
Table A4.2 Overview of data on measurements of diclofenac in different marine matrices Number of detected values is presented together with the total number of measurements. Max= maximum value, MD= median among detected. The WFD assessment criterion for diclofenac in coastal waters and transitional waters is 0.01 µg/l. Source: Original data.
Diclofenac Total Denmark Estonia Finland Germany Poland Sweden
Water
Detected/sampled 70/257 0/2 0/10 2/3 67/212 0/9 1/21
Max (µg/l) 0.054 * 0.054 0.002
MD (µg/l) 0.002
Sediment
Detected/sampled 4/15 0/10 4/5
Max (µg/kg d.w.) 3.5 3.5
Biota
Detected/sampled 5/50 5/50
Max (µg/kg w.w.) 5.2
*33 ng/passive sampler (POCIS), not translatable to a concentration per litre
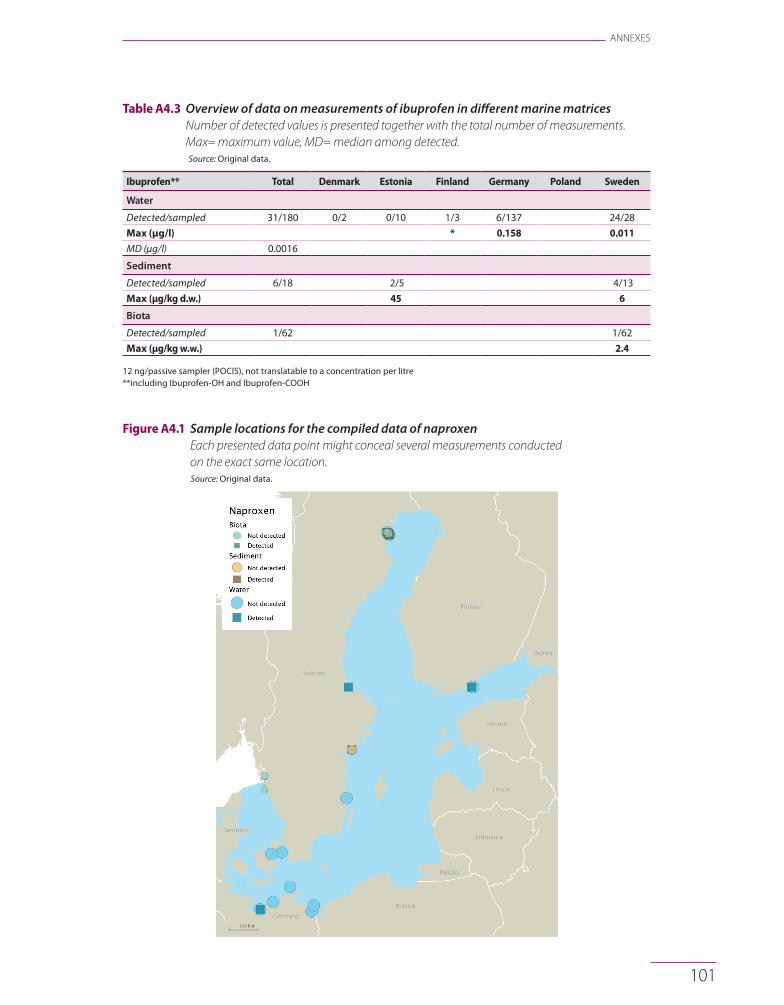
101
ANNEXES
Table A4.3 Overview of data on measurements of ibuprofen in different marine matrices Number of detected values is presented together with the total number of measurements. Max= maximum value, MD= median among detected. Source: Original data.
Ibuprofen** Total Denmark Estonia Finland Germany Poland Sweden
Water
Detected/sampled 31/180 0/2 0/10 1/3 6/137 24/28
Max (µg/l) * 0.158 0.011
MD (µg/l) 0.0016
Sediment
Detected/sampled 6/18 2/5 4/13
Max (µg/kg d.w.) 45 6
Biota
Detected/sampled 1/62 1/62
Max (µg/kg w.w.) 2.4
12 ng/passive sampler (POCIS), not translatable to a concentration per litre**including Ibuprofen-OH and Ibuprofen-COOH
Figure A4.1 Sample locations for the compiled data of naproxen Each presented data point might conceal several measurements conducted on the exact same location. Source: Original data.
102
EMERGING POLLUTANTS IN WATER SERIES 1 Pharmaceuticals in the aquatic environment of the Baltic Sea region
Table A4.4 Overview of data on measurements of naproxen in different marine matrices Number of detected values is presented together with the total number of measurements. Max= maximum value, MD= median among detected. Source: Original data.
Naproxen Total Denmark Estonia Finland Germany Poland Sweden
Water
Detected/sampled 10/33 0/2 2/3 1/16 7/12
Max (µg/l) * 0.014
MD (µg/l) 0.0056
Sediment
Detected/sampled 2/5 2/5
Max (µg/kg d.w.) 0.31
Biota
Detected/sampled 0/10 0/10
Max (µg/kg w.w.)
*39 ng/passive sampler (POCIS), not translatable to a concentration per litre
Table A4.5 Overview of data on measurements of phenazone in water Number of detected values is presented together with the total number of measurements. Max= maximum value, MD= median among detected. Source: Original data.
Phenazone Total Denmark Estonia Finland Germany Poland Sweden
Water
Detected/sampled 5/137 5/137
Max (µg/l) 0.504
MD (µg/l) 0.034

103
ANNEXES
Table A4.6 Overview of data on measurements of codein, dihydroergotamine, ketoprofen and paracetamol in different marine matrices Number of detected values is presented together with the total number of measurements. Max= maximum value, MD= median among detected. Source: Original data.
Codein Total Denmark Estonia Finland Germany Poland Sweden
Water
Detected/sampled 0/4 0/2 0/2
Max (µg/l)
MD (µg/l)
Biota
Detected/sampled 1/4 1/4
Max (µg/kg d.w.) 83 83
Dihydro-ergotamine Total Denmark Estonia Finland Germany Poland Sweden
Water
Detected/sampled 0/2 0/2
Max (µg/l)
MD (µg/l)
Biota
Detected/sampled 1/4 1/4
Max (µg/kg d.w.) 32 32
Ketoprofen Total Denmark Estonia Finland Germany Poland Sweden
Water
Detected/sampled 6/17 0/2 1/3 5/12
Max (µg/l) *
MD (µg/l) 0.0017
Sediment
Detected/sampled 0/5 0/5
Max (µg/kg d.w.)
Biota
Detected/sampled 0/10 0/10
Max (µg/kg w.w.)
Paracetamol Total Denmark Estonia Finland Germany Poland Sweden
Water
Detected/sampled 4/4 4/4
Max (µg/l) 0.36
MD (µg/l)
Sediment
Detected/sampled 4/4 4/4
Max (µg/kg d.w.) 69
Biota
Detected/sampled 0/10 0/10
Max (µg/kg w.w.)
*20 ng/passive sampler (POCIS), not translatable to a concentration per litre

104
EMERGING POLLUTANTS IN WATER SERIES 1 Pharmaceuticals in the aquatic environment of the Baltic Sea region
Table A4.7 Overview of data on measurements of pizotifen, tramadol and trehexyphenidyl in different marine matrices Number of detected values is presented together with the total number of measurements. Max= maximum value, MD= median among detected.
Source: Original data.
Pizotifen Total Denmark Estonia Finland Germany Poland Sweden
Water
Detected/sampled 0/2 0/2
Max (µg/l)
MD (µg/l)
Biota
Detected/sampled 1/4 1/4
Max (µg/kg w.w.) 0.7
Tramadol Total Denmark Estonia Finland Germany Poland Sweden
Water
Detected/sampled 3/4 1/2 2/2
Max (µg/l) 0.0016 0.00069
MD (µg/l)
Biota
Detected/sampled 2/4 2/4
Max (µg/kg w.w.) 179
Trihexy-phenidyl Total Denmark Estonia Finland Germany Poland Sweden
Water
Detected/sampled 0/2 0/2
Max (µg/l)
MD (µg/l)
Biota
Detected/sampled 3/4 3/4
Max (µg/kg w.w.) 185

105
ANNEXES
Antimicrobial (antibiotic, antifungal, antiviral, antiparasitic, disinfectant, antiseptic) and antidote
An overview of data reported on pharmaceuticals belonging to the therapeutic group of antimicrobial agents and antidotes is presented in Table A4.8 below.
Table A4.8 Summary of antimicrobial and antidote pharmaceuticals monitored in the Baltic Sea Pharmaceuticals detected in any sample of water, sediment or biota, are listed in the left column. Pharmaceuticals not detected in any media are listed to the right along with further information on number of samples analysed for each media.
Source: Original data.
Detected, details in tables and figures below Not detected, number of samples
Pharmaceutical
Detected, map
(*in main report)
Concentration, graph
(*in main report)
Detected, statistics Pharmaceutical Water Sediment Biota
Ciprofloxacin 9,10-Anthraquinone 9
Clarithromycin Figure A4.2 Figure 17* Table A4.9 Amoxicillin 2
Clindamycin Figure 17* Azithromycin 4 4
Clotrimazole Figure 17* Chloramphenicol 1
Erythromycin Figure A4.2 Table A4.9 Chlortetracyline 51 1
Ketoconazol Cloxacilline 1
Miconazol Demeclocycline 1 1 1
Norfloxacin Dicloxacilline 1
Sulfadiazine Doxycycline 51 1
Sulfamethoxazole Figure 18* Figure 17* Table A4.10 Fluconazole 4 3 4
Trimethoprim Figure 17* Lufenuron 9
Nafcilline 1
Naloxone 2
Ofloxacin 2 4
Oxacillin 1
Oxytetracycline 51 1
Phoxim 101
Roxithromycin 4 4
Tetracy 51 1 4
* in main reportNote: Some data on triclosan were made available as well but this substance was not included into this report.
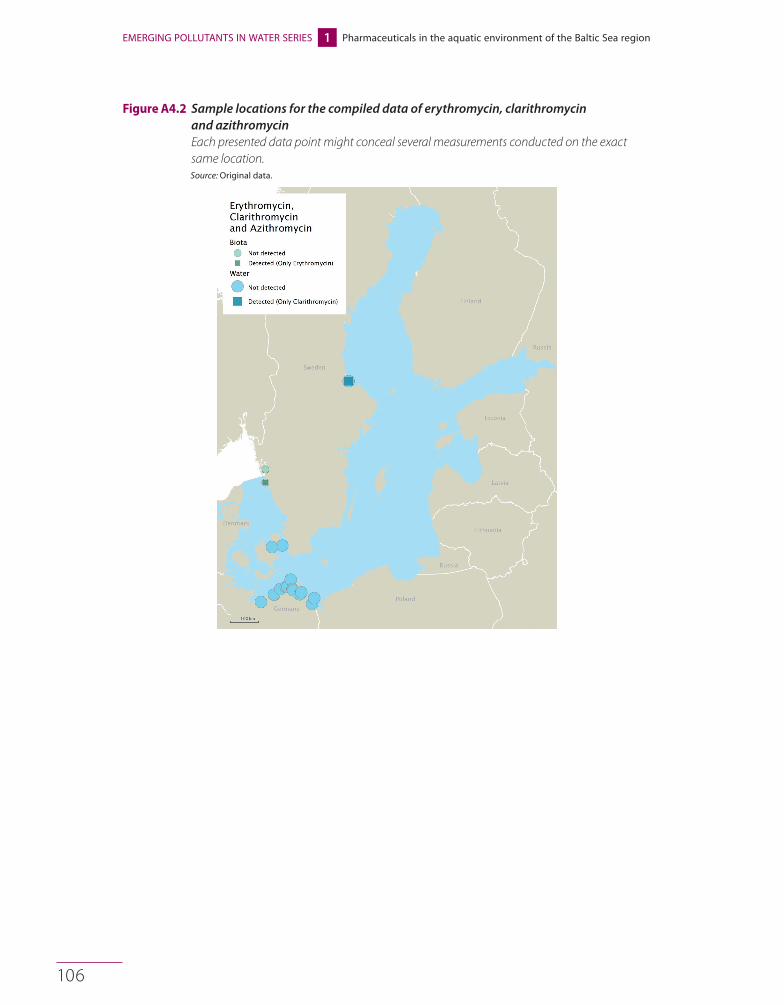
106
EMERGING POLLUTANTS IN WATER SERIES 1 Pharmaceuticals in the aquatic environment of the Baltic Sea region
Figure A4.2 Sample locations for the compiled data of erythromycin, clarithromycin and azithromycin Each presented data point might conceal several measurements conducted on the exact same location. Source: Original data.

107
ANNEXES
Table A4.9 Overview of data on measurements of erythromycin, clarithromycin and azithromycin in different marine matrices Number of detected values is presented together with the total number of measurements. Max= maximum value, MD= median among detected. Source: Original data.
Erythromycin, Clarithomycin, Azithromycin
Total Denmark Estonia Finland Germany Poland Sweden
Water
Detected/sampled 2/126 0/6 0/116 2/4
Max (µg/l) 0.00027 0.00027
MD (µg/l)
Biota
Detected/sampled 1/8 1/8
Max (µg/kg d.w.) 12.7
MD (µg/l)
Table A4.10 Overview of data on measurements of sulfamethoxazole in different marine matrices Number of detected values is presented together with the total number of measurements. Max= maximum value, MD= median among detected.Source: Original data.
Sulfamethoxazole Total Denmark Estonia Finland Germany Poland Sweden
Water
Detected/sampled 12/140 12/137 0/3
Max (µg/l) 0.033 * 0.033
MD (µg/l) 0.0016
Sediment
Detected/sampled 4/8 4/8
Max (µg/kg d.w.) 101
Biota
Detected/sampled 1/4 1/4
Max (µg/kg w.w.) 51

108
EMERGING POLLUTANTS IN WATER SERIES 1 Pharmaceuticals in the aquatic environment of the Baltic Sea region
Cardiovascular agents (blood pressure, diuretics, anticoagulants, antihistamine)
An overview of data reported on pharmaceuticals belonging to the therapeutic group of cardiovascular agents is presented in Table A4.11.
Table A4.11 Summary of cardiovascular agent pharmaceuticals monitored in the Baltic Sea Pharmaceuticals detected in any sample of water, sediment or biota, are listed in the left column. Pharmaceuticals not detected in any media are listed to the right along with further information on number of samples analyzed for each media. Source: Original data.
Detected, details in tables and figures below Not detected, number of samples
Pharmaceutical
Detected, map
(*in main report)
Concentration, graph
(*in main report)
Detected, statistics Pharmaceutical Water Sediment Biota
Acebutolol Amiloride 2
Alfuzosin Amiodarone 2 2
Atenolol Desloratadine 2 4
Bisoprolol Figure 21* Figure 19 Table A4.13 Diltiazem 2 4
Cilazapril Fexofenadine 2 4
Clemastine Flecainide 4
Cyproheptadine Isradipine 1
Diphenhydramine Losartan 2
Dipyridamole Figure 19 Meclozine 2 4
Eprosartan Promethazine 2 4
Felodipine Propranolol 139 40
Irbesartan Figure 19
Metoprolol Figure 20* Figure 19 Table A4.12
Sotalol Figure 22* Figure 19 Table A4.14
* in main report

109
ANNEXES
Table A4.12 Overview of data on measurements of metoprolol in different marine matrices Number of detected values is presented together with the total number of measurements. Max= maximum value, MD= median among detected. Source: Original data.
Metoprolol Total Denmark Estonia Finland Germany Poland Sweden
Water
Detected/sampled 23/144 0/2 3/3 18/137 2/2
Max (µg/l) 0.00027 * 0.055 0.0016
MD (µg/l)
Biota
Detected/sampled 0/4 0/4
Max (µg/kg d.w.)
MD (µg/l)
*40 ng/passive sampler (POCIS), not translatable to a concentration per liter
Table A4.13 Overview of submitted data on measurements of bisoprolol in different marine matrices Number of detected values is presented together with the total number of measurements. Max= maximum value, MD= median among detected. Source: Original data.
Bisoprolol Total Denmark Estonia Finland Germany Poland Sweden
Water
Detected/sampled 33/142 3/3 30/137 0/2
Max (µg/l) * 0.128
MD (µg/l)
Biota
Detected/sampled 1/44 1/44
Max (µg/kg d.w.) 102
MD (µg/l)
*39 ng/passive sampler (POCIS), not translatable to a concentration per liter
Table A4.14 Overview of data on measurements of sotalol in water Number of detected values is presented together with the total number of measurements. Max= maximum value, MD= median among detected. Source: Original data.
Sotalol Total Denmark Estonia Finland Germany Poland Sweden
Water
Detected/sampled 5/139 3/137 2/2
Max (µg/l) 0.024 0.00024
MD (µg/l)

110
EMERGING POLLUTANTS IN WATER SERIES 1 Pharmaceuticals in the aquatic environment of the Baltic Sea region
Central nervous system agents (psychotherapeutic, antiepileptic, antiparkinson, muscle relaxant)
Table A4.15 Summary of central nervous system agents monitored in the Baltic Sea Pharmaceuticals detected in any sample of water, sediment or biota, are listed in the left column. Pharmaceuticals not detected in any media are listed to the right along with further information on number of samples analyzed for each media. Source: Original data.
Detected, details in tables and figures below Not detected, number of samples
Pharmaceutical
Detected, map
(*in main report)
Concentration, graph
(*in main report)
Detected, statistics Pharmaceutical Water Sediment Biota
Alprazolam 7-aminoflunitrazepam 2
Bromocriptine Amitryptiline 2 4
Carbamazepine Figure 24* Figure 23* Table A4.16 Atracurium besylate 2 4
Chlorpromazine Biperiden 4
Citalopram Figure 23* Bupropion 2 4
Clonazepam Caffeine 2
Donepezil Clomipramine 2 4
Duloxetine Clozapine 2
Fluoxetine Diazepam 16 4
Haloperidol Flunitrazepam 6
Maprotiline Flupentixol 2 4
Memantine Fluphenazine 2 4
Mianserin Hydroxyzine 2 4
Mirtazapine Levomepromazine 2 4
Orphenadrine N-demethylflunitrazepam 2
Oxazepam Figure 26* Figure 23* Table A4.17 Nefazodone 2 4
Paroxetine Perphenazine 2 4
Primidone Figure 25* Figure 23* Table A4.18 Risperidone 2 6
Sertraline Figure 23* Temazepam 16
Venlafaxine Figure 23* Thioridazine 2
Zolpidem Zopiclone 2
Zopiclone N-oxide 2
Zuclopenthixol 1
* in main report

111
ANNEXES
Table A4.16 Overview of data on measurements of carbamazepine in different marine matrices Number of detected values is presented together with the total number of measurements. Max= maximum value, MD= median among detected. Source: Original data.
Carbamazepine Total Denmark Estonia Finland Germany Poland Sweden
Water
Detected/sampled 135/220 0/2 3/3 130/212 2/3
Max (µg/l) 0.033 * 0.073 0.0031
MD (µg/l) 0.0016
Sediment
Detected/sampled 0/1 0/1
Max (µg/kg d.w.)
Biota
Detected/sampled 1/45 1/45
Max (µg/kg w.w.) 141
*232 ng/passive sampler (POCIS), not directly translatable to a concentration per liter
Table A4.17 Overview of data on measurements of oxazepam in different marine matrices Number of detected values is presented together with the total number of measurements. Max= maximum value, MD= median among detected. Source: Original data.
Oxazepam Total Denmark Estonia Finland Germany Poland Sweden
Water
Detected/sampled 11/69 9/67 2/2
Max (µg/l) 0.0019 0.00085
MD (µg/l)
Biota
Detected/sampled 9/46 9/46
Max (µg/kg d.w.) 6.7
Table A4.18 Overview of data on measurements of primidone in sea water Number of detected values is presented together with the total number of measurements. Max= maximum value, MD= median among detected. Source: Original data.
Primidone Total Denmark Estonia Finland Germany Poland Sweden
Water
Detected/sampled 51/51 51/51
Max (µg/l) 0.0058
MD (µg/l)
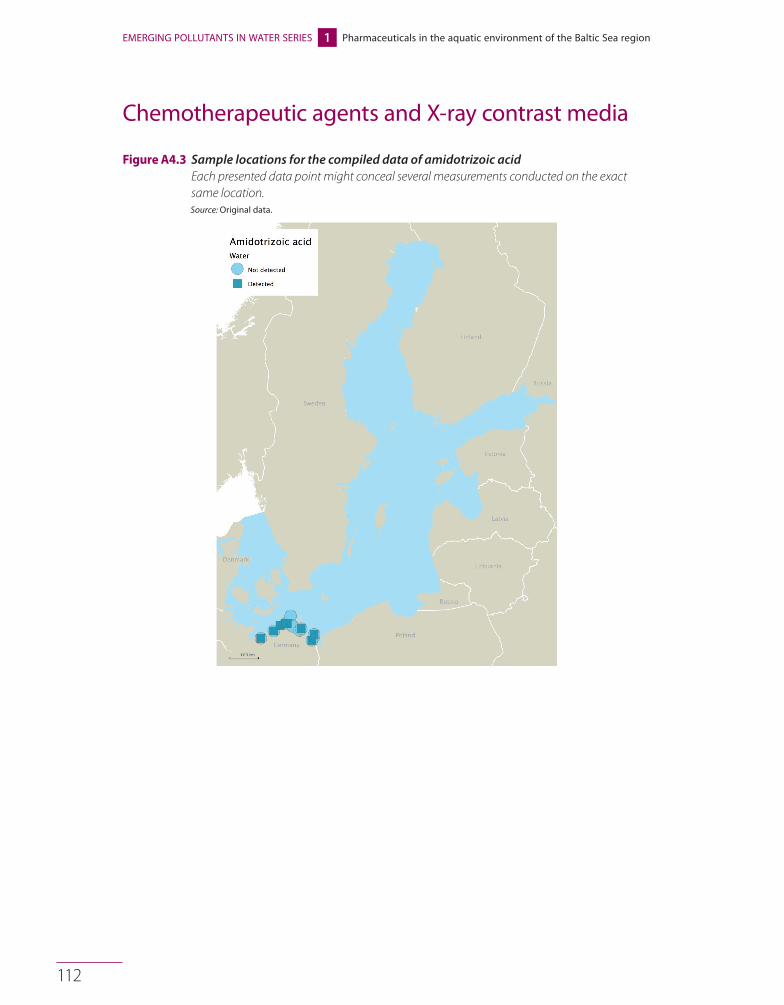
112
EMERGING POLLUTANTS IN WATER SERIES 1 Pharmaceuticals in the aquatic environment of the Baltic Sea region
Chemotherapeutic agents and X-ray contrast media
Figure A4.3 Sample locations for the compiled data of amidotrizoic acid Each presented data point might conceal several measurements conducted on the exact same location. Source: Original data.

113
ANNEXES
Dermatological agents
Table A4.19 Overview of data on measurements of salicylic acid in different marine matrices Number of detected values is presented together with the total number of measurements. Max= maximum value, MD= median among detected. Source: Original data.
Salicylic acid Total Denmark Estonia Finland Germany Poland Sweden
Water
Detected/sampled 4/8 4/8
Max (µg/l) 0.014 0.014
MD (µg/l) 0.012 0.012
Sediment
Detected/sampled 4/4 4/4
Max (µg/kg d.w.) 3.9 3.9
Biota
Detected/sampled 1/45 1/45
Max (µg/kg w.w.) 141
Hormones and hormone antagonists
Table A4.20 Summary of hormones and hormone antagonists monitored in the Baltic Sea Pharmaceuticals detected in any sample of water, sediment or biota, are listed in the left column. Pharmaceuticals not detected in any media are listed to the right along with further information on number of samples analyzed for each media.
Source: Original data.
Detected, details in tables and figures below Not detected, number of samples
Pharmaceutical Detected, map(*in main report)
Concentration, graph
(*in main report)
Detected, statistics Pharmaceutical Water Sediment Biota
17b-estradiol Figure A4.4 A4.21 Estriol 3 1
17a-ethinylestradiol Figure A4.4 A4.21 Estrone 1
Etonogestrel Finasteride 2 4
Flutamide Fulvestrant 1
Tamoxifen Levonorgestrel 3 1 5
Medroxyprogesterone 2
Mestranol 43 1
Norethindrone
Norethisteron 2
Progesterone 2

114
EMERGING POLLUTANTS IN WATER SERIES 1 Pharmaceuticals in the aquatic environment of the Baltic Sea region
Figure A4.4 Sample locations for the compiled data of 17a-ethinylestradiol, 17b-estradiol and estrone Each presented data point might conceal several measurements conducted on the exact same location. Source: Original data.

115
ANNEXES
Table A4.21 Overview of data on measurements of 17a-ethinylestradiol, 17b-estradiol and estrone in different marine matrices Number of detected values is presented together with the total number of measurements. Max= maximum value, MD= median among detected. Source: Original data.
17a-ethinylestradiol,17b-estradiol,Estrone
Total Denmark Estonia Finland Germany Poland Sweden
Water
Detected/sampled 3/198 0/20 0/154 3/24
Max (µg/l) 0.0011*
MD (µg/l)
Sediment
Detected/sampled 0/22 0/20 0/2
Max (µg/kg d.w.)
Biota
Detected/sampled 0/8 0/8
Max (µg/kg w.w.)
*maximum detected concentration is for 17b-estradiol
Metabolic agents and gastrointestinal agents
Table A4.22 Summary of metabolic and gastrointestinal agents monitored in the Baltic Sea Pharmaceuticals detected in any sample of water, sediment or biota, are listed in the left column. Pharmaceuticals not detected in any media are listed to the right along with further information on number of samples analyzed for each media.
Source: Original data.
Detected, details in tables and figures below Not detected, number of samples
PharmaceuticalDetected, map
(*in main report)
Concentration, graph
(*in main report)
Detected, statistics Pharmaceutical Water Sediment Biota
Atorvastatin Bezafibrate 139
Clofibric acid (metabolite of Clofibrate) Figure A4.5 Table A4.23 Ezetimibe 2 4
Dicycloverine Fenofibrate 1
Loperamide Gemfibrozil 17
Ranitidine Glibenclamide 4
Rosuvastatin Glimepiride 2 4
Metformin 1 5
Repaglinide 2 4

116
EMERGING POLLUTANTS IN WATER SERIES 1 Pharmaceuticals in the aquatic environment of the Baltic Sea region
Figure A4.5 Sample locations for the compiled data of clofibric acid Each presented data point might conceal several measurements conducted on the exact same location. Source: Original data.
Table A4.23 Overview of data on measurements of clofibric acid in water Number of detected values is presented together with the total number of measurements. Max= maximum value, MD= median among detected.
Source: Original data.
Clofibric acid Total Denmark Estonia Finland Germany Poland Sweden
Water
Detected/sampled 83/128 83/127 0/1
Max (µg/l) 0.0004 0.0004
MD (µg/l) 0.0001

117
ANNEXES
Annex 5. Overview of studies carried out on effects of pharmaceuticals on Baltic biotaThe tables below provide an overview of the results of different studies concerning the effects of pharmaceutical substances on Baltic Sea species.
The results are summarized according to species, test conditions (concentration and duration) and the essential outcome of the studies.
Table A5.1 Effects of propranolol on Baltic Sea species LOEC= lowest observable effect concentration. Source: Original data.
Species Test conditions LOEC (µg/l) Endpoints Reference
Mytilus edulis trossulus
1, 100, 1,000, 5,000 and10,000 µg/l(1-3 weeks)
1,000 Physiology: Lower byssus strength and lower byssus thread abundance at 10,000 µg/l.Lower SFG* after 2 weeks at 1,000 µg/l.Mortality 16% > 1,000 µg/l (2% in control treatments)
Ericson (2010)
Gammarus spp. 10, 100, and 1,000 µg/l(4 weeks)
100 Behavioral: Swimming activity decreased and time to find habitat increased with increased concentration.Feeding rates were more than 2 times higher than the control.
Ericson (2011)
Fucus vesiculosus 10, 100, and1,000 µg/l (4 weeks)
5,000 Physiology: Significant dose-response relationship and the significantly lowerGP/R**
Ericson (2011)
Fucus vesiculosus 10 – 1,000 µg/l 10 (8 weeks)
10 Physiology: Lower GP/R** at 10 µg/l after 4 weeks. Effects increased with increasing concentration and with exposure time.Lower chlorophyll fluorescence after 4 weeks at 1,000 µg/lNegative effect on the photosynthesis.
Oskarsson (2012)
Gammarus spp. 10 -1,000 µg/l(8 weeks)
100 Physiology: Reduced respiration (4 weeks). Inconsistent results at different concentrations over time.
Oskarsson (2012)
Microcosm study Ceramium tenuicorne, Mytilus edulis trossulus, Gammarus spp., water and sediment
1,000 µg/l100 µg/l
(6 weeks)
1,000 Algae: Higher carbon content at 1,000 µg/l.At 1,000 µg/l:Mussels: increased mortalityAmphipods: Increased reproductionAlgae: Higher carbon contentEcosystem structural change: The effect on the mussel led to a feeding shift from alga to mussel by the amphipods. Better food quality increased reproduction. Less amphipod grazing, and increased nutrient levels in the water was favorable for the alga.
Oskarsson (2012)
*(SFG) Scope for growth: the energy available for normal metabolism**(GP/R): primary production (GP) to respiration (R) ratio

118
EMERGING POLLUTANTS IN WATER SERIES 1 Pharmaceuticals in the aquatic environment of the Baltic Sea region
Table A5.2 Effects of diclofenac on Baltic Sea species LOEC= lowest observable effect concentration. Source: Original data.
Species Test conditions LOEC (µg/l) Endpoints Reference
Mytilus edulis trossulus
1, 100, 1,000, 5,000 and 10,000 µg/l (1-3 weeks)
100 Physiology: Lower byssus strength and lower byssus thread abundance at 10,000 µg/l. Lower SFG* after 2 weeks at 1,000 µg/l. Mortality 14% > 1,000 µg/l (2% in control treatments)
Ericson (2010)
Fucus vesiculosus
10, 100, and 1,000 µg/l(4 weeks)
>1,000 No significant effects Oskarsson (2012)
Gammarus spp 10, 100, and1,000 µg/l (4 weeks)
>1,000 No significant effects Oskarsson (2012)
*(SFG) Scope for growth: the energy available for normal metabolism
Table A5.3 Effects of a mixture of diclofenac (D) and propanolol (P) on blue mussels in the Baltic Sea LOEC= lowest observable effect concentration.
Source: Original data.
Species Test conditions LOEC (µg/l) Endpoints Reference
Mytilus edulis trossulus
Mixture exposure (2 weeks)
P: 250 D: 750
Total: 1,000
Physiology: lower SFG* Ericson (2010)
Mytilus edulistrossulus
50/50 mixture of iclofenac and propranolol. Total exposure concentration: 20, 200 and 2,000 µg/l.Sampled with increasing distance to a MWWTP outlet, exposed to the mixture for 3 weeks, and then tested for their physiological response and subsequent recovery from the exposure.
P: 100D: 100
Total: 200
Physiology: increased effect on SFG (and its components) Mussels collected further from outlet were more affected by the exposure and did not recover to the same extent as mussels closer to the outlet. The authors suggest that the mussels sampled closer to the MWWTP, have a higher food availability (= improved health status) and/or pre-exposure to natural disturbances, and the test substances, via the MWWTP effluent.
Kumblad (2015)
Gammarus spp 10, 100, and1,000 µg/l (4 weeks)
>1,000 No significant effects Oskarsson (2012)
*(SFG) Scope for growth: the energy available for normal metabolism
Table A5.4 Effects of ibuprofen on Baltic Sea species LOEC= lowest observable effect concentration.
Source: Original data.
Species Test conditions LOEC (µg/l) Endpoints Reference
Mytilus edulis trossulus
1, 100, 1,000, 5,000 and 10,000 µg/l (1-3 weeks)
1,000 Physiology: lower SFG* after 2 weeks at 1,000 µg/lByssus strength = Control treatmentMortality = Control treatments
Ericson (2010)
Gammarus spp. 1, 1,000, and 10,000 µg/l (1 weeks)
> 10,000 No significant effects Ericson (2011)
Fucus vesiculosus 1, 1,000 and 10,000 µg/l (1 week)
> 10,000 No significant effects Ericson (2011)
Fucus vesiculosus 10, 100, and 1,000 µg/l (4 weeks)
> 1,000 No significant effects Oskarsson (2012)
Gammarus spp. 110, 100, and 1,000 µg/l (4 weeks)
> 1,000 No significant effects. Oskarsson (2012)
*(SFG) Scope for growth: the energy available for normal metabolism
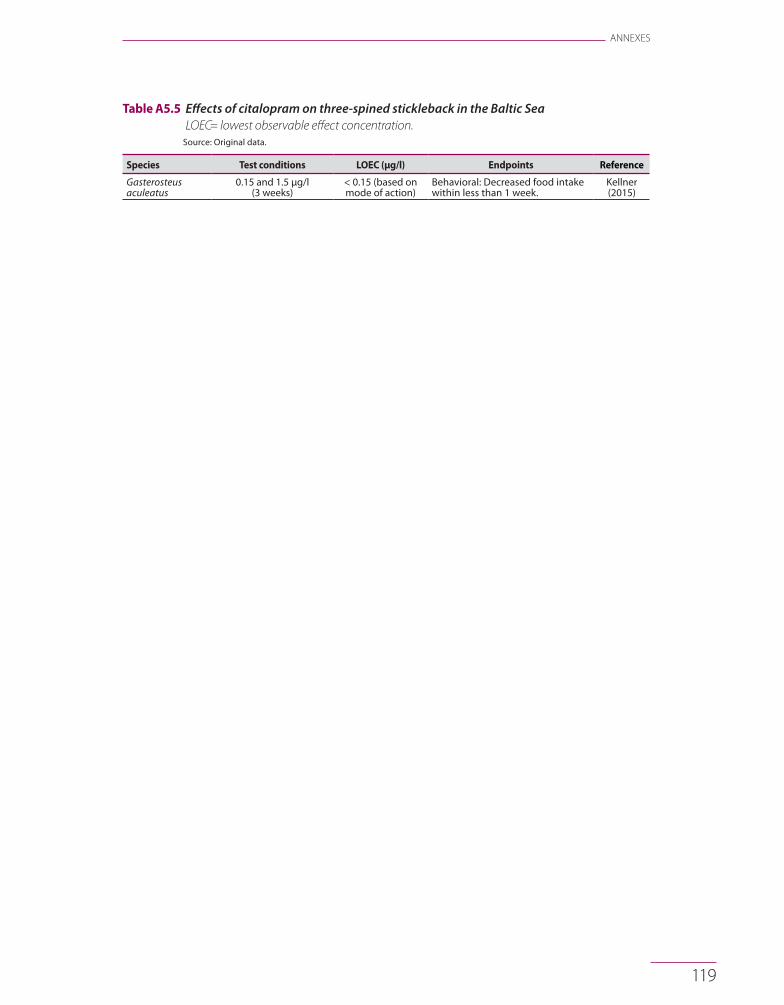
119
ANNEXES
Table A5.5 Effects of citalopram on three-spined stickleback in the Baltic Sea LOEC= lowest observable effect concentration.
Source: Original data.
Species Test conditions LOEC (µg/l) Endpoints Reference
Gasterosteus aculeatus
0.15 and 1.5 µg/l(3 weeks)
< 0.15 (based on mode of action)
Behavioral: Decreased food intake within less than 1 week.
Kellner(2015)

Phar
mac
euti
cals
in th
e aq
uati
c en
viro
nmen
t of t
he B
alti
c Se
a re
gion
EMER
GING
POLL
UTAN
TS IN
WAT
ER
International Hydrological Programme
United NationsEducational, Scientific and
Cultural Organization
International Initiative on Water Quality
Pharmaceuticals in the aquatic
environment of the Baltic Sea region
A status report
International Initiative on Water Quality – IIWQ
The International Initiative on Water Quality (IIWQ) was established by the official endorsement by the Intergovernmental Council of the International Hydrological Programme (IHP) of UNESCO at its 20th session in 2012 (Resolution XX-4), following recommendations of IHP Regional Consultation Meetings on Water Quality.
The IIWQ supports Member States in protecting, enhancing and sustainably managing the quality of the world’s freshwater resources by mobilizing, generating and disseminating scientific knowledge, providing policy advice and advocacy, promoting international scientific cooperation and raising awareness on water quality. It implements activities and projects focusing on specific water quality issues in both developing and developed countries to respond to global water quality challenges in a holistic interdisciplinary, participatory and cooperative way towards ensuring water security for sustainable development.
For more information: http://en.unesco.org/waterquality-iiwq
http://en.unesco.org/emergingpollutants
This publication is published in the framework of UNESCO Project on Emerging Pollutants in Wastewater Reuse in Developing Countries,
funded by the Government of Sweden.
International Hydrological Programme
United NationsEducational, Scientific and
Cultural Organization
InternationalInitiative onWater Quality 9 789231 002137
1
1 EMERGING POLLUTANTS IN WATER SERIES