Pesticide Residue Analysis Webinar Series: Tips and Tricks for the Whole Workflow
46
Pesticide Residue Analysis Webinar Series PART TWO: Workflow Guide for the Use of LCMS Richard Fussell Vertical Marketing Manager, Food and Beverage Claudia Martins Applications Program Manager, Environmental and Food Safety
-
Upload
chromatography-mass-spectrometry-solutions -
Category
Science
-
view
228 -
download
13
Transcript of Pesticide Residue Analysis Webinar Series: Tips and Tricks for the Whole Workflow
Pesticide Residue Analysis Webinar Series PART TWO: Workflow Guide for the Use of LCMS
Richard Fussell Vertical Marketing Manager, Food and Beverage Claudia Martins Applications Program Manager, Environmental and Food Safety
2
Webinar Series Objectives
• To provide pesticide residue analysts with valuable information on development and optimization of method workflows for the analysis of pesticide residues in food.
• To understand the challenges, limitations and advantages of multi-residue workflows for pesticides residues in food
• To review the latest developments in: • sample preparation • targeted and screening techniques using GC-MS/MS and LC-MS/MS • software advances to help with data interpretation and reporting.
3
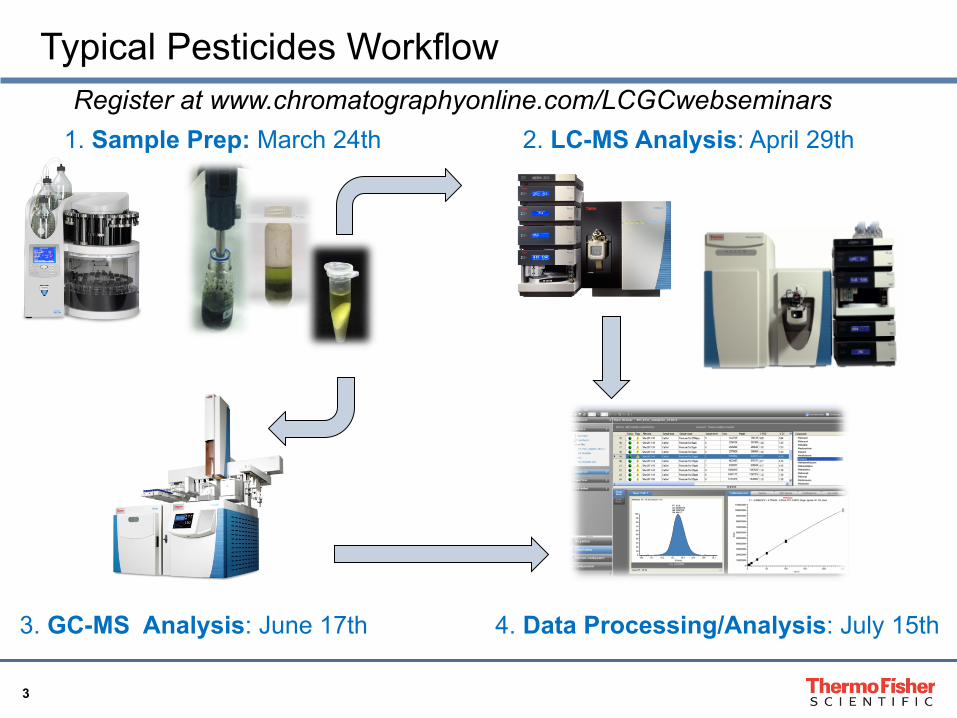
1. Sample Prep: March 24th 2. LC-MS Analysis: April 29th
3. GC-MS Analysis: June 17th 4. Data Processing/Analysis: July 15th
Typical Pesticides Workflow Register at www.chromatographyonline.com/LCGCwebseminars
4
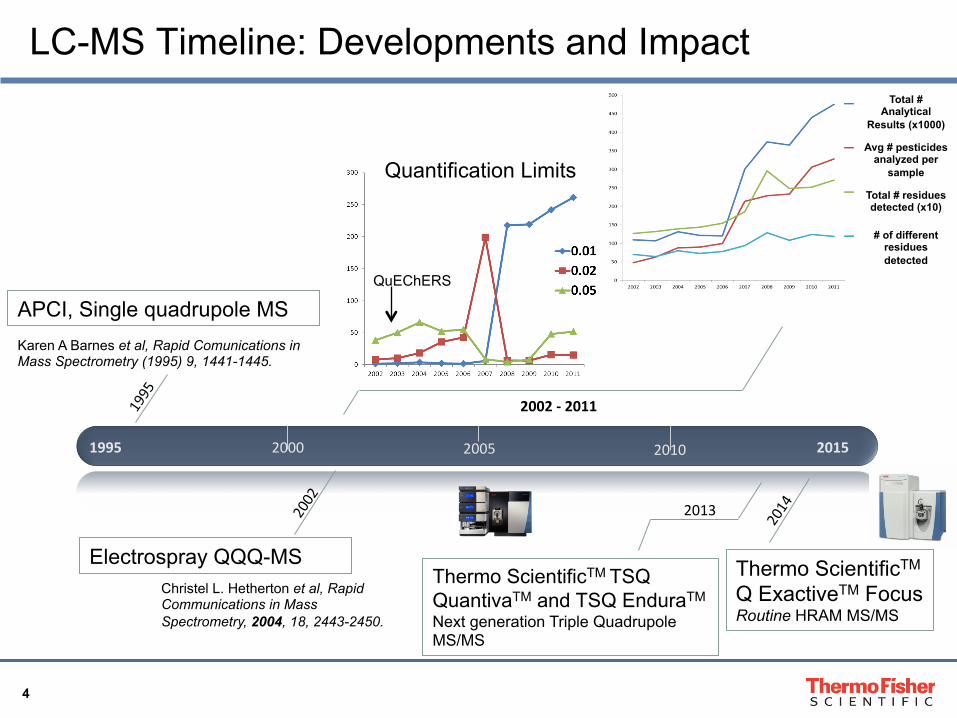
Thermo ScientificTM TSQ QuantivaTM and TSQ EnduraTM Next generation Triple Quadrupole MS/MS
LC-MS Timeline: Developments and Impact
Electrospray QQQ-MS
1995 2015
APCI, Single quadrupole MS Karen A Barnes et al, Rapid Comunications in Mass Spectrometry (1995) 9, 1441-1445.
Christel L. Hetherton et al, Rapid Communications in Mass Spectrometry, 2004, 18, 2443-2450.
Quantification Limits
QuEChERS
2002 -‐ 2011
Total # Analytical
Results (x1000)
Avg # pesticides analyzed per
sample
Total # residues detected (x10)
# of different residues detected
Thermo ScientificTM
Q ExactiveTM Focus Routine HRAM MS/MS
2013
2000 2005 2010
5
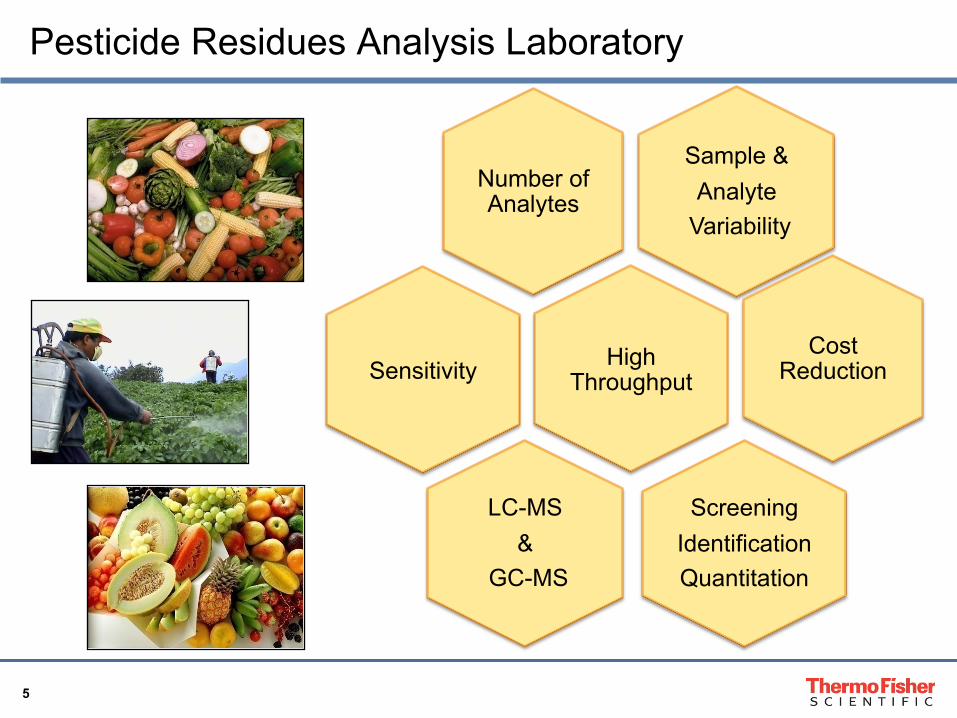
Pesticide Residues Analysis Laboratory
Sample & Analyte
Variability
Number of Analytes
High Throughput
Cost Reduction
Screening Identification Quantitation
LC-MS &
GC-MS
Sensitivity
6
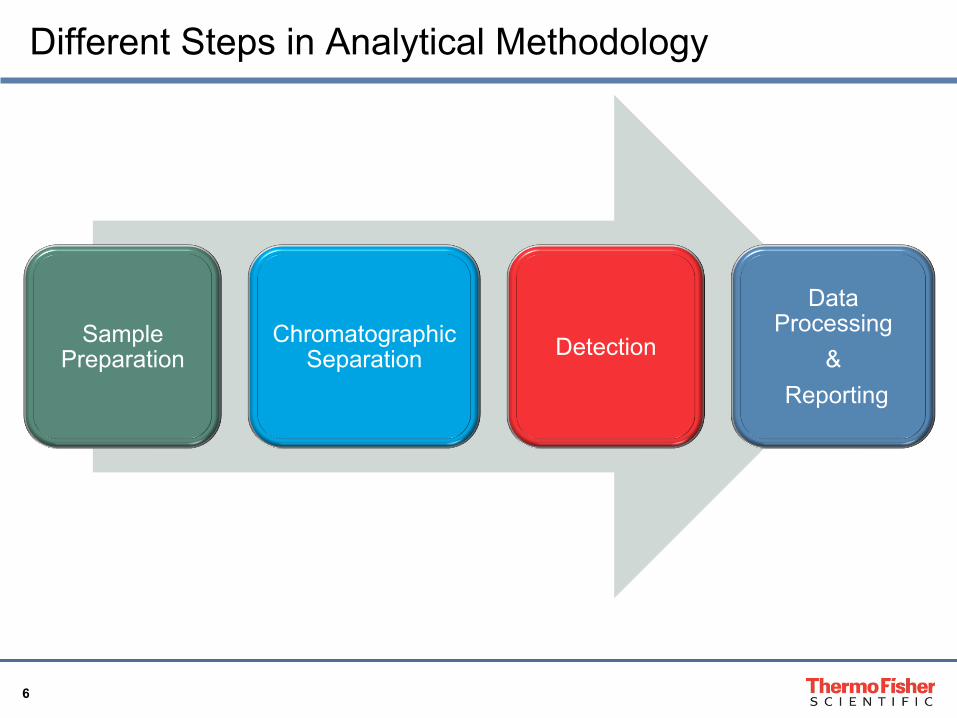
Different Steps in Analytical Methodology
Sample Preparation
Chromatographic Separation Detection
Data Processing
& Reporting
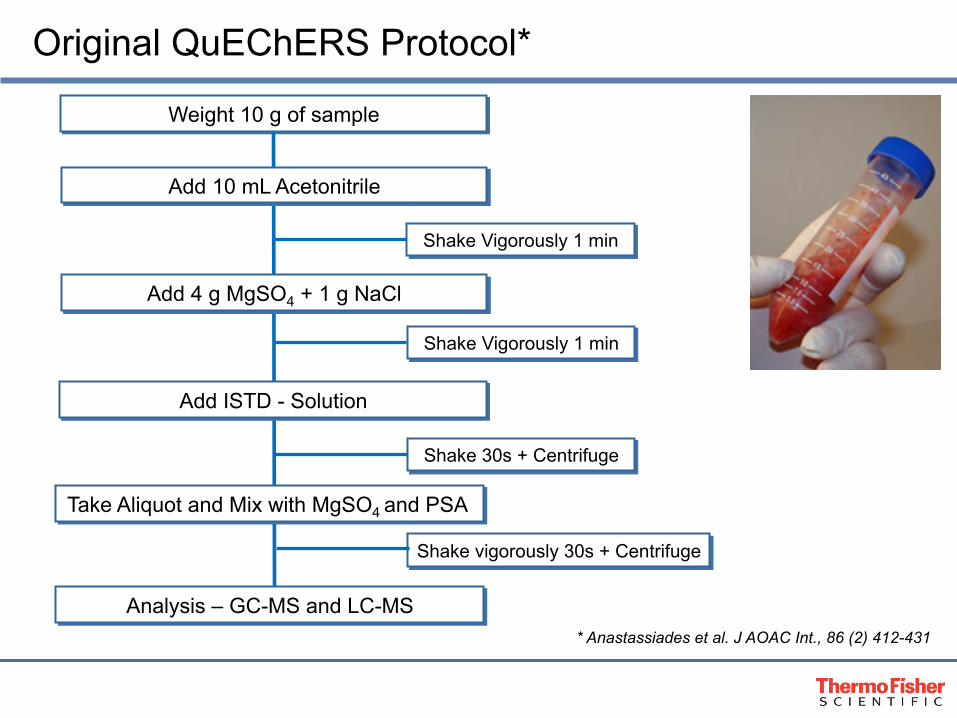
Original QuEChERS Protocol*
Weight 10 g of sample
* Anastassiades et al. J AOAC Int., 86 (2) 412-431
Analysis – GC-MS and LC-MS
Shake Vigorously 1 min
Shake Vigorously 1 min
Shake 30s + Centrifuge
Shake vigorously 30s + Centrifuge
Add 10 mL Acetonitrile
Add ISTD - Solution
Add 4 g MgSO4 + 1 g NaCl
Take Aliquot and Mix with MgSO4 and PSA
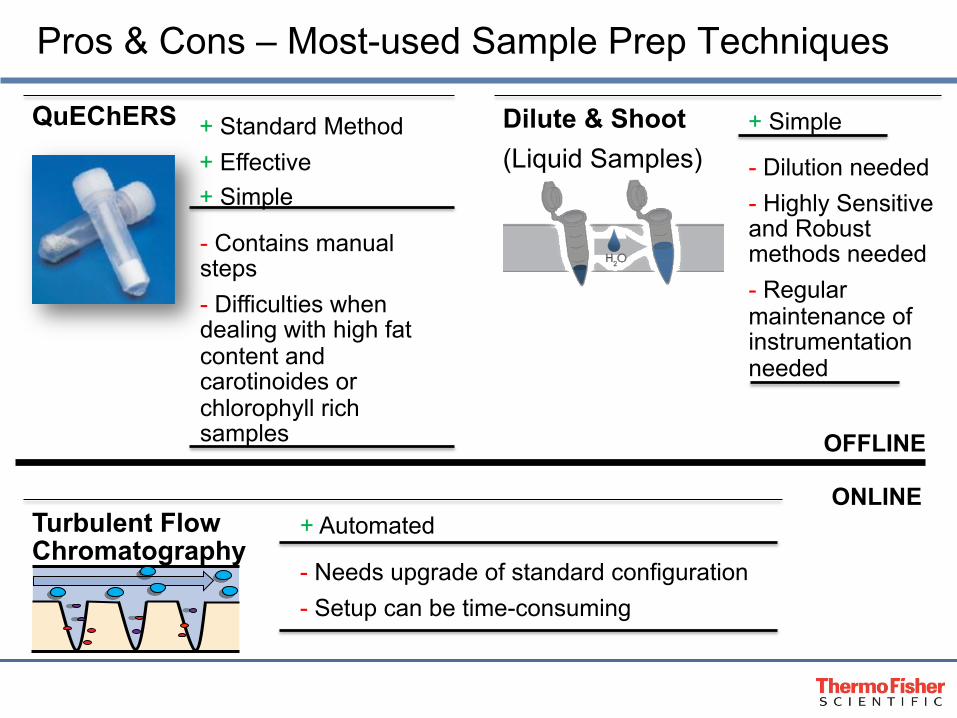
Pros & Cons – Most-used Sample Prep Techniques
QuEChERS + Standard Method + Effective + Simple
- Contains manual steps - Difficulties when dealing with high fat content and carotinoides or chlorophyll rich samples
Dilute & Shoot (Liquid Samples)
+ Simple
- Dilution needed - Highly Sensitive and Robust methods needed - Regular maintenance of instrumentation needed
Turbulent Flow Chromatography
+ Automated
- Needs upgrade of standard configuration - Setup can be time-consuming
OFFLINE
ONLINE
9 9
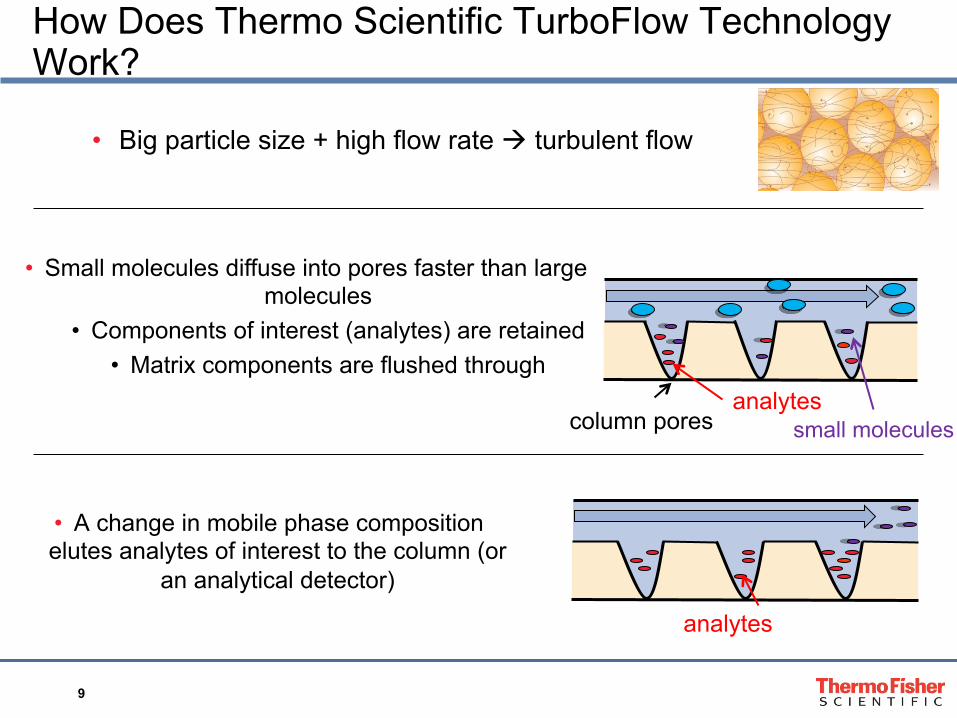
How Does Thermo Scientific TurboFlow Technology Work?
• Big particle size + high flow rate turbulent flow
• Small molecules diffuse into pores faster than large molecules
• Components of interest (analytes) are retained • Matrix components are flushed through
• A change in mobile phase composition elutes analytes of interest to the column (or
an analytical detector)
small molecules column pores analytes
analytes
10 10
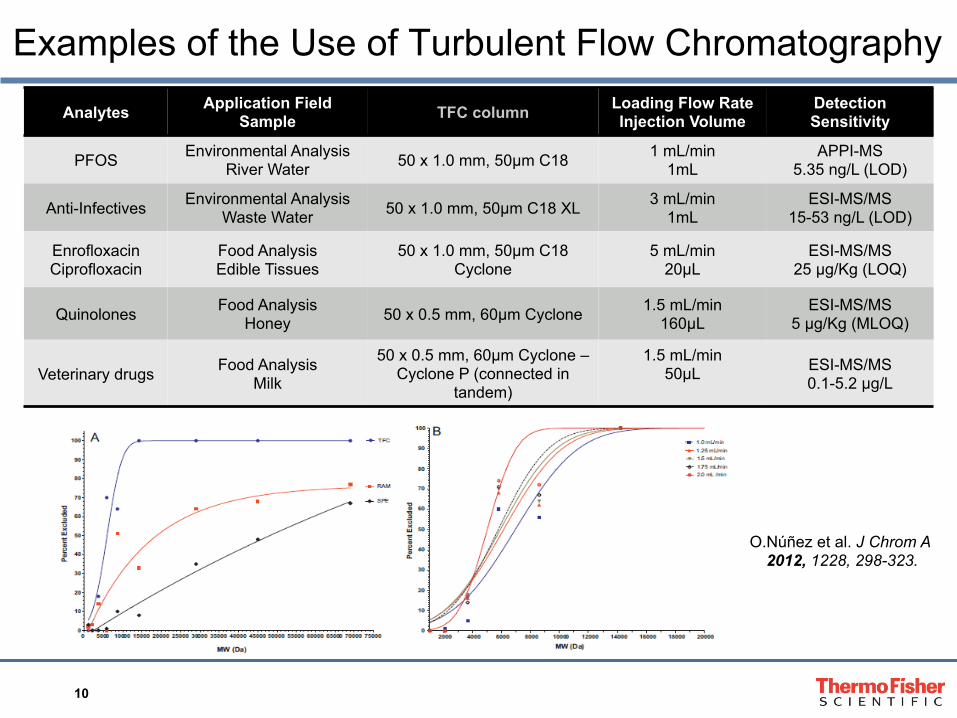
Examples of the Use of Turbulent Flow Chromatography
Analytes Application Field Sample TFC column Loading Flow Rate
Injection Volume Detection Sensitivity
PFOS Environmental Analysis River Water 50 x 1.0 mm, 50µm C18 1 mL/min
1mL APPI-MS
5.35 ng/L (LOD)
Anti-Infectives Environmental Analysis Waste Water 50 x 1.0 mm, 50µm C18 XL 3 mL/min
1mL ESI-MS/MS
15-53 ng/L (LOD)
Enrofloxacin Ciprofloxacin
Food Analysis Edible Tissues
50 x 1.0 mm, 50µm C18 Cyclone
5 mL/min 20µL
ESI-MS/MS 25 µg/Kg (LOQ)
Quinolones Food Analysis Honey 50 x 0.5 mm, 60µm Cyclone 1.5 mL/min
160µL ESI-MS/MS
5 µg/Kg (MLOQ)
Veterinary drugs Food Analysis Milk
50 x 0.5 mm, 60µm Cyclone – Cyclone P (connected in
tandem)
1.5 mL/min 50µL
ESI-MS/MS 0.1-5.2 µg/L
O.Núñez et al. J Chrom A 2012, 1228, 298-323.
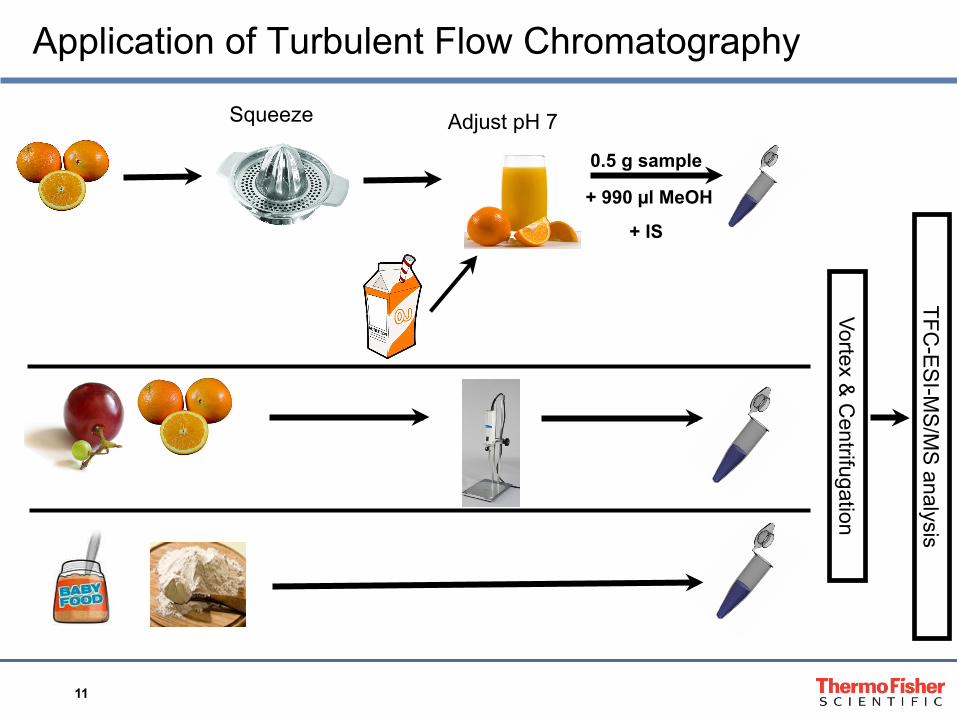
11 11
Vortex & C
entrifugation
0.5 g sample
+ 990 µl MeOH
+ IS
Squeeze Adjust pH 7
Application of Turbulent Flow Chromatography TFC
-ES
I-MS
/MS
analysis
12 12
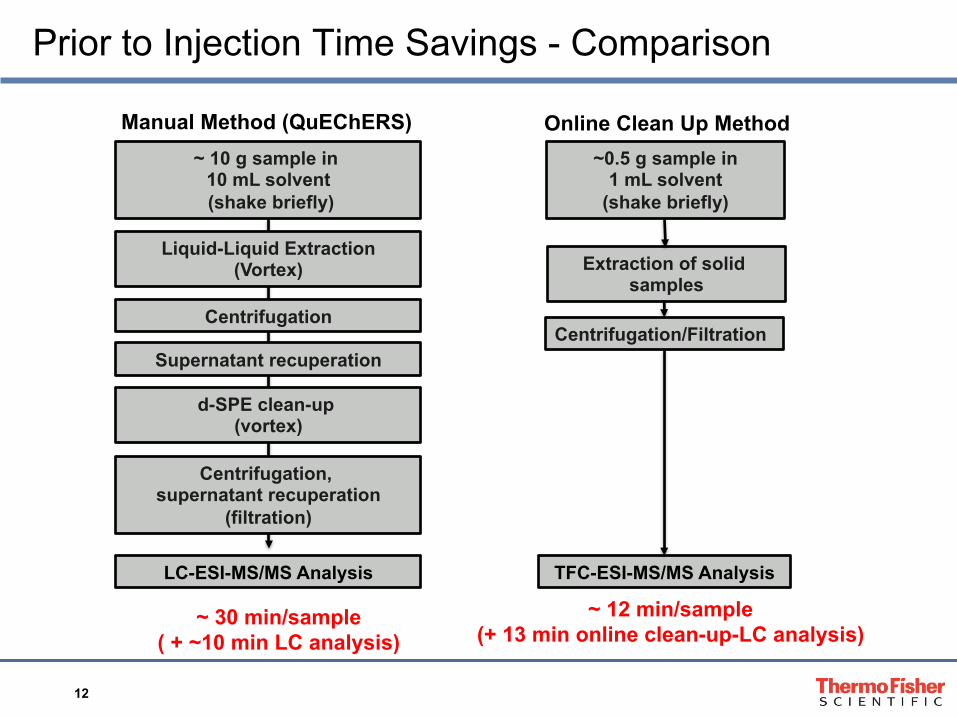
Prior to Injection Time Savings - Comparison
Online Clean Up Method
Centrifugation/Filtration
~0.5 g sample in 1 mL solvent
(shake briefly)
TFC-ESI-MS/MS Analysis
~ 12 min/sample (+ 13 min online clean-up-LC analysis)
Manual Method (QuEChERS)
d-SPE clean-up (vortex)
Supernatant recuperation
Liquid-Liquid Extraction (Vortex)
Centrifugation
~ 10 g sample in 10 mL solvent (shake briefly)
Centrifugation, supernatant recuperation
(filtration)
~ 30 min/sample ( + ~10 min LC analysis)
LC-ESI-MS/MS Analysis
Extraction of solid samples
13 13
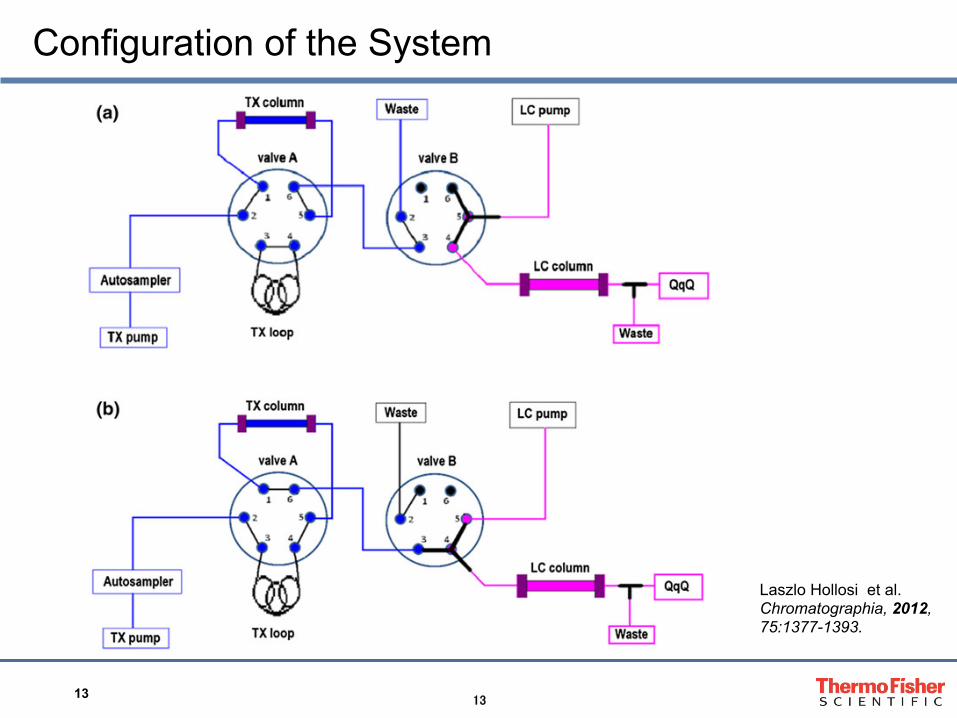
Configuration of the System
Laszlo Hollosi et al. Chromatographia, 2012, 75:1377-1393.
0
0
50
100
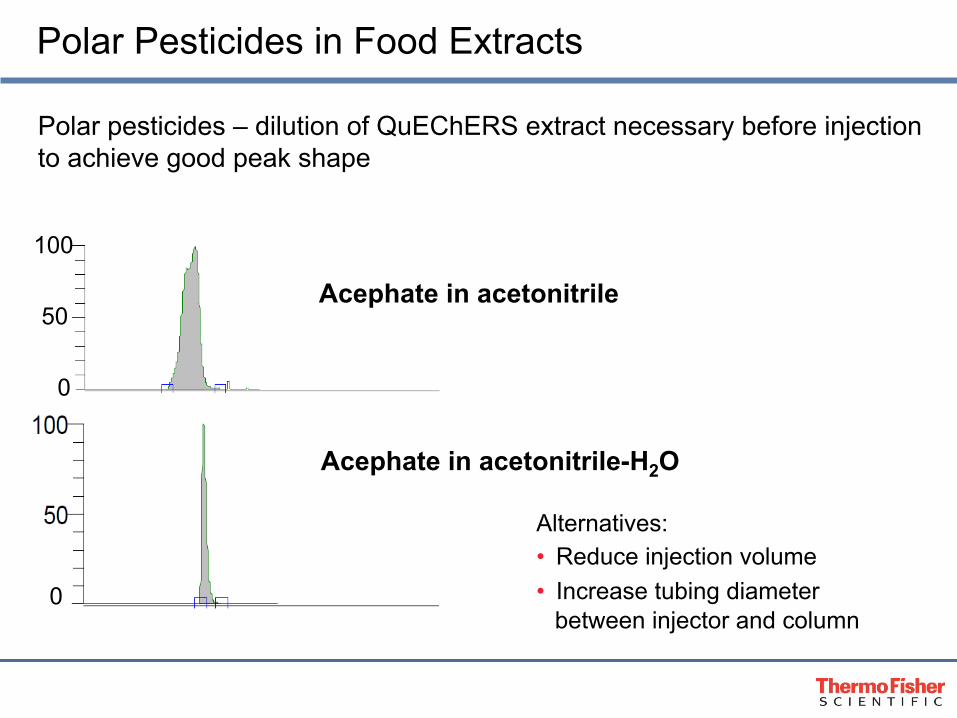
Polar Pesticides in Food Extracts
Acephate in acetonitrile
Acephate in acetonitrile-H2O
Polar pesticides – dilution of QuEChERS extract necessary before injection to achieve good peak shape
Alternatives: • Reduce injection volume • Increase tubing diameter
between injector and column
Time (min)
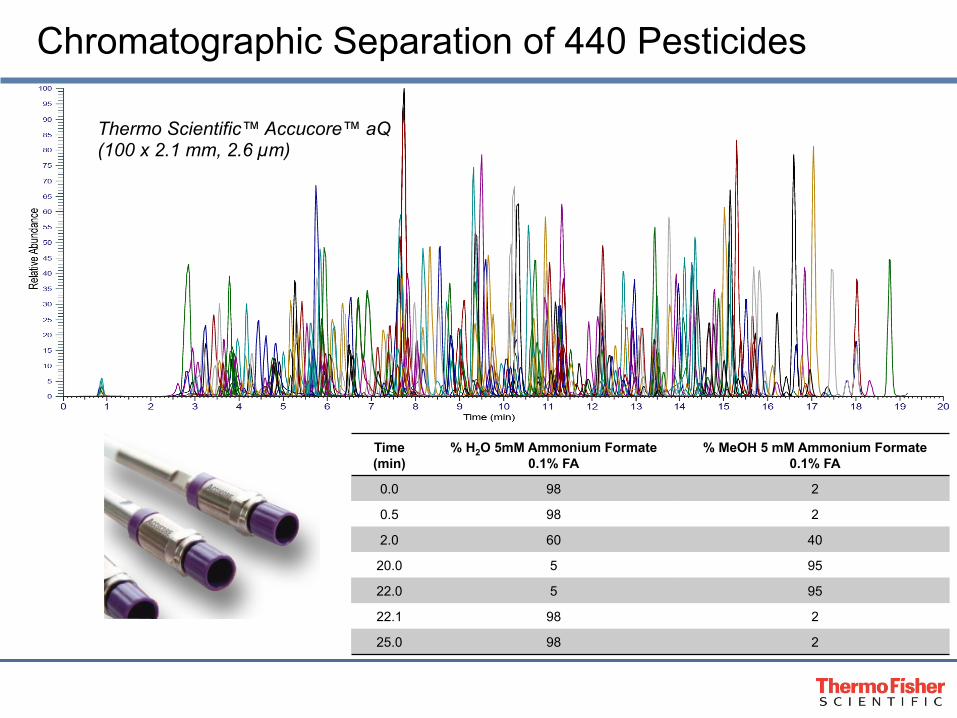
% H2O 5mM Ammonium Formate 0.1% FA
% MeOH 5 mM Ammonium Formate 0.1% FA
0.0 98 2
0.5 98 2
2.0 60 40
20.0 5 95
22.0 5 95
22.1 98 2
25.0 98 2
Thermo Scientific™ Accucore™ aQ (100 x 2.1 mm, 2.6 µm)
Chromatographic Separation of 440 Pesticides
0.0 1.0 2.0 3.0 4.0 5.0 6.0 7.0 8.0 Time (min)
0
50
100 0.64
Rel
ativ
e A
bund
ance
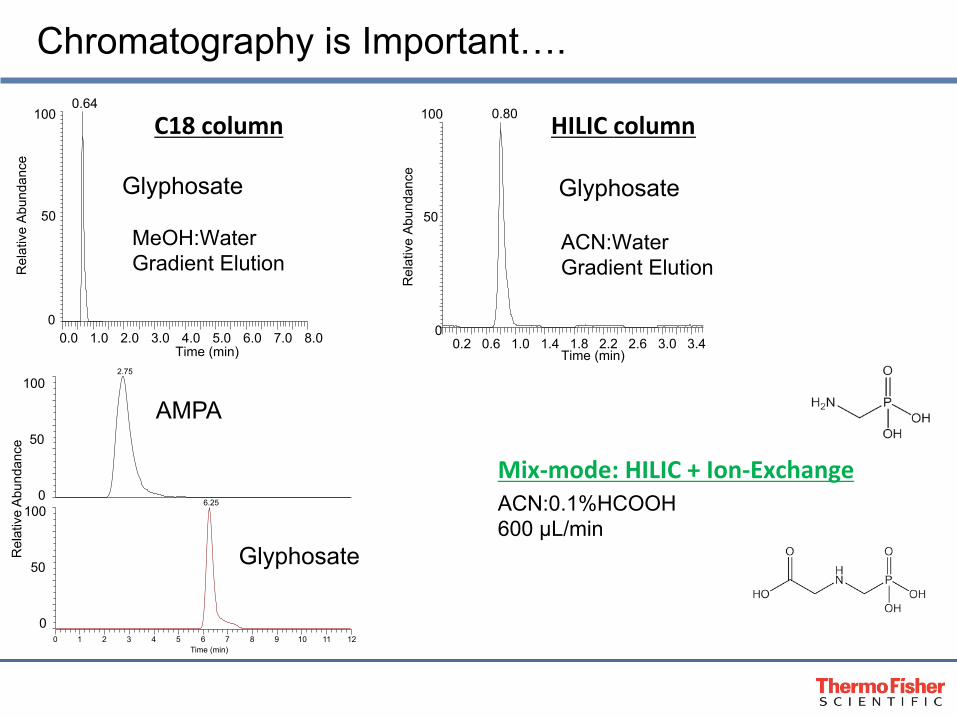
Glyphosate
MeOH:Water Gradient Elution
C18 column
0.2 0.6 1.0 1.4 1.8 2.2 2.6 3.0 3.4 Time (min)
0
50
100 0.80
Rel
ativ
e A
bund
ance
Glyphosate
ACN:Water Gradient Elution
HILIC column
Mix-‐mode: HILIC + Ion-‐Exchange ACN:0.1%HCOOH 600 µL/min
AMPA
Glyphosate
0 1 2 3 4 5 6 7 8 9 10 11 12 Time (min)
Rel
ativ
e A
bund
ance
2.75
6.25
Chromatography is Important….
0
50
100
0
50
100
17 17
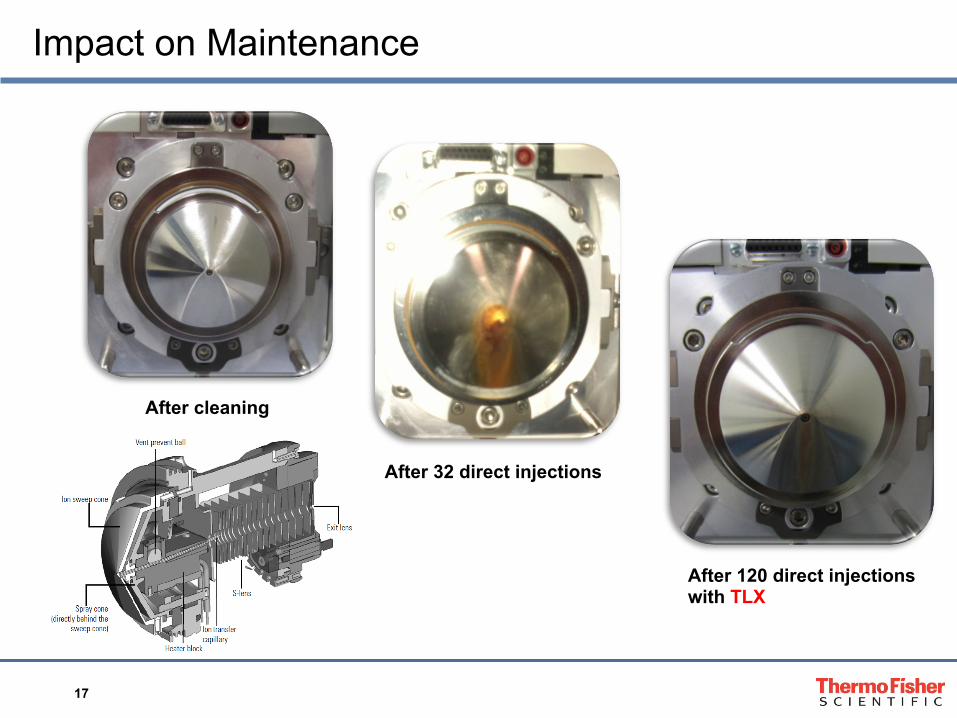
Impact on Maintenance
After cleaning
After 32 direct injections
After 120 direct injections with TLX
18 18
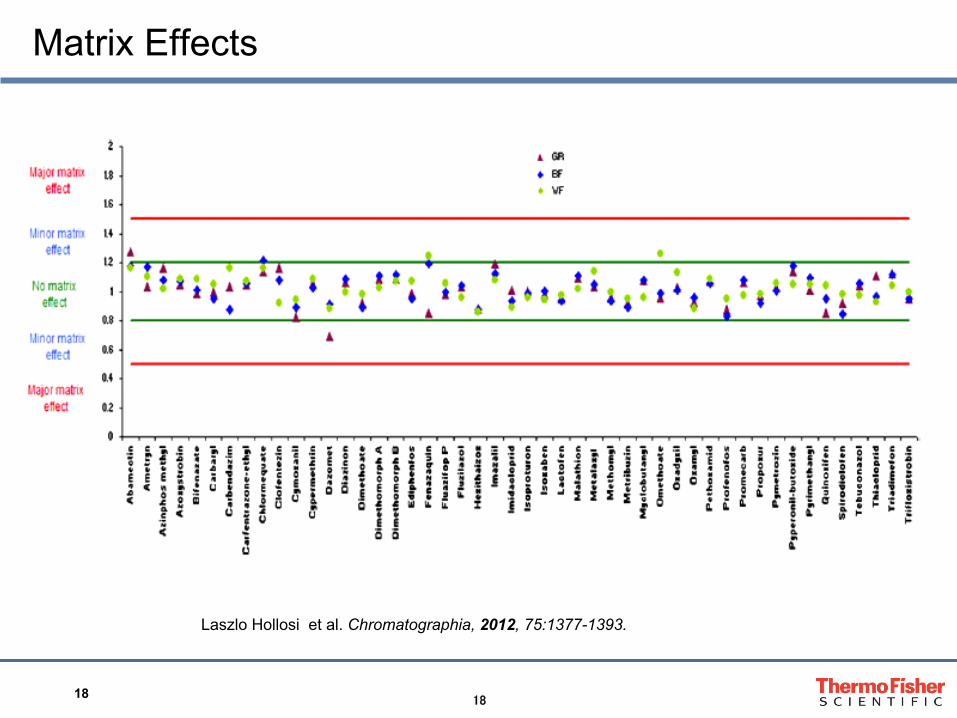
Matrix Effects
Laszlo Hollosi et al. Chromatographia, 2012, 75:1377-1393.
19 19
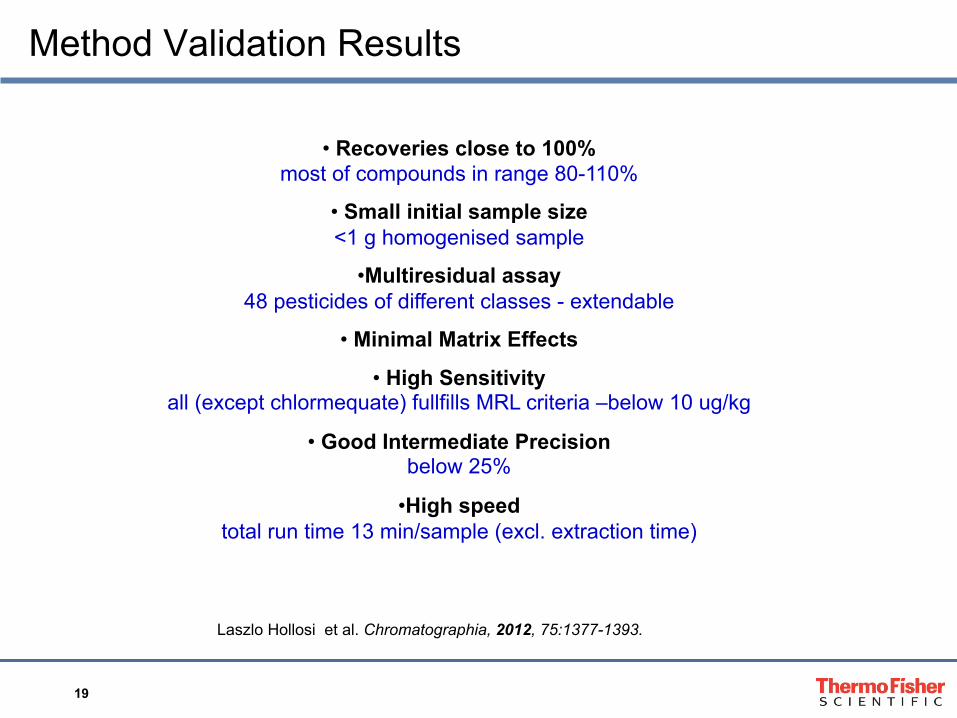
• Recoveries close to 100% most of compounds in range 80-110%
• Small initial sample size <1 g homogenised sample
• Multiresidual assay 48 pesticides of different classes - extendable
• Minimal Matrix Effects
• High Sensitivity all (except chlormequate) fullfills MRL criteria –below 10 ug/kg
• Good Intermediate Precision below 25%
• High speed total run time 13 min/sample (excl. extraction time)
Method Validation Results
Laszlo Hollosi et al. Chromatographia, 2012, 75:1377-1393.
20 20
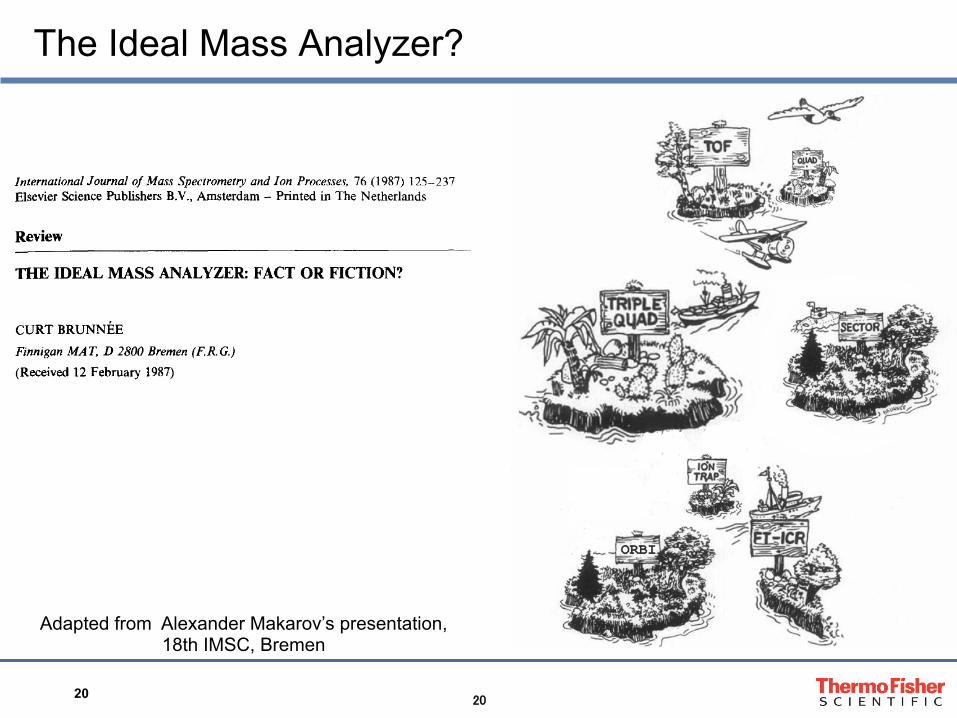
Adapted from Alexander Makarov’s presentation, 18th IMSC, Bremen
The Ideal Mass Analyzer?
21
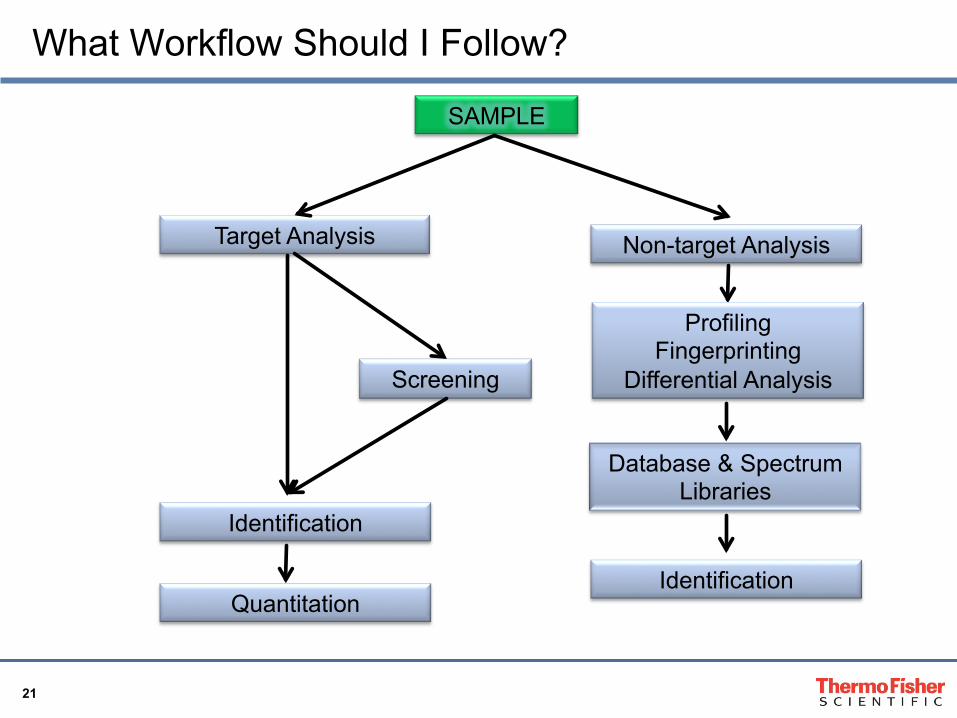
What Workflow Should I Follow?
SAMPLE
Target Analysis Non-target Analysis
Identification
Screening
Profiling Fingerprinting
Differential Analysis
Database & Spectrum Libraries
Identification Quantitation
22
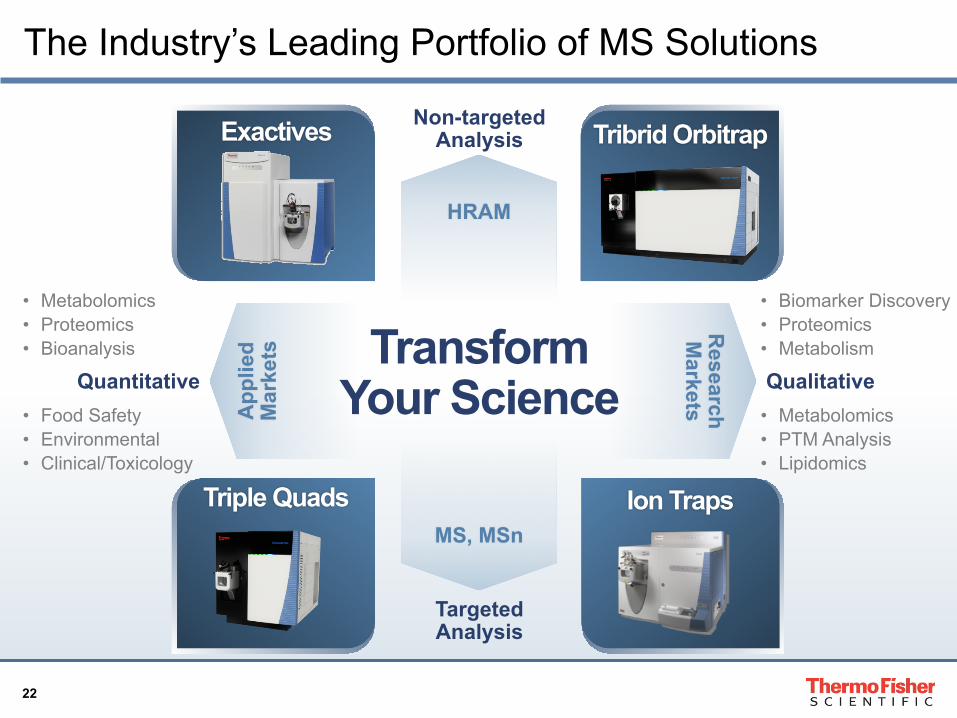
The Industry’s Leading Portfolio of MS Solutions
HRAM
MS, MSn
App
lied
Mar
kets
Research
Markets
Non-targeted Analysis
Targeted Analysis
Quantitative Qualitative
• Biomarker Discovery • Proteomics • Metabolism
• Metabolomics • Proteomics • Bioanalysis
• Food Safety • Environmental • Clinical/Toxicology
• Metabolomics • PTM Analysis • Lipidomics
Transform Your Science
Ion Traps Triple Quads
Tribrid Orbitrap Exactives
23
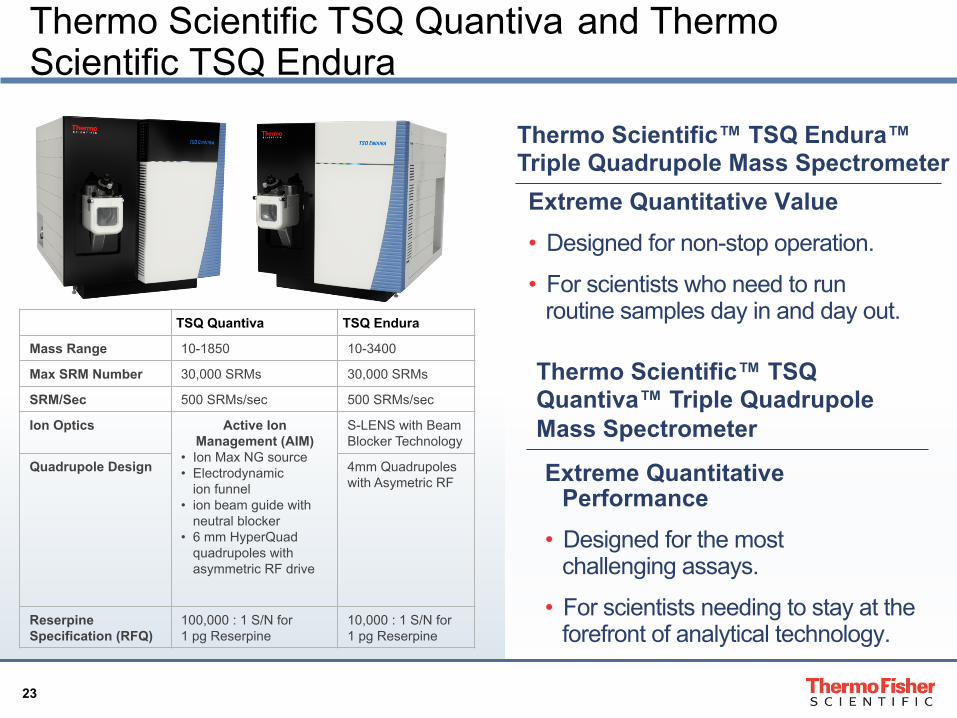
Thermo Scientific TSQ Quantiva and Thermo Scientific TSQ Endura
Thermo Scientific™ TSQ Endura™ Triple Quadrupole Mass Spectrometer
Thermo Scientific™ TSQ Quantiva™ Triple Quadrupole Mass Spectrometer
TSQ Quantiva TSQ Endura
Mass Range 10-1850 10-3400
Max SRM Number 30,000 SRMs 30,000 SRMs
SRM/Sec 500 SRMs/sec 500 SRMs/sec
Ion Optics Active Ion Management (AIM)
• Ion Max NG source • Electrodynamic
ion funnel • ion beam guide with
neutral blocker • 6 mm HyperQuad
quadrupoles with asymmetric RF drive
S-LENS with Beam Blocker Technology
Quadrupole Design 4mm Quadrupoles with Asymetric RF
Reserpine Specification (RFQ)
100,000 : 1 S/N for 1 pg Reserpine
10,000 : 1 S/N for 1 pg Reserpine
Extreme Quantitative Value • Designed for non-stop operation.
• For scientists who need to run routine samples day in and day out.
Extreme Quantitative Performance
• Designed for the most challenging assays.
• For scientists needing to stay at the forefront of analytical technology.
24
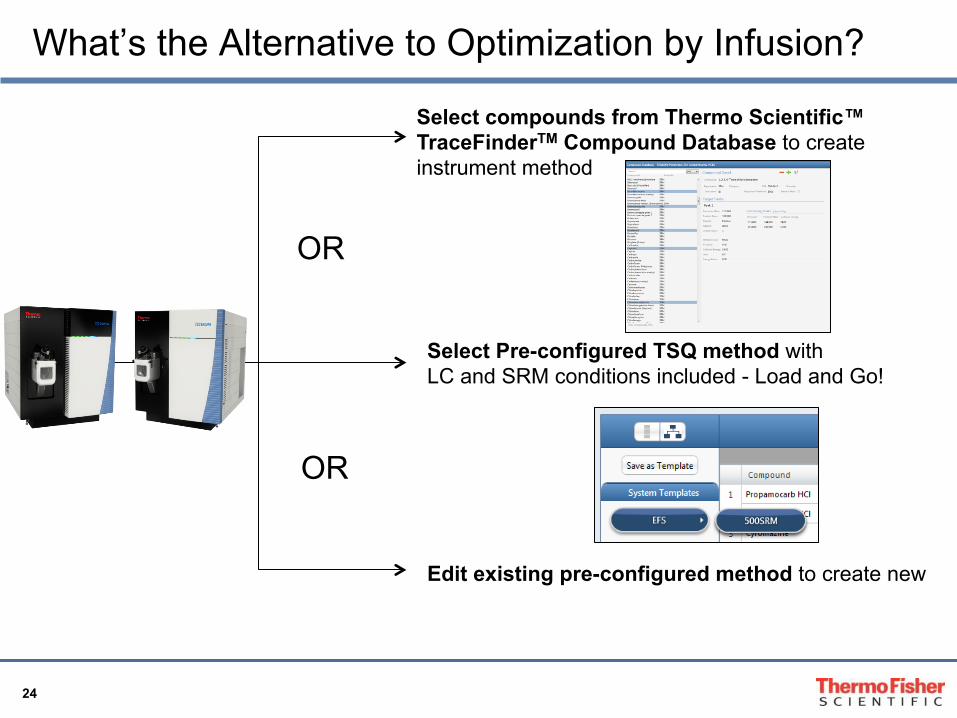
What’s the Alternative to Optimization by Infusion?
Select compounds from Thermo Scientific™ TraceFinderTM Compound Database to create instrument method
Select Pre-configured TSQ method with LC and SRM conditions included - Load and Go!
Edit existing pre-configured method to create new
OR
OR
25
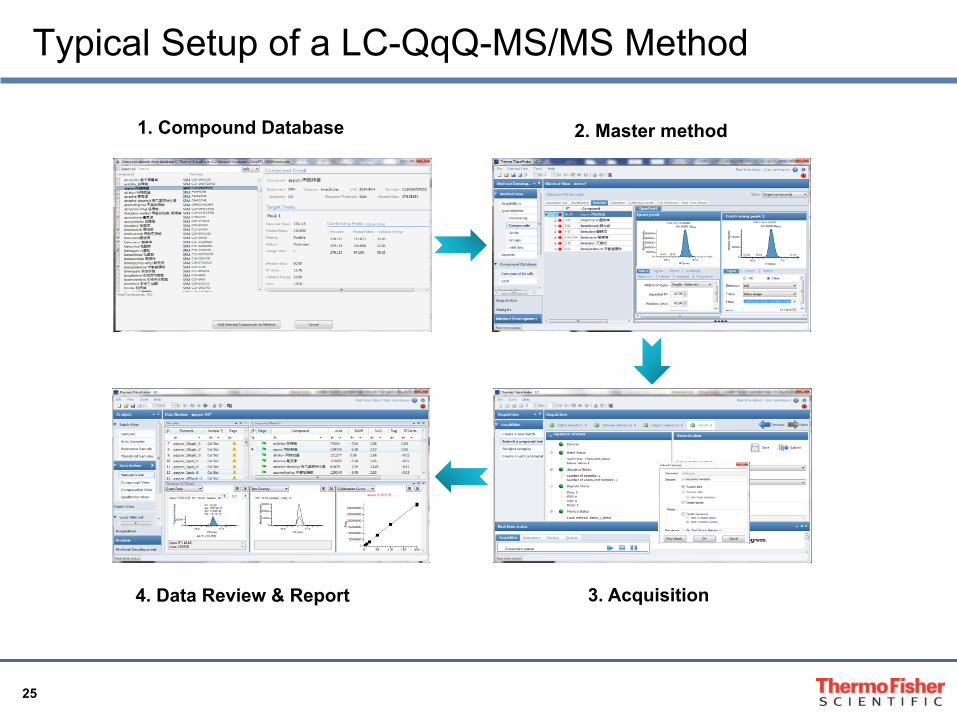
Typical Setup of a LC-QqQ-MS/MS Method
1. Compound Database 2. Master method
4. Data Review & Report 3. Acquisition
26
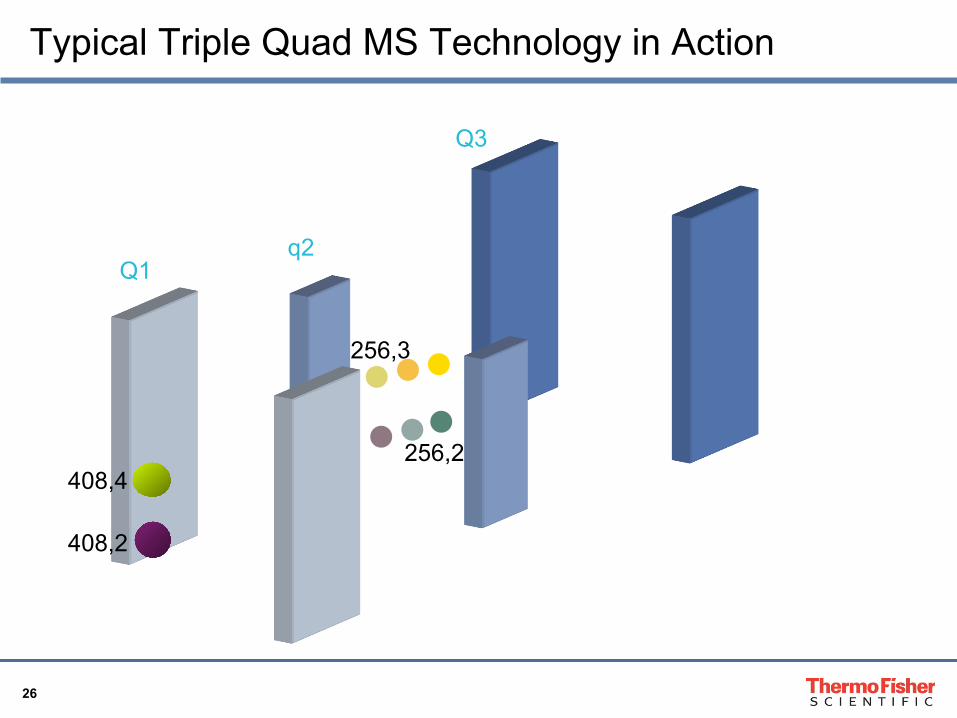
Typical Triple Quad MS Technology in Action
Q1 q2
Q3
408,4
408,2
256,2
256,3
27
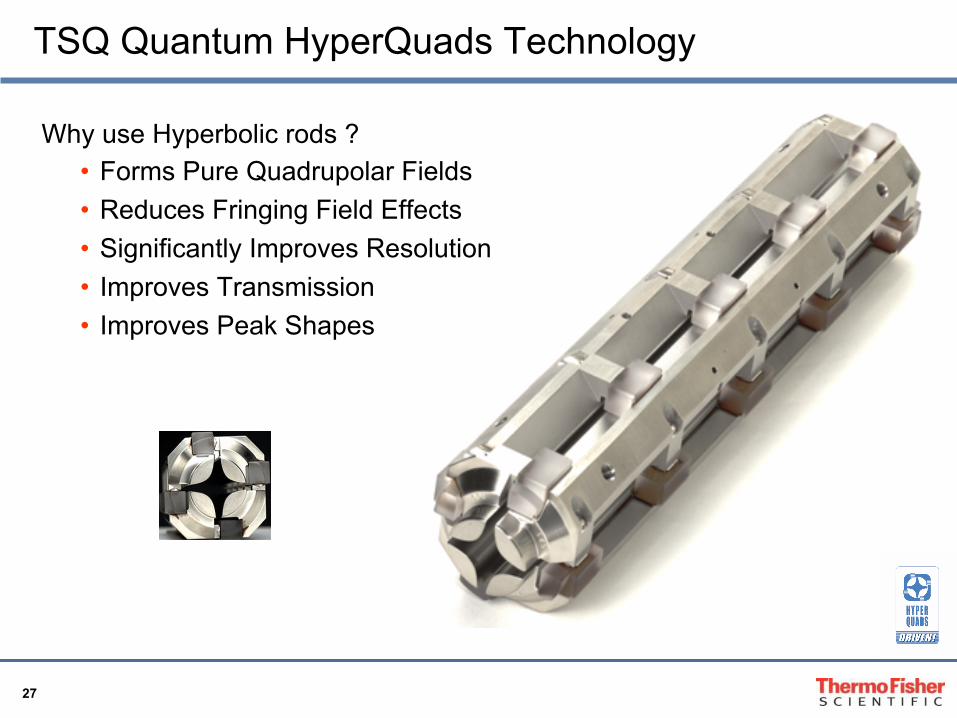
Why use Hyperbolic rods ? • Forms Pure Quadrupolar Fields • Reduces Fringing Field Effects • Significantly Improves Resolution • Improves Transmission • Improves Peak Shapes
TSQ Quantum HyperQuads Technology
28
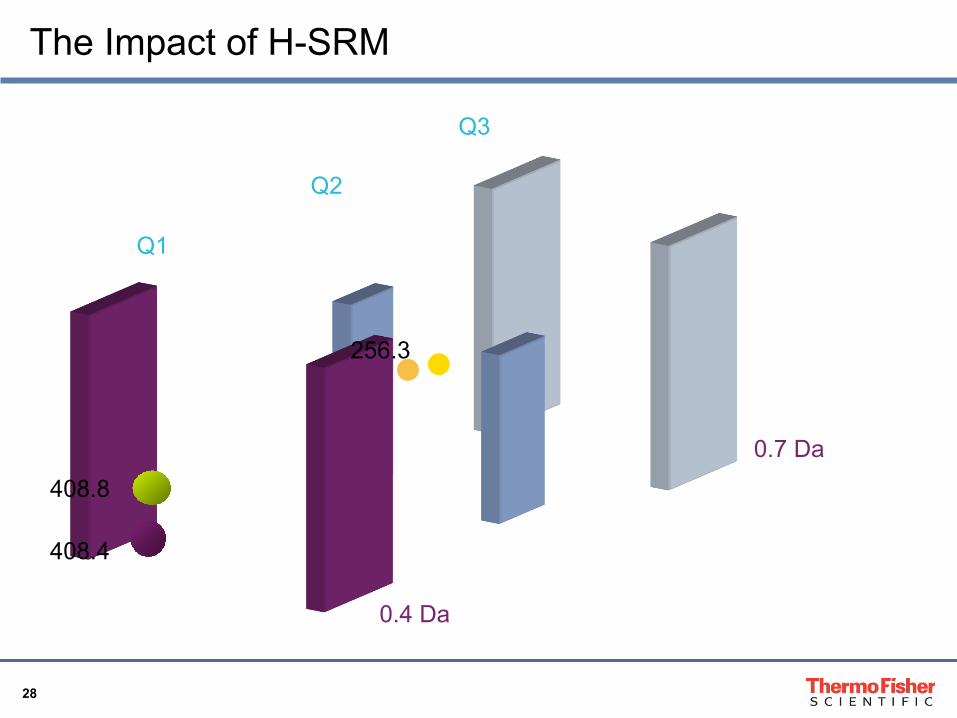
The Impact of H-SRM
Q1
Q2
Q3
408.8
408.4
0.7 Da
256.3
0.4 Da
29
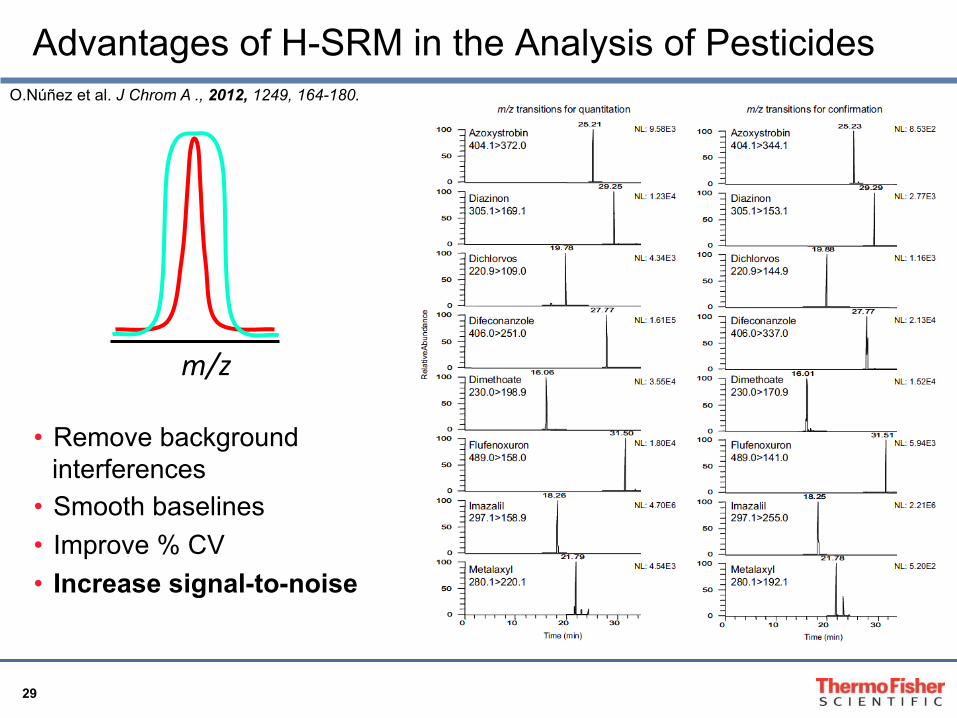
Advantages of H-SRM in the Analysis of Pesticides O.Núñez et al. J Chrom A ., 2012, 1249, 164-180.
m/z
• Remove background interferences
• Smooth baselines • Improve % CV • Increase signal-to-noise
30
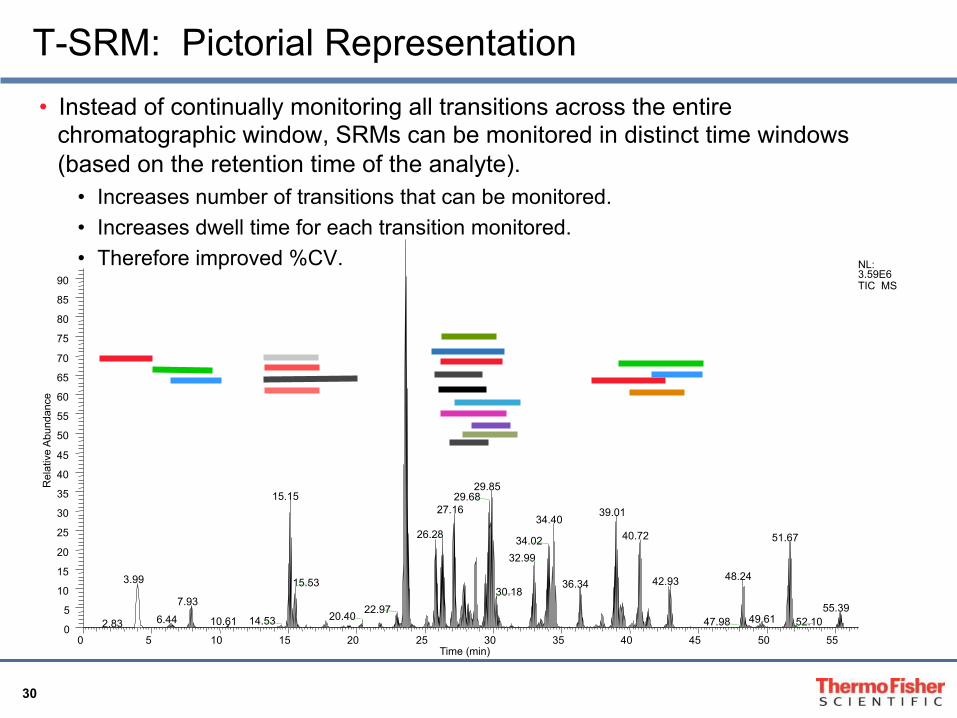
T-SRM: Pictorial Representation
0 5 10 15 20 25 30 35 40 45 50 55 Time (min)
0 5
10 15 20 25 30 35 40 45 50 55 60 65 70 75 80 85 90
Rel
ativ
e A
bund
ance
29.85 15.15 29.68
27.16 39.01 34.40
26.28 40.72 51.67 34.02 32.99
48.24 3.99 42.93 15.53 36.34 30.18
7.93 55.39 22.97 20.40 49.61 6.44 14.53 10.61 47.98 52.10 2.83
NL: 3.59E6 TIC MS
• Instead of continually monitoring all transitions across the entire chromatographic window, SRMs can be monitored in distinct time windows (based on the retention time of the analyte).
• Increases number of transitions that can be monitored. • Increases dwell time for each transition monitored. • Therefore improved %CV.
31
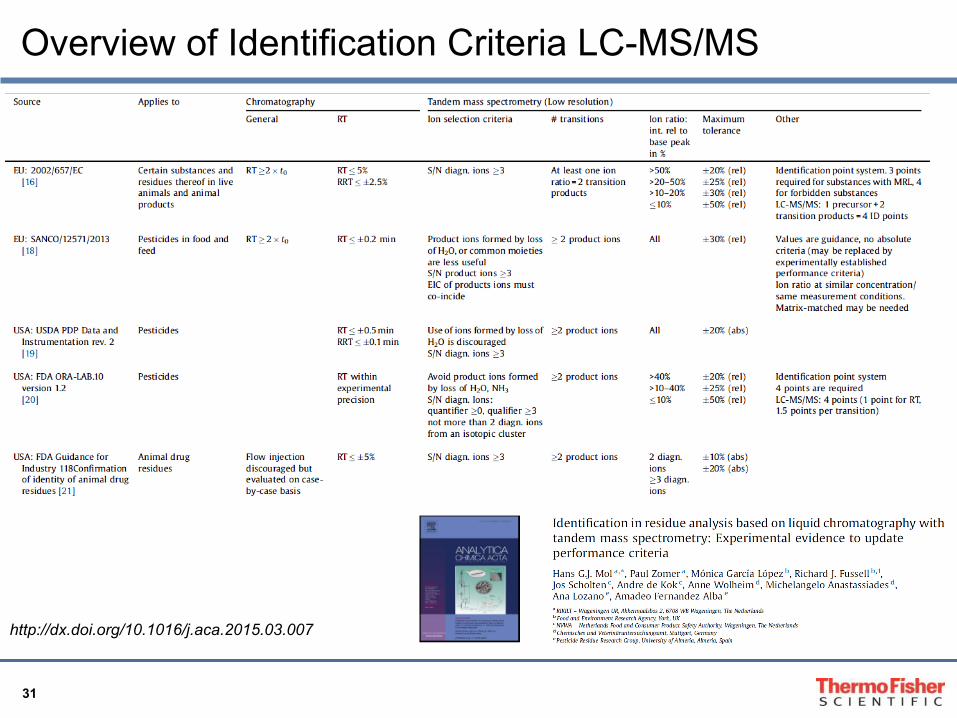
Overview of Identification Criteria LC-MS/MS
http://dx.doi.org/10.1016/j.aca.2015.03.007

32
The Use of QqQ for Pesticide Residue Analysis
• Compatibility with simple sample preparation: QuEChERS, extract-n-shoot • Compatibility with UHPLC • High Sensitivity BUT… • Targeted analysis only • Limited screening capability of MS/MS (~ 200 compounds) • Data evaluation is time consuming • Multiple instruments to cover whole scope of method
33
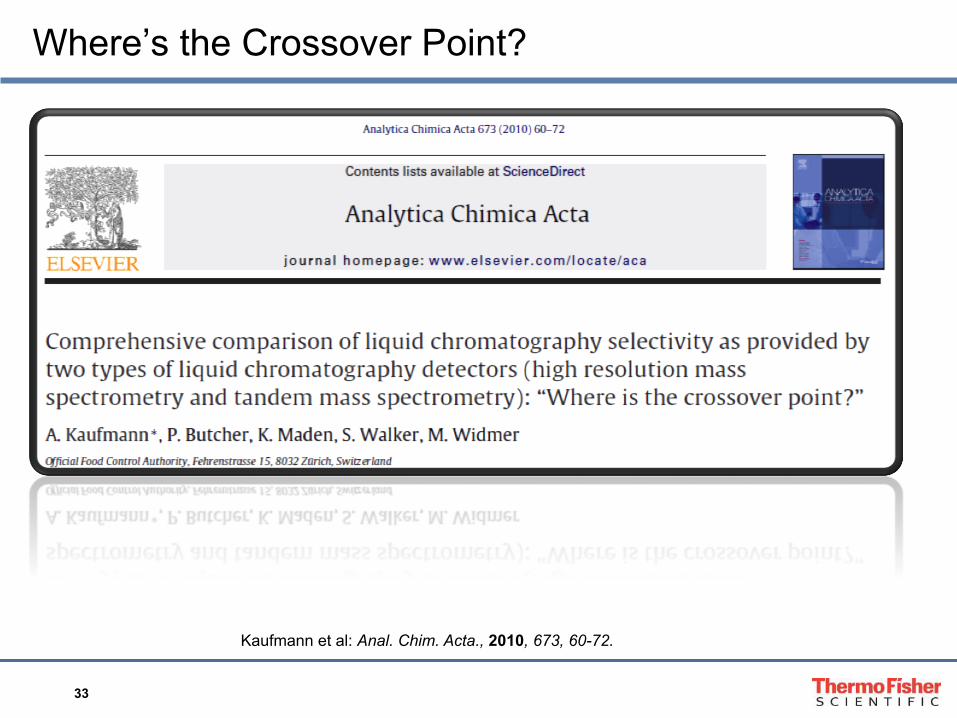
Where’s the Crossover Point?
Kaufmann et al: Anal. Chim. Acta., 2010, 673, 60-72.
34
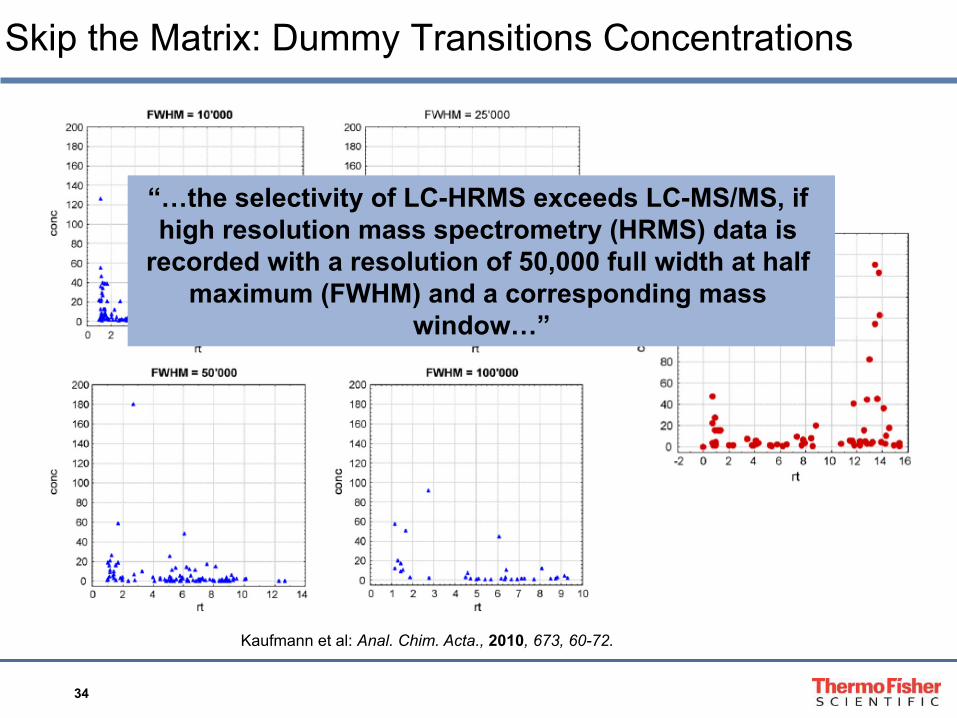
Skip the Matrix: Dummy Transitions Concentrations
“…the selectivity of LC-HRMS exceeds LC-MS/MS, if high resolution mass spectrometry (HRMS) data is
recorded with a resolution of 50,000 full width at half maximum (FWHM) and a corresponding mass
window…”
Kaufmann et al: Anal. Chim. Acta., 2010, 673, 60-72.
35 COMPANY CONFIDENTIAL
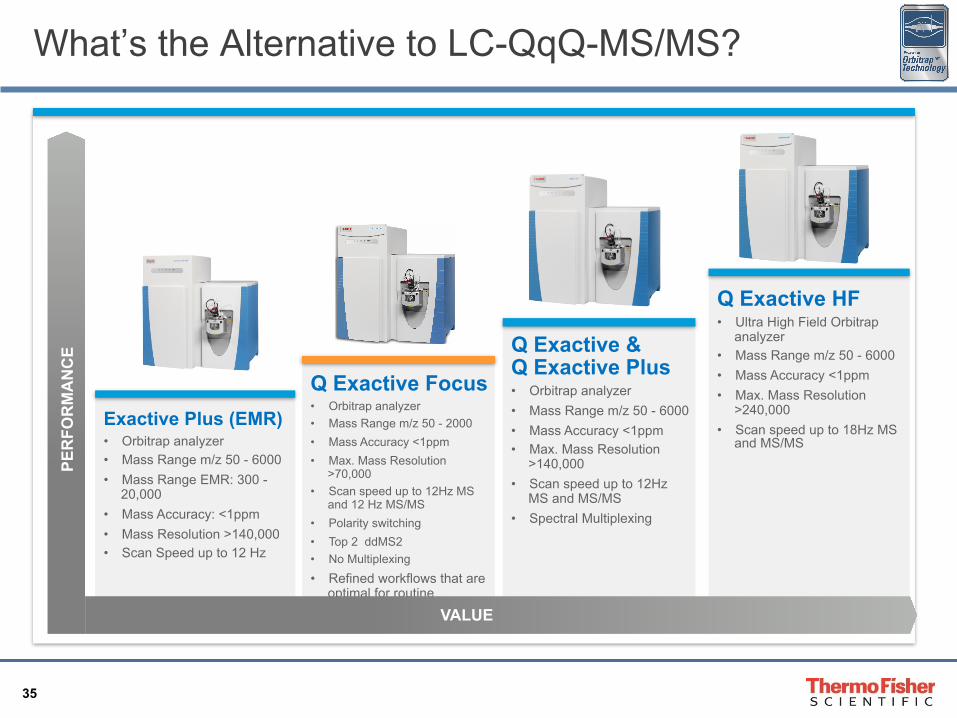
Q Exactive & Q Exactive Plus • Orbitrap analyzer • Mass Range m/z 50 - 6000 • Mass Accuracy <1ppm • Max. Mass Resolution
>140,000 • Scan speed up to 12Hz
MS and MS/MS • Spectral Multiplexing
Q Exactive HF • Ultra High Field Orbitrap
analyzer • Mass Range m/z 50 - 6000 • Mass Accuracy <1ppm • Max. Mass Resolution
>240,000 • Scan speed up to 18Hz MS
and MS/MS
Exactive Plus (EMR) • Orbitrap analyzer • Mass Range m/z 50 - 6000 • Mass Range EMR: 300 -
20,000 • Mass Accuracy: <1ppm • Mass Resolution >140,000 • Scan Speed up to 12 Hz
Q Exactive Focus • Orbitrap analyzer • Mass Range m/z 50 - 2000 • Mass Accuracy <1ppm • Max. Mass Resolution
>70,000 • Scan speed up to 12Hz MS
and 12 Hz MS/MS • Polarity switching • Top 2 ddMS2 • No Multiplexing • Refined workflows that are
optimal for routine laboratories VALUE
PER
FOR
MA
NC
E What’s the Alternative to LC-QqQ-MS/MS?
36
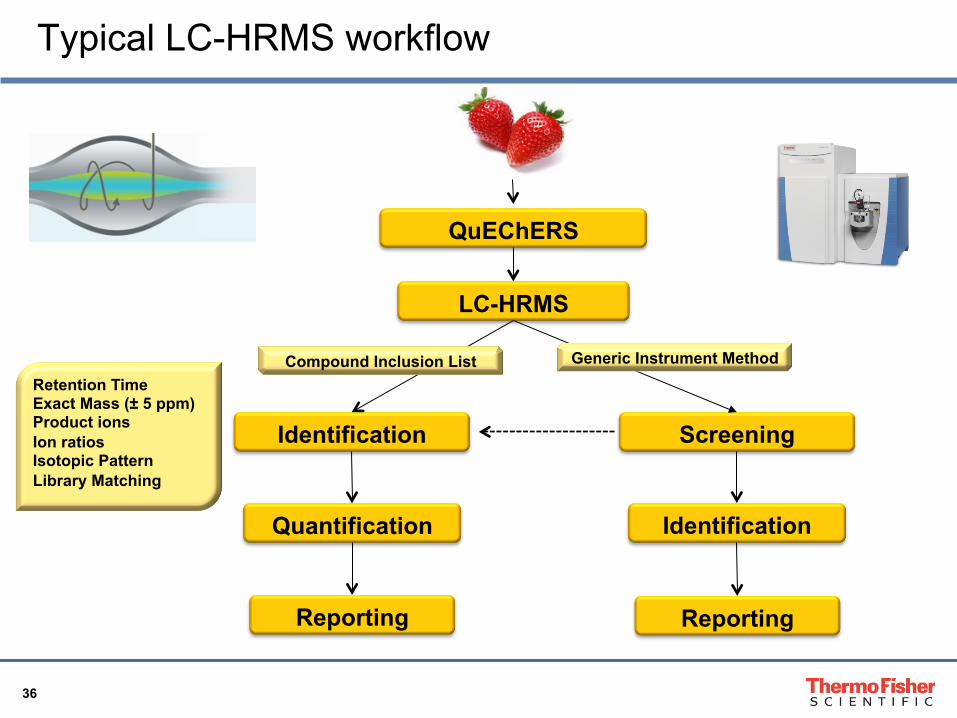
Typical LC-HRMS workflow
QuEChERS
LC-HRMS
Identification
Quantification
Reporting
Retention Time Exact Mass (± 5 ppm) Product ions Ion ratios Isotopic Pattern Library Matching
Compound Inclusion List
Screening
Identification
Reporting
Generic Instrument Method
37
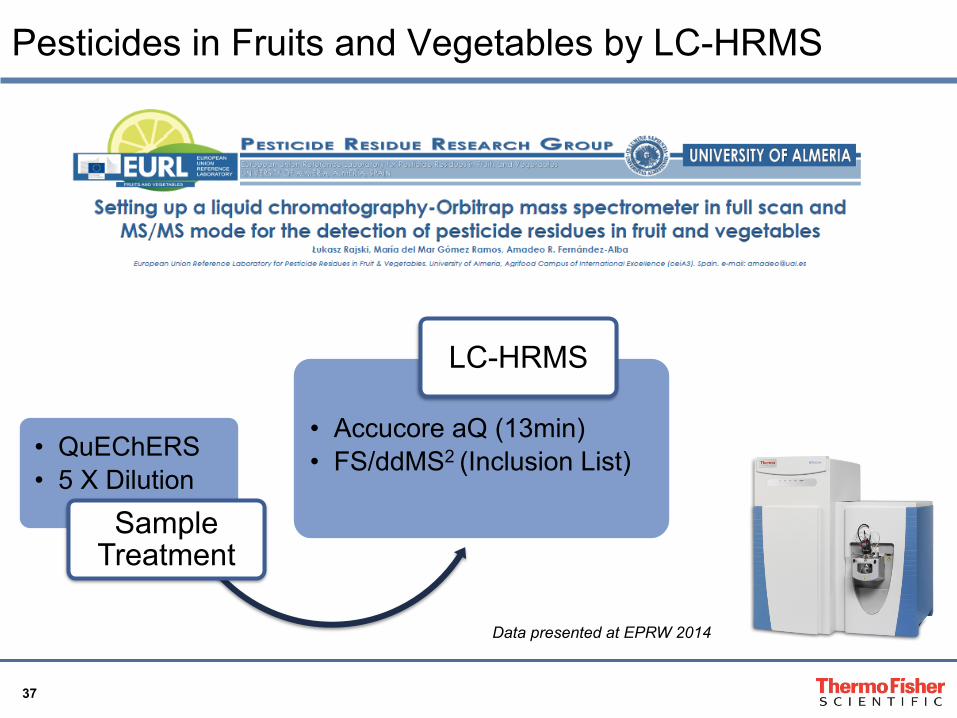
Pesticides in Fruits and Vegetables by LC-HRMS
• QuEChERS • 5 X Dilution
Sample Treatment
• Accucore aQ (13min)
• FS/ddMS2 (Inclusion List)
LC-HRMS
Data presented at EPRW 2014
38
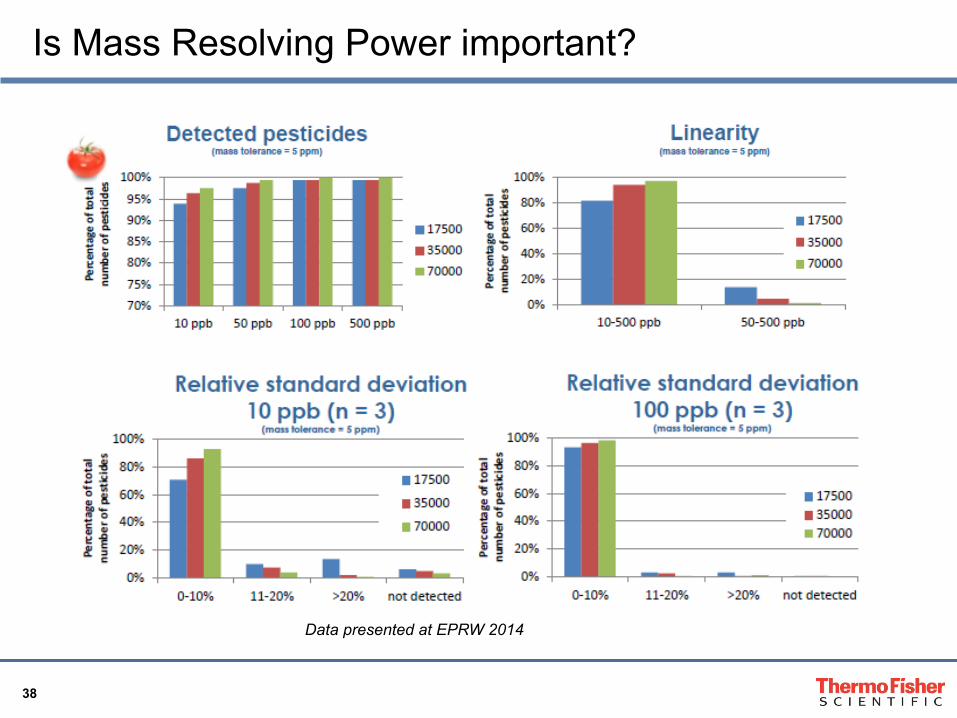
Is Mass Resolving Power important?
Data presented at EPRW 2014
39
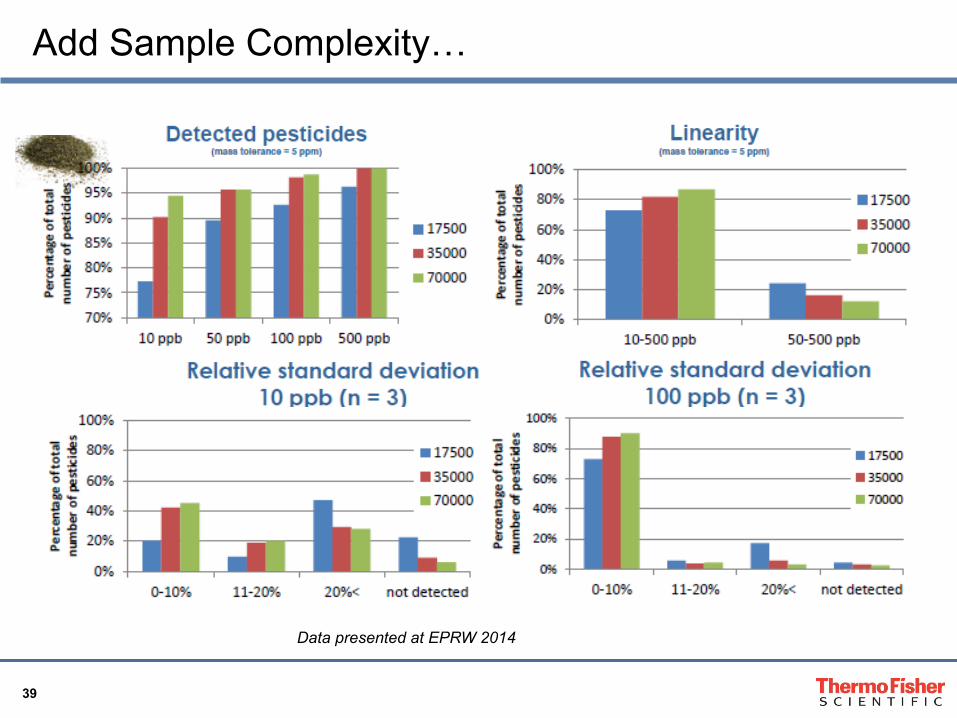
Add Sample Complexity…
Data presented at EPRW 2014

40
What Scan Mode is Right for Your Workflow?
PRM/T-MS2
Full Scan MS
Matrix
Leek extract spiked with 0.1 ppb imazalil
Pre
curs
or io
n @
R=7
0,00
0 P
rodu
ct io
n @
R=7
0,00
0
3.275 ppm Product Ion
M.M.Gomez-Ramos et al. J Chrom A., 2013, 1287, 24-37.
41
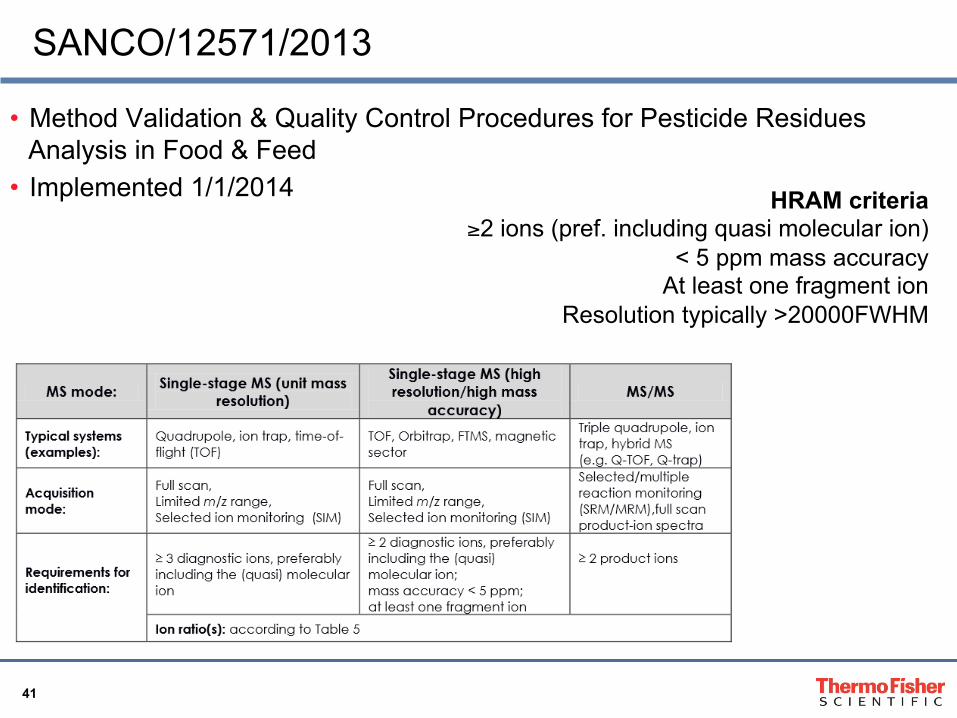
SANCO/12571/2013
• Method Validation & Quality Control Procedures for Pesticide Residues Analysis in Food & Feed
• Implemented 1/1/2014 HRAM criteria ≥ 2 ions (pref. including quasi molecular ion)
< 5 ppm mass accuracy At least one fragment ion
Resolution typically >20000FWHM
42
EU 2002/657/EC
SANCO 12571/2013
EU-RL-MB SOP
Gerssen (2010)
Mol (2012)
Domènech (2014)
Kumar (2014)
Pitarch (2007)
Analytes - Pesticides Lipophilic Toxins
Lipophilic Toxins
Pesticides Lipophilic Toxins Ronidazole Nitroimidazoles
Priority organic micropollutants
Matrix Food Food and Feed
Molluscs Shellfish Vegetables &Fruits Mussels Muscle Water
Technique HRMS HRMS LC-MS/MS LC-MS/MS LC-HRMS/MS LC-HRMS/MS LC-HRMS/MS GC-MS/MS
Mass Accuracy - ˂ 5ppm - - ˂ 5ppm ˂ 5ppm ˂ 5ppm - Mass Resolving Power (FWHM)
- ≥20,000 - - ≥20,000 ≥20,000 ≥70,000 -
Retention Time (RT) Tolerance
2.5% 2.5% Not exceed 3%
5% 1% Mean ±3SD (not relative to time)
±1% Agreement - RT samples & standards
Diagnostic Ions ≥ 2 ≥ 2 1 precursor 1 precursor ≥ 2 1 2 1 or 2 precursors Fragment Ions -
At least one At least 2
precursor-product
transitions
2 products At least one 1 At least 1 >20,000FWHM
At least 2 precursor-product
transitions
Isotope Ions - - - - M+1 M+2
M+1 - -
Ion Ratio Relative intensity (% at
base peak)
Relative intensity (% at base peak)
Must be recorded
As described 2002/657/EC
Fragment Ion Ratio: Diagnostic/Fragment
Isotope Ion Ratio: Diagnostic/M+1 (M
+2)
Fragment Ion Ratio: Diagnostic/
Fragment Isotope Ion Ratio: Diagnostic/M+1
At least one Ratio between quantitative and
confirmation transition
Fragment-Isotope Ion Ratio Tolerance
2 IPs for precursor ion 2.5 IPs for a
product
As described 2002/657/EC
- As described 2002/657/EC
Independent of relative intensity
between ions: ±50%
As described 2002/657/EC
- As described 2002/657/EC
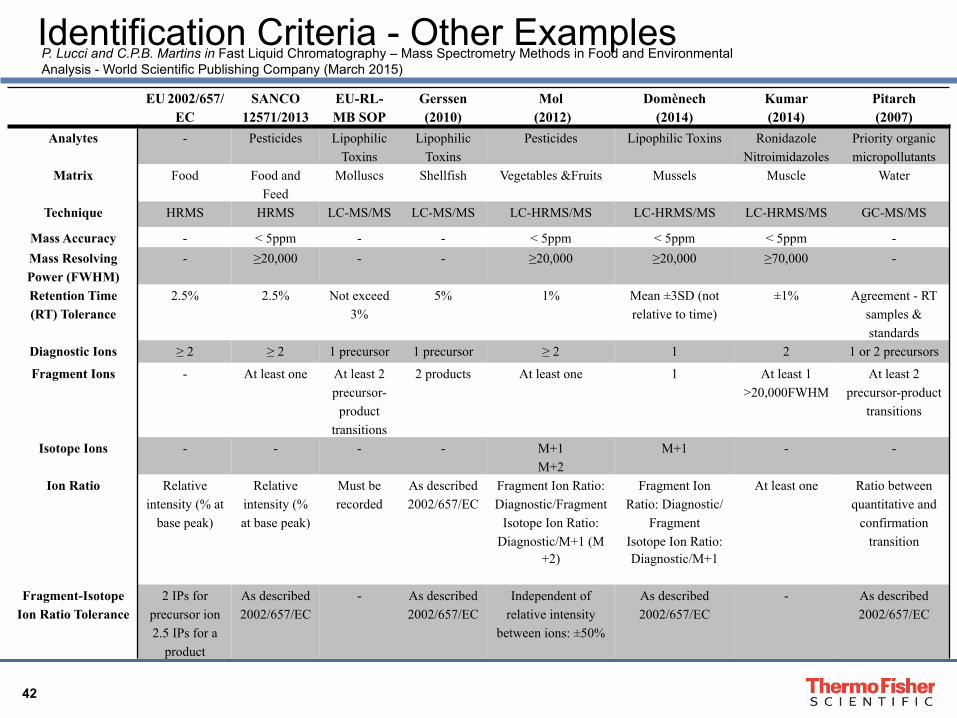
Identification Criteria - Other Examples P. Lucci and C.P.B. Martins in Fast Liquid Chromatography – Mass Spectrometry Methods in Food and Environmental Analysis - World Scientific Publishing Company (March 2015)
43
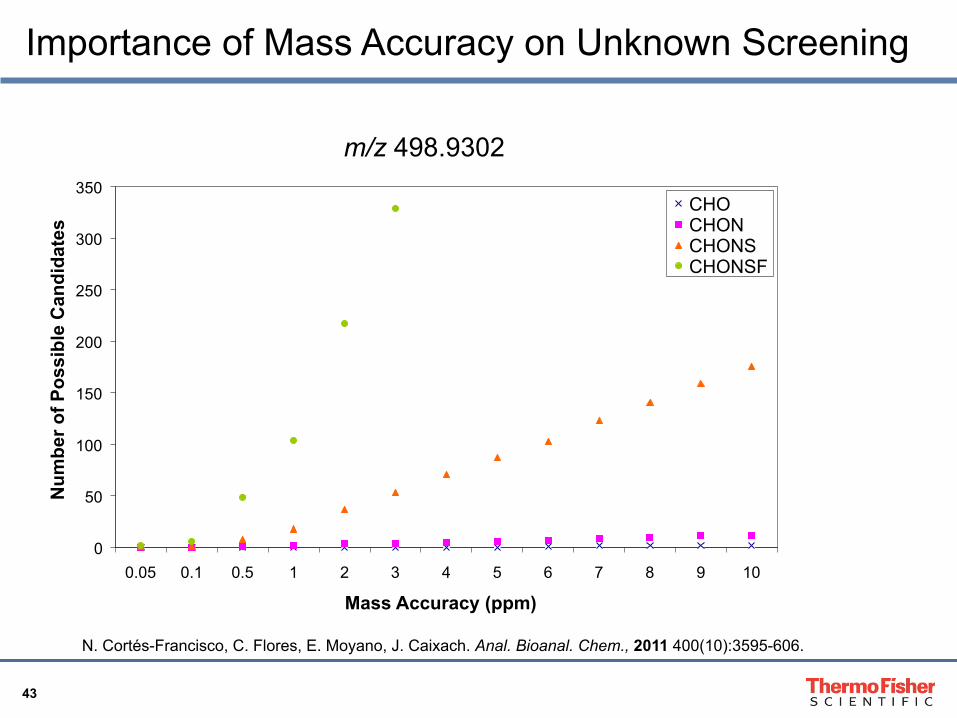
N. Cortés-Francisco, C. Flores, E. Moyano, J. Caixach. Anal. Bioanal. Chem., 2011 400(10):3595-606.
Importance of Mass Accuracy on Unknown Screening
0
50
100
150
200
250
300
350
0.05 0.1 0.5 1 2 3 4 5 6 7 8 9 10 Mass Accuracy (ppm)
Num
ber o
f Pos
sibl
e C
andi
date
s
CHO CHON CHONS CHONSF
m/z 498.9302
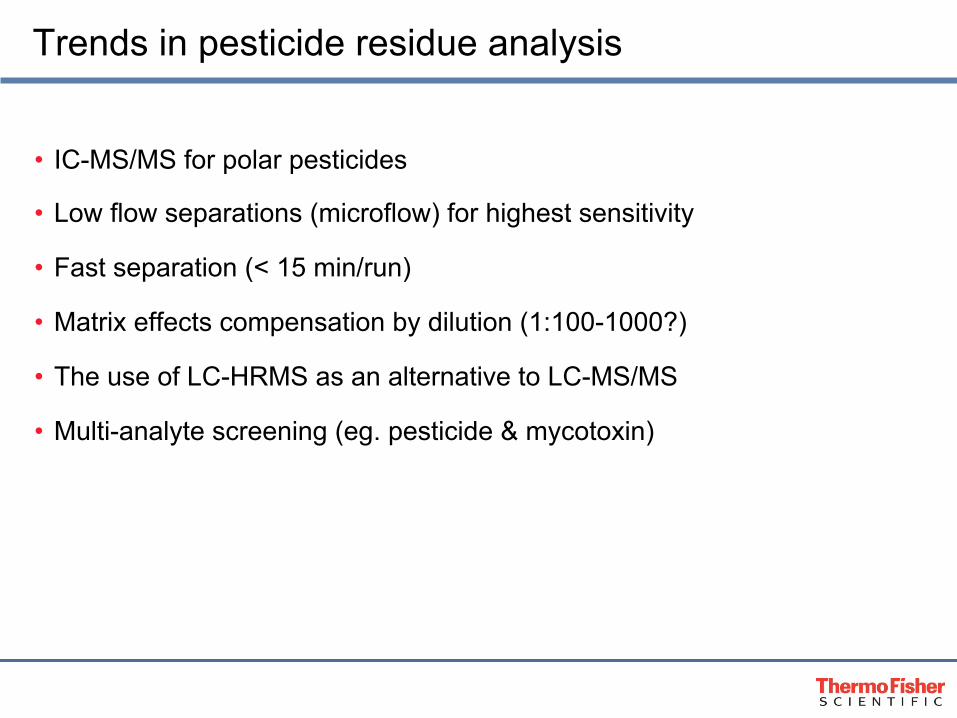
Trends in pesticide residue analysis
• IC-MS/MS for polar pesticides
• Low flow separations (microflow) for highest sensitivity
• Fast separation (< 15 min/run)
• Matrix effects compensation by dilution (1:100-1000?)
• The use of LC-HRMS as an alternative to LC-MS/MS
• Multi-analyte screening (eg. pesticide & mycotoxin)
Conclusions
• It is critical to adapt methodology for maximum performance • Sample preparation, chromatography, configuration, method set-up, etc
• Different technologies and configurations complement each other to
suit multiple needs
46
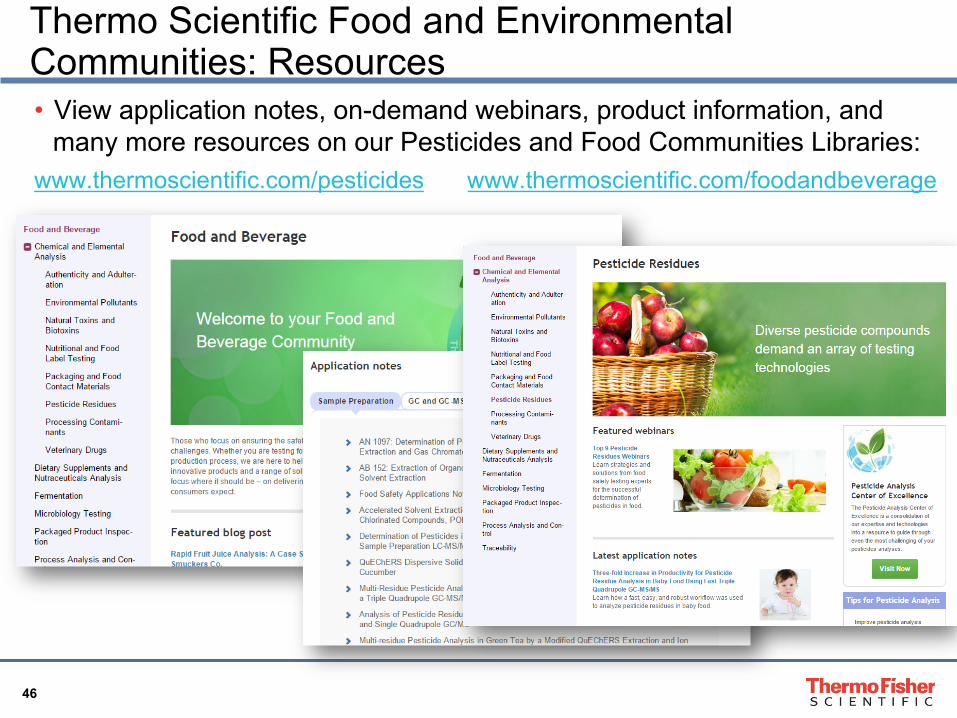
Thermo Scientific Food and Environmental Communities: Resources • View application notes, on-demand webinars, product information, and
many more resources on our Pesticides and Food Communities Libraries: www.thermoscientific.com/pesticides www.thermoscientific.com/foodandbeverage