Pert Chart Doc
180
PERT Chart EXPERT User's Guide © Critical Tools, Inc. 2010
-
Upload
muneeb-javed -
Category
Documents
-
view
71 -
download
1
description
PERT
Transcript of Pert Chart Doc

PERT Chart EXPERT
User's Guide
© Critical Tools, Inc. 2010
page 2
PERT Chart EXPERT
Table of Contents
Overview of PERT Chart EXPERT 5 What is PERT Chart EXPERT? 5 What is a PERT chart? 6Installation and Configuration 7 System Requirements 7 Installing on a Local PC 8 Installing on a Network 9 Configuring Microsoft Project 10 Configuring a Network Version of MS Project 13Using PERT Chart EXPERT 15 Terminology and Basic Concepts 15 Overview of Creating a PERT chart 18 Creating and Modifying Tasks 19 Creating Dependencies 21 Scheduling 23 Critical Path 28 Moving & Repositioning Tasks 29 Displaying Fields in Task Boxes 31 Grouping Tasks 32 Displaying a Timescale 35 Tracing Tasks 37 Fields in PERT Chart EXPERT 38 Printing 39 Saving PERT charts 41 Transferring a PERT chart to Microsoft Project 43 Transferring a PERT chart to WBS Chart Pro 44 Creating PERT charts from Microsoft Project plans 45 Tips when using PERT Chart EXPERT with MS Project 47Reference (by Menu) 48 File Menu 49 New 49 Open 50 Close 52 Save 53 Save As 54 Save As Picture 56 Save As Web Pages 57 Page Layouts 59 Page Layouts (Edit) 61 Page Setup 64 Print 67 Print Preview 69 Unlink 70 Properties 71 Most Recently Used Files (1,2,3,4) 74 Exit 75
page 3
PERT Chart EXPERT
Edit Menu 76 Undo 76 Redo 77 Cut 78 Copy 79 Paste 80 Insert Task 81 Delete 82 Task Information 83 Find 88 Find Next 89 Go To 90 Select All 91 View Menu 92 Normal 92 Page Layout 93 Online Layout 94 Toolbars 95 Views 96 Open Group 98 Close Group 99 Show All 100 Focus 101 Show Only Groups 102 Progress Marks 103 Hyperlink Symbols 104 Zoom 105 Format Menu 106 Fields 106 Borders 111 Chart 114 Dependency Lines 115 Custom Box Settings 117 Timescale 119 Group 121 Lock Box Positions 124 Layout Selected 125 Tools Menu 126 Chart Settings 126 Calendar 127 Resources 129 Trace 131 Renumber Tasks 132 Field Names 133 Border Names 135 Microsoft Project 136 Microsoft Project Setup 137 Goto WBS Chart Pro 138 Options 139 Window Menu 141
page 4
PERT Chart EXPERT
Cascade 141 Tile 142 Arrange Icons 143 List of Projects 144 Help Menu 145 Content and Index 145 Tip of the Day 146 About PERT Chart EXPERT 147Toolbar Buttons 148 Toolbar Buttons Defined 148Frequently Asked Questions 151 List of Frequently Asked Questions 151Error Messages and Prompts 154 Microsoft Project Messages 154 Unable to Open Linked Data File 156 Invalid Data 157 Cannot Merge 158 No Calendar Available 159 Opening Old PERT charts 160 HTML Template 161 Confirm Unlink 162 Unable to Save Image 163 Overwriting HTML Files 164 Demo Limits Exceeded 165 Program Registration 166 Displays a blank PERT chart from MS Project plans 167Contacting Critical Tools, Inc. 168 Company Address 168 Support 169
page 5
PERT Chart EXPERT
Overview of PERT Chart EXPERT
What is PERT Chart EXPERT?
PERT Chart EXPERT is a Windows-based project management software application that is usedto create and display projects using a PERT chart.
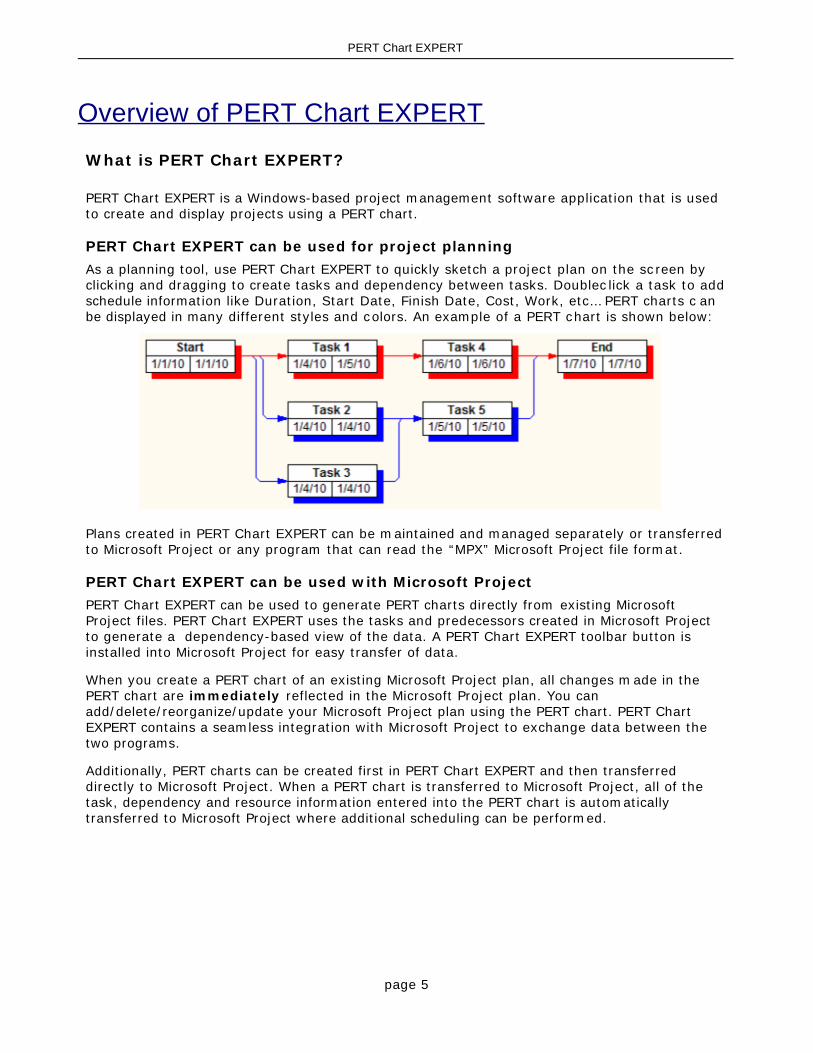
PERT Chart EXPERT can be used for project planningAs a planning tool, use PERT Chart EXPERT to quickly sketch a project plan on the screen byclicking and dragging to create tasks and dependency between tasks. Doublec lick a task to addschedule information like Duration, Start Date, Finish Date, Cost, Work, etc… PERT charts c anbe displayed in many different styles and colors. An example of a PERT chart is shown below:
Plans created in PERT Chart EXPERT can be maintained and managed separately or transferredto Microsoft Project or any program that can read the “MPX” Microsoft Project file format.
PERT Chart EXPERT can be used with Microsoft ProjectPERT Chart EXPERT can be used to generate PERT charts directly from existing MicrosoftProject files. PERT Chart EXPERT uses the tasks and predecessors created in Microsoft Projectto generate a dependency-based view of the data. A PERT Chart EXPERT toolbar button isinstalled into Microsoft Project for easy transfer of data.
When you create a PERT chart of an existing Microsoft Project plan, all changes made in thePERT chart are immediately reflected in the Microsoft Project plan. You canadd/delete/reorganize/update your Microsoft Project plan using the PERT chart. PERT ChartEXPERT contains a seamless integration with Microsoft Project to exchange data between thetwo programs.
Additionally, PERT charts can be created first in PERT Chart EXPERT and then transferreddirectly to Microsoft Project. When a PERT chart is transferred to Microsoft Project, all of thetask, dependency and resource information entered into the PERT chart is automaticallytransferred to Microsoft Project where additional scheduling can be performed.
page 6
PERT Chart EXPERT
What is a PERT chart?
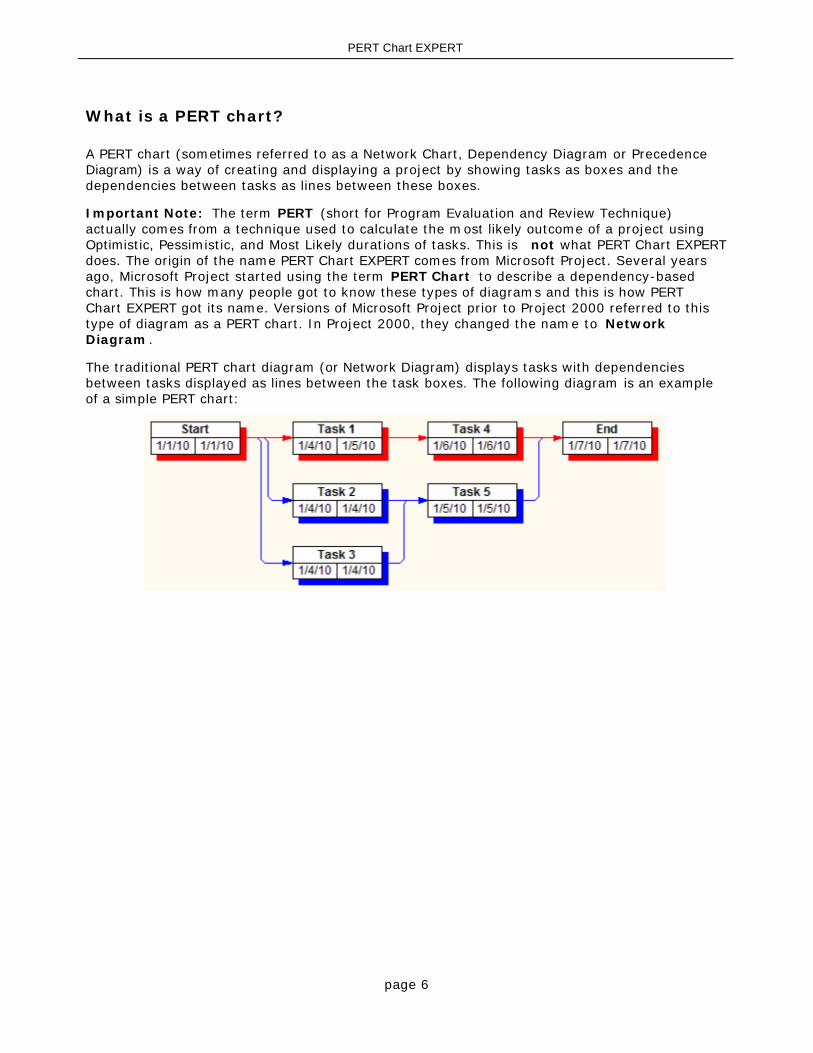
A PERT chart (sometimes referred to as a Network Chart, Dependency Diagram or PrecedenceDiagram) is a way of creating and displaying a project by showing tasks as boxes and thedependencies between tasks as lines between these boxes.
Important Note: The term PERT (short for Program Evaluation and Review Technique)actually comes from a technique used to calculate the most likely outcome of a project usingOptimistic, Pessimistic, and Most Likely durations of tasks. This is not what PERT Chart EXPERTdoes. The origin of the name PERT Chart EXPERT comes from Microsoft Project. Several yearsago, Microsoft Project started using the term PERT Chart to describe a dependency-basedchart. This is how many people got to know these types of diagrams and this is how PERTChart EXPERT got its name. Versions of Microsoft Project prior to Project 2000 referred to thistype of diagram as a PERT chart. In Project 2000, they changed the name to NetworkDiagram .
The traditional PERT chart diagram (or Network Diagram) displays tasks with dependenciesbetween tasks displayed as lines between the task boxes. The following diagram is an exampleof a simple PERT chart:
page 7
PERT Chart EXPERT
Installation and Configuration
System Requirements
PERT Chart EXPERT is a Windows based project planning software application. PERT ChartEXPERT can be used as a standalone project planning tool or as an add-on to Microsoft Project.
PERT Chart EXPERT system requirements:Windows 2000, XP, Vista or Windows 75 MB free disk spaceRuns on all major Networks
PERT Chart EXPERT is compatible and integrates seamlessly with thefollowing versions of Microsoft Project:
Microsoft Project 98Microsoft Project 2000Microsoft Project 2002Microsoft Project 2003Microsoft Project 2007Microsoft Project 2010
If you are using a version of Microsoft Project later than the ones listed above, go to ourwebsite at www.criticaltools.com for information on newer versions of PERT Chart EXPERT.
PERT Chart EXPERT does not require Microsoft Project.
page 8
PERT Chart EXPERT
Installing on a Local PC
PERT Chart EXPERT can be used as a standalone project planning tool or it c an be used withMicrosoft Project.
To use PERT Chart EXPERT as a standalone software application if you do not have MicrosoftProject, run Setup and answer No to the prompt during Setup to modify Microsoft Project.Once installed, PERT Chart EXPERT can be started by selecting the Start Menu-Program s-PERTChart EXPERT or by doubleclicking on the PERT Chart EXPERT shortcut on your desktop if youchose to add this.
To install PERT Chart EXPERT and configure PERT Chart EXPERT to work with a c opy ofMicrosoft Project on your computer, run Setup and answer Yes to the prompt during Setup tomodify Microsoft Project. Once installed with the Microsoft Project option, you can start PERTChart EXPERT by itself using the above-mentioned techniques or you can start Mic rosoftProject and select the PERT Chart EXPERT toolbar button within Microsoft Project to create aPERT chart of the current Microsoft Project plan.
There is no difference between the above two installations other than the fact that a PERTChart EXPERT Toolbar button will be installed into Microsoft Project if you choose the secondoption. You do not need Microsoft Project to run PERT Chart EXPERT.
If you have already installed the demo version of PERT Chart EXPERT, start the program, go tothe Help-About PERT Chart EXPERT menu, select Register and enter the Produc t ID providedwith your purchase.
See also:
Configuring MS Project for use with PERT Chart EXPERT
Installing on a Network

page 9
PERT Chart EXPERT
Installing on a Network
PERT Chart EXPERT Licensing for Network Use
PERT Chart EXPERT utilizes “named user” licensing and not “concurrent user” networklicensing. This means that each user who accesses PERT Chart EXPERT on a network m usthave a license. For example, if you have 10 people who need to use the version of PERT ChartEXPERT on your network you must have a 10 User Network License. User Licenses c an betransferred. If a user no longer accesses PERT Chart EXPERT on the network another user c anreplace that user.
Recommended approach to installing PERT Chart EXPERT on your Network
The simplest way to install a Network License is to install PERT Chart EXPERT into a direc toryon the network, and assign access to individuals up to the total number of licenses purchased.If a user no longer needs to use the software, the network administrator can replace theirname with another.
The first time each user starts the program it will be in Demo mode until the Product ID isentered on the users’ computer. To enter the Product ID, start PERT Chart EXPERT, go to theHelp-About PERT Chart EXPERT menu, select Register and enter the Produc t ID provided.
Configuring the Network version of Microsoft Project for use with PERT Chart EXPERT
If you wish to use PERT Chart EXPERT with a network installation of Microsoft Projec t, refer tothe Help topic Configuring a Network Version of MS Project for PERT Chart EXPERT

page 10
PERT Chart EXPERT
Configuring Microsoft Project
Configuring Project 98 thru Project 2007
The following are instructions for configuring Microsoft Project 98 through Project 2007. Instructions for configuring Project 2010 follow these instructions.
PERT Chart EXPERT can be accessed from within Microsoft Project through the use of a Toolbarbutton.
The PERT Chart EXPERT Toolbar button within Microsoft Project
With the PERT Chart EXPERT Toolbar button you can open a Microsoft Project plan and c lickthis button to create a PERT chart of the current plan in Microsoft Project. During PERT ChartEXPERT Setup you are prompted to install this Toolbar button. If you chose to do this and yousee the button when you start Microsoft Project then you are ready to create PERT charts ofyour Microsoft Project plans and can proceed to the Help topic, Creating PERT charts fromMicrosoft Project plans.
If you do not see the PERT Chart EXPERT Toolbar button in Microsoft Project, check thefollowing:
1. Are you using Microsoft Project installed on a network? If so, there may not be suffic ientrights to modify Microsoft Project on the network. Therefore, the PERT Chart EXPERTToolbar button will not be saved as part of Microsoft Project. See Configuring a NetworkVersion of MS Project for PERT Chart EXPERT for more information.
2. During PERT Chart EXPERT Setup, did you answer Yes when prompted to install the PERTChart EXPERT Toolbar button into Microsoft Project? If not, run Setup again and answerYes when prompted to install the PERT Chart EXPERT Toolbar button into Mic rosoftProject.
3. If you are using a locally installed version of Microsoft Project and you answered Yes tothe Toolbar prompt during PERT Chart EXPERT Setup, try manually installing the Toolbarbutton into Microsoft Project as described below.
Manually installing the PERT Chart EXPERT Toolbar button into Microsoft Project
1. Start Microsoft Project.
2. Choose the File menu and select Open.
3. Open the Folder where PERT Chart EXPERT is installed (the default is C:\ProgramFiles\PERT Chart EXPERT).
4. Open the SETUP file for the appropriate version of Microsoft Project:
SetupPERT41.mpp if you are using Microsoft Project 4.1a.SetupPERT98.mpp if you are using Microsoft Project 98.SetupPERT2000.mpp if you are using Project 2000.SetupPERT2002.mpp if you are using Project 2002.SetupPERT2003.mpp if you are using Project 2003.SetupPERT2007.mpp if you are using Project 2007.

page 11
PERT Chart EXPERT
These Setup files contain macros that are automatically run when opened and you must chooseto Enable Macros if you receive a message. These macros install the appropriate items intoMicrosoft Project to configure it to work with PERT Chart EXPERT.
After opening the SETUP file from within Microsoft Project, does the PERT Chart EXPERTToolbar button appear? If so, click it to see if it takes you to the PERT Chart EXPERT program .Then, close PERT Chart EXPERT to return to Microsoft Project. Upon returning to MicrosoftProject, close Microsoft Project and reopen it to see if the PERT Chart EXPERT Toolbar button isstill there. If the PERT Chart EXPERT Toolbar does not appear when you restart Mic rosoftProject then there is a problem saving information to the GLOBAL.MPT file. The Global.mpt fileis a Microsoft Project file and you should obtain the rights to modify and save the Global.mptfile.
If you do not have rights to modify the Global.mpt file then you can temporarily configureMicrosoft Project for use with PERT Chart EXPERT. To do this, start Microsoft Project and thenstart PERT Chart EXPERT. From within PERT Chart EXPERT, choose Tools-MicrosoftProject-Setup-OK. This copies the necessary Tables, Views, Macros and Toolbar button intoMicrosoft Project. These items will remain there until Microsoft Project is closed. You will needto repeat this the next time you want to use PERT Chart EXPERT with Microsoft Project.
Technical Explanation of how Microsoft Project is configured for PERT Chart EXPERTWhen Microsoft Project is configured for use with PERT Chart EXPERT, several items are copiedto Microsoft Project and stored in the GLOBAL.MPT file. The GLOBAL.MPT file is a Mic rosoftProject file that is used to store things like Macros, Tables, Views, Toolbar Buttons, etc.Microsoft Project installs this file into the same directory with the other Microsoft Projectprogram files. When installing PERT Chart EXPERT, you need Read/Write ac cess to theGLOBAL.MPT file for the PERT Chart EXPERT-specific items to be saved as part of Mic rosoftProject.
If you are running Microsoft Project on a local computer, you probably have suffic ientRead/Write access to the GLOBAL.MPT file on the local computer and configuring should not bea problem. If you are running Microsoft Project on a network then the GLOBAL.MPT may belocked (made Read-Only) along with the rest of the Mic rosoft Project program files and you willneed to follow the instructions for configuring Microsoft Project on a network, see Configuring aNetwork Version of MS Project for PERT Chart EXPERT.
When you configure PERT Chart EXPERT to work with Microsoft Projec t the following items areinstalled into the GLOBAL.MPT file:
A PERT Chart EXPERT Toolbar button – this starts the Macro used to exchange data.
GotoPERTChartEXPERT– this macro is used to initiate the process of exchanging databetween Microsoft Project and PERT Chart EXPERT.
A View – (beginning with the words Critical Tools), ensures a consistent view of the data.
A Filter – (beginning with the words Critical Tools), ensures the proper number of tasksare exchanged.
Several Tables (each beginning with the words Critical Tools), used to extract theMicrosoft Project fields in the correct order.
In order for PERT Chart EXPERT to seamlessly exchange data with Microsoft Projec t, all of theabove items need to be present in Microsoft Project to perform the necessary operations.
Note: Do not modify any of the above items as this may prevent PERT Chart EXPERT fromproperly exchanging data with Microsoft Project.
page 12
PERT Chart EXPERT
Configuring Microsoft Project 2010
To configure PERT Chart EXPERT to work with Project 2010, during Setup, choose to ModifyMicrosoft Project to add the items needed to integrate PERT with Project 2010. Setup will copythe Tables, Views, Filters and Macro needed for PERT Chart EXPERT to integrate with Project2010.
Configuring Project 2010 during Setup does not add a button to the Ribbon in Project2010. You need to do this manually. To add a Tab and Button to the Ribbon in Projec t 2010:
1. Start Project 2010, right click on the Ribbon and select "Customize the Ribbon..."
2. Click a Tab in the Main Tabs section in the right column and select the New Tab button.Click this New Tab, c lick Rename to name this tab to something like "Critical Tools" andclick OK.
3. In the left column, click the "Choose commands from" drop down list and selectMacros.
4. Select New Group in the right column.
5. Click the GotoPERTChartEXPERT macro in the left column and then click the Add>>button to copy this to the New Group*.
6. Click New Group and Rename if you wish to rename this group.
* - If you don't see the GotoPERTChartEXPERT macro after running Setup and choosing toModify Project 2010 then do this:
1. Open Project 2010, go to File-Options-Trust Center-Trust Center Settings and select"Enable All Macros".
2. Open the file called SetupPERT2010.mpp. This file is located in the C:\ProgramsFiles\PERT Chart EXPERT folder by default.
3. Repeat the steps above and if you see the Macros you can close the Setup file withoutsaving.
See also:
Creating PERT charts from Microsoft Project plans
page 13
PERT Chart EXPERT
Configuring a Network Version of MS Project
When Microsoft Project is configured for use with PERT Chart EXPERT, several items are copiedinto Microsoft Project and stored in the GLOBAL.MPT file. The GLOBAL.MPT file is a Mic rosoftProject file that is used to store things like Macros, Tables, Views, Toolbar Buttons, etc. Thisfile is installed by Microsoft Project into the same directory with other Microsoft Projec tprogram files.
When you configure PERT Chart EXPERT to work with Microsoft Projec t, the following items areinstalled into the GLOBAL.MPT file of Microsoft Project:
A PERT Chart EXPERT Toolbar button – this is used to start the Macro use to exchangedata.
GotoPERTChartEXPERT – this macro is called and is used to initiate the process ofexchanging data between Microsoft Project and PERT Chart EXPERT.
A View – (beginning with the words Critical Tools), ensures a consistent view of the data.
A Filter – (beginning with the words Critical Tools), ensures the proper number of tasksare exchanged.
Several Tables (each beginning with the words Critical Tools), used to extract theMicrosoft Project fields in the correct order.
PERT Chart EXPERT requires that the above items be installed into Microsoft Project to allow aseamless integration between the two programs. If you have Microsoft Project installed on anetwork there may not be sufficient rights to modify the GLOBAL.MPT. If this is the case and ifyou wish to use your Network version of Microsoft Project with PERT Chart EXPERT, you havethree options for doing this. They are:
1. Copy the necessary items into Microsoft Project each time you use PERT ChartEXPERT. To do this, start Microsoft Project and then start PERT Chart EXPERT. Fromwithin PERT Chart EXPERT, choose Tools-Microsoft Project-Setup-OK . This copiesthe necessary Tables, Views, Macros and Toolbar button into Microsoft Project. Theseitems will remain there until Microsoft Project is closed.
2. Obtain temporary Read/Write access to the GLOBAL.MPT file on the network, runPERT Chart EXPERT Setup and answer Yes to the prompt to modify Microsoft Project.This adds a PERT Chart EXPERT Toolbar button to the network installation of MicrosoftProject. This Toolbar button could access the PERT Chart EXPERT program installedon the Network or a version of PERT Chart EXPERT installed on a local computer. Thedisadvantage to this procedure is that everyone who uses the version of MicrosoftProject on the network will see this PERT Chart EXPERT button but they may not haveaccess to the PERT Chart EXPERT program.
3. Create a copy of the GLOBAL.MPT file and store it on your local computer. This way,Microsoft Project can be run from the network but all custom settings (Views, Tables,Macros, Reports, Toolbars, etc…) will be stored on the local computer. You can theninstruct Microsoft Project to use the GLOBAL.MPT on your local computer instead ofusing the one on the network. To do this, copy the GLOBAL.MPT file from thenetwork to a local drive and directory and make this directory the WorkingDirectory (also called the Start In directory in some operating systems). To make alocal directory the Working Directory (or Start In directory), modify the icon thatyou use to start Microsoft Project. If this is in your Start menu then you will need togo to the Start Menu, select Settings-Task Bar-Start Menu Programs-Advanced,
page 14
PERT Chart EXPERT
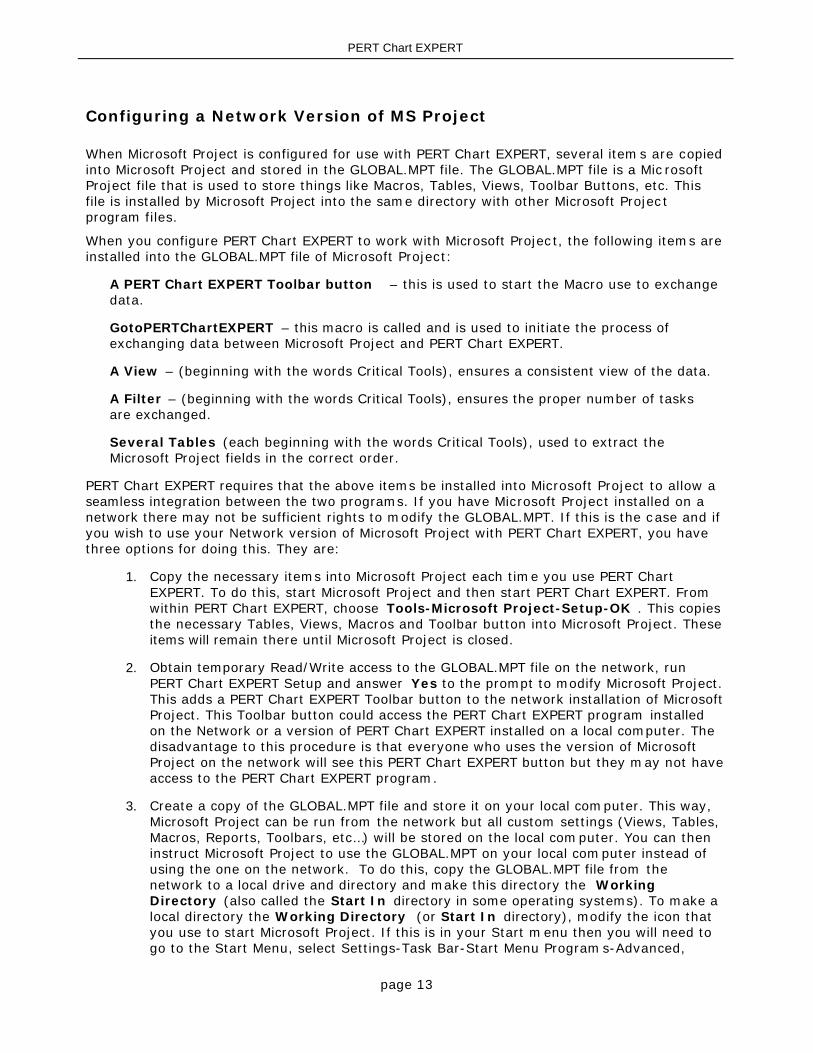
locate the icon used to start Microsoft Project, Right-Click with the m ouse and displaythe Properties. If you use an icon on your desktop, Right-Click this icon. Then, enterthe Drive and Path to the directory where you copied the GLOBAL.MPT file. Forexample:
This is the Properties dialog for Microsoft Project. Notice that Microsoft Project is installedand run from the network but the Start in directory is pointing to C:\Project 2007. If there isa GLOBAL.MPT in this directory, Microsoft Project will use this one instead of the one on theNetwork.
page 15
PERT Chart EXPERT
Using PERT Chart EXPERT
Terminology and Basic Concepts
Tasks
To create a project in PERT Chart EXPERT you simply click and drag with your mouse to createtasks. Task boxes can display certain pieces of information like the name of the task, the taskId (task number), the duration (how long it will take), and the start and finish date. You c andisplay any number of fields in a task box for displaying on the screen.
Select Format-Fields to define additional fields to display in the task boxes.
See also: Displaying Fields in Task Boxes
For additional information on creating and modifying Tasks, see: Creating and Modifying Tasks
Dependencies
A dependency is a relationship between two tasks. To specify that the tasks in your projectoccur in a certain order, you create dependencies between these tasks by clic king and draggingbetween tasks. A dependency says that one task must follow another task in some way (Forexample, a task starts after another finishes or starts 5 days after another starts, etc…).
For more information on creating/modifying dependencies and an explanation of the differenttypes of dependencies see: Creating Dependencies
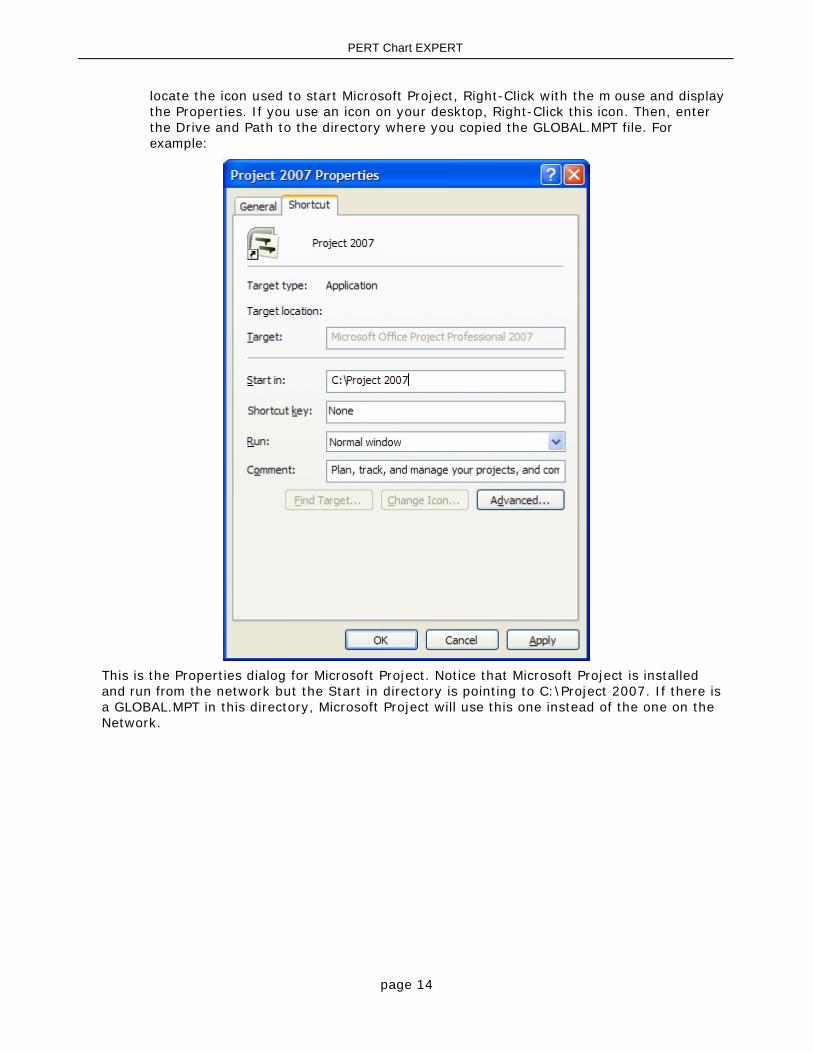
Summary Tasks and Tasks
A Summary Task is a term used to describe a task that summarizes a set of tasks. SummaryTasks are generally used to roll up information when projects are being displayed as a list.Below is a Microsoft Project plan showing an example of Summary Tasks and Tasks:
PERT charts are a different type of diagram and do not display data as a “list”. For this reason,if you display a PERT chart from a Microsoft Project plan, the summary tasks will not bedisplayed unless they have a dependency. For example,
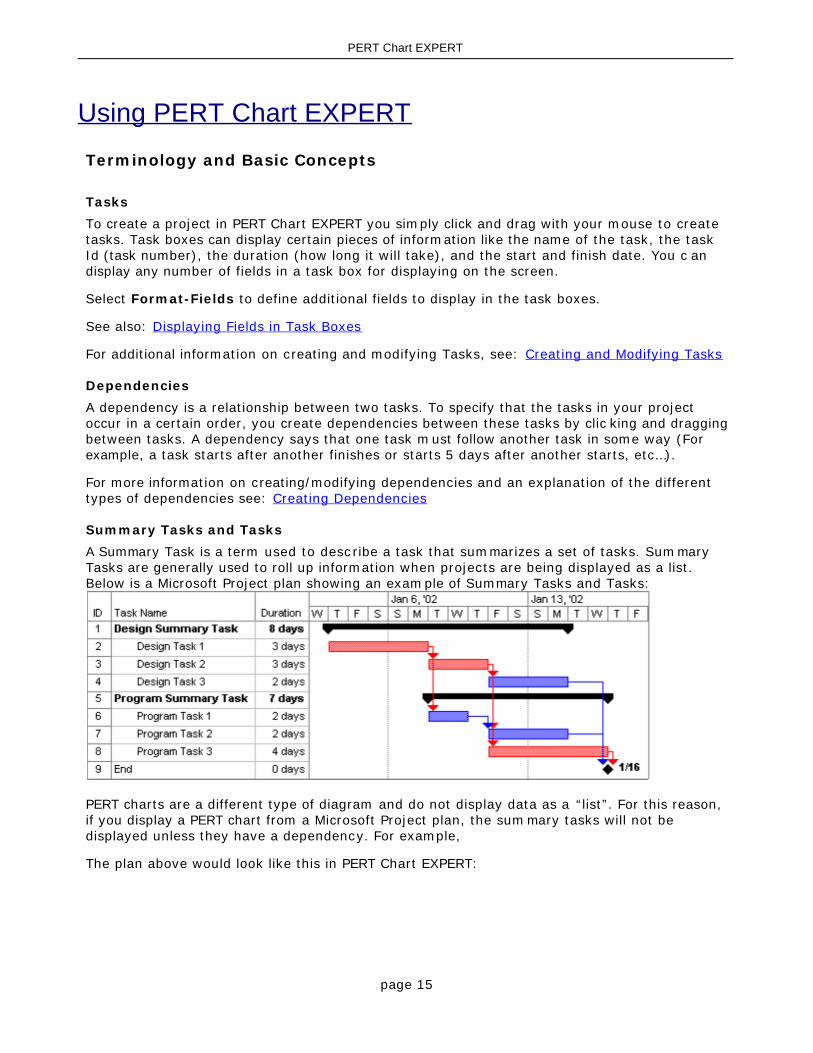
The plan above would look like this in PERT Chart EXPERT:
page 16
PERT Chart EXPERT
Notice that the Summary Tasks for Design and Program do not display in the PERT chart.
You can however, display the PERT chart Grouped by Summary Tasks, for example:
The above PERT chart is grouped by Outline which corresponds to the Summary Tasks inMicrosoft Project.
See also: Grouping Tasks
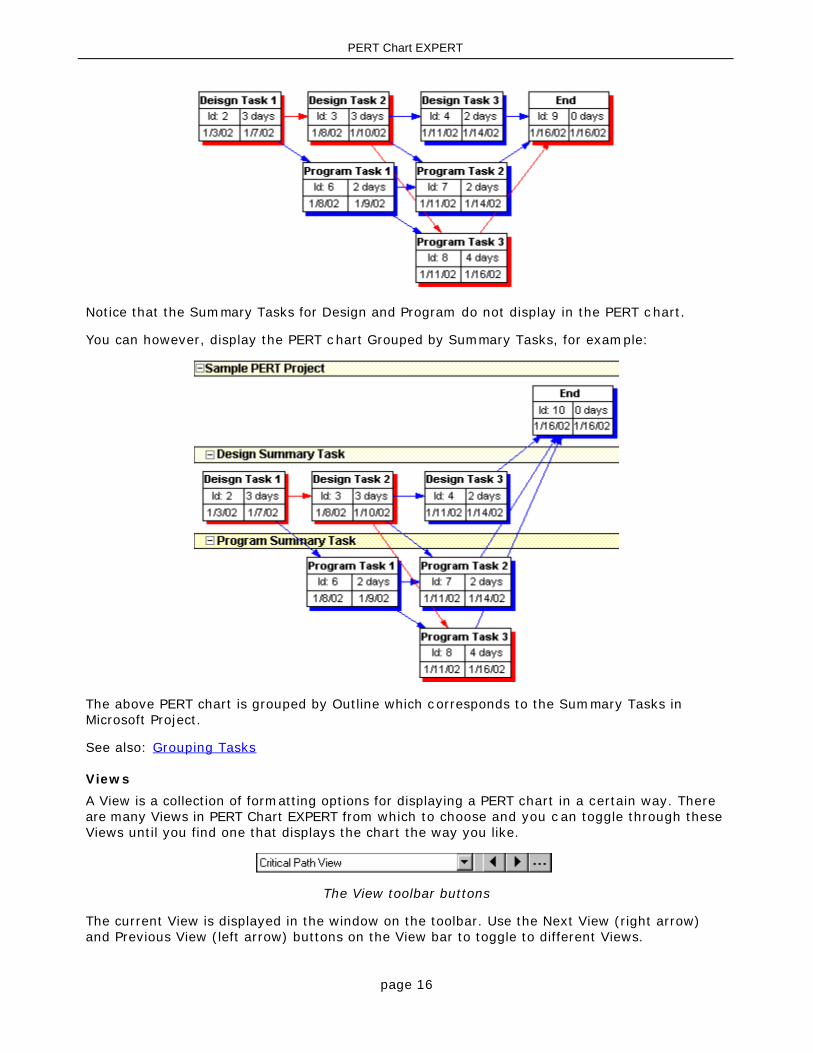
Views
A View is a collection of formatting options for displaying a PERT chart in a certain way. Thereare many Views in PERT Chart EXPERT from which to choose and you c an toggle through theseViews until you find one that displays the chart the way you like.
The View toolbar buttons
The current View is displayed in the window on the toolbar. Use the Next View (right arrow)and Previous View (left arrow) buttons on the View bar to toggle to different Views.
page 17
PERT Chart EXPERT
To modify a View, simply display that View and choose the many formatting options in theFormat menu.
See also: Views
These are some of the basic concepts for working in PERT Chart EXPERT.
For additional information on using PERT Chart EXPERT go to the Using PERT Chart EXPERTsection of Help.
For information on creating a PERT chart from Microsoft Project, see: Creating PERT chartsfrom Microsoft Project plans
page 18
PERT Chart EXPERT
Overview of Creating a PERT chart
Here are the basic steps to creating a new* PERT chart using PERT Chart EXPERT:
1. Open PERT Chart EXPERT (a New chart is created for you to begin planning). See also: New
2. Click and Drag to create tasks. See also: Creating and Modifying Tasks
3. Click and drag from one task to another to create a dependency. See also: CreatingDependencies
4. Click on the edge of a task box, drag and move it to rearrange the tasks in the chart. Seealso: Moving & Repositioning Tasks
5. Change Views to display the PERT chart differently. See also: Views
6. Print your PERT chart. See also: Printing
7. Save your PERT chart. See also: Saving PERT charts
These are only the basic steps for creating a PERT chart. There are many additional optionsavailable for working with PERT charts. For more ways to use PERT Chart EXPERT, see thetopics under the Using PERT Chart EXPERT section of Help.
* To create a PERT chart from an existing Microsoft Project plan, see the Help topic: CreatingPERT charts from Microsoft Project plans
page 19
PERT Chart EXPERT
Creating Tasks
To add a new task in a chart, click and drag with your mouse:
1. In an empty chart, click and drag anywhere in the chart to add a new task. A task box willappear in the upper left corner.
2. In a chart with tasks, click within a task and drag to empty space to create a new taskthat is dependent on the first task.
or
3. In a chart with tasks, click and drag in empty space to create a new task.
Entering Information
There are two ways to enter information for tasks in the PERT chart. One is to enter the taskinformation directly into the task box by simply selecting the task on the sc reen and typing theinformation directly. The other way to enter information is to doubleclick a task and enter theinformation into the Task Information form. Both options are discussed below:
Entering Information using the Task box on the screen
You can enter information about a Task by simply selecting a task on the sc reen and typinginformation directly into the selected field for that task. The information you can enter isdependent on which fields are currently displayed on the sc reen.
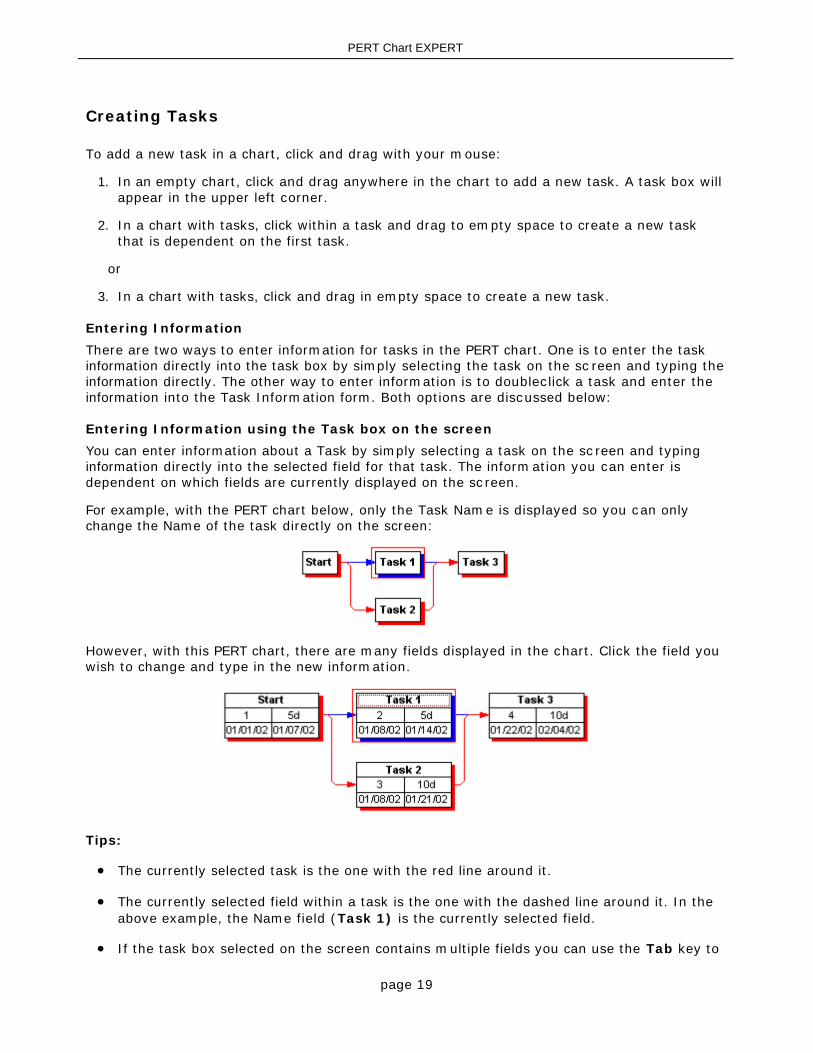
For example, with the PERT chart below, only the Task Name is displayed so you can onlychange the Name of the task directly on the screen:
However, with this PERT chart, there are many fields displayed in the chart. Click the field youwish to change and type in the new information.
Tips:
The currently selected task is the one with the red line around it.
The currently selected field within a task is the one with the dashed line around it. In theabove example, the Name field (Task 1) is the currently selected field.
If the task box selected on the screen contains multiple fields you can use the Tab key to
page 20
PERT Chart EXPERT
move around the different fields.
When you select a field in a Task box, select the Edit bar (or press F2) to m odify existingtext for that field.
To display PERT charts containing different arrangements of fields, try switc hing Viewsusing the Next View and Previous View buttons at the top of the screen. For m oreinformation on changing Views, see: Views
To add/delete or modify the fields that are currently displayed in the Task boxes, selec tthe Format menu and choose Fields.
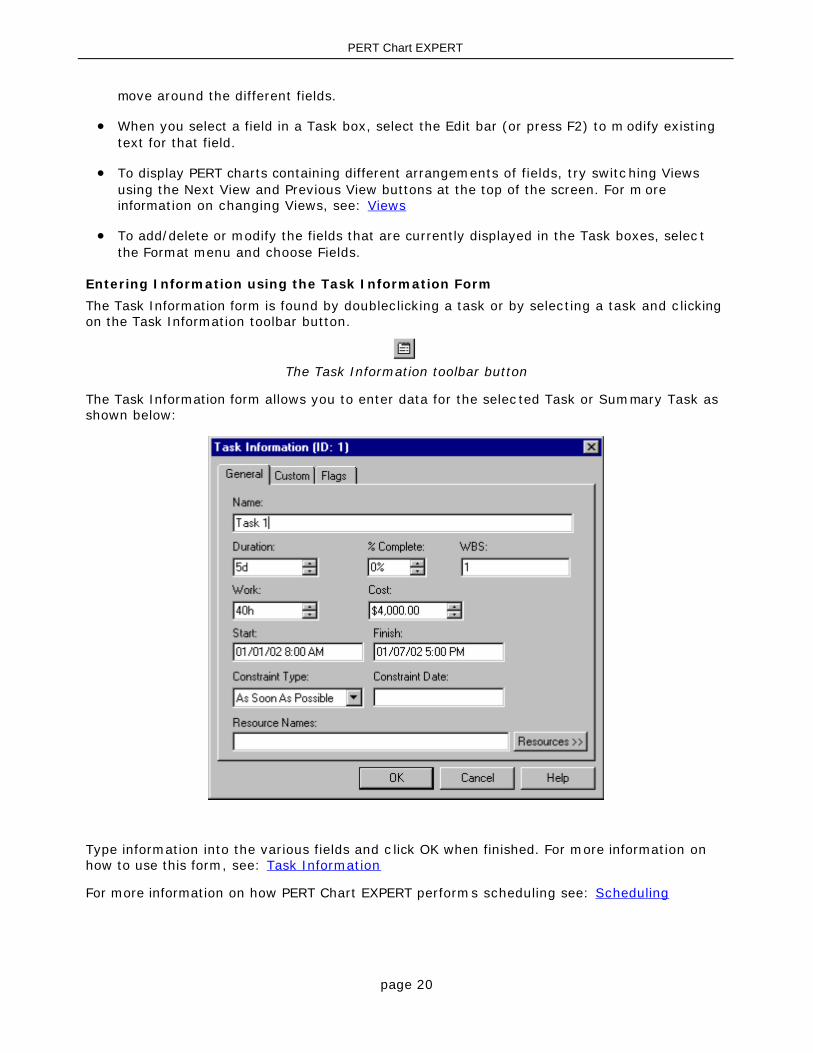
Entering Information using the Task Information Form
The Task Information form is found by doubleclicking a task or by selecting a task and c lickingon the Task Information toolbar button.
The Task Information toolbar button
The Task Information form allows you to enter data for the selec ted Task or Summary Task asshown below:
Type information into the various fields and c lick OK when finished. For more information onhow to use this form, see: Task Information
For more information on how PERT Chart EXPERT performs scheduling see: Scheduling
page 21
PERT Chart EXPERT
Dependencies
A dependency is a relationship between two tasks. To specify that the tasks in your projectoccur in a certain order, you create dependencies between these tasks by clic king and draggingbetween tasks. A dependency says that one task must follow another task in some way (eg:Start after another Finishes or Start 5 days after another Starts, etc…).
There are several types of dependencies. These include:
Finish to Start – One task cannot start until another is finished.
Start to Start – One task cannot start until another has started.
Finish to Finish – One task cannot finish until another is finished.
Start to Finish – One task cannot finish until another has started.
Microsoft Project Users: In Microsoft Project you create task dependencies by “linking”tasks. PERT Chart EXPERT supports the linking of tasks by dragging from one task to anotherto create a dependency (or from within one task to empty space to create a new task and adependency).
Predecessors and Successors
The first task between two dependent tasks is considered the Predecessor and the second theSuccessor.
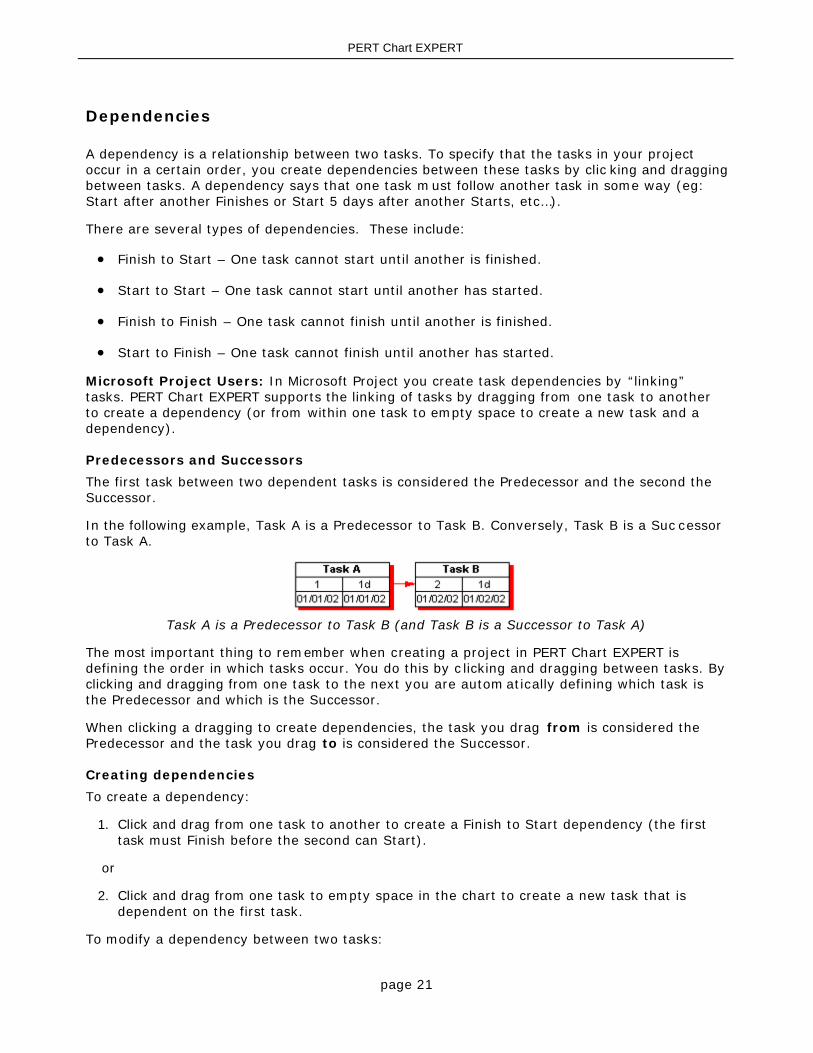
In the following example, Task A is a Predecessor to Task B. Conversely, Task B is a Suc cessorto Task A.
Task A is a Predecessor to Task B (and Task B is a Successor to Task A)
The most important thing to remember when creating a project in PERT Chart EXPERT isdefining the order in which tasks occur. You do this by c licking and dragging between tasks. Byclicking and dragging from one task to the next you are autom atically defining which task isthe Predecessor and which is the Successor.
When clicking a dragging to create dependencies, the task you drag from is considered thePredecessor and the task you drag to is considered the Successor.
Creating dependencies
To create a dependency:
1. Click and drag from one task to another to create a Finish to Start dependency (the firsttask must Finish before the second can Start).
or
2. Click and drag from one task to empty space in the chart to create a new task that isdependent on the first task.
To modify a dependency between two tasks:

page 22
PERT Chart EXPERT
1. Click and drag between any two dependent tasks. This displays a form showing thedependency that exists between these two tasks. Use the form to change thedependency.
or
2. Doubleclick the dependency line between two tasks. This displays a form showing thedependency that exists between these two tasks. Use the form to change the dependency.
See also: Scheduling and Critical Path
page 23
PERT Chart EXPERT
Scheduling
PERT Chart EXPERT schedules tasks based on the information you enter. It uses the Projec tStart Date (or Project Finish Date when scheduling from the Project Finish), Duration,Dependencies and Constraints to calculate when each task must Start and Finish. PERT ChartEXPERT also calculates the Critical Path (see Critical Path). Below is an explanation of howtasks are scheduled.
Tasks are scheduled based on the following:
1. By Project Start Date – If a task does not have a dependency, Constraint Date or ActualStart then the task is scheduled to start on the Project Start Date and its finish isdetermined by the Duration of the task.
2. By Duration – Each task’s finish date is determined by the Start Date plus the Durationyou enter taking into account the Calendar (working and non-working days, hours perday, etc.).
3. By Dependencies – If a task has a dependency but does not have a Constraint Date orActual Start then the task is scheduled based on the dependency.
4. By Constraint Date – If a task has a Constraint Date then it schedules the task based onthe Constraint Date and Constraint Type.
5. By Actual Start/Finish – If a task has an Actual Start or Actual Finish it will bescheduled based on these dates.
Each of these concepts is explained below:
Project Start Date and Project Finish Date
The Project Start Date in PERT Chart EXPERT is more then just the date on which the projec tstarts. The Project Start Date is used to define the Start date for all tasks that do not havedependencies, Constraint Dates or an Actual Start.
By default, the Project Start Date is set to the current date when you open a New file. Tochange the Project Start Date:
1. Select the Tools-Chart Settings menu.
2. Select Schedule from Project Start date.
3. Enter a date into the Project Start date in the field.
To schedule from the Finish of the project, select the Schedule from Project Start date optionand enter a date into the Project Finish date. When you schedule from the Project Finish, alltasks are given an As Late As Possible constraint and are schedule backwards from the dateyou enter.
Duration
The duration is the amount of time it takes to complete a task. A duration for a task can beentered in Minutes, Hours, Days, Weeks, Months or Years. A duration can be entered into theDuration field using the following format:
M = Minutes
H = Hours
page 24
PERT Chart EXPERT
D = Days
W = Weeks
MO = Months
Y = Years
For example, for a 10 day task you can simply enter 10d in the duration field, a 2 week taskwould be 2w.
When scheduling from the start of the project (check the option “Schedule from Project StartDate” under Tools-Chart Settings), the duration is used to calculate the Finish date of a task.
When scheduling from the finish of the project (deselect the option “Schedule from ProjectStart Date” under Tools-Chart Settings), the duration is used to calculate the Start date of atask.
Note: The above duration units take into acc ount the Calendar (Working and Non-WorkingTime). By default, PERT Chart EXPERT provides a standard 5 day workweek, 8 hour workdaycalendar. The duration you enter will work around this calendar and as you c hange thiscalendar your schedule will change accordingly. For example, if a task starts on Wednesdaymorning and you enter a duration of 5 Days then the task will Finish on the following Tuesdayevening (5 working days from Wednesday).
Durations can also be entered in Elapsed Days. Elapsed days ignore the c alendar andschedules based on a 24 hour day, 7 days a week with no non-working days. Elapsed durationunits are defined by entering an E prior to the Duration unit. For exam ple, 12eh for 12 ElapsedHours or 5ed for 5 Elapsed Days. A duration of 5 Elapsed Days from Wednesday would makethe finish of a task occur on Sunday evening.
To enter the Duration:
1. If the Duration field is displayed in the Task boxes on the sc reen, click in this field andtype the Duration.
or
2. Doubleclick the task and type the Duration into the Duration field.
Dependencies
A dependency is a relationship between tasks specifying that one task cannot start or finishuntil another task has started or finished. A dependency is the single most important factor fordetermining the schedule of tasks.
When planning projects, many tasks must happen in a certain order. This order is defined bycreating dependencies between tasks or “linking” tasks to specify that a particular task has tofinish before another can start or that one task can only start after another has worked for 5days, etc. One of the main features of PERT Chart EXPERT is the ability to click and drag toeasily create dependencies between tasks.
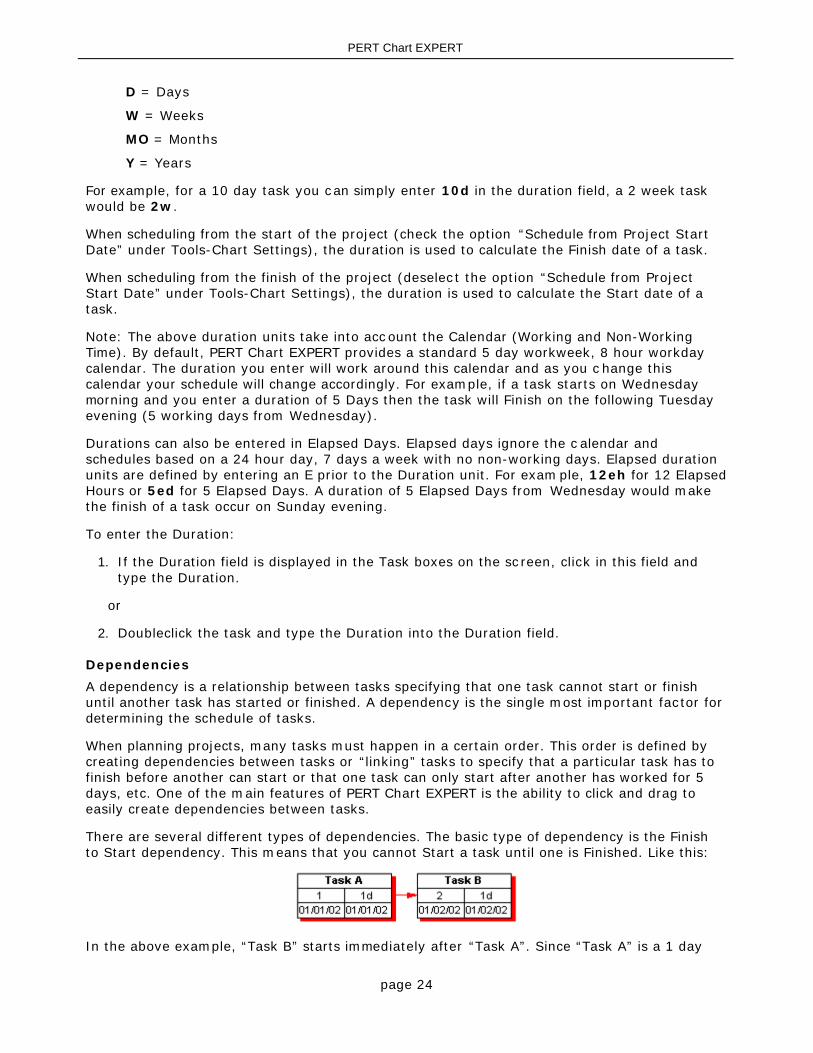
There are several different types of dependencies. The basic type of dependency is the Finishto Start dependency. This means that you cannot Start a task until one is Finished. Like this:
In the above example, “Task B” starts immediately after “Task A”. Since “Task A” is a 1 day
page 25
PERT Chart EXPERT
task and ends on 01/01/02, “Task B” starts at the beginning of the following day (01/02/02).The date and time that a task can start following its dependent task is determ ined by theCalendar. See also Calendar.
Note: When you have a dependency between two tasks, the first task in the chain is called the Predecessor and the second is the Successor. You can also create dependencies by enteringtask id numbers in the Predecessor and Successor fields or you can display the Predecessorand/or Successor field in the task boxes to list the dependent tasks.
To create a Finish to Start dependency in PERT Chart EXPERT:
1. Use the mouse to click from inside one task, drag to another and let go to create thedependency. By default, this creates a Finish to Start dependency between the first taskyou selected and the second task.
or
2. Click within a task and drag to empty space to create a new task with a Finish to Startdependency from the first.
To modify a dependency between two tasks:
1. Click and drag between any two dependent tasks. This displays a form showing thedependency that exists between these two tasks. Use the form to change thisdependency.
or
2. Doubleclick the dependency line between two tasks. This displays a form showing thedependency that exists between these two tasks. Use the form to change thisdependency.
There are several types of dependencies that you can create between tasks. Each of thedependency types is described below:
Finish to Start – One task cannot start until another is finished.
Start to Start – One task cannot start until another has started.
Finish to Finish – One task cannot finish until another is finished.
Start to Finish – One task cannot finish until another has started.
Lag
Most tasks in a project start immediately after one has finished but occ asionally you may needto enter a delay. When there is an amount of time that must transpire before the second taskmust occur you can use a “lag” for this. A lag is the amount of time that the second task mustwait after the first task starts or finishes.
For example, a Finish to Start dependency with a 5 day lag means that the successor taskcannot start until 5 days after the predecessor task has finished. Consider the followingexample where Task A is linked to Task B with the various types of dependencies and lags:
Finish to Start with a 5 day lag – Task B cannot start until 5 days after Task A finishes.
Start to Start with a 5 day lag – Task B cannot start until 5 days after Task A starts.
Finish to Finish with a 5 day lag – Task B cannot finish until 5 days after Task A finishes.
page 26
PERT Chart EXPERT
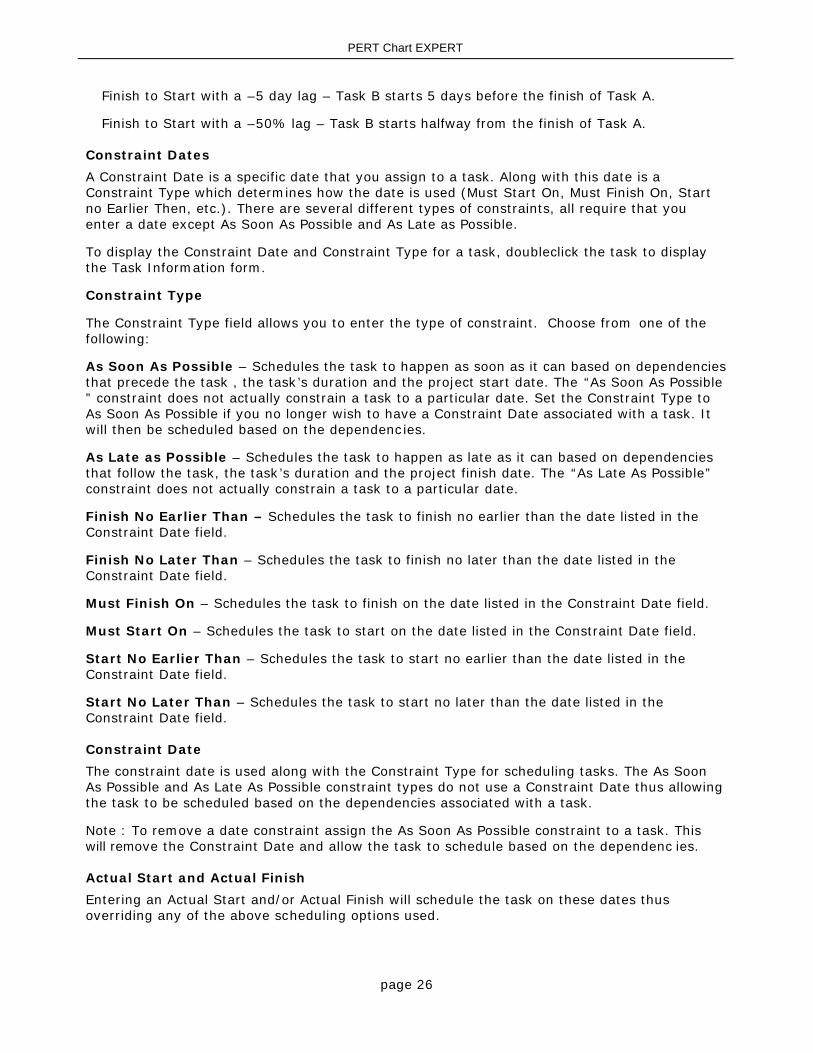
Finish to Start with a –5 day lag – Task B starts 5 days before the finish of Task A.
Finish to Start with a –50% lag – Task B starts halfway from the finish of Task A.
Constraint Dates
A Constraint Date is a specific date that you assign to a task. Along with this date is aConstraint Type which determines how the date is used (Must Start On, Must Finish On, Startno Earlier Then, etc.). There are several different types of constraints, all require that youenter a date except As Soon As Possible and As Late as Possible.
To display the Constraint Date and Constraint Type for a task, doubleclick the task to displaythe Task Information form.
Constraint Type
The Constraint Type field allows you to enter the type of constraint. Choose from one of thefollowing:
As Soon As Possible – Schedules the task to happen as soon as it can based on dependenciesthat precede the task , the task’s duration and the project start date. The “As Soon As Possible” constraint does not actually constrain a task to a particular date. Set the Constraint Type toAs Soon As Possible if you no longer wish to have a Constraint Date associated with a task. Itwill then be scheduled based on the dependencies.
As Late as Possible – Schedules the task to happen as late as it can based on dependenciesthat follow the task, the task’s duration and the project finish date. The “As Late As Possible”constraint does not actually constrain a task to a particular date.
Finish No Earlier Than – Schedules the task to finish no earlier than the date listed in theConstraint Date field.
Finish No Later Than – Schedules the task to finish no later than the date listed in theConstraint Date field.
Must Finish On – Schedules the task to finish on the date listed in the Constraint Date field.
Must Start On – Schedules the task to start on the date listed in the Constraint Date field.
Start No Earlier Than – Schedules the task to start no earlier than the date listed in theConstraint Date field.
Start No Later Than – Schedules the task to start no later than the date listed in theConstraint Date field.
Constraint Date
The constraint date is used along with the Constraint Type for scheduling tasks. The As SoonAs Possible and As Late As Possible constraint types do not use a Constraint Date thus allowingthe task to be scheduled based on the dependencies associated with a task.
Note : To remove a date constraint assign the As Soon As Possible constraint to a task. Thiswill remove the Constraint Date and allow the task to schedule based on the dependenc ies.
Actual Start and Actual Finish
Entering an Actual Start and/or Actual Finish will schedule the task on these dates thusoverriding any of the above scheduling options used.

page 27
PERT Chart EXPERT
page 28
PERT Chart EXPERT
Critical Path
The Critical Path is a schedule calculation that determines the longest path to the end of aproject or to the end of a set of tasks. PERT Chart EXPERT can calculate the Critical Path in twoways. These are:
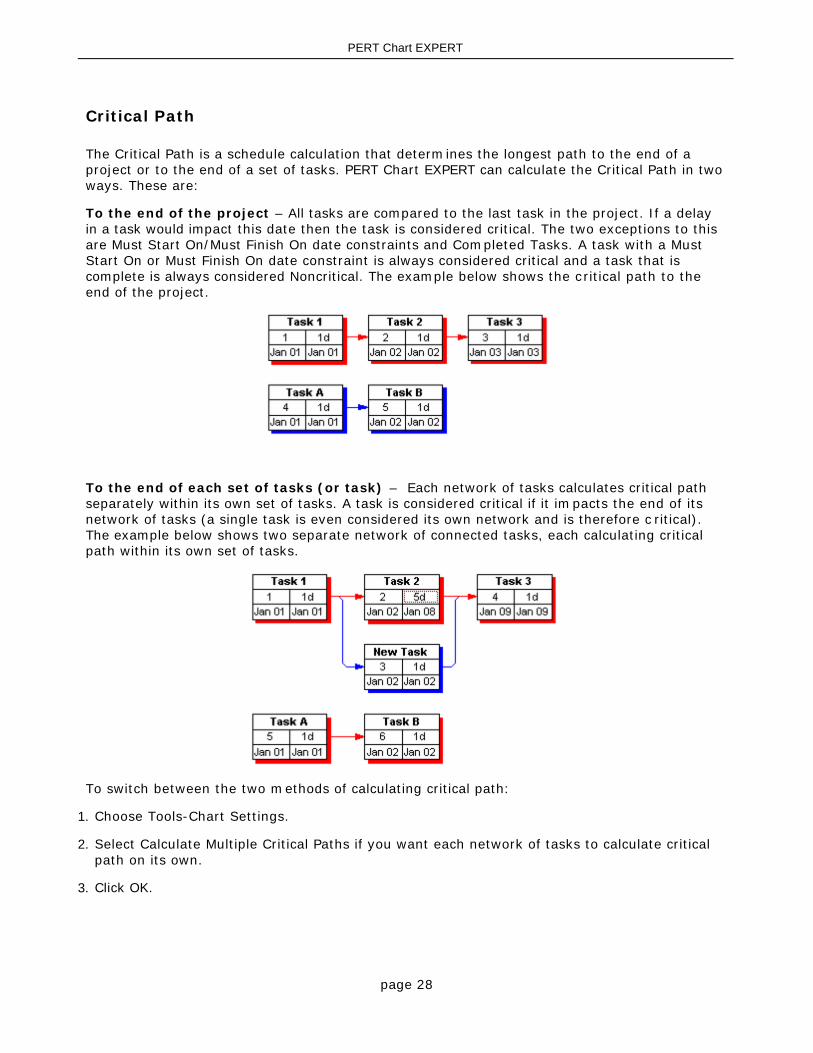
To the end of the project – All tasks are compared to the last task in the project. If a delayin a task would impact this date then the task is considered critical. The two exceptions to thisare Must Start On/Must Finish On date constraints and Completed Tasks. A task with a MustStart On or Must Finish On date constraint is always considered critical and a task that iscomplete is always considered Noncritical. The example below shows the critical path to theend of the project.
To the end of each set of tasks (or task) – Each network of tasks calculates critical pathseparately within its own set of tasks. A task is considered critical if it impacts the end of itsnetwork of tasks (a single task is even considered its own network and is therefore c ritical).The example below shows two separate network of connected tasks, each calculating criticalpath within its own set of tasks.
To switch between the two methods of calculating critical path:
1. Choose Tools-Chart Settings.
2. Select Calculate Multiple Critical Paths if you want each network of tasks to calculate criticalpath on its own.
3. Click OK.
page 29
PERT Chart EXPERT
Moving & Repositioning Tasks
Task boxes in PERT Chart EXPERT are positioned in the chart either Automatically or Manually.Before you begin clicking and dragging to move tasks around, it is a good idea to understandthese two concepts.
Automatic Box Positioning
Automatic Box Positioning means that PERT Chart EXPERT determines the best location forpositioning boxes in the chart. In general it tries to place a Successor to a task directly to theright of its Predecessor but there are many other rules for placing boxes to account for taskswithout dependencies, multiple successors and different types of dependenc ies (like Start toStart, etc).
By default, all boxes are positioned Automatically until you manually move a box. Once youmove a box then the entire PERT chart becomes “locked” and boxes are no longerautomatically positioned.
A PERT chart that is “locked” will display the word LOCK in the lower right corner of theprogram and the Lock toolbar button will appear pressed.
Click the Lock toolbar button to Unlock and automatically position all tasks in the chart. Or,select a group of tasks on the screen and choose Format-Layout Selected to automaticallyposition just the currently selected tasks.
When you create a PERT chart from Microsoft Project, a chart is created and the PERT boxesare Automatically positioned. As mentioned, if you move a task then the entire PERT chartbecomes “locked” and boxes are no longer automatically positioned. The exception to this is ifyou go back to Microsoft Project and add tasks. Upon returning to PERT Chart EXPERT, allboxes that were previously locked will stay in place and “new” boxes will be added to the PERTChart and Automatically placed in the most logical position relative to the locked boxes.
Manual Box Positioning
You can click and drag the edge of a box and place it anywhere in the chart. When youmanually position boxes this way the automatic positioning of boxes is turned off and all boxesare locked into position.
To move a task in PERT Chart EXPERT:
1. Place the cursor on the edge of a box until you see a four-way arrow.
2. Click and drag this box to a new location in the chart.
To move multiple tasks:
1. Click on empty space in the chart and drag to enclose a group of tasks.
2. Click the edge of one of the tasks and drag this group to a new location.
You can also Ctrl-Click to select multiple tasks and move them (hold the Ctrl key down whileselecting multiple tasks with your mouse. Then drag them to a new location in the chart).
In both cases above, if you place tasks in between rows or columns or if you place a task ontop of another then it may create a new row or column to accommodate the moved tasks.
When you click and drag move a box then the entire PERT chart becomes “locked” and boxesare no longer automatically positioned. Boxes will stay in their positions until you Unloc k them

page 30
PERT Chart EXPERT
or change a feature that requires a reposition of the boxes.
A PERT chart that is “locked” will display the word LOCK in the lower right corner of theprogram and the Lock toolbar button will appear pressed.
Click the Lock toolbar button to Unlock and automatically position all tasks in the chart. Or,select a group of tasks on the screen and choose Format-Layout Selected to automaticallyposition just the currently selected tasks.
Note: Certain features like grouping and applying a timescale may rearrange the boxes in thechart thus overriding the manual box positions that you may have used. If you have manuallypositioned tasks in the chart and you wish to group or timescale the chart, try making a copyof the current View or try switching Views. Each View maintains box positions separatelytherefore you can have one view where your boxes are positioned exactly where you wantthem and another View using the Group or Timescale feature with automatic box positions.
page 31
PERT Chart EXPERT
Displaying Fields in Task Boxes
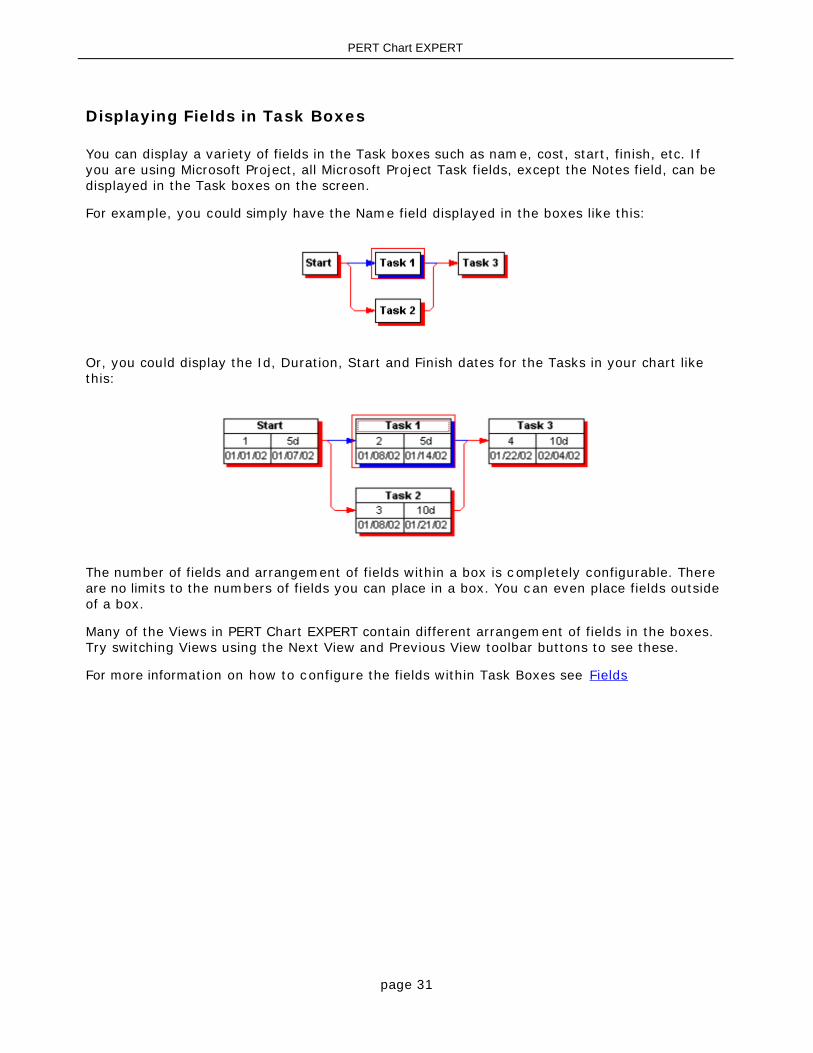
You can display a variety of fields in the Task boxes such as name, cost, start, finish, etc. Ifyou are using Microsoft Project, all Microsoft Project Task fields, except the Notes field, can bedisplayed in the Task boxes on the screen.
For example, you could simply have the Name field displayed in the boxes like this:
Or, you could display the Id, Duration, Start and Finish dates for the Tasks in your chart likethis:
The number of fields and arrangement of fields within a box is c ompletely configurable. Thereare no limits to the numbers of fields you can place in a box. You can even place fields outsideof a box.
Many of the Views in PERT Chart EXPERT contain different arrangement of fields in the boxes.Try switching Views using the Next View and Previous View toolbar buttons to see these.
For more information on how to configure the fields within Task Boxes see Fields
page 32
PERT Chart EXPERT
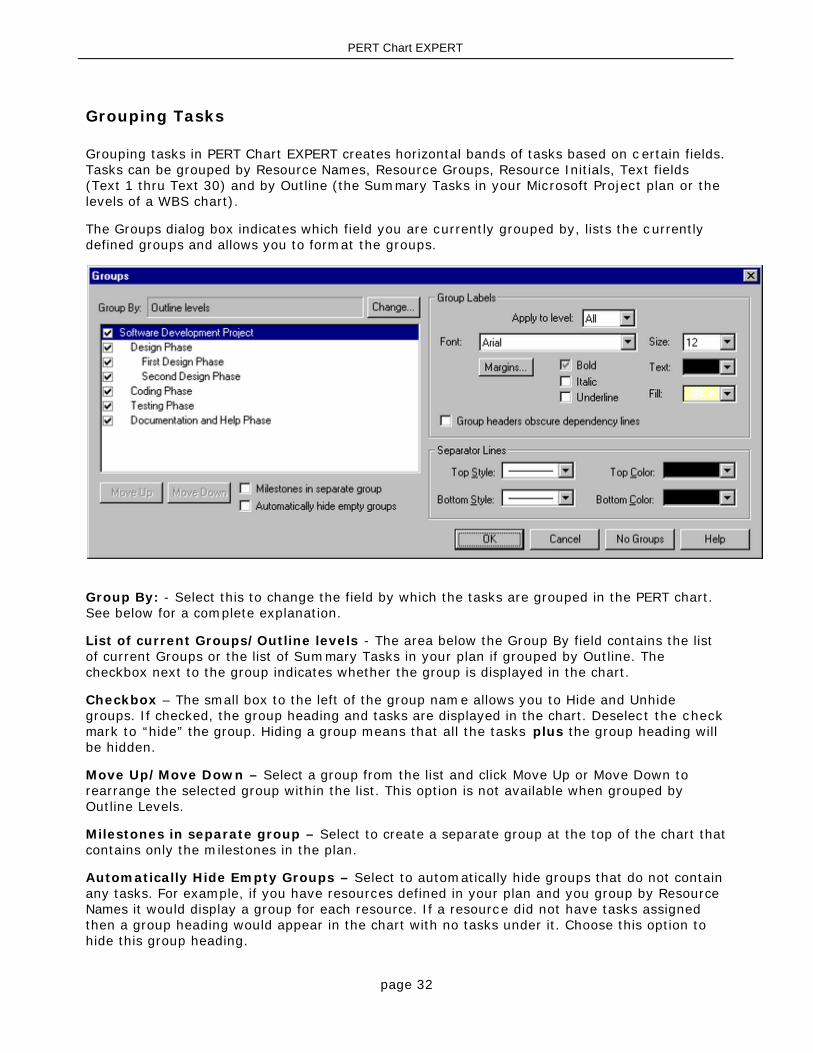
Grouping Tasks
Grouping tasks in PERT Chart EXPERT creates horizontal bands of tasks based on c ertain fields.Tasks can be grouped by Resource Names, Resource Groups, Resource Initials, Text fields(Text 1 thru Text 30) and by Outline (the Summary Tasks in your Microsoft Project plan or thelevels of a WBS chart).
The Groups dialog box indicates which field you are currently grouped by, lists the currentlydefined groups and allows you to format the groups.
Group By: - Select this to change the field by which the tasks are grouped in the PERT chart.See below for a complete explanation.
List of current Groups/Outline levels - The area below the Group By field contains the listof current Groups or the list of Summary Tasks in your plan if grouped by Outline. Thecheckbox next to the group indicates whether the group is displayed in the chart.
Checkbox – The small box to the left of the group name allows you to Hide and Unhidegroups. If checked, the group heading and tasks are displayed in the chart. Deselect the checkmark to “hide” the group. Hiding a group means that all the tasks plus the group heading willbe hidden.
Move Up/Move Down – Select a group from the list and click Move Up or Move Down torearrange the selected group within the list. This option is not available when grouped byOutline Levels.
Milestones in separate group – Select to create a separate group at the top of the chart thatcontains only the milestones in the plan.
Automatically Hide Empty Groups – Select to automatically hide groups that do not containany tasks. For example, if you have resources defined in your plan and you group by ResourceNames it would display a group for each resource. If a resource did not have tasks assignedthen a group heading would appear in the chart with no tasks under it. Choose this option tohide this group heading.
page 33
PERT Chart EXPERT
Group Labels – The options listed below this topic allow you to configure how the Groupheadings appear in the chart. Select Apply to level to format all groups at once or a specificlevel. Choose Font, Colors, etc. Select Group Headers obscure dependency lines todisplay the dependency lines behind the Group headings on the sc reen.
Separator Lines – Select the line style and color of the group headings.
No Groups – Select this to remove grouping from the chart.
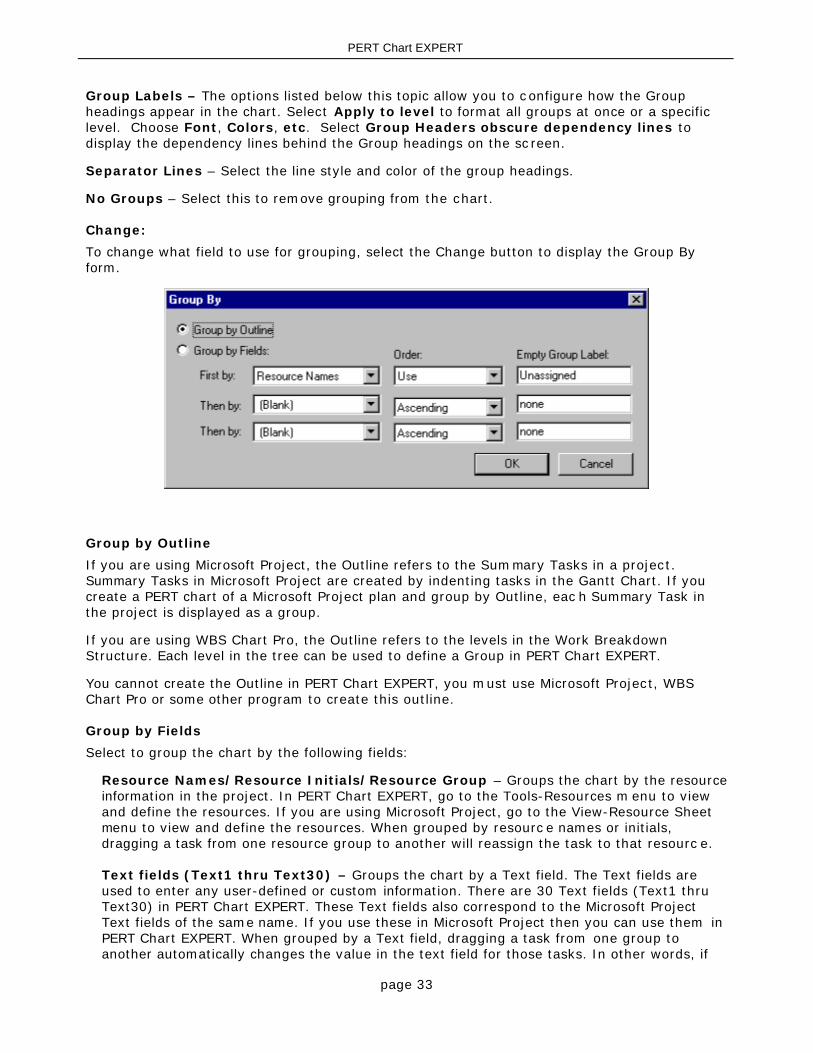
Change:
To change what field to use for grouping, select the Change button to display the Group Byform.
Group by Outline
If you are using Microsoft Project, the Outline refers to the Summary Tasks in a project.Summary Tasks in Microsoft Project are created by indenting tasks in the Gantt Chart. If youcreate a PERT chart of a Microsoft Project plan and group by Outline, eac h Summary Task inthe project is displayed as a group.
If you are using WBS Chart Pro, the Outline refers to the levels in the Work BreakdownStructure. Each level in the tree can be used to define a Group in PERT Chart EXPERT.
You cannot create the Outline in PERT Chart EXPERT, you must use Microsoft Project, WBSChart Pro or some other program to create this outline.
Group by Fields
Select to group the chart by the following fields:
Resource Names/Resource Initials/Resource Group – Groups the chart by the resourceinformation in the project. In PERT Chart EXPERT, go to the Tools-Resources m enu to viewand define the resources. If you are using Microsoft Project, go to the View-Resource Sheetmenu to view and define the resources. When grouped by resourc e names or initials,dragging a task from one resource group to another will reassign the task to that resourc e.
Text fields (Text1 thru Text30) – Groups the chart by a Text field. The Text fields areused to enter any user-defined or custom information. There are 30 Text fields (Text1 thruText30) in PERT Chart EXPERT. These Text fields also correspond to the Microsoft ProjectText fields of the same name. If you use these in Microsoft Project then you can use them inPERT Chart EXPERT. When grouped by a Text field, dragging a task from one group toanother automatically changes the value in the text field for those tasks. In other words, if
page 34
PERT Chart EXPERT
you are grouped by Text1 and you drag from Group A to Group B the task will change thevalue in its Text1 field to Group B.
Order
You can arrange the groups in the chart based on the options in the Order list. They are:
Ascending – Lists the groups in the chart from the lowest to the highest value (1, 2, 3… a,b, c).
Descending – Lists the groups in the chart from the highest to the lowest value (3, 2, 1… c,b, a).
Use – Lists the group in the chart in the order that the fields are used. For example, if yougroup by resource, it would list the resources in the order that they are defined in theResource List (under Tools-Resources in PERT Chart EXPERT or in the Resource View inMicrosoft Project).
Note: If the chart is grouped by the Resource or Text fields you can rearrange a groupwithin this list by selecting the Move Up and Move Down buttons.
Empty Group Label – If there are tasks in the project that do not contain any value for thefield in which you are grouping then these tasks are included in a separate group. Use theEmpty Group Label to identify this group. For example, if you are grouping by Resource andthere are tasks with no resources assigned then these will be placed into a separate group withthe title that is entered in the Empty Group Label (such as “Unassigned”).
page 35
PERT Chart EXPERT
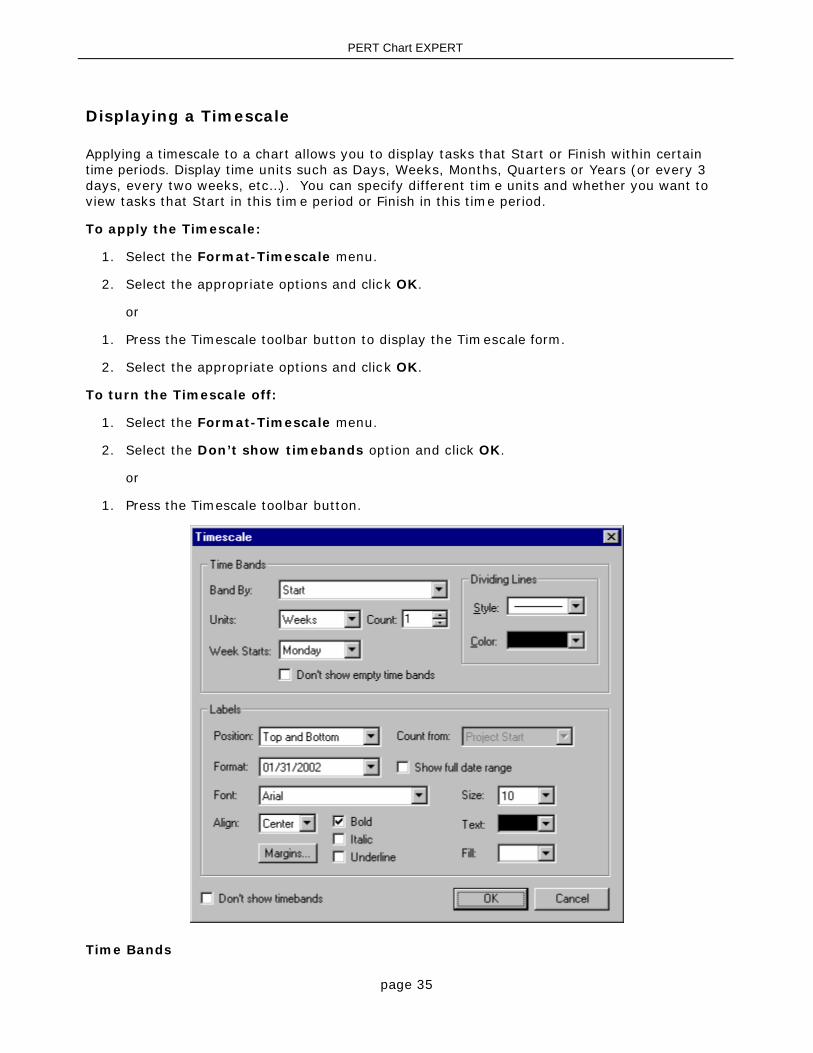
Displaying a Timescale
Applying a timescale to a chart allows you to display tasks that Start or Finish within certaintime periods. Display time units such as Days, Weeks, Months, Quarters or Years (or every 3days, every two weeks, etc…). You can specify different tim e units and whether you want toview tasks that Start in this time period or Finish in this time period.
To apply the Timescale:
1. Select the Format-Timescale menu.
2. Select the appropriate options and click OK.
or
1. Press the Timescale toolbar button to display the Timescale form.
2. Select the appropriate options and click OK.
To turn the Timescale off:
1. Select the Format-Timescale menu.
2. Select the Don’t show timebands option and click OK.
or
1. Press the Timescale toolbar button.
Time Bands
page 36
PERT Chart EXPERT
Band By – Select the field to use when placing a task in the time band. If you select Start,all tasks that Start during the time period are displayed in the time band. If you select Finishthen all tasks that finish within that time period are displayed in the time band.
Units – Select to display the timescale by Hour, Day, Week, Month, Quarter, Half Year orYear time units.
Count – Select the time interval between units. Enter 1 to display every time period, 2 todisplay every other time period and so on. For example, if you were displaying Weeks as theUnits, entering 2 in the Count would display a time band every two weeks.
Week Starts – Specify the day of the week to use when displaying weeks as the time unit.
Don’t Show Empty Time Bands – Hides the time bands in the chart that do not containtasks.
Dividing Lines – Defines the color and line style of the vertical timescale dividing lines.
Labels
Position – Select to display the timescale labels at the Top, Bottom or both Top andBottom.
Count From – This option only applies when you choose to display dates (using the Form atoption) as Day 1, Day 2… or Week 1, Week 2, etc… The Project Start option uses theProject Start Date to start counting up from this date, eg: Day 1, Day 2, etc. Project Finishuses the Project Finish Date to start counting down from this date eg: Day –5, Day –4,etc... Earliest Task uses the earliest task displayed on the screen to start counting. LatestTask uses the latest task displayed on the screen to start counting down from this date.Today uses today’s date to start counting.
Format – Select the date format for the timescale.
Show Full Date Range – Displays the full range of dates when applicable. For example, ifa two week period is selected, the full date range would display dates as Jan 1, 2002 – Jan14, 2002 instead or Jan 1, 2002.
Font – Select the font size for the timescale labels.
Align – Select to align the labels within the time band either left, right or center.
Size – Select the font size of the timescale label.
Text – Select this to define the color of the timescale label text.
Fill – Select this to define the background color of the timescale labels.
Margins – Select to adjust the margins around the timescale label.
Don’t show timebands – Select this option and click OK to turn off the timescale so it isnot displayed on the chart. You can also press the Timescale toolbar button to turn off thetimescale.
page 37
PERT Chart EXPERT
Tracing Tasks
The Trace feature lets you select a task in PERT Chart EXPERT and display only those tasksthat lead up to that task and/or follow that task. You can also specify that only Critical Tasksare included in the trace and that the trace be limited to so many tasks forward or backwardsfrom the selected task.
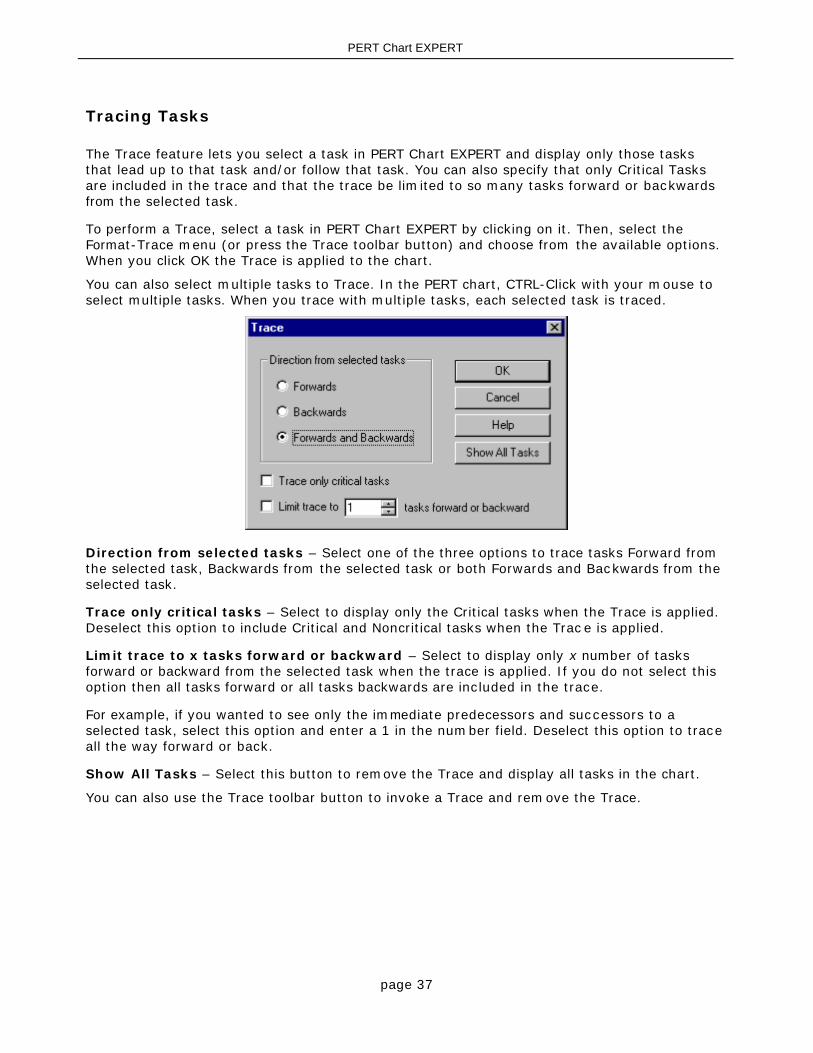
To perform a Trace, select a task in PERT Chart EXPERT by clicking on it. Then, select theFormat-Trace menu (or press the Trace toolbar button) and choose from the available options.When you click OK the Trace is applied to the chart.
You can also select multiple tasks to Trace. In the PERT chart, CTRL-Click with your mouse toselect multiple tasks. When you trace with multiple tasks, each selected task is traced.
Direction from selected tasks – Select one of the three options to trace tasks Forward fromthe selected task, Backwards from the selected task or both Forwards and Backwards from theselected task.
Trace only critical tasks – Select to display only the Critical tasks when the Trace is applied.Deselect this option to include Critical and Noncritical tasks when the Trac e is applied.
Limit trace to x tasks forward or backward – Select to display only x number of tasksforward or backward from the selected task when the trace is applied. If you do not select thisoption then all tasks forward or all tasks backwards are included in the trace.
For example, if you wanted to see only the immediate predecessors and successors to aselected task, select this option and enter a 1 in the number field. Deselect this option to traceall the way forward or back.
Show All Tasks – Select this button to remove the Trace and display all tasks in the chart.
You can also use the Trace toolbar button to invoke a Trace and remove the Trace.

page 38
PERT Chart EXPERT
Fields in PERT Chart EXPERT
There are many different data fields in PERT Chart EXPERT for entering inform ation into,including fields like Name, Duration, Start, Finish, Cost, Work, etc. These fields are sim ilar tothe Task fields found in Microsoft Project.
Note: PERT Chart EXPERT does not use all of the fields of Microsoft Project. PERT Chart EXPERTaccesses most of the data in Microsoft Project’s Task Table. PERT Chart EXPERT does notimport the Notes field from Microsoft Project and certain Resource and Resource Assignmentdata are not accessed by PERT Chart EXPERT.
If you are using Project 98 or Project 95 (version 4.1) some of the fields used in PERT ChartEXPERT are not transferable to these programs since some of the fields are specific to laterversions of MS Project. If you were to use a field in PERT Chart EXPERT that is not supportedby the version of Microsoft Project that you are using then this information would be stored inthe PERT chart file since it cannot be transferred to Microsoft Project. For exam ple, PERT ChartEXPERT supports 20 Flag fields. Project 2000 and Project 98 support these 20 Flag fields butProject 95 does not. If you were using Project 95 and used all 20 Flag fields in PERT ChartEXPERT and then transferred your PERT chart to Project 95, it would transfer the first 10 Flagfields and the remaining 10 would be stored in the PERT chart file.
Tip: You can rename any field in PERT Chart EXPERT using the Field Names… option in theTools menu. This will permanently rename that field in PERT Chart EXPERT so that the newname appears in all forms, dialog boxes and printouts. For example, you could rename theFlag 1 field to Engineering Dept, the Flag 2 field to Sales Dept and so on. See also Field Names
page 39
PERT Chart EXPERT
Printing
Here is a process we recommend for printing your PERT charts:
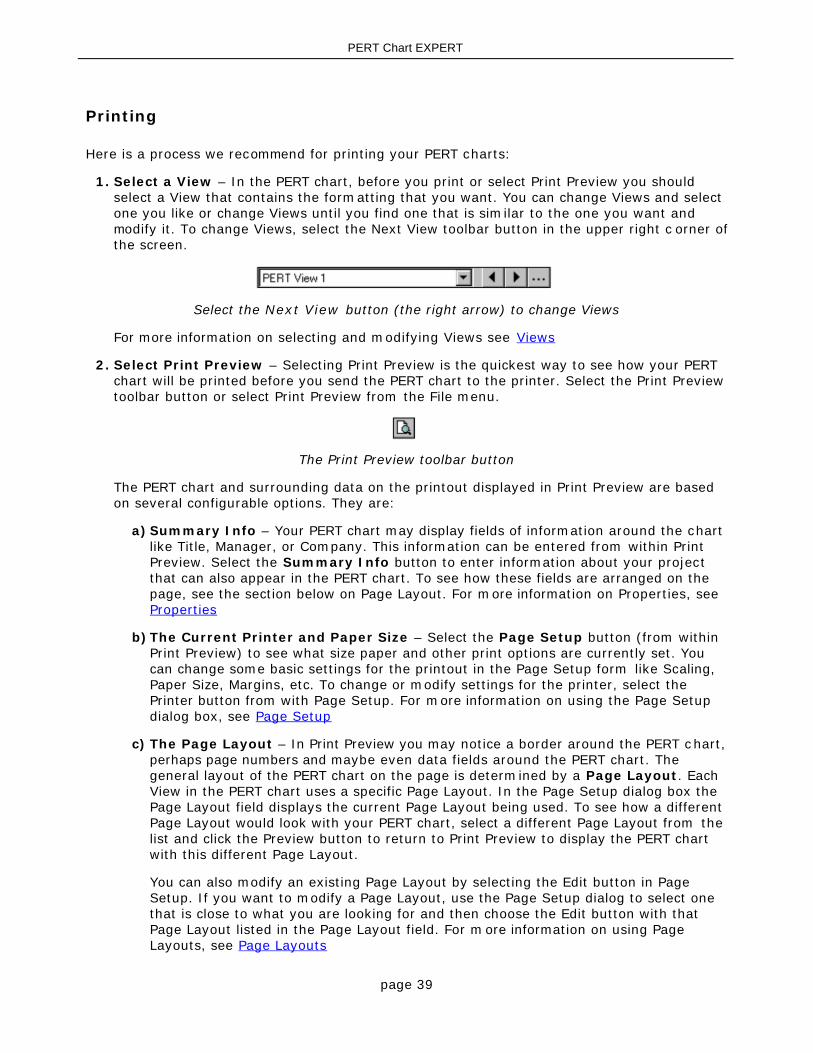
1. Select a View – In the PERT chart, before you print or select Print Preview you shouldselect a View that contains the formatting that you want. You can change Views and selectone you like or change Views until you find one that is similar to the one you want andmodify it. To change Views, select the Next View toolbar button in the upper right c orner ofthe screen.
Select the Next View button (the right arrow) to change Views
For more information on selecting and modifying Views see Views
2. Select Print Preview – Selecting Print Preview is the quickest way to see how your PERTchart will be printed before you send the PERT chart to the printer. Select the Print Previewtoolbar button or select Print Preview from the File menu.
The Print Preview toolbar button
The PERT chart and surrounding data on the printout displayed in Print Preview are basedon several configurable options. They are:
a)Summary Info – Your PERT chart may display fields of information around the chartlike Title, Manager, or Company. This information can be entered from within PrintPreview. Select the Summary Info button to enter information about your projectthat can also appear in the PERT chart. To see how these fields are arranged on thepage, see the section below on Page Layout. For more information on Properties, see Properties
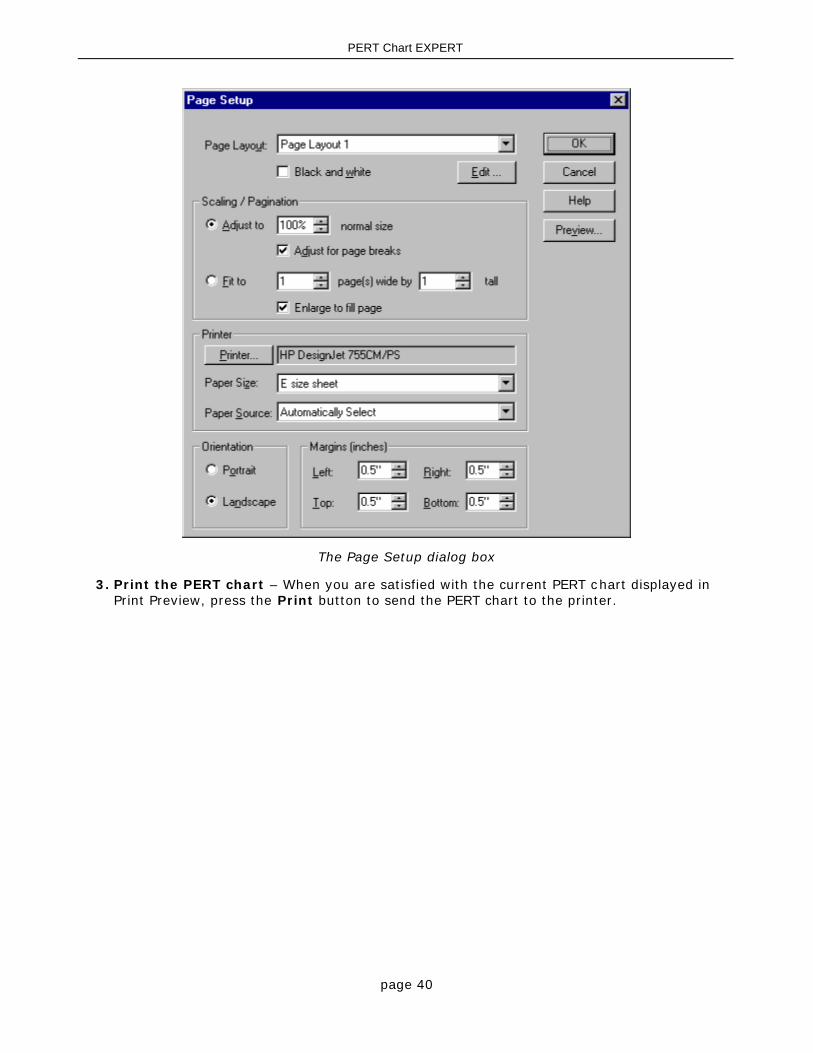
b)The Current Printer and Paper Size – Select the Page Setup button (from withinPrint Preview) to see what size paper and other print options are currently set. Youcan change some basic settings for the printout in the Page Setup form like Scaling,Paper Size, Margins, etc. To change or modify settings for the printer, select thePrinter button from with Page Setup. For more information on using the Page Setupdialog box, see Page Setup
c) The Page Layout – In Print Preview you may notice a border around the PERT chart,perhaps page numbers and maybe even data fields around the PERT chart. Thegeneral layout of the PERT chart on the page is determined by a Page Layout. EachView in the PERT chart uses a specific Page Layout. In the Page Setup dialog box thePage Layout field displays the current Page Layout being used. To see how a differentPage Layout would look with your PERT chart, select a different Page Layout from thelist and click the Preview button to return to Print Preview to display the PERT chartwith this different Page Layout.
You can also modify an existing Page Layout by selecting the Edit button in PageSetup. If you want to modify a Page Layout, use the Page Setup dialog to select onethat is close to what you are looking for and then choose the Edit button with thatPage Layout listed in the Page Layout field. For more information on using PageLayouts, see Page Layouts
page 40
PERT Chart EXPERT
The Page Setup dialog box
3. Print the PERT chart – When you are satisfied with the current PERT chart displayed inPrint Preview, press the Print button to send the PERT chart to the printer.
page 41
PERT Chart EXPERT
Saving PERT charts
A PERT chart is either saved “standalone” or “linked” to a datasource (such as a MicrosoftProject plan, an MPX file or a Text file).
Saving a PERT chart (standalone)
Saving a standalone PERT chart saves all of the project data, box colors, views and form attingoptions into a single file. This is what happens when you simply open PERT Chart EXPERT,create a PERT chart and save the PERT chart. If you only use PERT Chart EXPERT to createyour PERT charts then your charts are always saved “standalone” and this PERT file is acompletely self-contained file.
To save a PERT chart standalone:
1. Choose File-Save (or File-Save As).
2. Select a location to save the file and enter a name for this file in the filename field.
3. Make sure the “save as type” option is set to PERT chart and click OK to save this file.
PERT chart files created in PERT Chart EXPERT have an extension of .PCE.
Saving a PERT chart (linked)
Saving a PERT chart that is “linked” to a datasource saves the PERT chart formatting into thePERT file but the data remains in the datasource.
For example, if you are using PERT Chart EXPERT with Microsoft Project and you create a PERTchart of a Microsoft Project plan, the data is in Microsoft Project but the PERT chartformatting are part of the PERT file (the *.PCE file). The PERT file is then “linked” to thisMicrosoft Project plan. The data that you see in the PERT chart is not actually in PERT ChartEXPERT but a reflection of what is maintained in Microsoft Project. If you make changes to thisdata in PERT Chart EXPERT such as adding new tasks, moving tasks or deleting tasks, this isactually being done dynamically in Microsoft Project.
When you create a PERT chart from a Microsoft Project plan and save the PERT chart (to a .PCEfile) this link is remembered so that the next time you create a PERT chart from this sameMicrosoft Project plan, the PERT chart displays as you left it.
Note: When you Save a PERT chart that is linked to a Microsoft Project plan this also saves theplan in Microsoft Project.
Opening a standalone PERT chart
To open a PERT chart, choose the File-Open menu and locate the appropriate PERT chart file.Select the PERT chart file and choose Open.
Opening a PERT chart linked to a Microsoft Project plan
There are two ways to open a PERT chart that is linked to a Microsoft Project plan. They are:
1. From within Microsoft Project, click the PERT Chart EXPERT toolbar button. If you havepreviously created a PERT chart from this Microsoft Project plan and saved the PERTchart, it will remember this and automatically open this chart for you to continue working.If it does not open the previously saved PERT chart, see the Note below.
2. From within PERT Chart EXPERT, if you open the PERT chart (*.PCE file) that is linked to
page 42
PERT Chart EXPERT
the Microsoft Project plan it will automatically open Microsoft Project and thecorresponding Microsoft Project plan.
Note: If you rename or move a Microsoft Project plan that is linked to a PERT c hart file it maynot be able to locate this PERT chart file the next time you to create a PERT chart from theMicrosoft Project plan. If you move or rename a Microsoft Project plan that is linked to aparticular PERT chart file, perform the following to link this new MS Projec t plan to the PERTchart file:
1. Open PERT Chart EXPERT.
2. Select File-Open.
3. Click on the PERT chart file (the .PCE file) that was linked to the Microsoft Project plan.
4. Click "Link to another datasource" and click Open.
5. Locate the MS Project plan and select Open.
When you save the PERT chart it will remember the name and location of the new Mic rosoftProject to which it is linked.
page 43
PERT Chart EXPERT
Transferring a PERT chart to Microsoft Project
Use PERT Chart EXPERT to create your projects first and then transfer these charts to MicrosoftProject for further scheduling.
If you create a new chart in PERT Chart EXPERT, configure this chart and save this chart, it isconsidered a “standalone” PERT chart. This means that the PERT chart file is a self-containedfile with all of the data and formatting within this file.
In PERT Chart EXPERT you can make dependencies between tasks plus modify various fields ofinformation about the tasks in your projec t. PERT Chart EXPERT contains a simple schedulingsystem. For more elaborate scheduling, to manage resources, do resource leveling, etc. youcan transfer the PERT chart to Microsoft Project.
To transfer the current PERT chart to Microsoft Project, select the G oto Project toolbar button.
The Goto Project toolbar button
Transferring a standalone PERT chart to Microsoft Project means that the data that exists in thePERT chart will be removed from the PERT chart and placed into a Microsoft Project plan. ThePERT chart then becomes linked to this Microsoft Project plan. You are prompted to save theMicrosoft Project plan and you must enter a filename for this Microsoft Project plan to continuetransferring the PERT chart to Microsoft Project. You will then have two files; the MicrosoftProject file containing the data (information like names, start dates, finish dates, costs, etc .),and the PERT chart file containing the formatting options that are PERT chart-specific (such ascustom colors, box placement, etc.).
After transferring the data to Microsoft Project, the next time you open the PERT chart it notonly opens the PERT chart with all the formatting but also opens the corresponding MicrosoftProject file to which it is now linked.
You can also open the Microsoft Project plan first and select the Goto PERT Chart EXPERTbutton to open the saved PERT chart corresponding to the Microsoft Project plan.

page 44
PERT Chart EXPERT
Transferring a PERT chart to WBS Chart Pro
WBS Chart Pro is the other product from our company (Critical Tools) that allows you to planand display projects using a Top-Down type of chart. This c hart displays the Work Breakdown(WBS) of the phases and tasks in a project. You can seamlessly transfer projects from PERTChart EXPERT to WBS Chart Pro and vice versa.
To transfer the current PERT chart to WBS Chart Pro just press the Goto WBS Chart Pro toolbarbutton.
When you transfer a PERT chart to WBS Chart Pro your PERT chart is saved to the WBS ChartPro format (a .WBS file) and then immediately opened in WBS Chart Pro. You will no longerhave a PERT chart file, it will become a WBS chart file. To create a PERT c hart file again simplypress the Goto PERT Chart EXPERT button in WBS Chart Pro to transfer it back to PERT ChartEXPERT.
Note: If the Goto WBS Chart Pro button is not available (is grayed out) this means that youeither do not have WBS Chart Pro or you do not have a version of WBS Chart Pro that workswith PERT Chart EXPERT. You must have version 4.1 or greater of WBS Chart Pro for this towork. Select the Help-About menu to see which version you have. Contact Critical Tools forinformation on obtaining a version of WBS Chart Pro that works with PERT Chart EXPERT.
See Contacting Critical Tools
page 45
PERT Chart EXPERT
Creating a PERT chart from your MS Project plans
To create a PERT chart from an existing Microsoft Project plan:
1. Start Microsoft Project and open the desired Microsoft Project plan.
2. Click the PERT Chart EXPERT toolbar button*.
The PERT Chart EXPERT toolbar button
PERT Chart EXPERT is started and the current project plan from Microsoft Project is displayedin a PERT chart.
When you create a PERT chart from an existing Microsoft Project plan, the PERT chart isdynamically linked to this Microsoft Project plan. Any changes made in the PERT chart areimmediately reflected in Microsoft Project.
Tip: When a PERT chart is dynamically linked to a Microsoft Project plan the word LINKEDappears in the lower right corner of the screen.
Saving a PERT chart linked to a Microsoft Project plan
After modifying the linked PERT chart, when it comes time to save and c lose your PERT chart ithelps to remember that the data is stored in Microsoft Project (a .MPP file) and the PERT chartformatting is stored in the PERT chart file (a .PCE file).
When you save a PERT chart that is linked to a Microsoft Project plan, it saves both the PERTchart file (.PCE) and the corresponding Microsoft Project plan (.MPP).
The saved PERT chart contains the formatting of the chart, and a link to the Microsoft Projectplan where the data is stored.
To save the PERT chart, select the File menu and choose Save (or Save As). Specify a filenameand click OK.
Opening a PERT chart linked to a Microsoft Project plan
There are two ways to open a PERT chart that is linked to a Microsoft Project plan. They are:
1. From within Microsoft Project, click the PERT Chart EXPERT toolbar button. If you havepreviously created a PERT chart from this Microsoft Project plan and saved the PERTchart, it will remember this and automatically open this chart for you to continue working.If it does not open the previously saved PERT chart, see the Note below.
2. From within PERT Chart EXPERT, if you open the PERT chart (*.PCE file) that is linked tothe Microsoft Project plan it will automatically open Microsoft Project and thecorresponding Microsoft Project plan.
Note: If you rename or move a Microsoft Project plan that is linked to a PERT c hart file it maynot be able to locate its corresponding PERT chart file. If you move or rename a MicrosoftProject that is linked to a particular PERT chart file, perform the following to link this new MSProject plan to the PERT chart file:
1. Open PERT Chart EXPERT.
2. Select File-Open.
page 46
PERT Chart EXPERT
3. Click on the PERT chart file (the .PCE file) that was linked to the Microsoft Project plan.
4. Click "Link to another datasource" and click Open.
5. Locate the Microsoft Project plan and select Open.
When you save the PERT chart it will remember the name and location of the new Mic rosoftProject to which it is linked.
*If you do not see the PERT Chart EXPERT toolbar button in Microsoft Project, see the helptopic Configuring MS Project for use with PERT Chart EXPERT
If you want to create a PERT chart and Unlink it from the Microsoft Project plan see the topic Unlink

page 47
PERT Chart EXPERT
Tips when using PERT Chart EXPERT with MS Project
When you create a PERT chart from an existing Microsoft Project plan you must remember thatyou are dynamically linked to this plan and any changes made in the PERT chart areimmediately reflected in Microsoft Project. If you add or delete tasks in the PERT c hart, thesetasks are immediately added or deleted in Microsoft Project.
A PERT chart created form an existing Microsoft Project can be saved but this does not savethe data; all project data is still maintained in Microsoft Project. Saving a PERT chart that islinked to a Microsoft Project plan only saves the link and any PERT chart-spec ific items thatcannot be saved in Microsoft Project like box placement, custom box colors and formattingoptions for the PERT chart. See also Saving PERT charts
If you create a PERT chart from an existing Microsoft Project plan and you do not want thisPERT chart to be dynamically linked to the corresponding Microsoft Project plan then you cansave the PERT chart as a “standalone” PERT chart. This will “unlink” the PERT chart from theMicrosoft Project plan and save all of the data to the PERT chart file. Once you save as astandalone chart, this PERT chart cannot be linked back to the original Mic rosoft Project planfrom which it was created. You can only use this standalone PERT chart to create a newMicrosoft Project plan. See also Saving PERT Charts

page 48
PERT Chart EXPERT
Reference (by Menu)
page 49
PERT Chart EXPERT
File Menu
New (File Menu)
Displays a blank screen for creating a new PERT chart.
To create your first task, click and drag anywhere on the blank page to create a task. Click thattask and drag outside of the task to create another task that is dependent on this task or clickand drag in the chart background to add a task that is independent of others.
See also Creating a New PERT chart
page 50
PERT Chart EXPERT
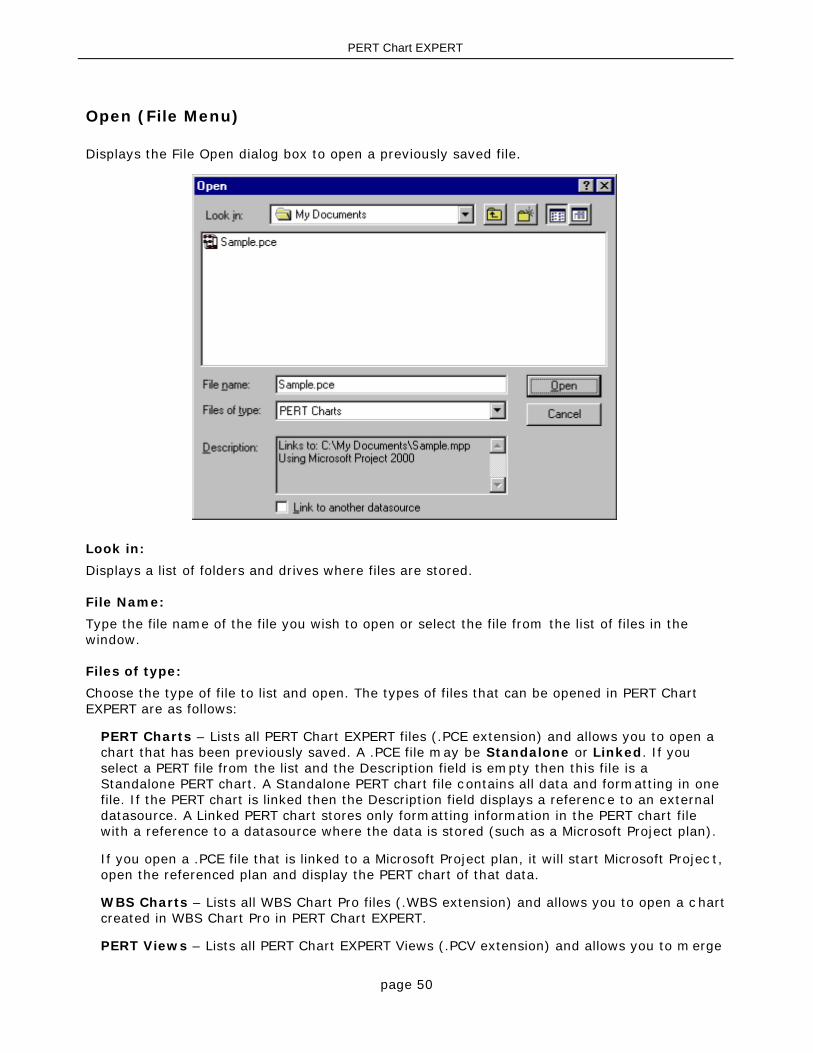
Open (File Menu)
Displays the File Open dialog box to open a previously saved file.
Look in:
Displays a list of folders and drives where files are stored.
File Name:
Type the file name of the file you wish to open or select the file from the list of files in thewindow.
Files of type:
Choose the type of file to list and open. The types of files that can be opened in PERT ChartEXPERT are as follows:
PERT Charts – Lists all PERT Chart EXPERT files (.PCE extension) and allows you to open achart that has been previously saved. A .PCE file may be Standalone or Linked. If youselect a PERT file from the list and the Description field is empty then this file is aStandalone PERT chart. A Standalone PERT chart file contains all data and formatting in onefile. If the PERT chart is linked then the Description field displays a reference to an externaldatasource. A Linked PERT chart stores only formatting information in the PERT chart filewith a reference to a datasource where the data is stored (such as a Microsoft Project plan).
If you open a .PCE file that is linked to a Microsoft Project plan, it will start Microsoft Projec t,open the referenced plan and display the PERT chart of that data.
WBS Charts – Lists all WBS Chart Pro files (.WBS extension) and allows you to open a c hartcreated in WBS Chart Pro in PERT Chart EXPERT.
PERT Views – Lists all PERT Chart EXPERT Views (.PCV extension) and allows you to m erge

page 51
PERT Chart EXPERT
Views into the current PERT chart.
PERT Page Layouts – Lists all PERT Chart EXPERT Page Layouts (.PCP extension) andallows you to merge Page Layouts into the current PERT chart.
Microsoft Project Plans (mpp) – Lists all Microsoft Project files (.MPP extension). If youopen a Microsoft Project Plan in PERT Chart EXPERT it opens this MPP file in MS Project(starting MS Project if necessary) and creates a PERT chart of this MS Project plan.
MPX – Lists all MPX files (.MPX extension) and allows you to create a PERT c hart from theMPX file format. The MPX file format is a text-based version of a Microsoft Projec t plan. Manyapplications including other project management software programs can save to this fileformat thus allowing you to create PERT charts from these programs by opening the MPXfile.
Text – Lists all Text files (TXT extension) and allows you to create a PERT chart from Textfiles.
Description:
If the selected PERT chart is linked to an external datasource (like Microsoft Project) then thisfield displays the file it is linked to and the location of this file.
Link to another datasource – If the current PERT chart is linked to a specific datasourceand you need to link this to another datasource then select this option before you open thePERT chart. When selected, you are prompted to pick a new datasource before opening thePERT chart. The PERT chart then becomes linked to this new datasource. This option isuseful when you have renamed or moved the datasource and allows a linked PERT chart to “find” its datasource.

page 52
PERT Chart EXPERT
Close (File Menu)
Closes the current PERT chart. You are prompted to save the PERT chart if changes have beenmade to the PERT chart since it was opened.

page 53
PERT Chart EXPERT
Save (File Menu)
Saves the current PERT chart to the same file name. If the PERT chart file has never beensaved it will prompt you for a file name.
To save the current file to a different file name, use the Save As command.
For a complete explanation on Saving PERT charts, see the help topic Saving PERT charts
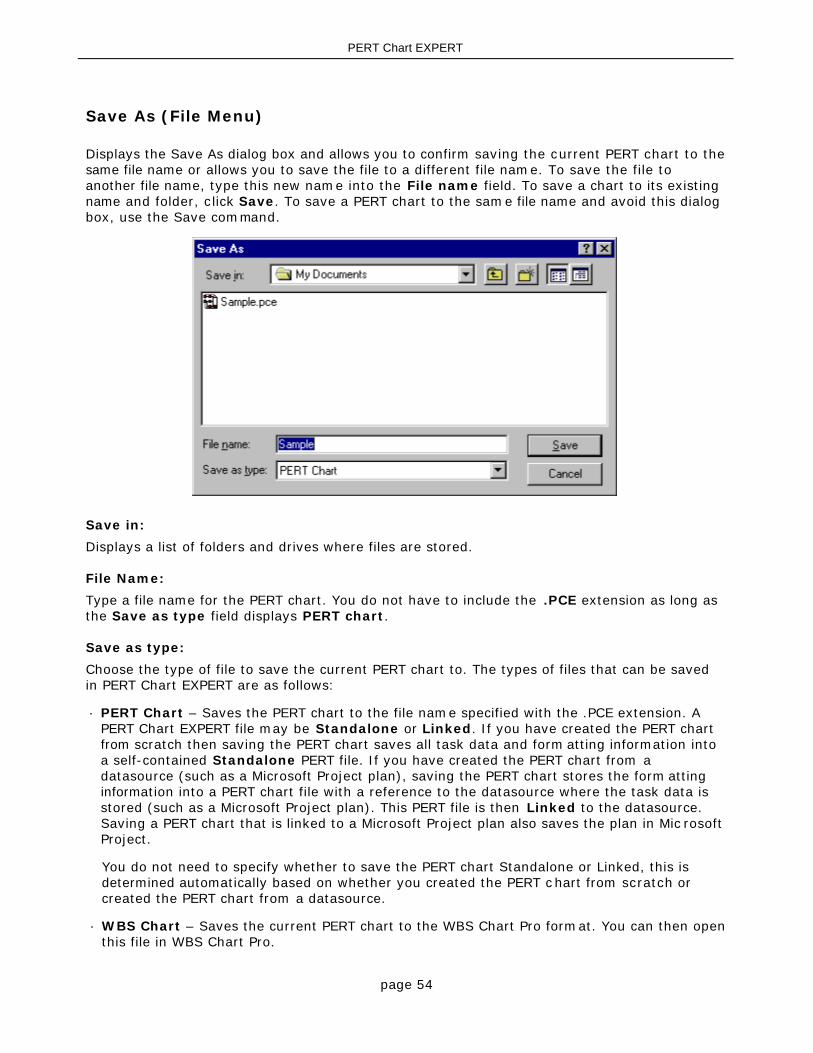
page 54
PERT Chart EXPERT
Save As (File Menu)
Displays the Save As dialog box and allows you to confirm saving the current PERT chart to thesame file name or allows you to save the file to a different file name. To save the file toanother file name, type this new name into the File name field. To save a chart to its existingname and folder, click Save. To save a PERT chart to the same file name and avoid this dialogbox, use the Save command.
Save in:
Displays a list of folders and drives where files are stored.
File Name:
Type a file name for the PERT chart. You do not have to include the .PCE extension as long asthe Save as type field displays PERT chart.
Save as type:
Choose the type of file to save the current PERT chart to. The types of files that can be savedin PERT Chart EXPERT are as follows:
· PERT Chart – Saves the PERT chart to the file name specified with the .PCE extension. APERT Chart EXPERT file may be Standalone or Linked. If you have created the PERT chartfrom scratch then saving the PERT chart saves all task data and form atting information intoa self-contained Standalone PERT file. If you have created the PERT chart from adatasource (such as a Microsoft Project plan), saving the PERT chart stores the form attinginformation into a PERT chart file with a reference to the datasource where the task data isstored (such as a Microsoft Project plan). This PERT file is then Linked to the datasource.Saving a PERT chart that is linked to a Microsoft Project plan also saves the plan in Mic rosoftProject.
You do not need to specify whether to save the PERT chart Standalone or Linked, this isdetermined automatically based on whether you created the PERT c hart from scratch orcreated the PERT chart from a datasource.
· WBS Chart – Saves the current PERT chart to the WBS Chart Pro format. You can then openthis file in WBS Chart Pro.

page 55
PERT Chart EXPERT
· MPX – Saves the current PERT chart to an MPX file. The MPX file format is a text-basedversion of a Microsoft Project plan. Many applications including other project managementsoftware programs can read this file format thus allowing you to create PERT charts andtransfer the chart to other programs.
For a complete explanation on Saving PERT charts, see the help topic Saving PERT charts
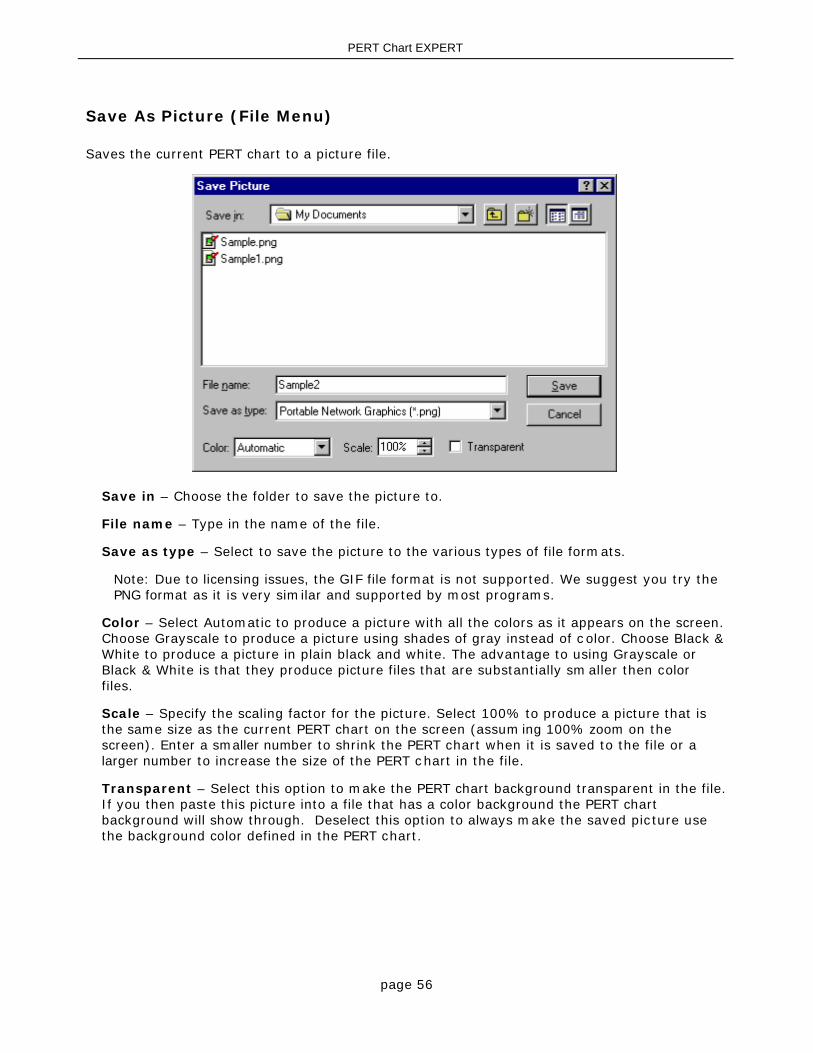
page 56
PERT Chart EXPERT
Save As Picture (File Menu)
Saves the current PERT chart to a picture file.
Save in – Choose the folder to save the picture to.
File name – Type in the name of the file.
Save as type – Select to save the picture to the various types of file formats.
Note: Due to licensing issues, the GIF file format is not supported. We suggest you try thePNG format as it is very similar and supported by most programs.
Color – Select Automatic to produce a picture with all the colors as it appears on the screen.Choose Grayscale to produce a picture using shades of gray instead of c olor. Choose Black &White to produce a picture in plain black and white. The advantage to using Grayscale orBlack & White is that they produce picture files that are substantially sm aller then colorfiles.
Scale – Specify the scaling factor for the picture. Select 100% to produce a picture that isthe same size as the current PERT chart on the screen (assum ing 100% zoom on thescreen). Enter a smaller number to shrink the PERT chart when it is saved to the file or alarger number to increase the size of the PERT chart in the file.
Transparent – Select this option to make the PERT chart background transparent in the file.If you then paste this picture into a file that has a color background the PERT chartbackground will show through. Deselect this option to always make the saved picture usethe background color defined in the PERT chart.

page 57
PERT Chart EXPERT
Save As Web Pages (File Menu)
Saves the current PERT chart to a web page in the listed folder using the selected tem plate.
The Save As Web Pages feature allows you to save the PERT chart image and incorporate thisimage into a pre-defined Web Page. We provide a basic template for this purpose. You c anmodify this template to do many things but not in PERT Chart EXPERT, you must modify thetemplate in a text editor or HTML editor. The PERT Chart EXPERT program is not intended to bean HTML Editor so you should be familiar with HTML Editing to modify the Template.
Note: See the file, PERT HTML Commands.txt, for additional information on the PERT ChartEXPERT Template commands. This file was copied into the PERT Chart EXPERT direc tory duringSetup.
The basic concepts for saving PERT charts to a Web Page are:
1. Create and configure your PERT chart.
2. When you want to publish this chart, select the File menu and Save as Web Pages.
3. Select the template. If you have created your own or modified an existing template,select it in the field provided.
4. Select the Folder to save the HTML pages.
5. Choose the other options if necessary.
6. Click OK. This will generate the HTML pages. Unless the PERT c hart is very small or youhave modified the template to produce one output page, there may be several pages ofHTML output. Since Browsers are not made to handle large scrollable pages, PERT ChartEXPERT will break up the chart into as many pages as it needs to output the entirechart.
7. If you have selected to open your browser upon creation of the Web Pages then the firstpage of your output will be opened automatically. If you chose not to open your browserupon creation of the Web Pages, you need to open the first page of the HTML output inyour browser. The standard template contains buttons for sc rolling the HTML documentsLeft, Right, Up and Down so that if you open the first page of the output you can scrollthrough each page of your HTML output.
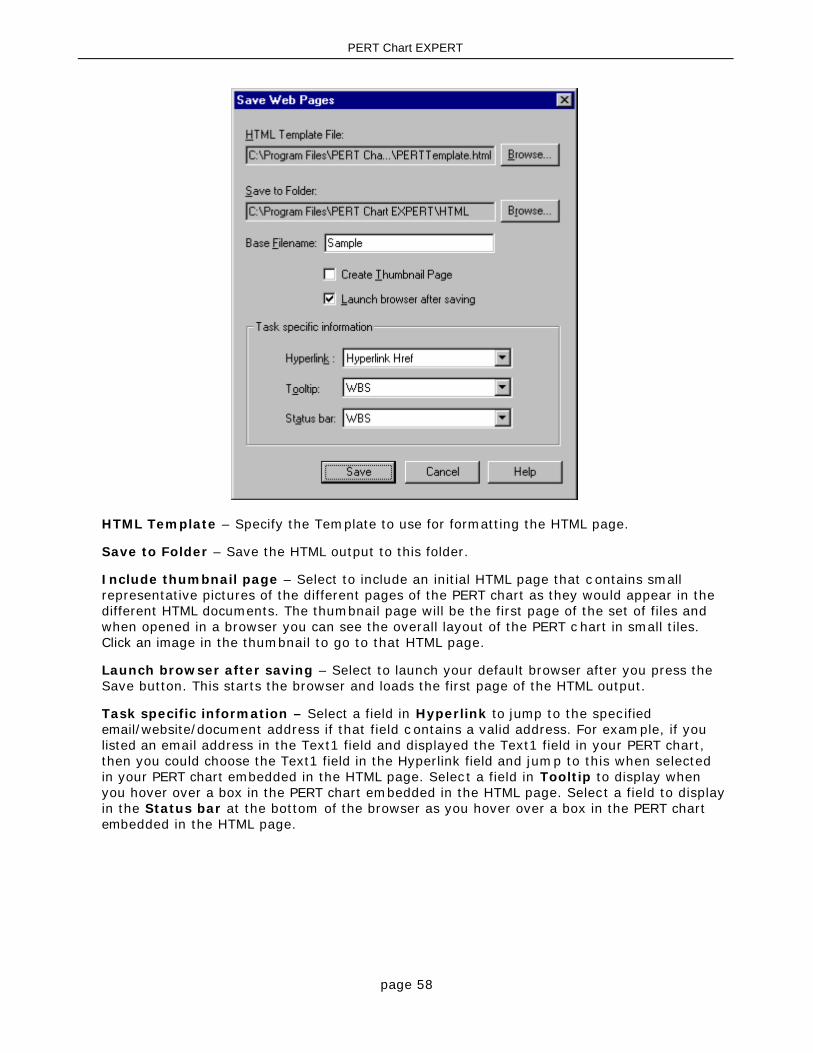
page 58
PERT Chart EXPERT
HTML Template – Specify the Template to use for formatting the HTML page.
Save to Folder – Save the HTML output to this folder.
Include thumbnail page – Select to include an initial HTML page that c ontains smallrepresentative pictures of the different pages of the PERT chart as they would appear in thedifferent HTML documents. The thumbnail page will be the first page of the set of files andwhen opened in a browser you can see the overall layout of the PERT c hart in small tiles.Click an image in the thumbnail to go to that HTML page.
Launch browser after saving – Select to launch your default browser after you press theSave button. This starts the browser and loads the first page of the HTML output.
Task specific information – Select a field in Hyperlink to jump to the specifiedemail/website/document address if that field c ontains a valid address. For example, if youlisted an email address in the Text1 field and displayed the Text1 field in your PERT chart,then you could choose the Text1 field in the Hyperlink field and jump to this when selectedin your PERT chart embedded in the HTML page. Select a field in Tooltip to display whenyou hover over a box in the PERT chart embedded in the HTML page. Select a field to displayin the Status bar at the bottom of the browser as you hover over a box in the PERT chartembedded in the HTML page.
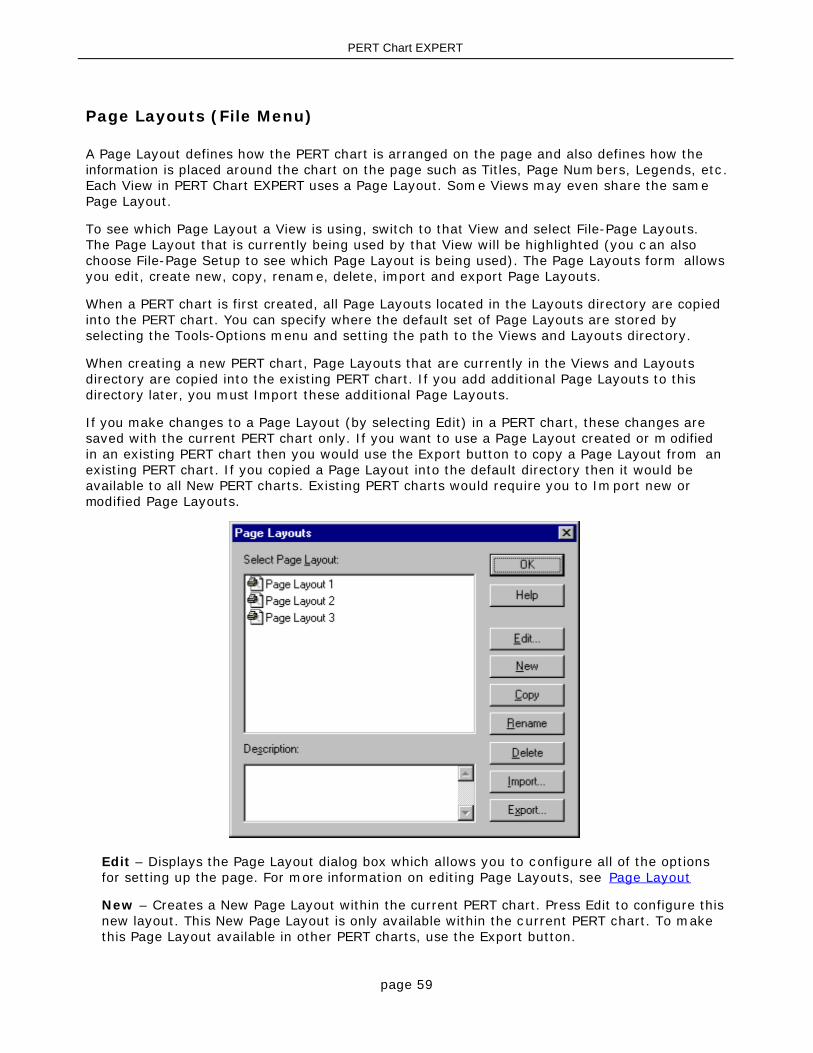
page 59
PERT Chart EXPERT
Page Layouts (File Menu)
A Page Layout defines how the PERT chart is arranged on the page and also defines how theinformation is placed around the chart on the page such as Titles, Page Num bers, Legends, etc.Each View in PERT Chart EXPERT uses a Page Layout. Some Views may even share the samePage Layout.
To see which Page Layout a View is using, switch to that View and select File-Page Layouts.The Page Layout that is currently being used by that View will be highlighted (you c an alsochoose File-Page Setup to see which Page Layout is being used). The Page Layouts form allowsyou edit, create new, copy, rename, delete, import and export Page Layouts.
When a PERT chart is first created, all Page Layouts located in the Layouts directory are copiedinto the PERT chart. You can specify where the default set of Page Layouts are stored byselecting the Tools-Options menu and setting the path to the Views and Layouts directory.
When creating a new PERT chart, Page Layouts that are currently in the Views and Layoutsdirectory are copied into the existing PERT chart. If you add additional Page Layouts to thisdirectory later, you must Import these additional Page Layouts.
If you make changes to a Page Layout (by selecting Edit) in a PERT chart, these changes aresaved with the current PERT chart only. If you want to use a Page Layout created or m odifiedin an existing PERT chart then you would use the Export button to copy a Page Layout from anexisting PERT chart. If you copied a Page Layout into the default directory then it would beavailable to all New PERT charts. Existing PERT charts would require you to Import new ormodified Page Layouts.
Edit – Displays the Page Layout dialog box which allows you to configure all of the optionsfor setting up the page. For more information on editing Page Layouts, see Page Layout
New – Creates a New Page Layout within the current PERT chart. Press Edit to configure thisnew layout. This New Page Layout is only available within the current PERT chart. To makethis Page Layout available in other PERT charts, use the Export button.

page 60
PERT Chart EXPERT
Copy – Copies the existing Page Layout within the current PERT chart. Press Edit toconfigure this layout.
Rename – Renames the selected Page Layout.
Delete – Deletes the selected Page Layout from the current PERT chart. This does not deletethe selected Page Layout from the default directory of Page Layouts. To delete a Page Layoutfrom your system, use the File-Open command or Windows Explorer.
Import – Copies selected Page Layouts from the specified directory into the current PERTchart.
Export – Copies selected Page Layouts from the current PERT chart to the specifieddirectory.
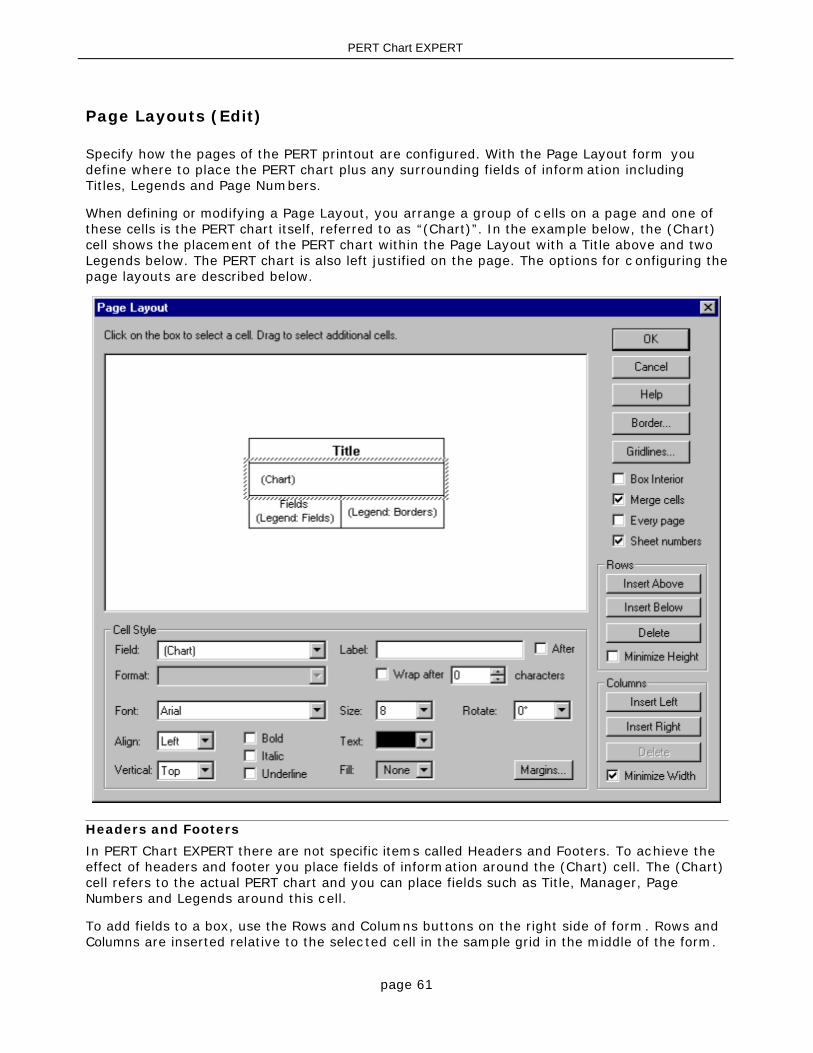
page 61
PERT Chart EXPERT
Page Layouts (Edit)
Specify how the pages of the PERT printout are configured. With the Page Layout form youdefine where to place the PERT chart plus any surrounding fields of information includingTitles, Legends and Page Numbers.
When defining or modifying a Page Layout, you arrange a group of c ells on a page and one ofthese cells is the PERT chart itself, referred to as “(Chart)”. In the example below, the (Chart)cell shows the placement of the PERT chart within the Page Layout with a Title above and twoLegends below. The PERT chart is also left justified on the page. The options for c onfiguring thepage layouts are described below.
Headers and Footers
In PERT Chart EXPERT there are not specific items called Headers and Footers. To achieve theeffect of headers and footer you place fields of information around the (Chart) cell. The (Chart)cell refers to the actual PERT chart and you can place fields such as Title, Manager, PageNumbers and Legends around this cell.
To add fields to a box, use the Rows and Columns buttons on the right side of form. Rows andColumns are inserted relative to the selec ted cell in the sample grid in the middle of the form.
page 62
PERT Chart EXPERT
Rows
Insert Above – Adds a cell or row of cells above the selected cell.
Insert Below – Adds a cell or row of cells below the selected cell.
Delete – Removes the entire row containing the selected cell.
Minimize Height – Select this option to make the selected row as short as possible. Thisoption is useful for minimizing the height of certain rows when the rows need to be stretc hedwithin the box. Rows may need to be stretched when data in one area of the box causes thebox to be bigger.
Columns
Insert Left – Adds a cell or column of cells to the left of the selected cell.
Insert Right – Adds a cell or column of cells to the right of the selected cell.
Delete – Removes the entire column containing the selected cell.
Minimize Width – Select this option to make the selected column as narrow as possible.This option is useful for minimizing the width of certain c olumns when the columns need tobe stretched within the box. Columns may need to be stretched when data in one area of thebox causes the box to be bigger.
Formatting the Fields
To format a field, select the field (cell) by clicking on the appropriate field in the sample grid inthe middle of the form. Then, select the formatting options in the Cell Style area.
Following is an explanation of each of the options in Cell Style:
Field – Select the drop down arrow to display a complete list of fields. Choose a field fromthis list to display in the selected cell. Some fields such as Title, Manager and Companycome from the File-Properties menu in PERT Chart EXPERT. These fields c an also come fromMicrosoft Project. Some fields like Actual Cost, % Complete and Work are project totals andcome from these calculated fields in Microsoft Project. You can place these fields around yourPERT chart and they will display the values that you have typed into these fields or arecalculated elsewhere.
Tip: If you simply want to display a field with some text around your chart try displaying the[Blank] field and typing text into the Label field.
The fields with the brackets such as the [Blank], [Legends], [Page Number] and [Chart]fields are only used in Page Layout.
Label – Enter text to display before or after the data in the selected cell. Leave the Aftercheckbox unchecked to display text to the left of the data in the cell or click the Aftercheckbox to display the label to the right of the data in the cell.
Format – Displays options for formatting the selected cell. Some fields do not haveformatting options and this option is unavailable.
Wrap after xx characters – Specify the number of characters on which to “Word Wrap”.PERT Chart EXPERT attempts to wrap the line of text at the number of characters specified.However, it can only wrap on a space and may wrap at more or less then the number ofcharacters specified.
Font – Sets the font type for the selected cell.

page 63
PERT Chart EXPERT
Size – Sets the font size for the selected cell.
Rotate – Displays the text in the cell normal (0°), top-to-bottom (90°), or bottom-to-top(270°).
Align – Sets the alignment of the text Horizontally Left, Center or Right within the cell.
Vertical – Sets the alignment of the text Vertically Top, Center or Bottom within the cell.
Bold/Italic/Underline – Sets the text to Bold, Italic or Underlined for the selected cell.
Text – Sets the color for the text in the cell. Choose the Same as Box Border option todisplay the text the same color as the border.
Fill – Sets the background color for the cell.
Margins – Allows you to set the left, right, top and bottom margins around the text in theselected cell.
Setting Additional Page Layout Options
Gridlines – Select to configure the gridlines between the fields. The separating linesbetween the fields that you have displayed in the Summary or Task Boxes are referred to asGridlines. You can choose to turn them all off, turn them all on or individually select whichgridlines appear.
Box Interior – Defines the box interior so fields can be displayed outside of the border. Todefine the “Box Interior” simply click and drag across the fields (cells) that you want toinclude inside the border and select Box Interior.
Merge Cells – Makes a field span more then one cell. To merge cells, click and drag toselect multiple cells and then select the Merge Cells option.
Every Page – Select this option to place this Page Layout on every page of the printout.Deselect this option to stretch this Page Layout across the total num ber of pages in theprintout.
Tip: If you have defined to display page numbers by placing the Page Number field in a celland you have deselected the Every Page option then page numbering will not work sincethere is really only one big page that is divided up into sheets based on the size paper you areusing. In other words, if you use the Page Number field then you have to place this field onevery page and you must choose the Every Page option to do this. Including the Page Layouton every page might not always be desired but numbering the pages might be. If you do notwant a Page Layout on every page, try removing the Page Number field and use the SheetNumber feature described below to number the pages in the printout.
Sheet Number – Places a number in the upper right corner of the page corresponding tothe number of pages in the printout. This option is useful if you choose to have the PageLayout stretch across the entire printout and you want som e kind of page numberingsystem. The Sheet Number is fixed, you cannot change the font or position of this num ber.
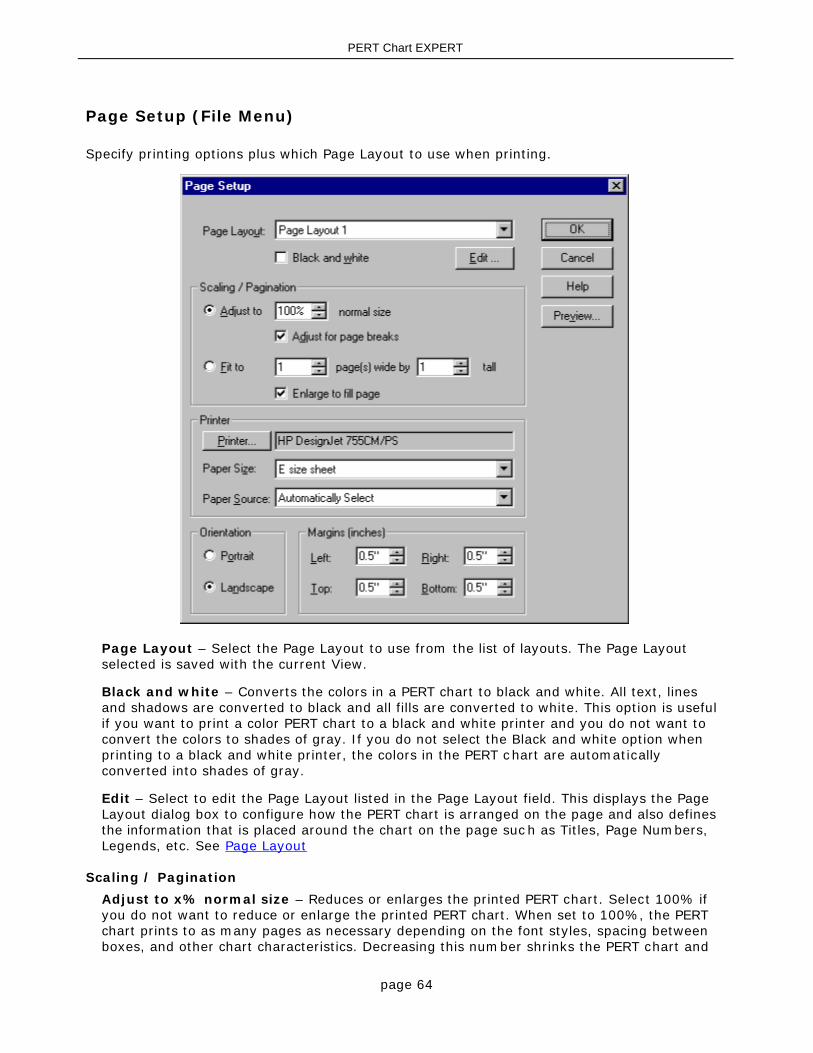
page 64
PERT Chart EXPERT
Page Setup (File Menu)
Specify printing options plus which Page Layout to use when printing.
Page Layout – Select the Page Layout to use from the list of layouts. The Page Layoutselected is saved with the current View.
Black and white – Converts the colors in a PERT chart to black and white. All text, linesand shadows are converted to black and all fills are converted to white. This option is usefulif you want to print a color PERT chart to a black and white printer and you do not want toconvert the colors to shades of gray. If you do not select the Black and white option whenprinting to a black and white printer, the colors in the PERT chart are automaticallyconverted into shades of gray.
Edit – Select to edit the Page Layout listed in the Page Layout field. This displays the PageLayout dialog box to configure how the PERT chart is arranged on the page and also definesthe information that is placed around the chart on the page suc h as Titles, Page Numbers,Legends, etc. See Page Layout
Scaling / Pagination
Adjust to x% normal size – Reduces or enlarges the printed PERT chart. Select 100% ifyou do not want to reduce or enlarge the printed PERT chart. When set to 100%, the PERTchart prints to as many pages as necessary depending on the font styles, spacing betweenboxes, and other chart characteristics. Decreasing this number shrinks the PERT chart and
page 65
PERT Chart EXPERT
increasing this number enlarges the PERT chart by the percentage specified.
Adjust for page breaks – Repositions boxes that fall on a page break onto the next page.Instead of splitting a box that appears on a page break, space between boxes is addedwhere necessary to force any box that falls on a page break to appear in its entirety on asubsequent page.
Tip: When using the Adjust for page break option, try selecting Page Layout from theView menu to see how tasks are arranged on the page. While in Page Layout Mode youcan also manually drag boxes to avoid page breaks.
Note: Using the Adjust for page breaks option may make your PERT charts bigger sinceit needs to add space to avoid page breaks.
Fit to x page(s) wide by y tall – Forces the PERT chart to the specified number of pages.The “Fit to page” option shrinks the PERT chart proportionally to fit the number of pagesselected (if Enlarge to fill page is not selected). This means that shrinking a 10 page widePERT chart to 5 pages wide would not only reduce the width of the chart but also theheight of the chart by the same amount to stay in proportion.
To increase the size of the PERT chart to the specified number of pages, select the Enlarge tofill page option along with the Fit to page option.
Note: When using the Fit to x page wide by y tall option there is no c orresponding “Adjust for page breaks” option. Since the “Fit to Page” option is forcing it to a certainnumber of pages it would be impossible to impose the extra space necessary to “Adjustfor page breaks”.
Enlarge to fill page – Automatically increases the size of the chart to fill the rem ainingspace in the printout until it reaches one edge of the chart (width or height). For exam ple,suppose your PERT chart is normally 1 ½ pages wide and ½ page tall. If you selec t Fit to 2pages wide by 1 page tall and Enlarge to fill page, PERT Chart EXPERT enlarges thechart until either the chart is a full 2 pages wide or 1 page tall, whichever is reached first.PERT Chart EXPERT only increases the size proportionally so once it reaches the edge ofthe page (the width in the above example) it stops enlarging.
Remember that when using the Enlarge to fill page option, once it reaches one edge of thechart (width or height) it will stop enlarging. If you try to print a very wide PERT c hart to abig piece of paper with the Enlarge to fill page option, you may still have quite a bit of whitespace below your chart if the width of the PERT chart is as wide as the page. When thishappens you need to use the features of PERT Chart EXPERT to make it taller and less wide.Try dragging some of the Tasks in your chart down the page or try setting Word Wrap tofewer characters so your boxes get taller and narrower.
Paper
Size – Select the paper size from the list of available sizes. The sizes listed are thosesupported by the currently selected printer. To change the currently selected printer, choosethe Printer button.
Source – Select the source of the paper for the currently selected printer.
Orientation
Portrait – Select to print the PERT chart in Portrait mode.
Landscape – Select to print the PERT chart in Landscape mode.
Margins

page 66
PERT Chart EXPERT
Specify the distance between the left/right/top/bottom edge of the page and the first printedline.
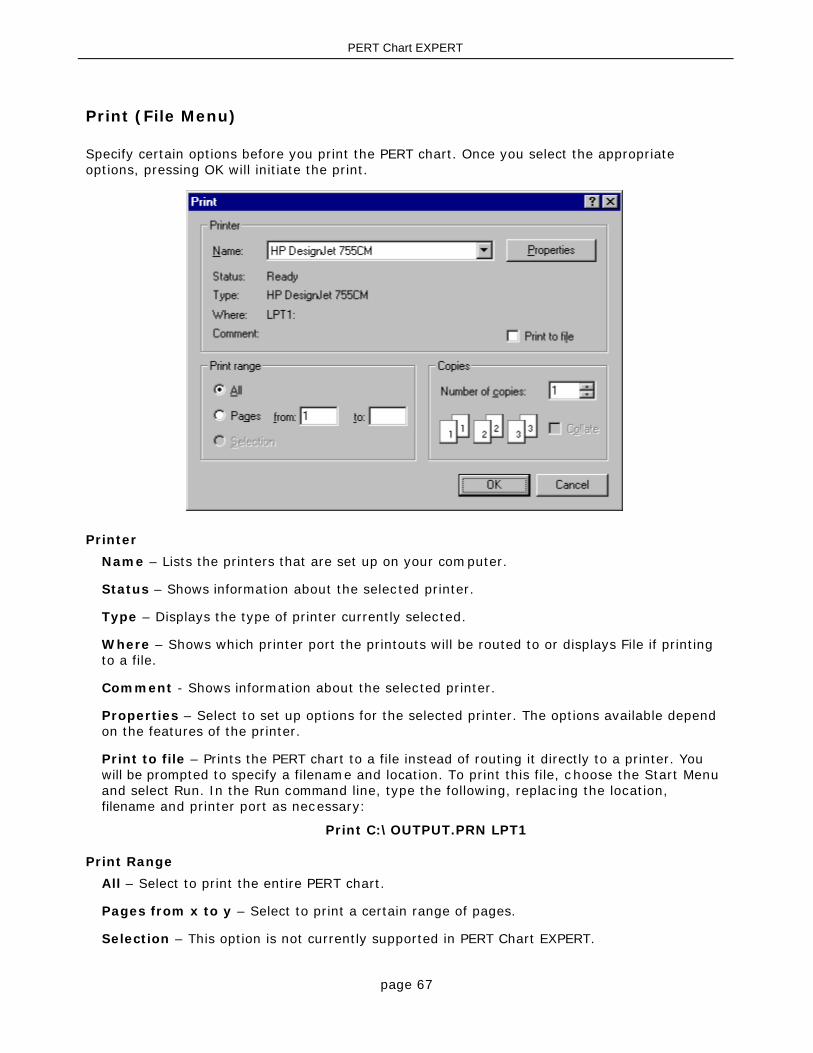
page 67
PERT Chart EXPERT
Print (File Menu)
Specify certain options before you print the PERT chart. Once you select the appropriateoptions, pressing OK will initiate the print.
Printer
Name – Lists the printers that are set up on your computer.
Status – Shows information about the selected printer.
Type – Displays the type of printer currently selected.
Where – Shows which printer port the printouts will be routed to or displays File if printingto a file.
Comment - Shows information about the selected printer.
Properties – Select to set up options for the selected printer. The options available dependon the features of the printer.
Print to file – Prints the PERT chart to a file instead of routing it directly to a printer. Youwill be prompted to specify a filename and location. To print this file, choose the Start Menuand select Run. In the Run command line, type the following, replac ing the location,filename and printer port as necessary:
Print C:\OUTPUT.PRN LPT1
Print Range
All – Select to print the entire PERT chart.
Pages from x to y – Select to print a certain range of pages.
Selection – This option is not currently supported in PERT Chart EXPERT.

page 68
PERT Chart EXPERT
Copies
Numbers of copies – Specify the number of copies that you want to print.
Collate – If you have selected more then one copy, specifies whether you want the copies tobe collated.
page 69
PERT Chart EXPERT
Print Preview (File Menu)
Displays a sample of what the PERT chart will look like when printed. Print Preview uses thecurrently selected printer and paper size to display the PERT chart exac tly how it will appearwhen printed.
The information in the lower left corner of the Print Preview window displays useful informationregarding the printout. For example, it might display
Scale - Page: 1 of 10 Size: 2 rows by 5 column Scale: 100%
This means that you have selected the “Adjust to” option in Page Setup, it is currentlydisplaying Page 1 of this 10 page chart. The printout is 2 rows and 5 c olumns of paper and theScale is 100% as set in the Page Setup dialog box under Sc aling.
In the Print Preview window, you can:
Scroll – On a multiple page printout, the buttons in the upper left corner of the PrintPreview window allow you to scroll through the different pages of the printout. Click the Left,Right, Up and Down buttons to scroll (a button is only selectable if you c an scroll in thatdirection).
Select a One Page or Two Page window – The One / Two Page button allows you todisplay the Print Preview window in a single page or double page view. Two pages is themost you can see at a time in Print Preview. If you want to see more then two pages atonce, close Print Preview and select View-Page Layout. This displays the entire PERT chartincluding page breaks (but without the fields around the page as is shown in Print Preview).
Zoom In and Out – The Zoom and Zoom out buttons allow you to see more or less detail inthe PERT chart. You can also click anywhere on a page to Zoom In and Out.
Print – Select the Print button to send the PERT chart to the printer. You can also set printeroptions by clicking the Print button. See also Print
Modify Page Options – Select the Page Setup button to change paper size, printorientation, margins and to change the Page Layout used for this PERT chart. See also PageSetup
Enter Project Properties – Select the Properties button to enter information like Title,Manager, Company, etc. See also Properties
Note: You cannot edit the PERT chart in the Print Preview window, however, if you close PrintPreview and choose View-Page Layout, you can see (and edit) the PERT chart including wherethe page breaks appear.

page 70
PERT Chart EXPERT
Unlink (File Menu)
Removes the link to the datasource specified.
What it means to be Linked to a datasource
When you are linked to a datasource (such as a Microsoft Project plan), the data that isdisplayed in the PERT chart is actually stored in the datasource and not in the PERT chart. ThePERT chart is only a reflection of the data in the datasource. Saving the PERT chart linked to adatasource saves the formatting options into the PERT file but the data is stored in thedatasource.
Unlinking from a Microsoft Project plan
If you create a PERT chart from a Microsoft Project plan, the PERT chart is linked to the MSProject plan. Any changes you make to the PERT chart are immediately reflected in theMicrosoft Project plan. With Microsoft Project you have a dynamic link back to the datasource,which means that you can change the PERT chart and send this information back to MicrosoftProject. As mentioned above, when linked to a Microsoft Project plan all of the data is stored inMicrosoft Project and the PERT formatting options are saved in the PERT chart file.
Unlinking a PERT chart from a Microsoft Project plan will transfer the data into the PERT chartso that the PERT chart will become a standalone file containing all of the data and formatting.
Important Note: When you Unlink a PERT chart from a Microsoft Project plan you cannotre-link it to this same Microsoft Project plan. This is because you would then have two sets ofdata, one in Microsoft Project and one in the PERT chart file. If you unlink a PERT c hart from anexisting Microsoft Project plan you can only send it back to Microsoft Project as a NewMicrosoft Project plan, you cannot use it to modify an existing Microsoft Project plan.
Unlinking from an MPX or Text file
If you create a PERT chart from an MPX or Text file this PERT chart is linked to these files butnot dynamically. In other words, you cannot modify the PERT chart and have this m odify theMPX of Text file.
You can select to Unlink from an MPX or Text file by selec ting the Unlink command. However,Unlinking from a MPX or Text file will happen automatically if you change the data in the linkedPERT chart (if you add a task, for example). Since PERT Chart EXPERT cannot write back to theMPX or Text file and since you have changed the data it must Unlink from the MPX or Text fileto manage the data properly.
See also Creating PERT charts from Microsoft Project plans
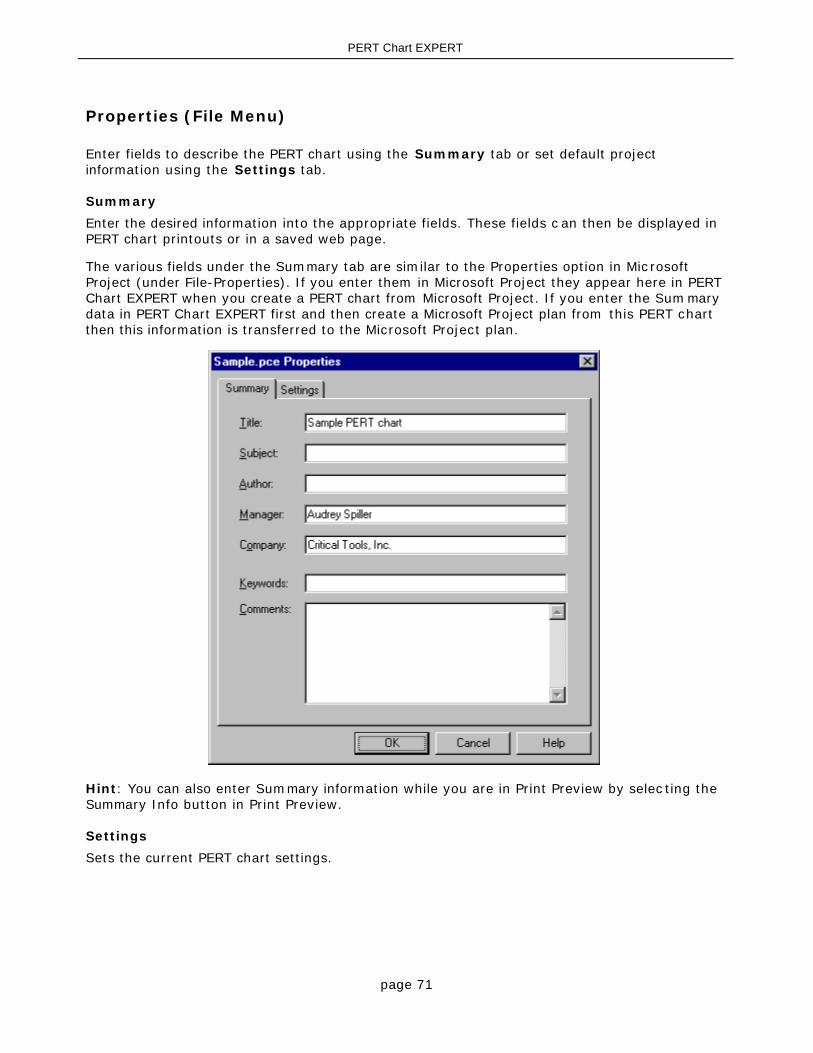
page 71
PERT Chart EXPERT
Properties (File Menu)
Enter fields to describe the PERT chart using the Summary tab or set default projectinformation using the Settings tab.
Summary
Enter the desired information into the appropriate fields. These fields c an then be displayed inPERT chart printouts or in a saved web page.
The various fields under the Summary tab are similar to the Properties option in Mic rosoftProject (under File-Properties). If you enter them in Microsoft Project they appear here in PERTChart EXPERT when you create a PERT chart from Microsoft Project. If you enter the Summarydata in PERT Chart EXPERT first and then create a Microsoft Project plan from this PERT chartthen this information is transferred to the Microsoft Project plan.
Hint: You can also enter Summary information while you are in Print Preview by selec ting theSummary Info button in Print Preview.
Settings
Sets the current PERT chart settings.
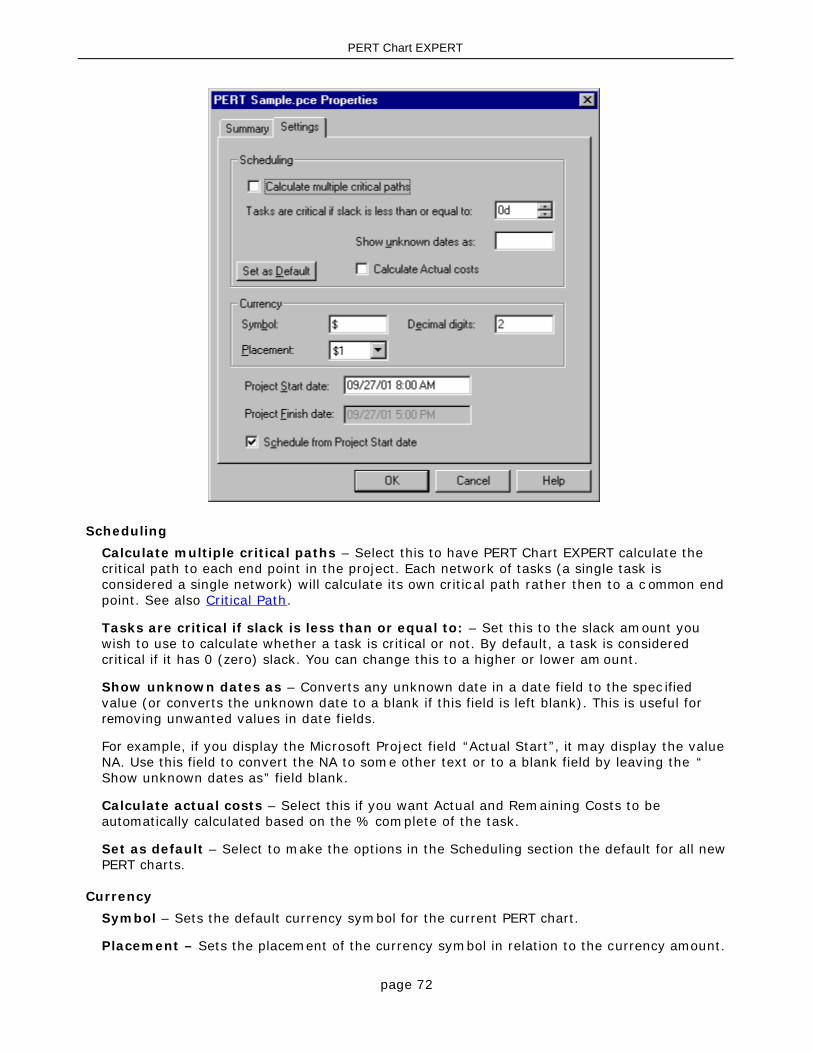
page 72
PERT Chart EXPERT
Scheduling
Calculate multiple critical paths – Select this to have PERT Chart EXPERT calculate thecritical path to each end point in the project. Each network of tasks (a single task isconsidered a single network) will calculate its own critical path rather then to a c ommon endpoint. See also Critical Path.
Tasks are critical if slack is less than or equal to: – Set this to the slack amount youwish to use to calculate whether a task is critical or not. By default, a task is consideredcritical if it has 0 (zero) slack. You can change this to a higher or lower am ount.
Show unknown dates as – Converts any unknown date in a date field to the spec ifiedvalue (or converts the unknown date to a blank if this field is left blank). This is useful forremoving unwanted values in date fields.
For example, if you display the Microsoft Project field “Actual Start”, it may display the valueNA. Use this field to convert the NA to some other text or to a blank field by leaving the “Show unknown dates as” field blank.
Calculate actual costs – Select this if you want Actual and Remaining Costs to beautomatically calculated based on the % complete of the task.
Set as default – Select to make the options in the Scheduling section the default for all newPERT charts.
Currency
Symbol – Sets the default currency symbol for the current PERT chart.
Placement – Sets the placement of the currency symbol in relation to the currency amount.

page 73
PERT Chart EXPERT
Decimal Digits – Specifies the number of decimal digits for the currency.
Project Start date – Set the start date of the current PERT chart.
Project Finish date – Set the finish date for the current PERT chart.
Schedule from Project Start date – Select this to schedule tasks forward from the ProjectStart Date. Deselect this to schedule tasks backwards from the Project Finish Date.

page 74
PERT Chart EXPERT
Most Recently Used Files (1,2,3,4 on File Menu)
Displays the most recently used files in PERT Chart EXPERT. Selec t the number to open thatfile.

page 75
PERT Chart EXPERT
Exit (File Menu)
Closes the PERT Chart EXPERT program.
page 76
PERT Chart EXPERT
Edit Menu
Undo (Edit Menu)
Removes the last command performed in PERT Chart EXPERT. When using PERT Chart EXPERTto create a standalone PERT chart, most operations can be undone.
IMPORTANT NOTE: When using PERT Chart EXPERT to modify an existing Microsoft Projectplan, certain operations cannot be undone. Adding, Deleting or Moving tasks in a PERT chartthat is linked to a Microsoft Project plan cannot be undone. The reason for this is that PERTChart EXPERT uses OLE automation to make Microsoft Project perform required operations.Unfortunately there is no way to tell Microsoft Project to Undo any operation that is perform edon it using OLE. We have worked around this in a few instanc es. For example, when renaminga task in a PERT chart that is linked to Microsoft Project you are able to Undo this but m oreinvolved operations like adding and deleting tasks are too complex to Undo.

page 77
PERT Chart EXPERT
Redo (Edit Menu)
Reverses the action of the Undo command. To undo recent actions one at a time, click Undo. Ifyou didn't want to undo an action click Redo.

page 78
PERT Chart EXPERT
Cut (Edit Menu)
Cuts (deletes) the selected task and places it on the Clipboard so you can paste it elsewhere.
Select another task in the PERT chart and choose Edit-Paste to insert the cut task before theselected task. You can also Right-Click on a task to Paste.

page 79
PERT Chart EXPERT
Copy (Edit Menu)
Copies the selected task and places it on the Clipboard so you can paste it elsewhere.
Select another task in the PERT chart and choose Edit-Paste to insert the copied task beforethe selected task. You can also Right-Click on a task to Paste.

page 80
PERT Chart EXPERT
Paste (Edit Menu)
Pastes previously Cut or Copied tasks before the selected task.

page 81
PERT Chart EXPERT
Insert Task (Edit Menu)
Inserts a new task before the selected task.
Tip: You can also use the Ins key on the keyboard.

page 82
PERT Chart EXPERT
Delete (Edit Menu)
Deletes the selected Task. If you delete a Task you are not prompted to confirm this deletion.Select Undo if you want to undo the delete.
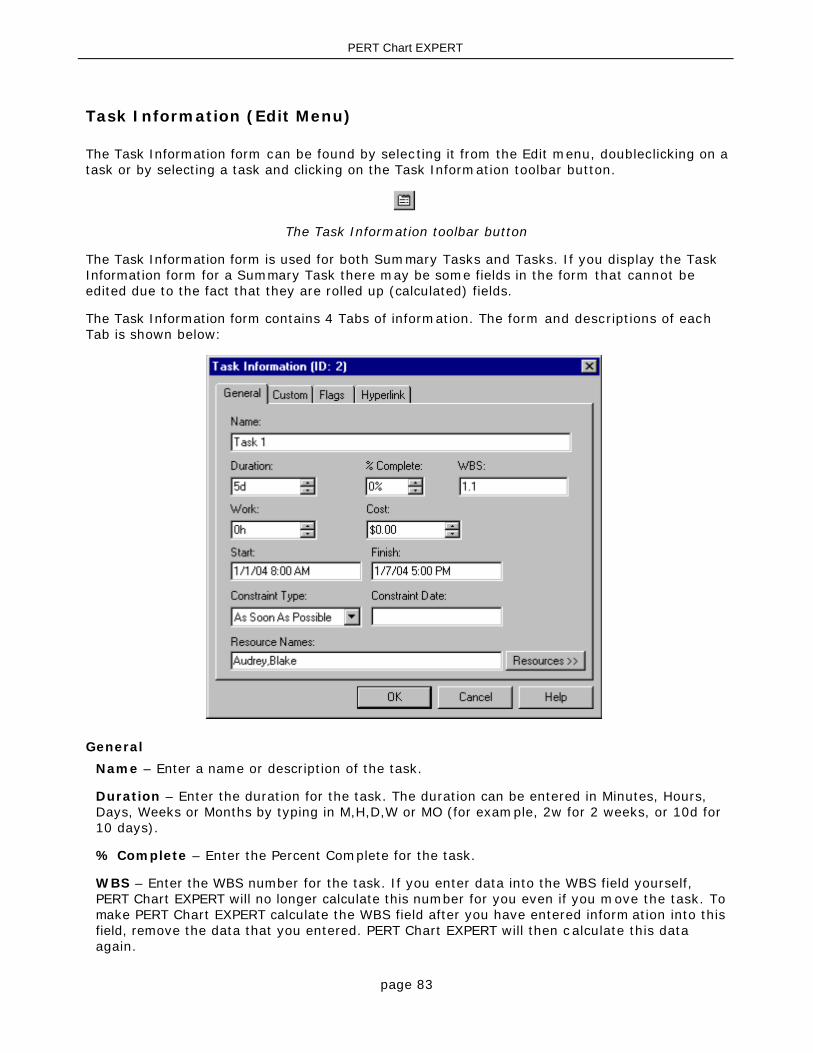
page 83
PERT Chart EXPERT
Task Information (Edit Menu)
The Task Information form can be found by selecting it from the Edit menu, doubleclicking on atask or by selecting a task and clicking on the Task Information toolbar button.
The Task Information toolbar button
The Task Information form is used for both Summary Tasks and Tasks. If you display the TaskInformation form for a Summary Task there may be some fields in the form that cannot beedited due to the fact that they are rolled up (calculated) fields.
The Task Information form contains 4 Tabs of information. The form and descriptions of eachTab is shown below:
General
Name – Enter a name or description of the task.
Duration – Enter the duration for the task. The duration can be entered in Minutes, Hours,Days, Weeks or Months by typing in M,H,D,W or MO (for example, 2w for 2 weeks, or 10d for10 days).
% Complete – Enter the Percent Complete for the task.
WBS – Enter the WBS number for the task. If you enter data into the WBS field yourself,PERT Chart EXPERT will no longer calculate this number for you even if you move the task. Tomake PERT Chart EXPERT calculate the WBS field after you have entered inform ation into thisfield, remove the data that you entered. PERT Chart EXPERT will then c alculate this dataagain.
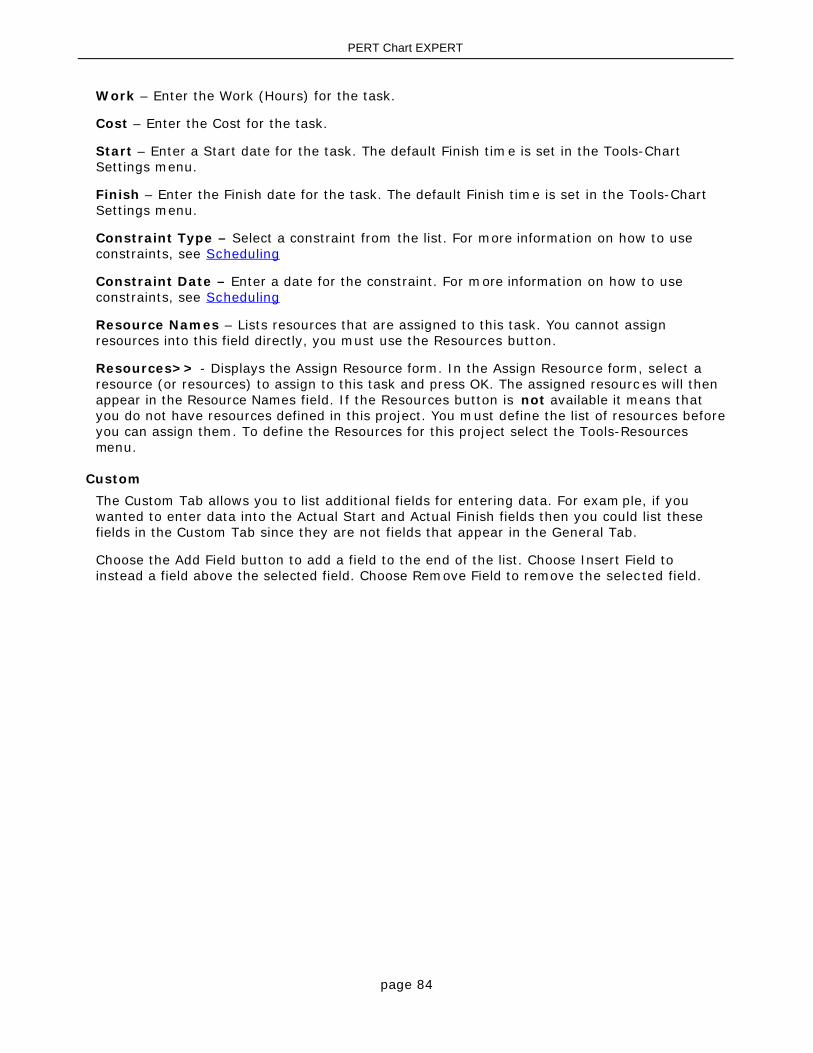
page 84
PERT Chart EXPERT
Work – Enter the Work (Hours) for the task.
Cost – Enter the Cost for the task.
Start – Enter a Start date for the task. The default Finish time is set in the Tools-ChartSettings menu.
Finish – Enter the Finish date for the task. The default Finish time is set in the Tools-ChartSettings menu.
Constraint Type – Select a constraint from the list. For more information on how to useconstraints, see Scheduling
Constraint Date – Enter a date for the constraint. For more information on how to useconstraints, see Scheduling
Resource Names – Lists resources that are assigned to this task. You cannot assignresources into this field directly, you must use the Resources button.
Resources>> - Displays the Assign Resource form. In the Assign Resource form, select aresource (or resources) to assign to this task and press OK. The assigned resourc es will thenappear in the Resource Names field. If the Resources button is not available it means thatyou do not have resources defined in this project. You must define the list of resources beforeyou can assign them. To define the Resources for this project select the Tools-Resourcesmenu.
Custom
The Custom Tab allows you to list additional fields for entering data. For exam ple, if youwanted to enter data into the Actual Start and Actual Finish fields then you could list thesefields in the Custom Tab since they are not fields that appear in the General Tab.
Choose the Add Field button to add a field to the end of the list. Choose Insert Field toinstead a field above the selected field. Choose Remove Field to remove the selected field.
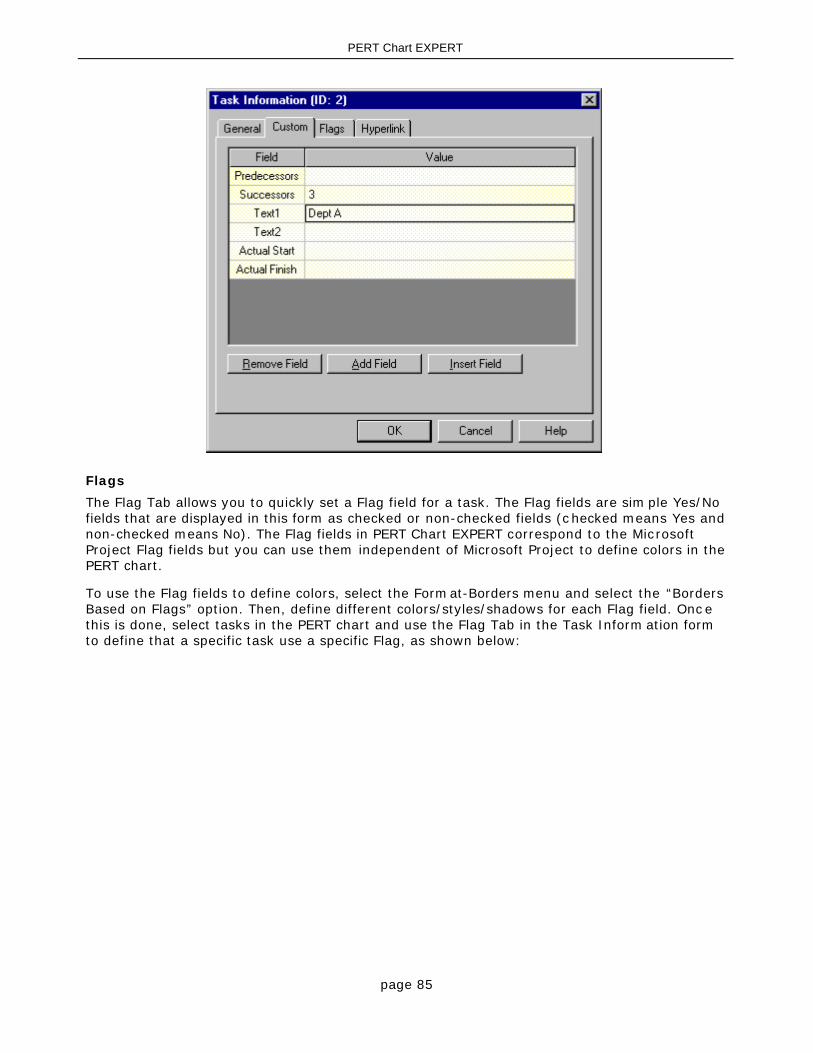
page 85
PERT Chart EXPERT
Flags
The Flag Tab allows you to quickly set a Flag field for a task. The Flag fields are sim ple Yes/Nofields that are displayed in this form as checked or non-checked fields (c hecked means Yes andnon-checked means No). The Flag fields in PERT Chart EXPERT correspond to the MicrosoftProject Flag fields but you can use them independent of Microsoft Project to define colors in thePERT chart.
To use the Flag fields to define colors, select the Format-Borders menu and select the “BordersBased on Flags” option. Then, define different colors/styles/shadows for each Flag field. Onc ethis is done, select tasks in the PERT chart and use the Flag Tab in the Task Inform ation formto define that a specific task use a specific Flag, as shown below:
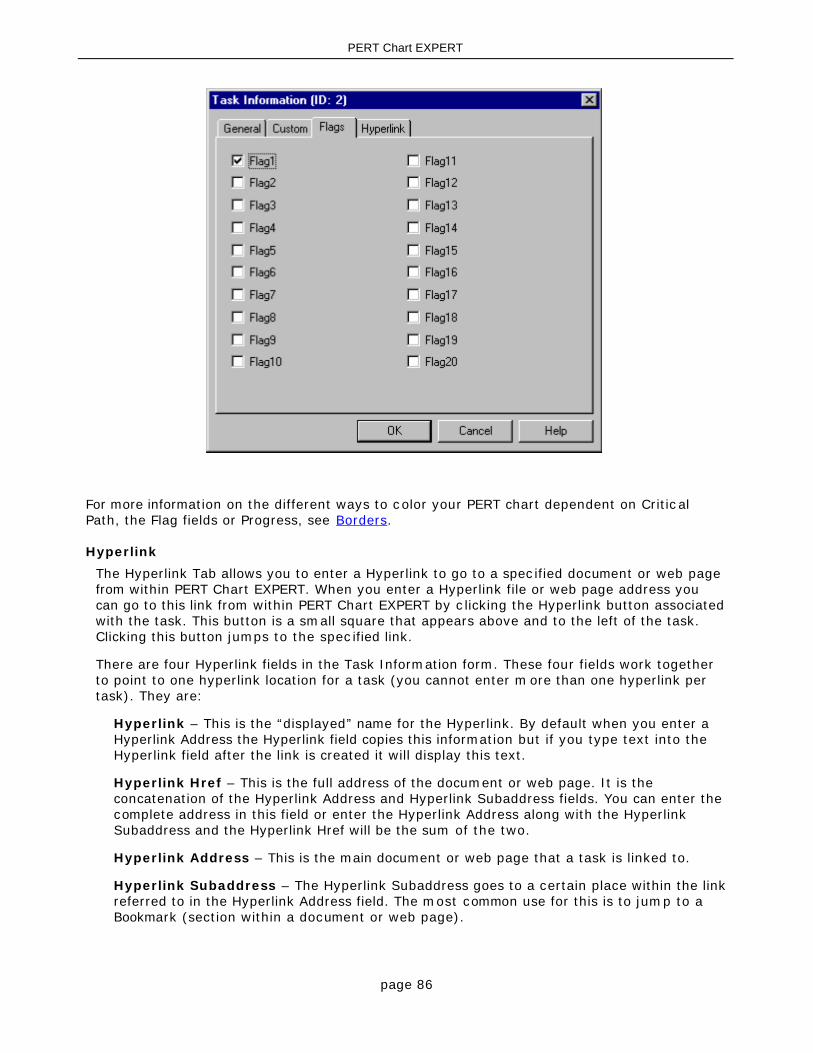
page 86
PERT Chart EXPERT
For more information on the different ways to color your PERT chart dependent on Critic alPath, the Flag fields or Progress, see Borders.
Hyperlink
The Hyperlink Tab allows you to enter a Hyperlink to go to a spec ified document or web pagefrom within PERT Chart EXPERT. When you enter a Hyperlink file or web page address youcan go to this link from within PERT Chart EXPERT by c licking the Hyperlink button associatedwith the task. This button is a small square that appears above and to the left of the task.Clicking this button jumps to the spec ified link.
There are four Hyperlink fields in the Task Information form. These four fields work togetherto point to one hyperlink location for a task (you cannot enter m ore than one hyperlink pertask). They are:
Hyperlink – This is the “displayed” name for the Hyperlink. By default when you enter aHyperlink Address the Hyperlink field copies this information but if you type text into theHyperlink field after the link is created it will display this text.
Hyperlink Href – This is the full address of the document or web page. It is theconcatenation of the Hyperlink Address and Hyperlink Subaddress fields. You can enter thecomplete address in this field or enter the Hyperlink Address along with the HyperlinkSubaddress and the Hyperlink Href will be the sum of the two.
Hyperlink Address – This is the main document or web page that a task is linked to.
Hyperlink Subaddress – The Hyperlink Subaddress goes to a certain place within the linkreferred to in the Hyperlink Address field. The most common use for this is to jump to aBookmark (section within a document or web page).
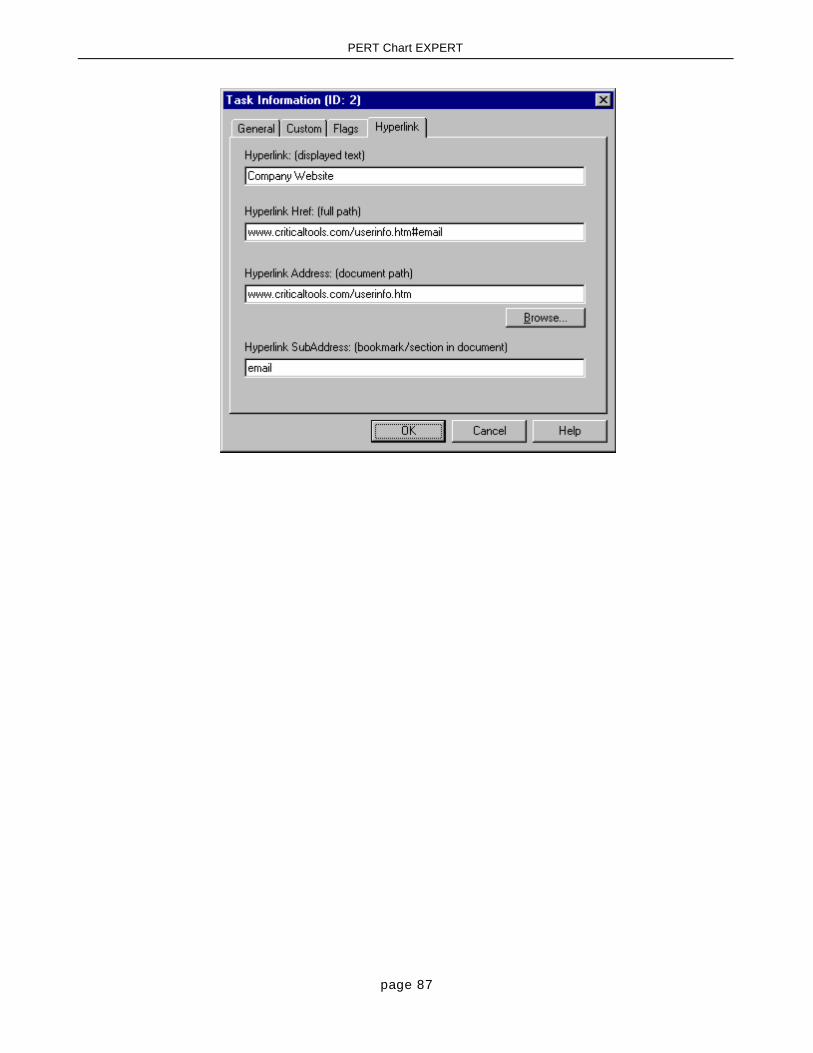
page 87
PERT Chart EXPERT

page 88
PERT Chart EXPERT
Find (Edit Menu)
Searches the PERT chart and selects the first occurrence of the text entered in the “Find what”field. The Find feature only looks for text that is currently displayed in the c hart.
Select the Find Next button to find the next occurrence of the text. You can also press Canceland press F3 to find each occurrence of the text.

page 89
PERT Chart EXPERT
Find Next (Edit Menu)
Searches the PERT chart and selects the next occurrence of the text entered in the Find form .

page 90
PERT Chart EXPERT
Goto (Edit Menu)
Searches for and selects a task in the PERT chart based on certain criteria. Type in the Id orWBS number for the task you are looking for and PERT Chart EXPERT will selec t this task.

page 91
PERT Chart EXPERT
Select All (Edit Menu)
Selects all tasks in the PERT chart.
Additional ways to select tasks in PERT Chart EXPERT:
1. Press Ctrl-A to select all tasks in the chart.
2. Click and drag in the PERT chart to enclose any number of tasks. Only those tasks that arefully enclosed become selected.
Note: if you click and drag and do not enclose any tasks then a new task is inserted(clicking and dragging in empty space is the command to add a new task).
3. Ctrl-Click (hold the Ctrl key down while selecting various tasks with the mouse) to select arandom set of tasks.

page 92
PERT Chart EXPERT
View Menu
Normal (View Menu)
Displays the PERT chart in a regular window without page breaks or other output indic ators.

page 93
PERT Chart EXPERT
Page Layout (View Menu)
Displays the PERT chart showing page breaks as they would appear if printed. Page breaks aredisplayed based on the currently selected printer and paper size. Go to File-Page Setup tochange printers and/or paper size.
The Page Layout mode is useful for moving tasks around to avoid page breaks but you can alsohave PERT Chart EXPERT automatically adjust for page breaks by selec ting this option inFile-Page Setup.
Hint: Try the Zoom out command (or the View-Zoom menu) when in Page Layout mode to seethe entire PERT chart and all pages of the chart.

page 94
PERT Chart EXPERT
Online Layout (View Menu)
Displays the PERT chart showing page breaks as they would appear if you selec ted Save AsWeb Pages for this PERT chart. Page breaks are displayed based on the size of the im agespecified in the template used to create the Web Pages.
See also Save as Web Pages

page 95
PERT Chart EXPERT
Toolbars (View Menu)
Turns the Toolbars on and off. There are several different toolbars that can be shown orhidden. A checkmark next to the Toolbar in the list indicates that it is currently selec ted (on).
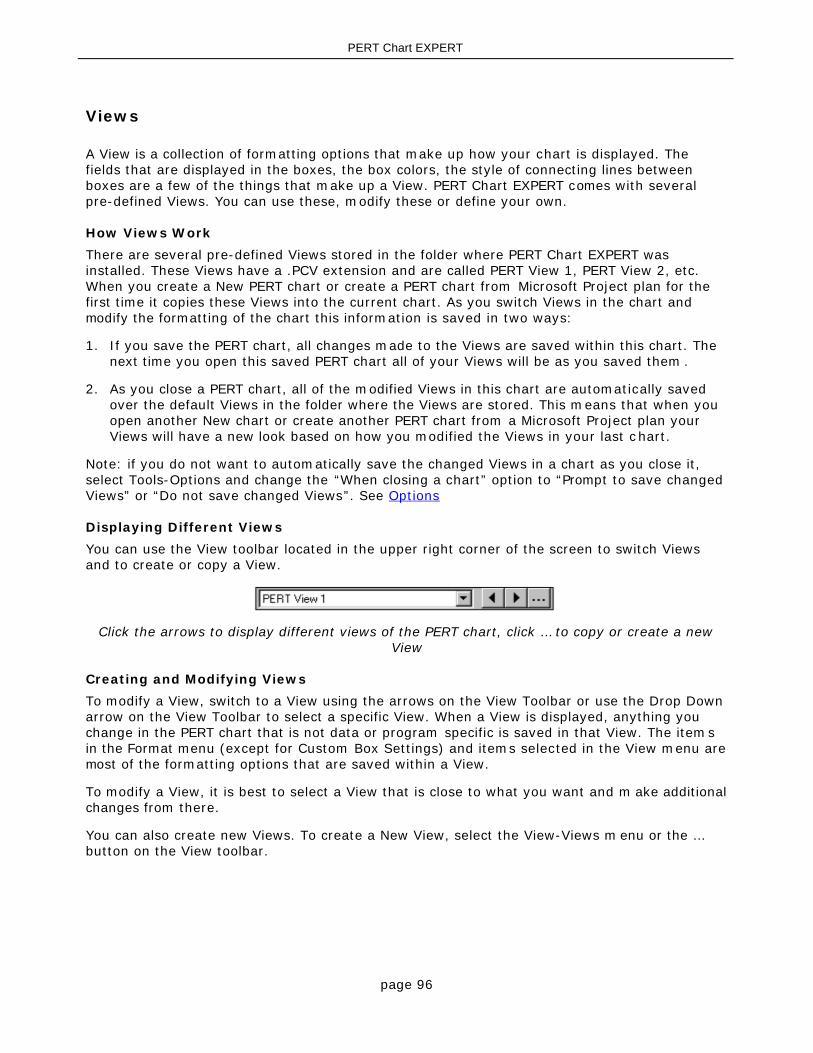
page 96
PERT Chart EXPERT
Views
A View is a collection of formatting options that make up how your chart is displayed. Thefields that are displayed in the boxes, the box colors, the style of connecting lines betweenboxes are a few of the things that make up a View. PERT Chart EXPERT comes with severalpre-defined Views. You can use these, modify these or define your own.
How Views Work
There are several pre-defined Views stored in the folder where PERT Chart EXPERT wasinstalled. These Views have a .PCV extension and are called PERT View 1, PERT View 2, etc.When you create a New PERT chart or create a PERT chart from Microsoft Project plan for thefirst time it copies these Views into the current chart. As you switch Views in the chart andmodify the formatting of the chart this information is saved in two ways:
1. If you save the PERT chart, all changes made to the Views are saved within this chart. Thenext time you open this saved PERT chart all of your Views will be as you saved them .
2. As you close a PERT chart, all of the modified Views in this chart are automatically savedover the default Views in the folder where the Views are stored. This means that when youopen another New chart or create another PERT chart from a Microsoft Project plan yourViews will have a new look based on how you modified the Views in your last c hart.
Note: if you do not want to automatically save the changed Views in a chart as you close it,select Tools-Options and change the “When closing a chart” option to “Prompt to save changedViews” or “Do not save changed Views”. See Options
Displaying Different Views
You can use the View toolbar located in the upper right corner of the screen to switch Viewsand to create or copy a View.
Click the arrows to display different views of the PERT chart, click … to copy or create a newView
Creating and Modifying Views
To modify a View, switch to a View using the arrows on the View Toolbar or use the Drop Downarrow on the View Toolbar to select a specific View. When a View is displayed, anything youchange in the PERT chart that is not data or program specific is saved in that View. The itemsin the Format menu (except for Custom Box Settings) and items selected in the View menu aremost of the formatting options that are saved within a View.
To modify a View, it is best to select a View that is close to what you want and m ake additionalchanges from there.
You can also create new Views. To create a New View, select the View-Views m enu or the …button on the View toolbar.
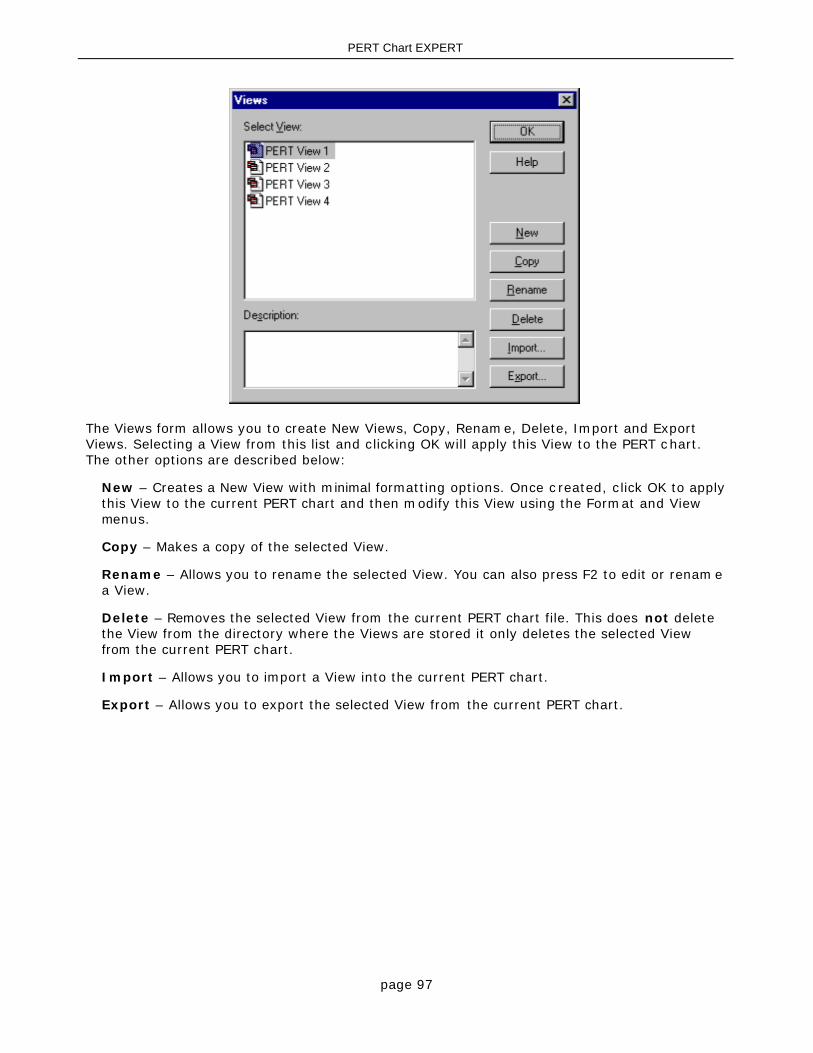
page 97
PERT Chart EXPERT
The Views form allows you to create New Views, Copy, Rename, Delete, Import and ExportViews. Selecting a View from this list and clicking OK will apply this View to the PERT chart.The other options are described below:
New – Creates a New View with minimal formatting options. Once c reated, click OK to applythis View to the current PERT chart and then modify this View using the Format and Viewmenus.
Copy – Makes a copy of the selected View.
Rename – Allows you to rename the selected View. You can also press F2 to edit or renam ea View.
Delete – Removes the selected View from the current PERT chart file. This does not deletethe View from the directory where the Views are stored it only deletes the selected Viewfrom the current PERT chart.
Import – Allows you to import a View into the current PERT chart.
Export – Allows you to export the selected View from the current PERT chart.
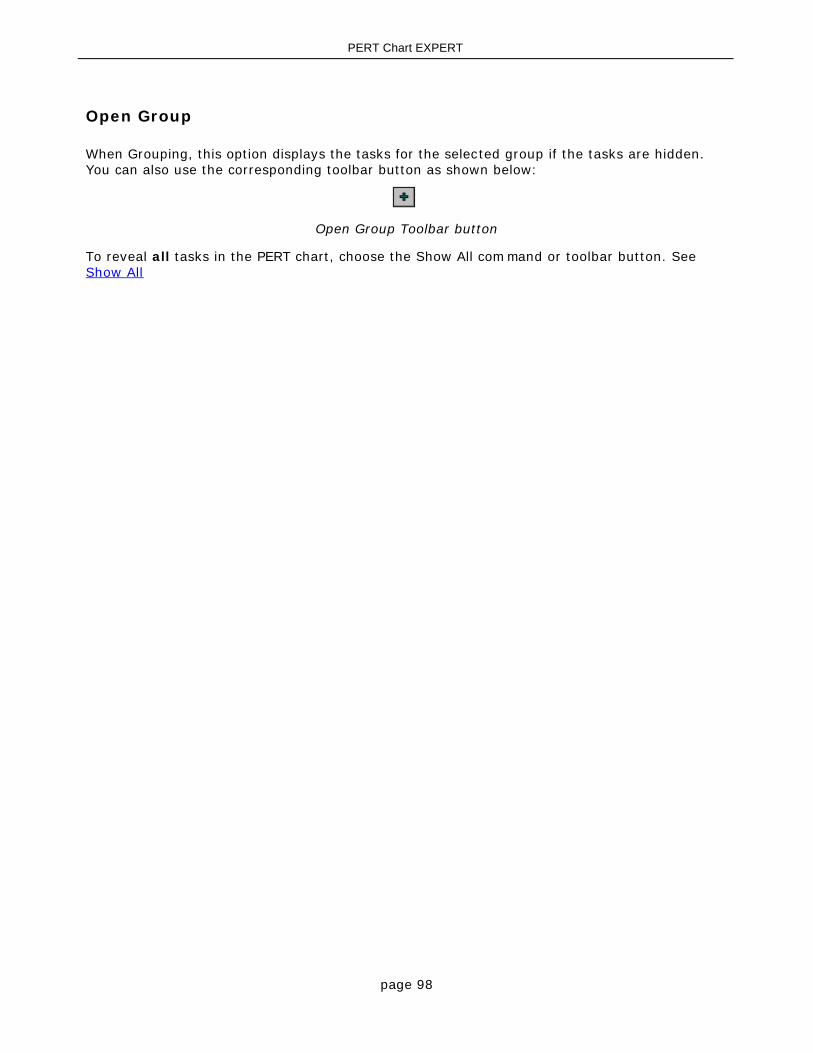
page 98
PERT Chart EXPERT
Open Group
When Grouping, this option displays the tasks for the selected group if the tasks are hidden.You can also use the corresponding toolbar button as shown below:
Open Group Toolbar button
To reveal all tasks in the PERT chart, choose the Show All command or toolbar button. SeeShow All

page 99
PERT Chart EXPERT
Close Group (View Menu)
When Grouping, this option hides the tasks in the selected group. You can also use thecorresponding toolbar button as shown below:
Close Group Toolbar button

page 100
PERT Chart EXPERT
Show All (View Menu)
Reveals all tasks throughout the PERT chart that were hidden using the Close Group, Trac efeature or Filtering from MS Project. You can also use the corresponding toolbar button asshown below:
The Show All Toolbar button
page 101
PERT Chart EXPERT
Focus (View Menu)
When Grouped, this option displays the selected group (and any subgroups to the selectedgroup) and hides the rest. You can also use the corresponding toolbar button as shown below:
Focus Toolbar button
This is useful for isolating a section of your PERT chart for display or printing. Selec t thisbutton again to restore focus to the entire PERT chart.

page 102
PERT Chart EXPERT
Show Only Groups (View Menu)
When Grouped, this option displays only the group headers and hides all tasks in the c hart.You can also use the corresponding toolbar button as shown below:
The Show Only Groups Toolbar button
page 103
PERT Chart EXPERT
Progress Marks (View Menu)
Turns the Progress Marks on and off. A checkmark next to the word Progress Marks in the Viewmenu indicates that it is currently selected (on).
Progress Marks indicate the progress of tasks (and summary tasks) by placing an X or a singlediagonal line through the task box based on the Percent Complete of the task. Progress Marksuse the Percent Complete field to determine the progress of the tasks in the PERT chart usingthe following rules:
Displays an X through the box if the task is 100% complete.
Displays a diagonal line through the box if the task is 1% to 99% Complete (in progress).
Does not display Progress Marks if the task is 0% complete.
Using Progress Marks is one of a number of different ways to display progress in a PERT c hart.You can also show progress using the following features:
Use Colors and Border styles to display progress for your tasks in the PERT chart – SeeBorders
Fill in a Field for a task box based on progress. See Fields
page 104
PERT Chart EXPERT
Hyperlink Symbols (View Menu)
Turns the Hyperlink Symbol on and off. A checkmark next to the Hyperlink Symbols optionindicates that it is currently selected (on).
Hyperlink Symbols allow you to quickly jump to the Hyperlink associated with a task byclicking the small symbol next to the task. If Hyperlink Symbols are displayed in the PERTchart, a Task with a Hyperlink displays a small box next to that task. Click this box to go tothat Hyperlink.
Hyperlink Symbols can be positioned in different places around a task box. See Chart forinformation on how to change the location of the Hyperlink Symbol.
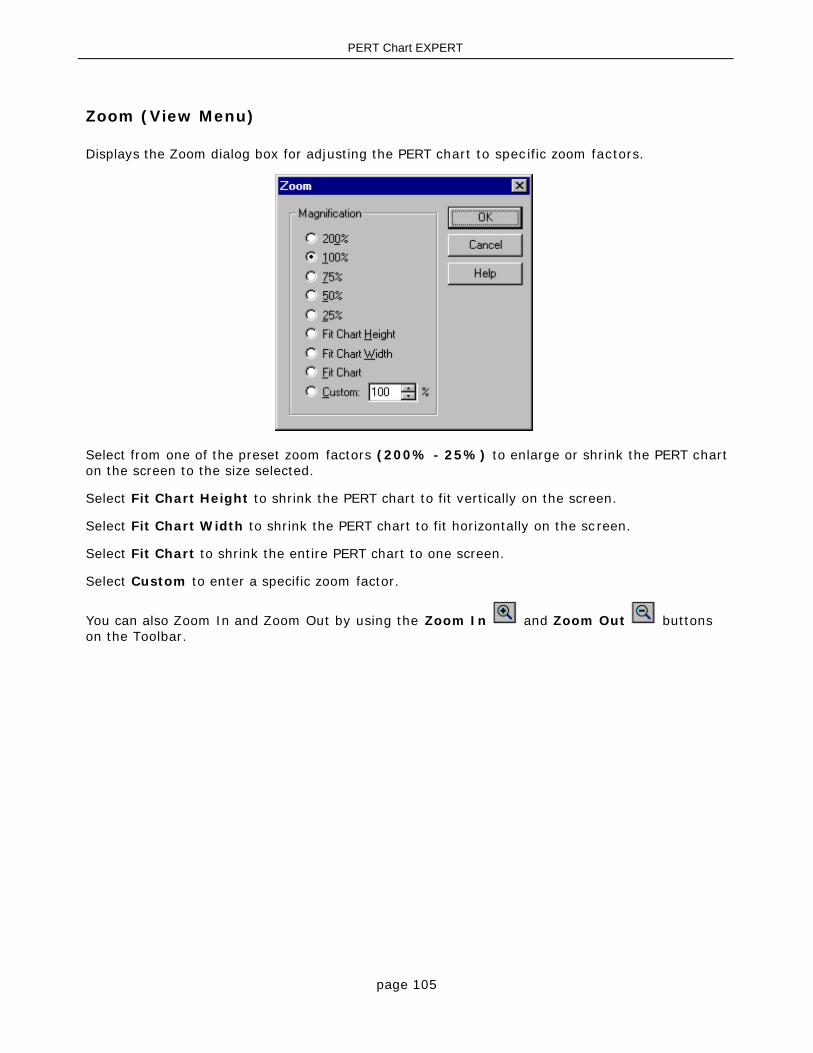
page 105
PERT Chart EXPERT
Zoom (View Menu)
Displays the Zoom dialog box for adjusting the PERT chart to spec ific zoom factors.
Select from one of the preset zoom factors (200% - 25%) to enlarge or shrink the PERT charton the screen to the size selected.
Select Fit Chart Height to shrink the PERT chart to fit vertically on the screen.
Select Fit Chart Width to shrink the PERT chart to fit horizontally on the screen.
Select Fit Chart to shrink the entire PERT chart to one screen.
Select Custom to enter a specific zoom factor.
You can also Zoom In and Zoom Out by using the Zoom In and Zoom Out buttonson the Toolbar.
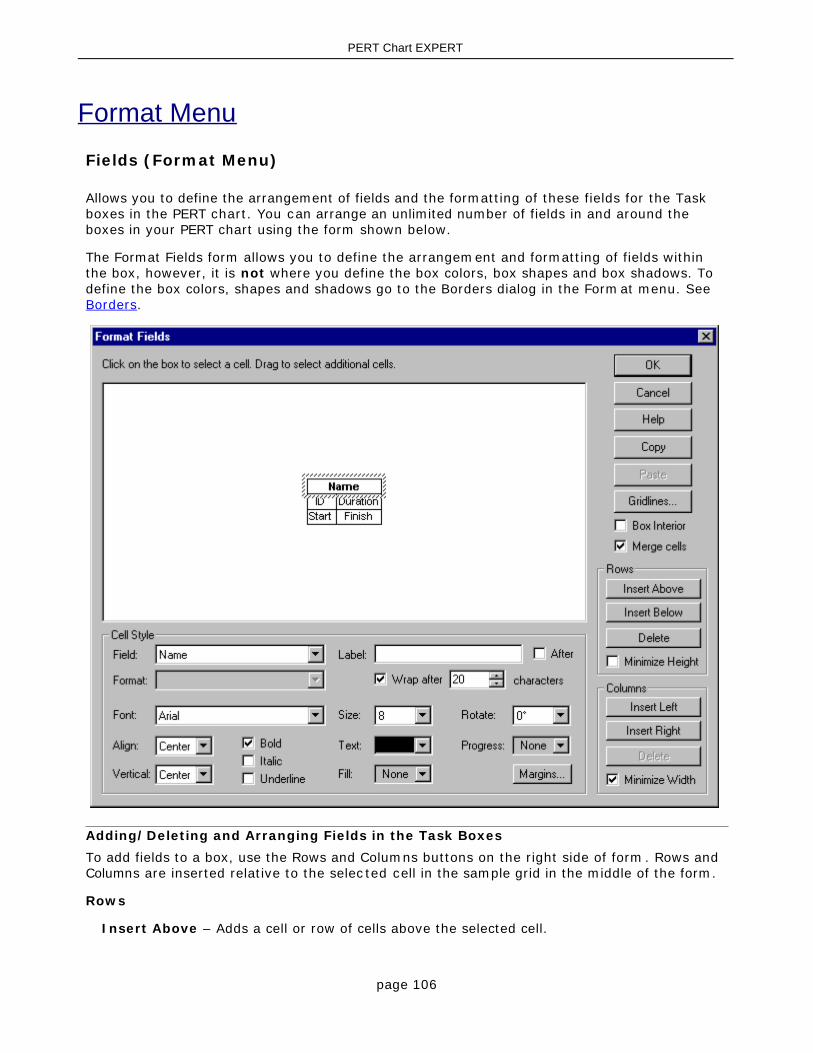
page 106
PERT Chart EXPERT
Format Menu
Fields (Format Menu)
Allows you to define the arrangement of fields and the formatting of these fields for the Taskboxes in the PERT chart. You can arrange an unlimited number of fields in and around theboxes in your PERT chart using the form shown below.
The Format Fields form allows you to define the arrangement and formatting of fields withinthe box, however, it is not where you define the box colors, box shapes and box shadows. Todefine the box colors, shapes and shadows go to the Borders dialog in the Format menu. See Borders.
Adding/Deleting and Arranging Fields in the Task Boxes
To add fields to a box, use the Rows and Columns buttons on the right side of form. Rows andColumns are inserted relative to the selec ted cell in the sample grid in the middle of the form.
Rows
Insert Above – Adds a cell or row of cells above the selected cell.
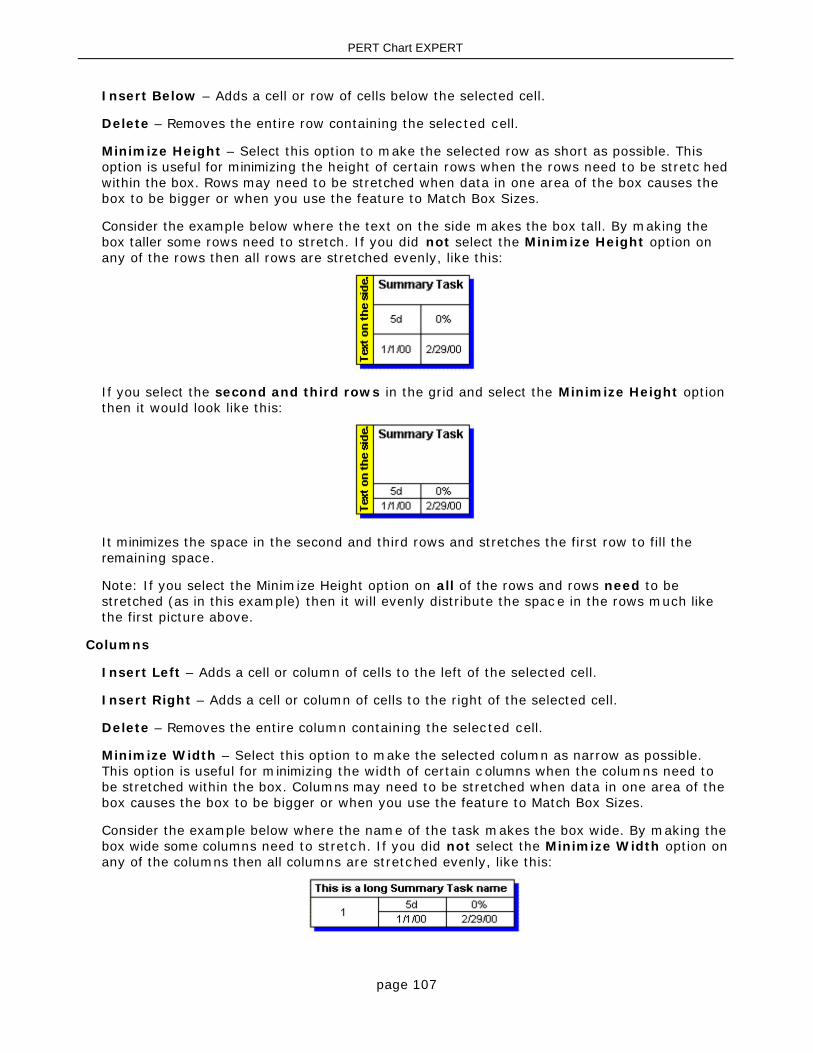
page 107
PERT Chart EXPERT
Insert Below – Adds a cell or row of cells below the selected cell.
Delete – Removes the entire row containing the selected cell.
Minimize Height – Select this option to make the selected row as short as possible. Thisoption is useful for minimizing the height of certain rows when the rows need to be stretc hedwithin the box. Rows may need to be stretched when data in one area of the box causes thebox to be bigger or when you use the feature to Match Box Sizes.
Consider the example below where the text on the side m akes the box tall. By making thebox taller some rows need to stretch. If you did not select the Minimize Height option onany of the rows then all rows are stretched evenly, like this:
If you select the second and third rows in the grid and select the Minimize Height optionthen it would look like this:
It minimizes the space in the second and third rows and stretches the first row to fill theremaining space.
Note: If you select the Minimize Height option on all of the rows and rows need to bestretched (as in this example) then it will evenly distribute the spac e in the rows much likethe first picture above.
Columns
Insert Left – Adds a cell or column of cells to the left of the selected cell.
Insert Right – Adds a cell or column of cells to the right of the selected cell.
Delete – Removes the entire column containing the selected cell.
Minimize Width – Select this option to make the selected column as narrow as possible.This option is useful for minimizing the width of certain c olumns when the columns need tobe stretched within the box. Columns may need to be stretched when data in one area of thebox causes the box to be bigger or when you use the feature to Match Box Sizes.
Consider the example below where the name of the task makes the box wide. By making thebox wide some columns need to stretch. If you did not select the Minimize Width option onany of the columns then all columns are stretched evenly, like this:
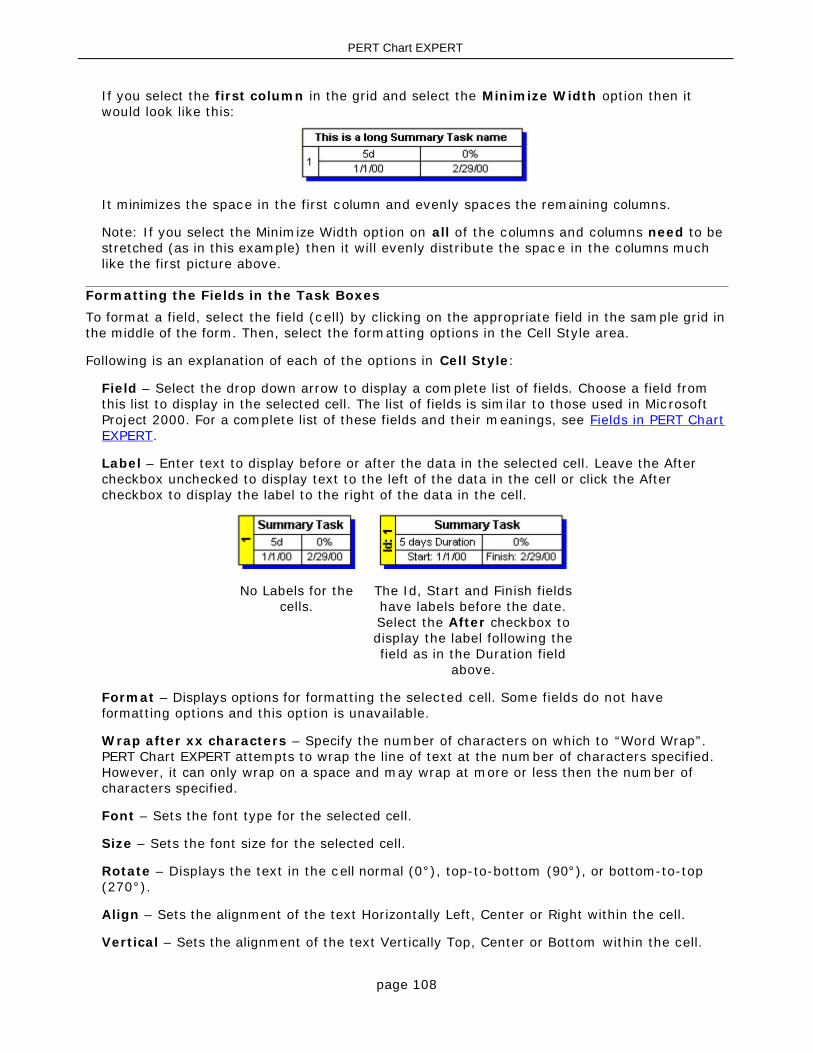
page 108
PERT Chart EXPERT
If you select the first column in the grid and select the Minimize Width option then itwould look like this:
It minimizes the space in the first column and evenly spaces the remaining columns.
Note: If you select the Minimize Width option on all of the columns and columns need to bestretched (as in this example) then it will evenly distribute the spac e in the columns muchlike the first picture above.
Formatting the Fields in the Task Boxes
To format a field, select the field (cell) by clicking on the appropriate field in the sample grid inthe middle of the form. Then, select the formatting options in the Cell Style area.
Following is an explanation of each of the options in Cell Style:
Field – Select the drop down arrow to display a complete list of fields. Choose a field fromthis list to display in the selected cell. The list of fields is similar to those used in MicrosoftProject 2000. For a complete list of these fields and their meanings, see Fields in PERT ChartEXPERT.
Label – Enter text to display before or after the data in the selected cell. Leave the Aftercheckbox unchecked to display text to the left of the data in the cell or click the Aftercheckbox to display the label to the right of the data in the cell.
No Labels for thecells.
The Id, Start and Finish fieldshave labels before the date.Select the After checkbox todisplay the label following thefield as in the Duration field
above.
Format – Displays options for formatting the selected cell. Some fields do not haveformatting options and this option is unavailable.
Wrap after xx characters – Specify the number of characters on which to “Word Wrap”.PERT Chart EXPERT attempts to wrap the line of text at the number of characters specified.However, it can only wrap on a space and may wrap at more or less then the number ofcharacters specified.
Font – Sets the font type for the selected cell.
Size – Sets the font size for the selected cell.
Rotate – Displays the text in the cell normal (0°), top-to-bottom (90°), or bottom-to-top(270°).
Align – Sets the alignment of the text Horizontally Left, Center or Right within the cell.
Vertical – Sets the alignment of the text Vertically Top, Center or Bottom within the cell.
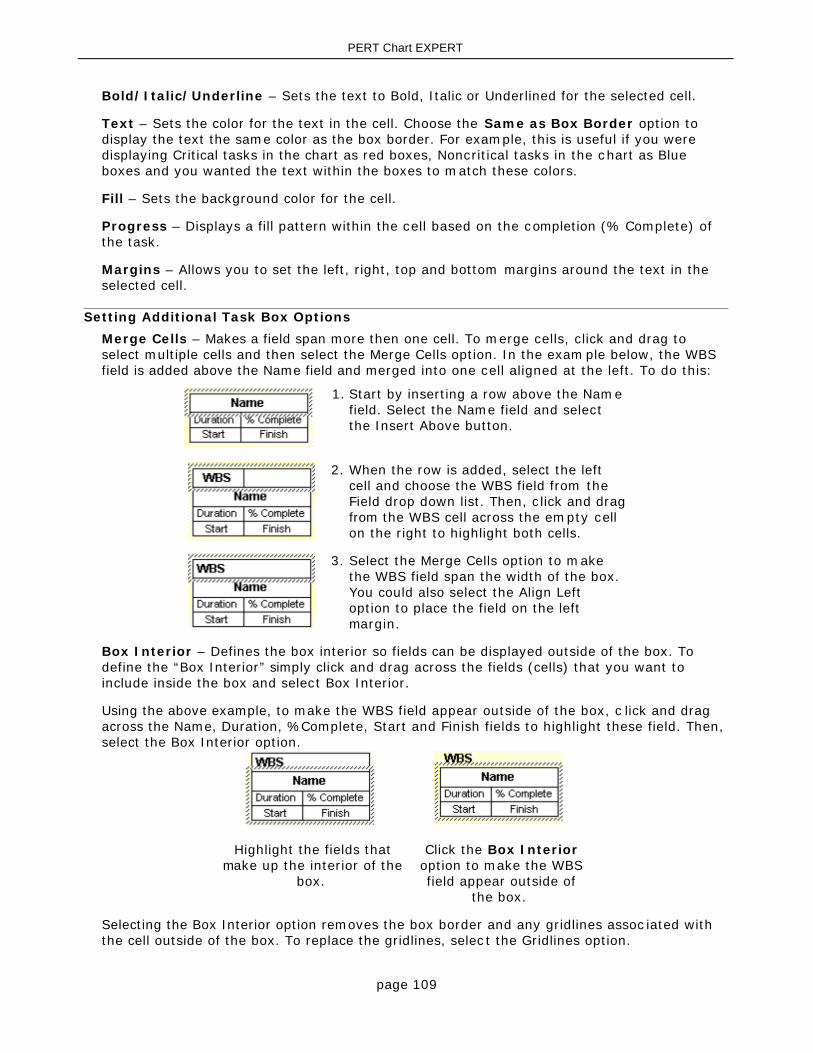
page 109
PERT Chart EXPERT
Bold/Italic/Underline – Sets the text to Bold, Italic or Underlined for the selected cell.
Text – Sets the color for the text in the cell. Choose the Same as Box Border option todisplay the text the same color as the box border. For example, this is useful if you weredisplaying Critical tasks in the chart as red boxes, Noncritical tasks in the chart as Blueboxes and you wanted the text within the boxes to match these colors.
Fill – Sets the background color for the cell.
Progress – Displays a fill pattern within the cell based on the completion (% Complete) ofthe task.
Margins – Allows you to set the left, right, top and bottom margins around the text in theselected cell.
Setting Additional Task Box Options
Merge Cells – Makes a field span more then one cell. To merge cells, click and drag toselect multiple cells and then select the Merge Cells option. In the example below, the WBSfield is added above the Name field and merged into one cell aligned at the left. To do this:
1. Start by inserting a row above the Namefield. Select the Name field and selectthe Insert Above button.
2. When the row is added, select the leftcell and choose the WBS field from theField drop down list. Then, click and dragfrom the WBS cell across the empty cellon the right to highlight both cells.
3. Select the Merge Cells option to makethe WBS field span the width of the box.You could also select the Align Leftoption to place the field on the leftmargin.
Box Interior – Defines the box interior so fields can be displayed outside of the box. Todefine the “Box Interior” simply click and drag across the fields (cells) that you want toinclude inside the box and select Box Interior.
Using the above example, to make the WBS field appear outside of the box, c lick and dragacross the Name, Duration, %Complete, Start and Finish fields to highlight these field. Then,select the Box Interior option.
Highlight the fields thatmake up the interior of the
box.
Click the Box Interioroption to make the WBSfield appear outside of
the box.
Selecting the Box Interior option removes the box border and any gridlines assoc iated withthe cell outside of the box. To replace the gridlines, selec t the Gridlines option.

page 110
PERT Chart EXPERT
Gridlines – Select to configure the gridlines between the fields. The separating linesbetween the fields that you have displayed in the Summary or Task Boxes are referred to asGridlines. You can choose to turn them all off, turn them all on or individually select whichgridlines appear.
Copy – Select to copy the arrangement of fields for pasting into the Summary Boxes or TaskBoxes form. For example, if you are currently configuring Task Boxes and you wanted to usethis same arrangement of fields for your Summary Boxes you would press Copy while in theTask Boxes form then go to the Summary Boxes form and press Paste.
Paste – Select to paste the copy of the fields into the current Sum mary or Task Boxes form.You must have previously selected Copy from either the Summary Boxes or Task Boxes formfor this to work.
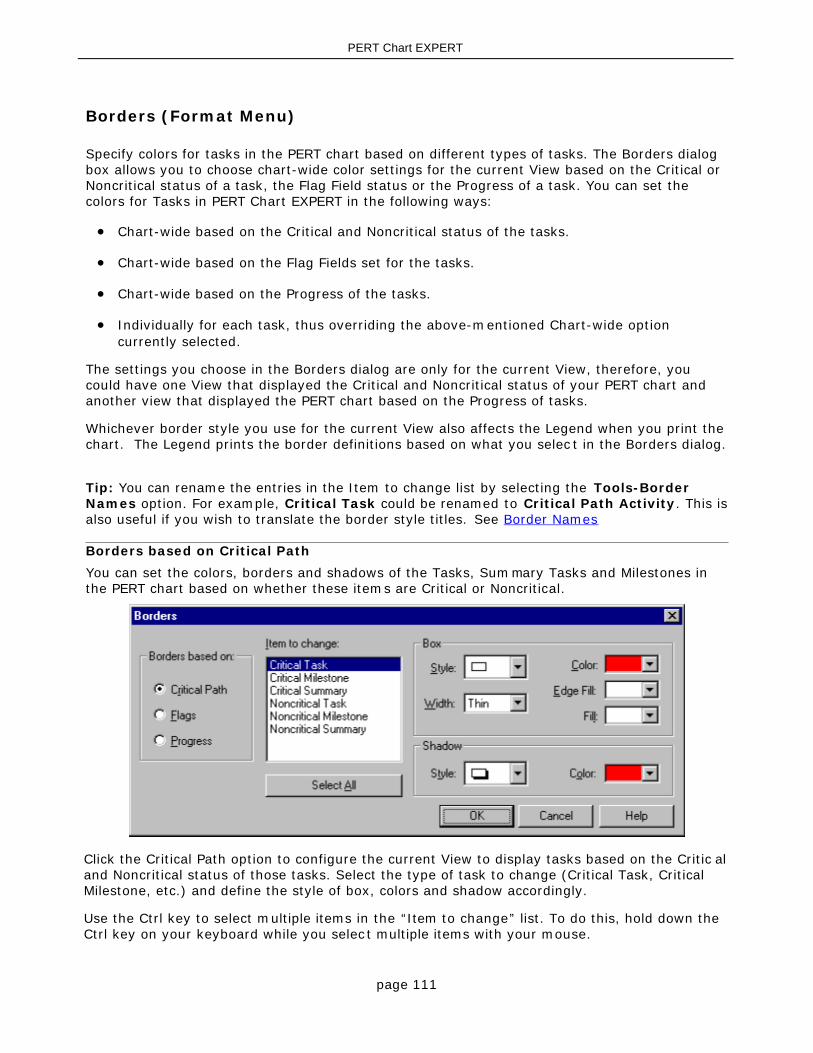
page 111
PERT Chart EXPERT
Borders (Format Menu)
Specify colors for tasks in the PERT chart based on different types of tasks. The Borders dialogbox allows you to choose chart-wide color settings for the current View based on the Critical orNoncritical status of a task, the Flag Field status or the Progress of a task. You can set thecolors for Tasks in PERT Chart EXPERT in the following ways:
Chart-wide based on the Critical and Noncritical status of the tasks.
Chart-wide based on the Flag Fields set for the tasks.
Chart-wide based on the Progress of the tasks.
Individually for each task, thus overriding the above-mentioned Chart-wide optioncurrently selected.
The settings you choose in the Borders dialog are only for the current View, therefore, youcould have one View that displayed the Critical and Noncritical status of your PERT chart andanother view that displayed the PERT chart based on the Progress of tasks.
Whichever border style you use for the current View also affects the Legend when you print thechart. The Legend prints the border definitions based on what you selec t in the Borders dialog.
Tip: You can rename the entries in the Item to change list by selecting the Tools-BorderNames option. For example, Critical Task could be renamed to Critical Path Activity. This isalso useful if you wish to translate the border style titles. See Border Names
Borders based on Critical Path
You can set the colors, borders and shadows of the Tasks, Summary Tasks and Milestones inthe PERT chart based on whether these items are Critical or Noncritical.
Click the Critical Path option to configure the current View to display tasks based on the Critic aland Noncritical status of those tasks. Select the type of task to change (Critical Task, CriticalMilestone, etc.) and define the style of box, colors and shadow accordingly.
Use the Ctrl key to select multiple items in the “Item to change” list. To do this, hold down theCtrl key on your keyboard while you selec t multiple items with your mouse.
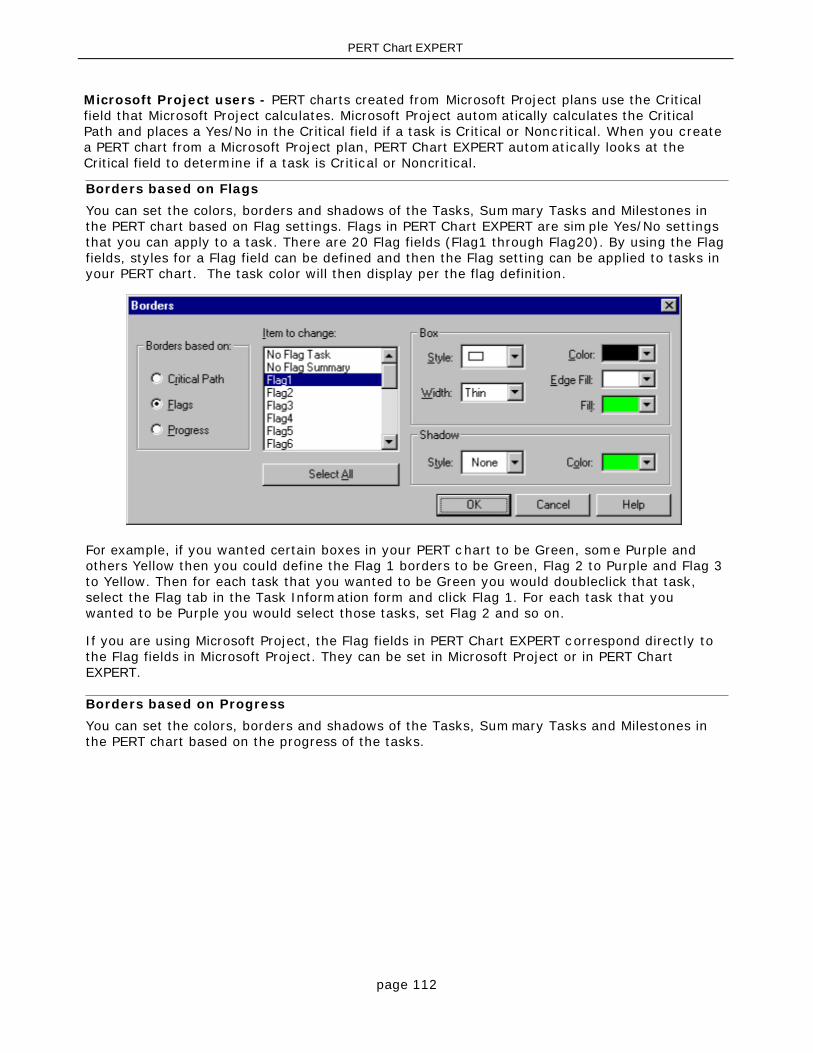
page 112
PERT Chart EXPERT
Microsoft Project users - PERT charts created from Microsoft Project plans use the Criticalfield that Microsoft Project calculates. Microsoft Project autom atically calculates the CriticalPath and places a Yes/No in the Critical field if a task is Critical or Noncritical. When you createa PERT chart from a Microsoft Project plan, PERT Chart EXPERT automatically looks at theCritical field to determine if a task is Critical or Noncritical.
Borders based on Flags
You can set the colors, borders and shadows of the Tasks, Summary Tasks and Milestones inthe PERT chart based on Flag settings. Flags in PERT Chart EXPERT are simple Yes/No settingsthat you can apply to a task. There are 20 Flag fields (Flag1 through Flag20). By using the Flagfields, styles for a Flag field can be defined and then the Flag setting can be applied to tasks inyour PERT chart. The task color will then display per the flag definition.
For example, if you wanted certain boxes in your PERT chart to be Green, some Purple andothers Yellow then you could define the Flag 1 borders to be Green, Flag 2 to Purple and Flag 3to Yellow. Then for each task that you wanted to be Green you would doubleclick that task,select the Flag tab in the Task Information form and click Flag 1. For each task that youwanted to be Purple you would select those tasks, set Flag 2 and so on.
If you are using Microsoft Project, the Flag fields in PERT Chart EXPERT correspond directly tothe Flag fields in Microsoft Project. They can be set in Microsoft Project or in PERT ChartEXPERT.
Borders based on Progress
You can set the colors, borders and shadows of the Tasks, Summary Tasks and Milestones inthe PERT chart based on the progress of the tasks.
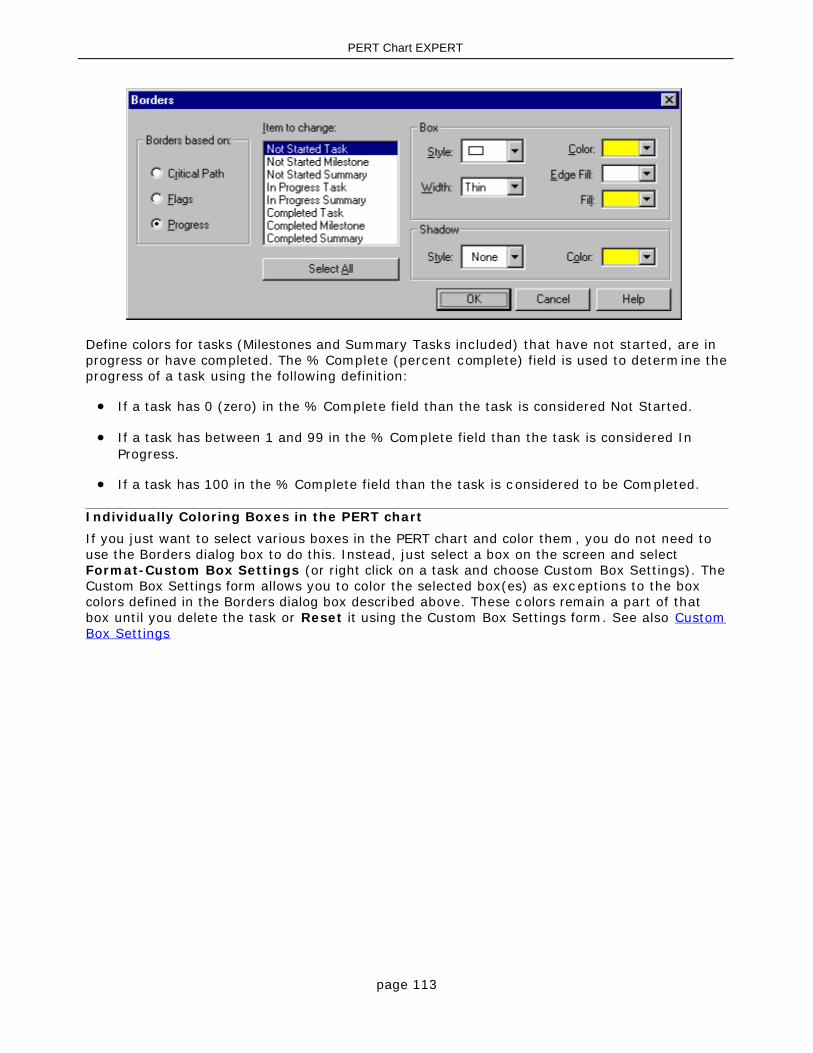
page 113
PERT Chart EXPERT
Define colors for tasks (Milestones and Summary Tasks included) that have not started, are inprogress or have completed. The % Complete (percent complete) field is used to determine theprogress of a task using the following definition:
If a task has 0 (zero) in the % Complete field than the task is considered Not Started.
If a task has between 1 and 99 in the % Complete field than the task is considered InProgress.
If a task has 100 in the % Complete field than the task is c onsidered to be Completed.
Individually Coloring Boxes in the PERT chart
If you just want to select various boxes in the PERT chart and color them, you do not need touse the Borders dialog box to do this. Instead, just select a box on the screen and select Format-Custom Box Settings (or right click on a task and choose Custom Box Settings). TheCustom Box Settings form allows you to color the selected box(es) as exceptions to the boxcolors defined in the Borders dialog box described above. These colors remain a part of thatbox until you delete the task or Reset it using the Custom Box Settings form. See also CustomBox Settings
page 114
PERT Chart EXPERT
Chart (Format Menu)
Displays various features used to configure the default options in a chart. The options availableapply to the current View. This allows each View to have its own default.
Box Arrangement – Specify the method of placing boxes in the chart. Choose “Top DownFrom Left” to arrange boxes from the top left and down based on Predecessors, Successors andId. Choose “Top Down - Critical First” to place them from the top left and down based onPredecessors and Successors but also attempt to place Critical Tasks first across the top of thechart.
Background Color – Specify the background color of the chart.
Hyperlink Symbols – Specify where to place the Hyperlink symbol associated with a task.
Row Spacing – Specify any extra space to include between rows in the chart.
Column Spacing – Specify any extra space to include between columns in the chart.
Match box heights – Specify that all boxes are the same height (all boxes will be as tall asthe tallest box).
Match box widths – Specify that all boxes are the same width (all boxes will be as wide asthe widest box).
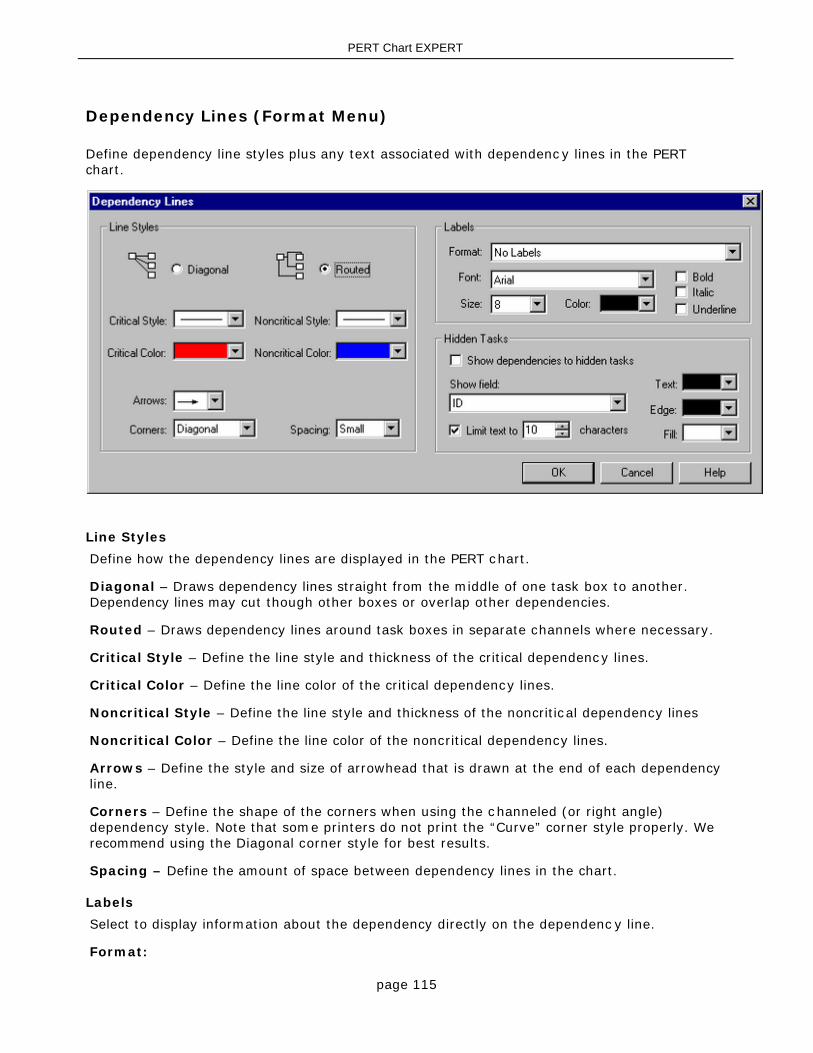
page 115
PERT Chart EXPERT
Dependency Lines (Format Menu)
Define dependency line styles plus any text associated with dependenc y lines in the PERTchart.
Line Styles
Define how the dependency lines are displayed in the PERT chart.
Diagonal – Draws dependency lines straight from the middle of one task box to another.Dependency lines may cut though other boxes or overlap other dependencies.
Routed – Draws dependency lines around task boxes in separate channels where necessary.
Critical Style – Define the line style and thickness of the critical dependency lines.
Critical Color – Define the line color of the critical dependency lines.
Noncritical Style – Define the line style and thickness of the noncritical dependency lines
Noncritical Color – Define the line color of the noncritical dependency lines.
Arrows – Define the style and size of arrowhead that is drawn at the end of each dependencyline.
Corners – Define the shape of the corners when using the channeled (or right angle)dependency style. Note that some printers do not print the “Curve” corner style properly. Werecommend using the Diagonal corner style for best results.
Spacing – Define the amount of space between dependency lines in the chart.
Labels
Select to display information about the dependency directly on the dependenc y line.
Format:
page 116
PERT Chart EXPERT
No Labels – Does not display any information about the dependency on the dependenc y line.
Dependency Type + Lag – Displays the type of dependency plus any lag on the dependencyline. For example, it would display FS or FS+5d for a Finish to Start or Finish to Start plus a 5day lag.
Lag Only – Displays only lag amounts that are not 0 (zero) on the dependenc y line.
Predecessor ID – Displays the type of dependency plus the Id of the predecessor on thedependency line.
Predecessor ID (without Dependency Type) – Displays the Id of the predecessor on thedependency line.
Unique Predecessor – Displays the type of dependency plus the Unique Id of thepredecessor on the dependency line.
Unique Predecessor (without Dependency Type) – Displays the Unique Id of thepredecessor on the dependency line.
WBS Predecessor – Displays the type of dependency plus the WBS number of thepredecessor on the dependency line.
WBS Predecessor (without Dependency Type) – Displays the WBS number of thepredecessor on the dependency line.
Font/Size/Color, etc. – Define the text attributes for the dependency line labels. Theseattributes also apply to the text at the end of Hidden Dependency Lines if you choose theoption described below.
Hidden Tasks
Select this option to show dependency identifiers to tasks that are currently not displayed(hidden) in the chart.
Show dependencies to hidden tasks – Select this option to turn on this feature and toshow the dependency plus a node at the end of the dependency line to identify the hiddentask.
Show Field – Select the information to include at the node at the end of the dependency linesuch as the Id or the Name of the task.
Limit text to xx characters – Enter a maximum number of characters to include in the nodefor hidden tasks. Text will be truncated after the number of characters specified.
Text – Select the color for the text in the node.
Edge – Select the border color of the node.
Fill – Select the color for the interior of the node.
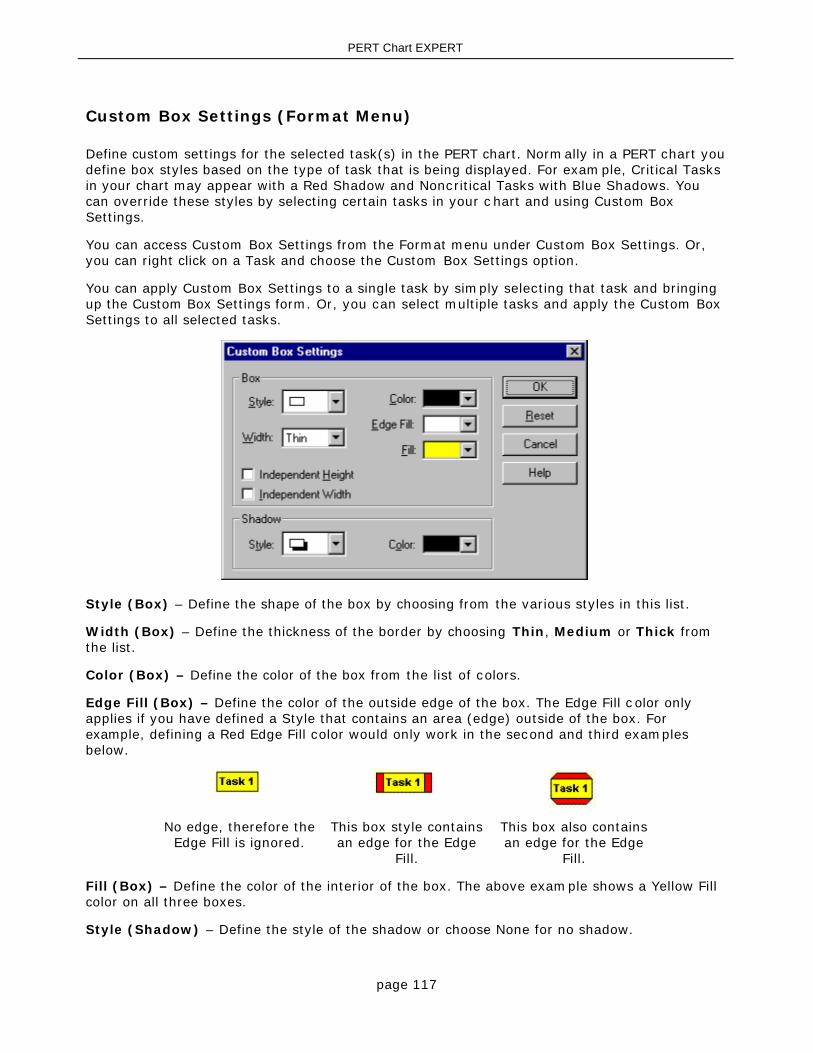
page 117
PERT Chart EXPERT
Custom Box Settings (Format Menu)
Define custom settings for the selected task(s) in the PERT chart. Normally in a PERT chart youdefine box styles based on the type of task that is being displayed. For example, Critical Tasksin your chart may appear with a Red Shadow and Noncritical Tasks with Blue Shadows. Youcan override these styles by selecting certain tasks in your c hart and using Custom BoxSettings.
You can access Custom Box Settings from the Format menu under Custom Box Settings. Or,you can right click on a Task and choose the Custom Box Settings option.
You can apply Custom Box Settings to a single task by simply selecting that task and bringingup the Custom Box Settings form. Or, you can select multiple tasks and apply the Custom BoxSettings to all selected tasks.
Style (Box) – Define the shape of the box by choosing from the various styles in this list.
Width (Box) – Define the thickness of the border by choosing Thin, Medium or Thick fromthe list.
Color (Box) – Define the color of the box from the list of colors.
Edge Fill (Box) – Define the color of the outside edge of the box. The Edge Fill c olor onlyapplies if you have defined a Style that contains an area (edge) outside of the box. Forexample, defining a Red Edge Fill color would only work in the second and third examplesbelow.
No edge, therefore theEdge Fill is ignored.
This box style containsan edge for the Edge
Fill.
This box also containsan edge for the Edge
Fill.
Fill (Box) – Define the color of the interior of the box. The above example shows a Yellow Fillcolor on all three boxes.
Style (Shadow) – Define the style of the shadow or choose None for no shadow.

page 118
PERT Chart EXPERT
Color (Shadow) – Define the shadow color from the list of colors.
Independent Box Height – If you have chosen to Match Box Heights, you can select thisoption to not include the selected task(s).
Independent Box Width – If you have chosen the Match Box Widths, you can select thisoption to not include the selected task(s).
Reset – Removes all of the Custom Box Settings and reverts to using the default settings forthis box.
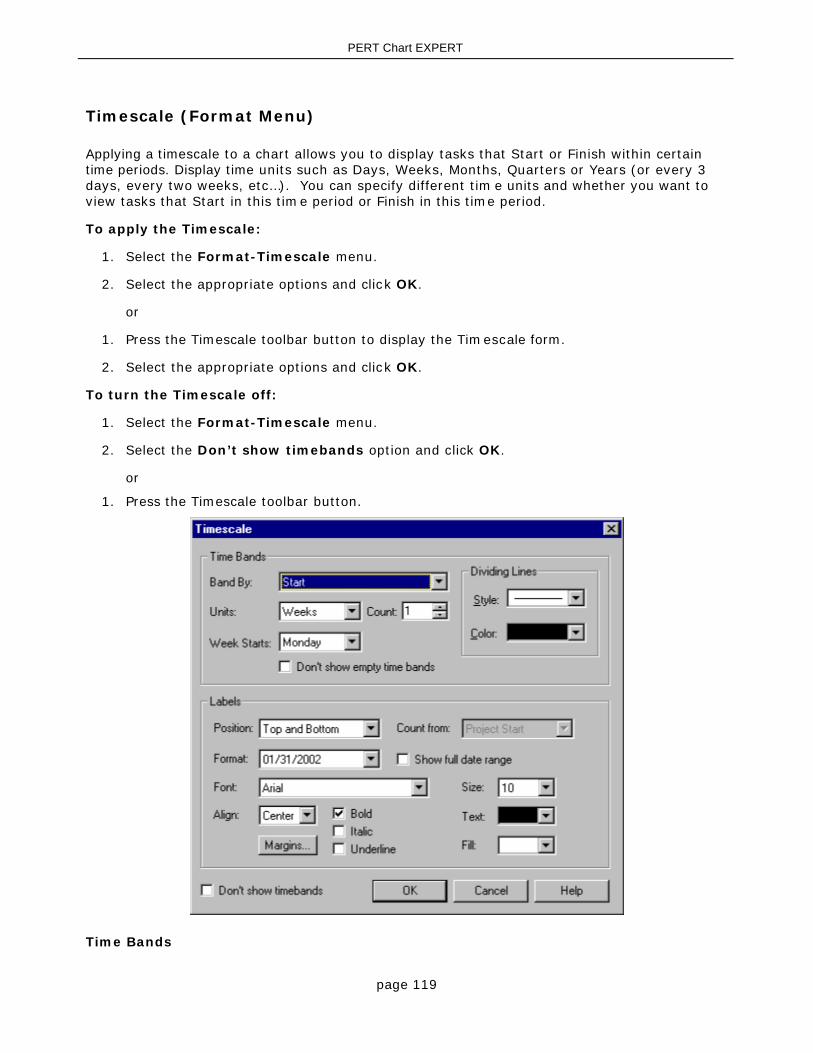
page 119
PERT Chart EXPERT
Timescale (Format Menu)
Applying a timescale to a chart allows you to display tasks that Start or Finish within certaintime periods. Display time units such as Days, Weeks, Months, Quarters or Years (or every 3days, every two weeks, etc…). You can specify different tim e units and whether you want toview tasks that Start in this time period or Finish in this time period.
To apply the Timescale:
1. Select the Format-Timescale menu.
2. Select the appropriate options and click OK.
or
1. Press the Timescale toolbar button to display the Timescale form.
2. Select the appropriate options and click OK.
To turn the Timescale off:
1. Select the Format-Timescale menu.
2. Select the Don’t show timebands option and click OK.
or
1. Press the Timescale toolbar button.
Time Bands

page 120
PERT Chart EXPERT
Band By – Select the field to use when placing a task in the time band. If you select Start,all tasks that Start during the time period are displayed in the time band. If you select Finishthen all tasks that finish within that time period are displayed in the time band.
Units – Select to display the timescale by Hour, Day, Week, Month, Quarter, Half Year orYear time units.
Count – Select the time interval between units. Enter 1 to display every time period, 2 todisplay every other time period and so on. For example, if you were displaying Weeks as theUnits, entering 2 in the Count would display a time band every two weeks.
Week Starts – Specify the day of the week to use when displaying weeks as the time unit.
Don’t Show Empty Time Bands – Hides the time bands in the chart that do not containtasks.
Dividing Lines – Defines the color and line style of the vertical timescale dividing lines.
Labels
Position – Select to display the timescale labels at the Top, Bottom or both Top andBottom.
Count From – This option only applies when you choose to display dates (using the Form atoption) as Day 1, Day 2… or Week 1, Week 2, etc… The Project Start option uses theProject Start Date to start counting up from this date, eg: Day 1, Day 2, etc. Project Finishuses the Project Finish Date to start counting down from this date eg: Day –5, Day –4,etc... Earliest Task uses the earliest task displayed on the screen to start counting. LatestTask uses the latest task displayed on the screen to start counting down from this date.Today uses today’s date to start counting.
Format – Select the date format for the timescale.
Show Full Date Range – Displays the full range of dates when applicable. For example, ifa two week period is selected, the full date range would display dates as Jan 1, 2002 – Jan14, 2002 instead or Jan 1, 2002.
Font – Select the font size for the timescale labels.
Align – Select to align the labels within the time band either left, right or center.
Size – Select the font size of the timescale label.
Text – Select this to define the color of the timescale label text.
Fill – Select this to define the background color of the timescale labels.
Margins – Select to adjust the margins around the timescale label.
Don’t show timebands – Select this option and click OK to turn off the timescale so it isnot displayed on the chart. You can also press the Timescale toolbar button to turn off thetimescale.

page 121
PERT Chart EXPERT
Group (Format Menu)
Grouping tasks in PERT Chart EXPERT creates horizontal bands of tasks based on c ertain fields.Tasks can be grouped by Resource Names, Resource Groups, Resource Initials, Text fields(Text 1 thru Text 30) and by Outline (the Summary Tasks in your Microsoft Project plan or thelevels of a WBS chart).
The Groups dialog box indicates which field you are currently grouped by, lists the currentlydefined groups and allows you to format the groups.
Group By: - Select this to change the field by which the tasks are grouped in the PERT chart.See below for a complete explanation.
List of current Groups/Outline levels - The area below the Group By field contains the listof current Groups or the list of Summary Tasks in your plan if grouped by Outline. Thecheckbox next to the group indicates whether the group is displayed in the chart.
Checkbox – The small box to the left of the group name allows you to Hide and Unhidegroups. If checked, the group heading and tasks are displayed in the chart. Deselect the checkmark to “hide” the group. Hiding a group means that all the tasks plus the group heading willbe hidden.
Move Up/Move Down – Select a group from the list and click Move Up or Move Down torearrange the selected group within the list. This option is not available when grouped byOutline Levels.
Milestones in separate group – Select to create a separate group at the top of the chart thatcontains only the milestones in the plan.
Automatically Hide Empty Groups – Select to automatically hide groups that do not containany tasks. For example, if you have resources defined in your plan and you group by ResourceNames it would display a group for each resource. If a resource did not have tasks assignedthen a group heading would appear in the chart with no tasks under it. Choose this option tohide this group heading.
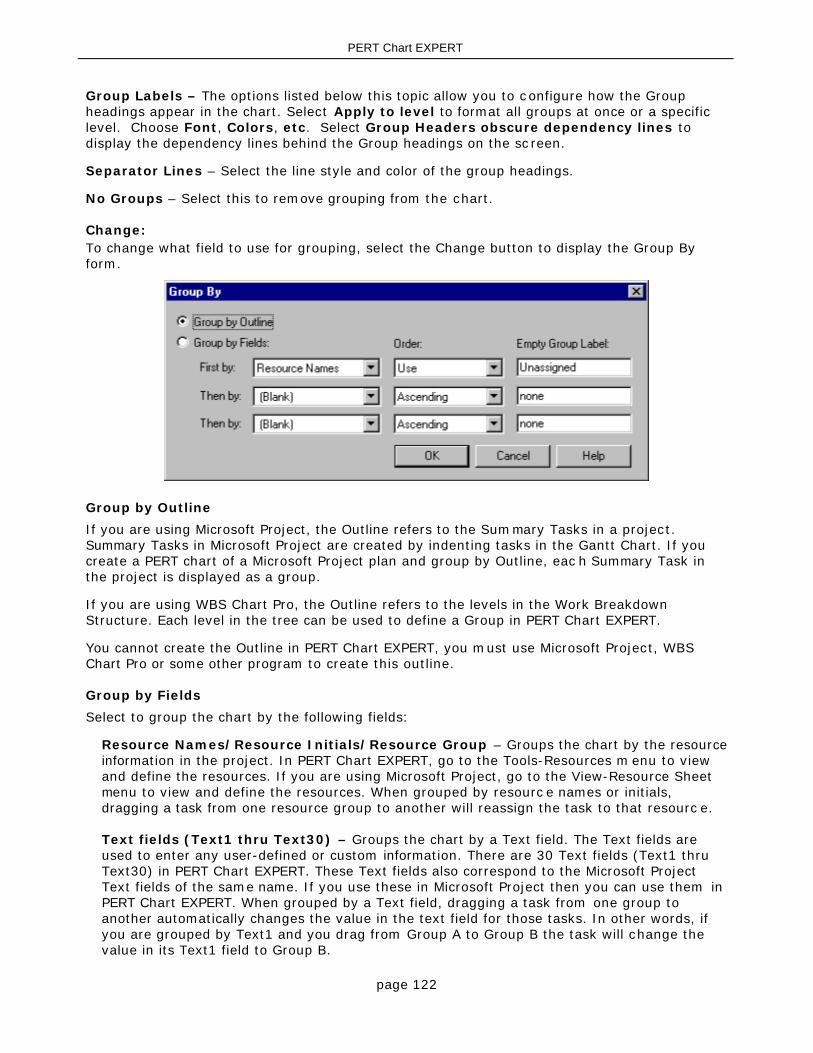
page 122
PERT Chart EXPERT
Group Labels – The options listed below this topic allow you to configure how the Groupheadings appear in the chart. Select Apply to level to format all groups at once or a specificlevel. Choose Font, Colors, etc. Select Group Headers obscure dependency lines todisplay the dependency lines behind the Group headings on the sc reen.
Separator Lines – Select the line style and color of the group headings.
No Groups – Select this to remove grouping from the chart.
Change:To change what field to use for grouping, select the Change button to display the Group Byform.
Group by Outline
If you are using Microsoft Project, the Outline refers to the Summary Tasks in a project.Summary Tasks in Microsoft Project are created by indenting tasks in the Gantt Chart. If youcreate a PERT chart of a Microsoft Project plan and group by Outline, eac h Summary Task inthe project is displayed as a group.
If you are using WBS Chart Pro, the Outline refers to the levels in the Work BreakdownStructure. Each level in the tree can be used to define a Group in PERT Chart EXPERT.
You cannot create the Outline in PERT Chart EXPERT, you must use Microsoft Project, WBSChart Pro or some other program to create this outline.
Group by Fields
Select to group the chart by the following fields:
Resource Names/Resource Initials/Resource Group – Groups the chart by the resourceinformation in the project. In PERT Chart EXPERT, go to the Tools-Resources m enu to viewand define the resources. If you are using Microsoft Project, go to the View-Resource Sheetmenu to view and define the resources. When grouped by resourc e names or initials,dragging a task from one resource group to another will reassign the task to that resourc e.
Text fields (Text1 thru Text30) – Groups the chart by a Text field. The Text fields areused to enter any user-defined or custom information. There are 30 Text fields (Text1 thruText30) in PERT Chart EXPERT. These Text fields also correspond to the Microsoft ProjectText fields of the same name. If you use these in Microsoft Project then you can use them inPERT Chart EXPERT. When grouped by a Text field, dragging a task from one group toanother automatically changes the value in the text field for those tasks. In other words, ifyou are grouped by Text1 and you drag from Group A to Group B the task will change thevalue in its Text1 field to Group B.

page 123
PERT Chart EXPERT
Order
You can arrange the groups in the chart based on the options in the Order list. They are:
Ascending – Lists the groups in the chart from the lowest to the highest value (1, 2, 3… a,b, c).
Descending – Lists the groups in the chart from the highest to the lowest value (3, 2, 1… c,b, a).
Use – Lists the group in the chart in the order that the fields are used. For example, if yougroup by resource, it would list the resources in the order that they are defined in theResource List (under Tools-Resources in PERT Chart EXPERT or in the Resource View inMicrosoft Project).
Note: If the chart is grouped by the Resource or Text fields you can rearrange a groupwithin this list by selecting the Move Up and Move Down buttons.
Empty Group Label – If there are tasks in the project that do not contain any value for thefield in which you are grouping then these tasks are included in a separate group. Use theEmpty Group Label to identify this group. For example, if you are grouping by Resource andthere are tasks with no resources assigned then these will be placed into a separate groupwith the title that is entered in the Empty Group Label (such as “Unassigned”).
page 124
PERT Chart EXPERT
Lock Box Positions
Select this to lock all boxes in the chart in their current positions. The Lock Box Positionsoption will also automatically become selected and lock boxes if you manually move boxesaround in the chart. By default a PERT chart automatically positions boxes as you add tasks orwhen you create a chart from Microsoft Project or other software. If you move a box by clickingthe edge of a box the entire chart will become Locked.
With boxes locked you can move boxes anywhere in the chart or add tasks exac tly where youwant them and they will stay where you place them. The exception to this is if you try to plac ea new box or move a box in between a row or column of tasks. In this case, it may create arow or column to accommodate the new tasks.
You can also lock boxes by selecting the Lock toolbar button.
To unlock box and have them automatically positioned in the chart, deselect the Lock BoxPositions option or click the Lock toolbar button.
You can also Unlock the selected tasks by clicking and dragging to selec t a number of tasksand then choosing the Format-Layout Selected option. This will automatically position only theselected tasks in the chart relative to each of their predecessors.
See also Moving and Repositioning Tasks

page 125
PERT Chart EXPERT
Layout Selected
When boxes are Locked use this command to automatically position only the selected tasks inthe chart. Each selected task will be automatically positioned relative to its predecessor.
See also Moving and Repositioning Tasks

page 126
PERT Chart EXPERT
Tools Menu
Chart Settings (Tools Menu)
See Properties
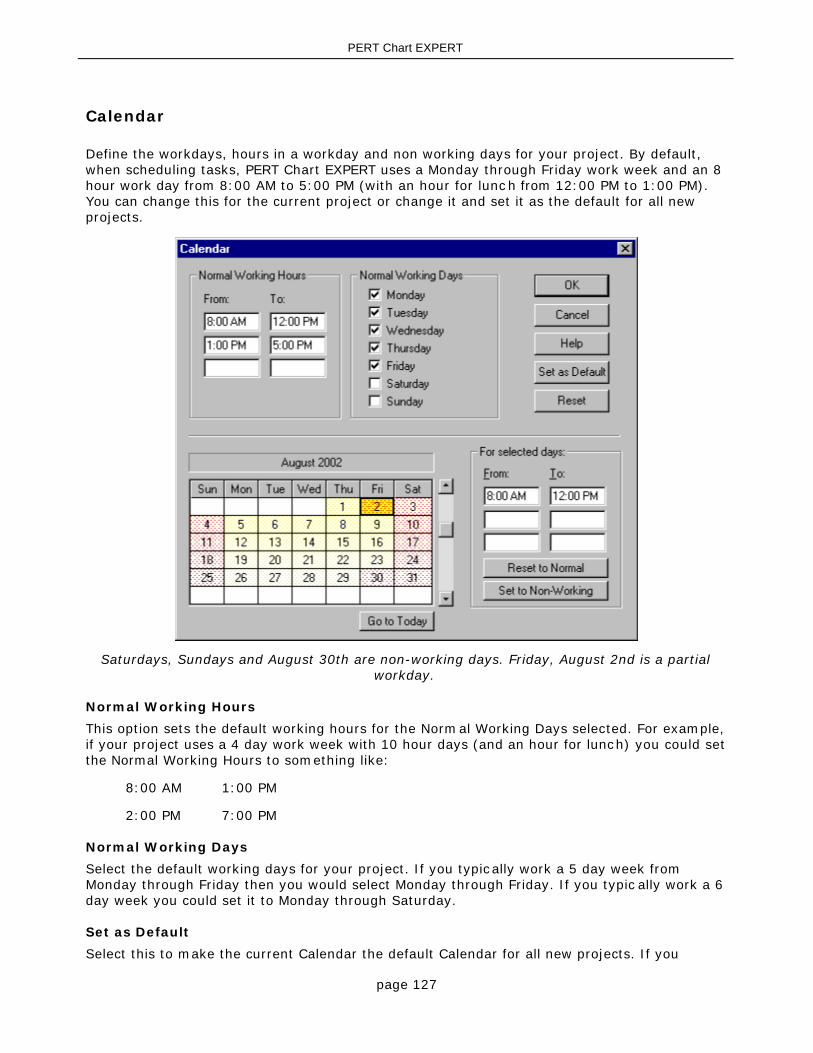
page 127
PERT Chart EXPERT
Calendar
Define the workdays, hours in a workday and non working days for your project. By default,when scheduling tasks, PERT Chart EXPERT uses a Monday through Friday work week and an 8hour work day from 8:00 AM to 5:00 PM (with an hour for lunc h from 12:00 PM to 1:00 PM).You can change this for the current project or change it and set it as the default for all newprojects.
Saturdays, Sundays and August 30th are non-working days. Friday, August 2nd is a partialworkday.
Normal Working Hours
This option sets the default working hours for the Normal Working Days selected. For example,if your project uses a 4 day work week with 10 hour days (and an hour for lunch) you could setthe Normal Working Hours to something like:
8:00 AM 1:00 PM
2:00 PM 7:00 PM
Normal Working Days
Select the default working days for your project. If you typically work a 5 day week fromMonday through Friday then you would select Monday through Friday. If you typic ally work a 6day week you could set it to Monday through Saturday.
Set as Default
Select this to make the current Calendar the default Calendar for all new projects. If you

page 128
PERT Chart EXPERT
customize a Calendar and select the Set as Default button, whenever you open a New projec tand begin planning, this customized Calendar is used. Using the Set as Default option does notaffect any existing Calendars in existing projects.
Reset
Select Reset to remove any custom settings to the current Calendar and set it to the defaultCalendar.
For selected days
Select a date (or dates) in the Calendar grid and use the options in the “For selected days”area to set the hours for these dates by entering From and To times, Reset these dates to thedefault or set them to be Non-Working days.
The Calendar File
When Set to Default is selected, a Calendar file is created and saved to the folder where youinstalled PERT Chart EXPERT. This file is called Calendar.ctc. This calendar is then used for allnew PERT charts you create. Any existing PERT charts will not be affected. If you have anexisting PERT chart that you want to use with this new Calendar, open that chart, selectTools-Calendar and choose Reset.
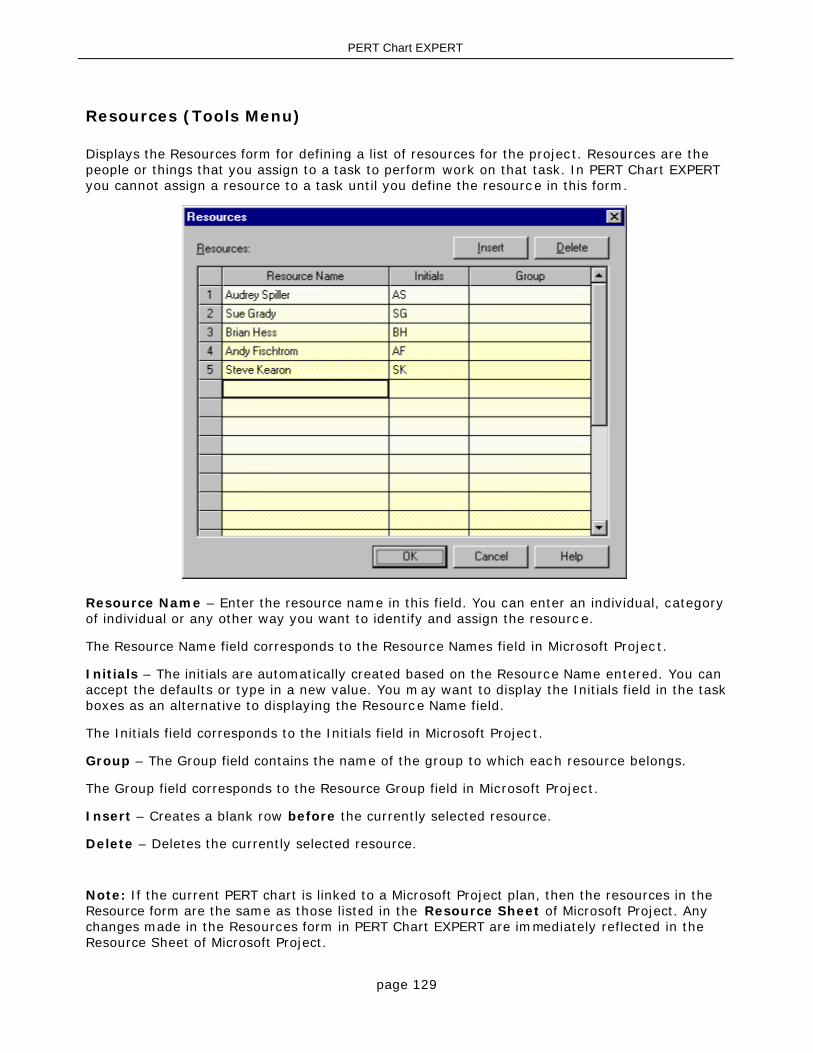
page 129
PERT Chart EXPERT
Resources (Tools Menu)
Displays the Resources form for defining a list of resources for the project. Resources are thepeople or things that you assign to a task to perform work on that task. In PERT Chart EXPERTyou cannot assign a resource to a task until you define the resource in this form.
Resource Name – Enter the resource name in this field. You can enter an individual, categoryof individual or any other way you want to identify and assign the resourc e.
The Resource Name field corresponds to the Resource Names field in Microsoft Projec t.
Initials – The initials are automatically created based on the Resource Name entered. You canaccept the defaults or type in a new value. You may want to display the Initials field in the taskboxes as an alternative to displaying the Resource Name field.
The Initials field corresponds to the Initials field in Microsoft Projec t.
Group – The Group field contains the name of the group to which each resource belongs.
The Group field corresponds to the Resource Group field in Microsoft Project.
Insert – Creates a blank row before the currently selected resource.
Delete – Deletes the currently selected resource.
Note: If the current PERT chart is linked to a Microsoft Project plan, then the resources in theResource form are the same as those listed in the Resource Sheet of Microsoft Project. Anychanges made in the Resources form in PERT Chart EXPERT are immediately reflected in theResource Sheet of Microsoft Project.

page 130
PERT Chart EXPERT
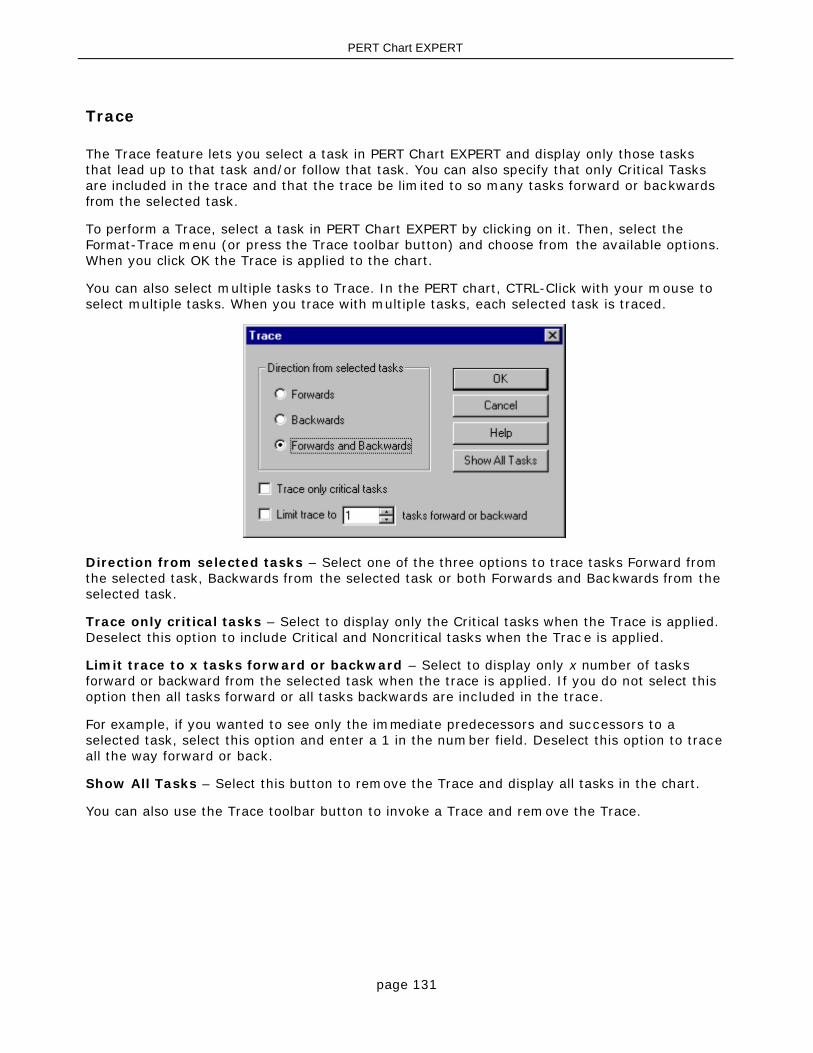
page 131
PERT Chart EXPERT
Trace
The Trace feature lets you select a task in PERT Chart EXPERT and display only those tasksthat lead up to that task and/or follow that task. You can also specify that only Critical Tasksare included in the trace and that the trace be limited to so many tasks forward or backwardsfrom the selected task.
To perform a Trace, select a task in PERT Chart EXPERT by clicking on it. Then, select theFormat-Trace menu (or press the Trace toolbar button) and choose from the available options.When you click OK the Trace is applied to the chart.
You can also select multiple tasks to Trace. In the PERT chart, CTRL-Click with your mouse toselect multiple tasks. When you trace with multiple tasks, each selected task is traced.
Direction from selected tasks – Select one of the three options to trace tasks Forward fromthe selected task, Backwards from the selected task or both Forwards and Backwards from theselected task.
Trace only critical tasks – Select to display only the Critical tasks when the Trace is applied.Deselect this option to include Critical and Noncritical tasks when the Trac e is applied.
Limit trace to x tasks forward or backward – Select to display only x number of tasksforward or backward from the selected task when the trace is applied. If you do not select thisoption then all tasks forward or all tasks backwards are included in the trace.
For example, if you wanted to see only the immediate predecessors and successors to aselected task, select this option and enter a 1 in the number field. Deselect this option to traceall the way forward or back.
Show All Tasks – Select this button to remove the Trace and display all tasks in the chart.
You can also use the Trace toolbar button to invoke a Trace and remove the Trace.

page 132
PERT Chart EXPERT
Renumber Tasks
Allows you to Renumber the Id’s in your PERT chart. Renumbering occurs in a chart from theearliest task to the latest task and top to bottom for those tasks occurring on the same date.This option is only available while working in a standalone chart (not linked to MS Projec t orother datasource).
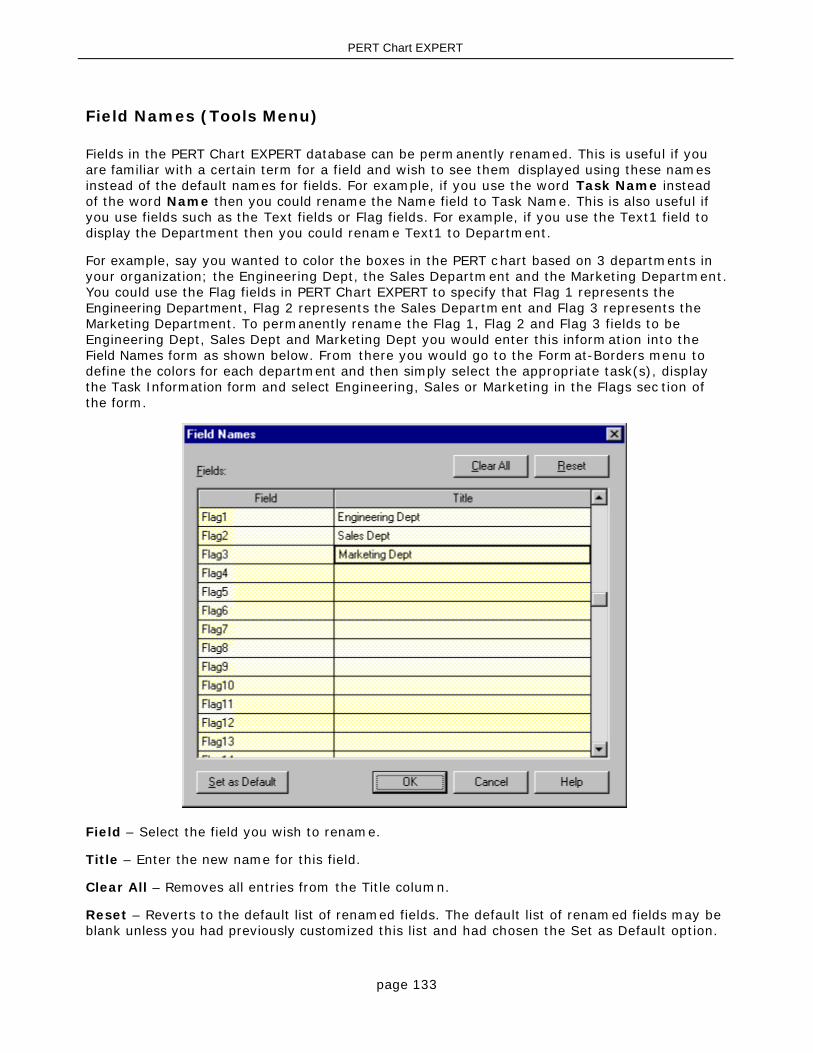
page 133
PERT Chart EXPERT
Field Names (Tools Menu)
Fields in the PERT Chart EXPERT database can be permanently renamed. This is useful if youare familiar with a certain term for a field and wish to see them displayed using these namesinstead of the default names for fields. For example, if you use the word Task Name insteadof the word Name then you could rename the Name field to Task Name. This is also useful ifyou use fields such as the Text fields or Flag fields. For example, if you use the Text1 field todisplay the Department then you could rename Text1 to Department.
For example, say you wanted to color the boxes in the PERT chart based on 3 departments inyour organization; the Engineering Dept, the Sales Department and the Marketing Department.You could use the Flag fields in PERT Chart EXPERT to specify that Flag 1 represents theEngineering Department, Flag 2 represents the Sales Department and Flag 3 represents theMarketing Department. To permanently rename the Flag 1, Flag 2 and Flag 3 fields to beEngineering Dept, Sales Dept and Marketing Dept you would enter this information into theField Names form as shown below. From there you would go to the Format-Borders menu todefine the colors for each department and then simply select the appropriate task(s), displaythe Task Information form and select Engineering, Sales or Marketing in the Flags sec tion ofthe form.
Field – Select the field you wish to rename.
Title – Enter the new name for this field.
Clear All – Removes all entries from the Title column.
Reset – Reverts to the default list of renamed fields. The default list of renamed fields may beblank unless you had previously customized this list and had chosen the Set as Default option.

page 134
PERT Chart EXPERT
Set as Default – Changes made to the Fields Name form are saved to the current PERT chart.Select the Set as Default option to make the current Field Names form the default for all newPERT charts.
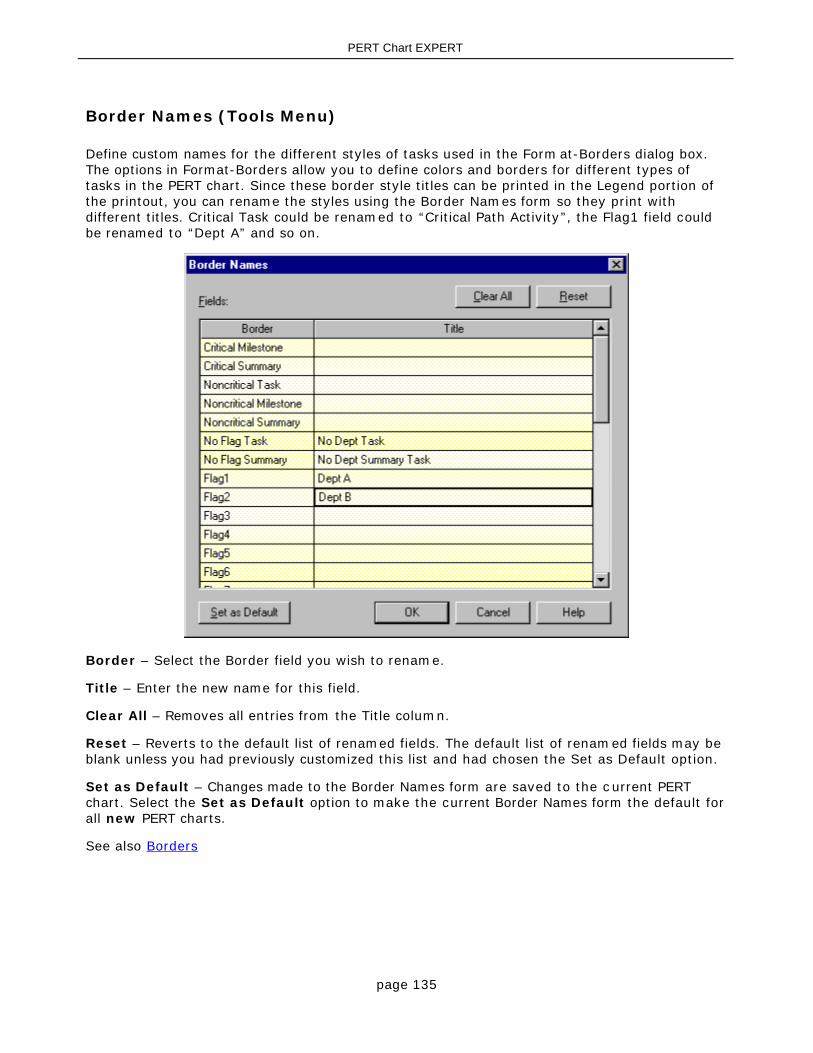
page 135
PERT Chart EXPERT
Border Names (Tools Menu)
Define custom names for the different styles of tasks used in the Form at-Borders dialog box.The options in Format-Borders allow you to define colors and borders for different types oftasks in the PERT chart. Since these border style titles can be printed in the Legend portion ofthe printout, you can rename the styles using the Border Names form so they print withdifferent titles. Critical Task could be renamed to “Critical Path Activity”, the Flag1 field couldbe renamed to “Dept A” and so on.
Border – Select the Border field you wish to rename.
Title – Enter the new name for this field.
Clear All – Removes all entries from the Title column.
Reset – Reverts to the default list of renamed fields. The default list of renamed fields may beblank unless you had previously customized this list and had chosen the Set as Default option.
Set as Default – Changes made to the Border Names form are saved to the c urrent PERTchart. Select the Set as Default option to make the current Border Names form the default forall new PERT charts.
See also Borders
page 136
PERT Chart EXPERT
Microsoft Project (Tools Menu)
This allows you to select various options if you use PERT Chart EXPERT with Microsoft Project.
Display PERT chart of Active Project – Generates a PERT chart of the currently activeproject in Microsoft Project. If you already have a PERT chart of the active project displayed inPERT Chart EXPERT then this option updates the existing PERT chart.
Goto Project – If this is a Standalone PERT chart, this option transfers the current PERT chartto Microsoft Project. If the PERT chart is linked to a Microsoft Project plan then the G oto Projectcommand simply returns to the existing Mic rosoft Project plan.
Transferring a Standalone PERT chart to Microsoft Project means that the data that exists inthe PERT chart will be removed from the PERT chart and placed into a Mic rosoft Project plan.The PERT chart then becomes linked to this Microsoft Project plan. You are prompted to savethe Microsoft Project plan and you must enter a filename for this Microsoft Project plan tocontinue transferring the PERT chart to Microsoft Project. You will then have two files. TheMicrosoft Project file, which contains the data (the task information like names, start dates,finish dates, costs, etc.), and the PERT chart file, which contains the form atting options thatare PERT chart-specific (such as custom colors, box placement, etc.).
You can also select the corresponding toolbar button:
Goto Project Toolbar button
Setup – See Microsoft Project Setup

page 137
PERT Chart EXPERT
Microsoft Project Setup (Tools-Microsoft Project Menu)
Select which version(s) of Microsoft Project you want to configure to work with PERT ChartEXPERT.
For more information on Microsoft Project Setup see Configuring Microsoft Project for use withPERT Chart EXPERT

page 138
PERT Chart EXPERT
Goto WBS Chart Pro (Tools Menu)
WBS Chart Pro is the other product from our company (Critical Tools) that allows you to planand display projects using a Top-Down type of chart. This c hart displays the Work Breakdown(WBS) of the phases and tasks in a project. You can seamlessly transfer projects from PERTChart EXPERT to WBS Chart Pro and vice versa.
To transfer the current PERT chart to WBS Chart Pro, select the Goto WBS Chart Pro m enuoption or press the Go to WBS Chart Pro toolbar button.
When you transfer a PERT chart to WBS Chart Pro your PERT chart is saved to the WBS ChartPro format (a .WBS file) and then immediately opened in WBS Chart Pro. You will no longerhave a PERT chart file, it will become a WBS chart file. To create a PERT c hart file again simplypress the Goto PERT Chart EXPERT button in WBS Chart Pro to transfer it back to PERT ChartEXPERT.
The Goto WBS Chart Pro button is not available (grayed out) if:
A) You do not have WBS Chart Pro.
B) You are working with a PERT chart that is linked to a Microsoft Project file. To create aWBS chart from a linked file, first go to Microsoft Project using the Goto Projec t toolbarbutton, then from within Microsoft Project use the Goto WBS Chart Pro toolbar button.Linked files require that you go to Microsoft Project first when switc hing between WBSChart Pro and PERT Chart EXPERT since all of your project data is stored within Mic rosoftProject.
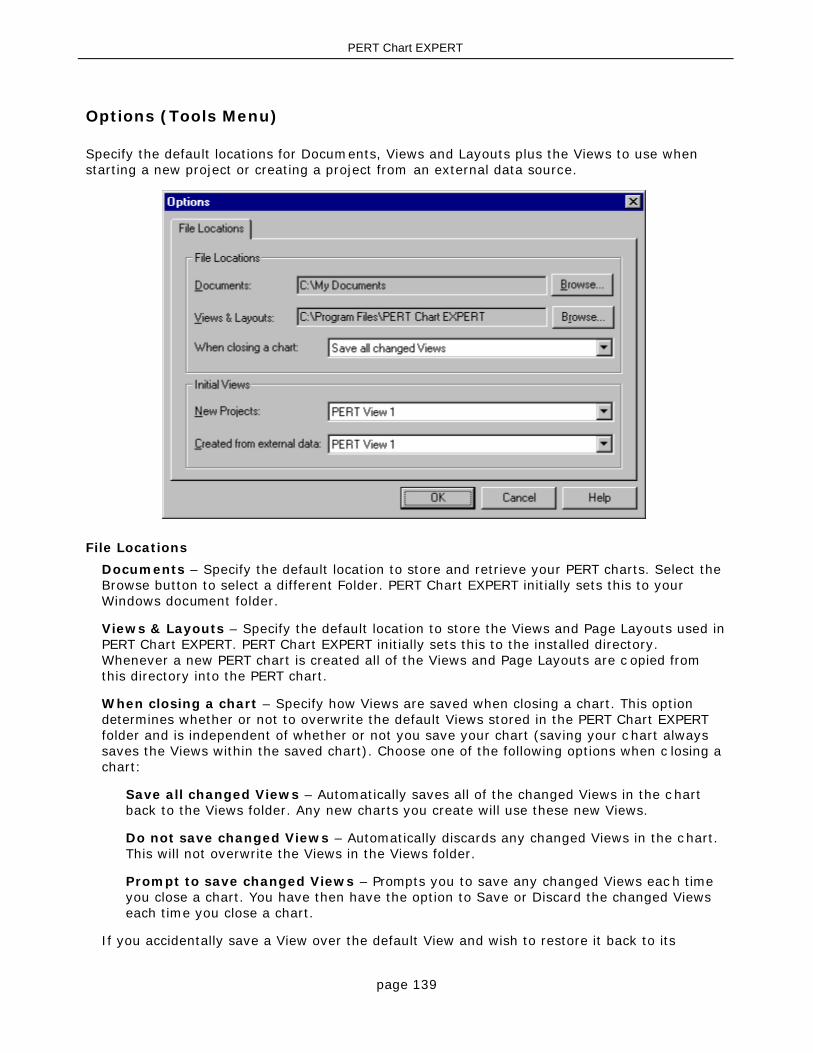
page 139
PERT Chart EXPERT
Options (Tools Menu)
Specify the default locations for Documents, Views and Layouts plus the Views to use whenstarting a new project or creating a project from an external data source.
File Locations
Documents – Specify the default location to store and retrieve your PERT charts. Select theBrowse button to select a different Folder. PERT Chart EXPERT initially sets this to yourWindows document folder.
Views & Layouts – Specify the default location to store the Views and Page Layouts used inPERT Chart EXPERT. PERT Chart EXPERT initially sets this to the installed directory.Whenever a new PERT chart is created all of the Views and Page Layouts are c opied fromthis directory into the PERT chart.
When closing a chart – Specify how Views are saved when closing a chart. This optiondetermines whether or not to overwrite the default Views stored in the PERT Chart EXPERTfolder and is independent of whether or not you save your chart (saving your c hart alwayssaves the Views within the saved chart). Choose one of the following options when c losing achart:
Save all changed Views – Automatically saves all of the changed Views in the chartback to the Views folder. Any new charts you create will use these new Views.
Do not save changed Views – Automatically discards any changed Views in the chart.This will not overwrite the Views in the Views folder.
Prompt to save changed Views – Prompts you to save any changed Views each timeyou close a chart. You have then have the option to Save or Discard the changed Viewseach time you close a chart.
If you accidentally save a View over the default View and wish to restore it back to its

page 140
PERT Chart EXPERT
original state you can copy the original View from the Backup Views folder. This folder isfound in the installed folder (for example: C:\Program Files\PERT Chart EXPERT\Bac kupViews).
Initial Views
New Projects – Specify the View to use when you create a new PERT chart. You may wantto have a different View that you use to create new PERT charts as opposed to when youcreate a PERT chart from an external datasource (like Microsoft Project).
Created from external data – Specify the View to use when you create a PERT chart froman external datasource. You may want to have a different View that you use to create newPERT charts as opposed to when you create a PERT chart from an external datasource (likeMicrosoft Project).

page 141
PERT Chart EXPERT
Window Menu
Cascade (Window Menu)
Arranges all of the open PERT charts on the screen in an overlapping fashion.

page 142
PERT Chart EXPERT
Tile (Window Menu)
Arranges all of the open PERT charts on the screen.

page 143
PERT Chart EXPERT
Arrange Icons (Window Menu)
If you have minimized several open PERT charts, this option lines the c hart icons up at thebottom of the screen.

page 144
PERT Chart EXPERT
List of Projects (Window Menu)
Displays a list of all open PERT chart files. The active PERT chart displays a c heckmark next tothe name of that chart.

page 145
PERT Chart EXPERT
Help Menu
Content and Index (Help Menu)
Displays the main Help program allowing you to search and locate Help topics.

page 146
PERT Chart EXPERT
Tip of the Day (Help Menu)
Displays a window when you start PERT Chart EXPERT offering a short tip on a particularfeature of the program.

page 147
PERT Chart EXPERT
About PERT Chart EXPERT
Displays the version number of the software and c ompany information. This section also allowsyou to register the product and turn the demo product into the full software.
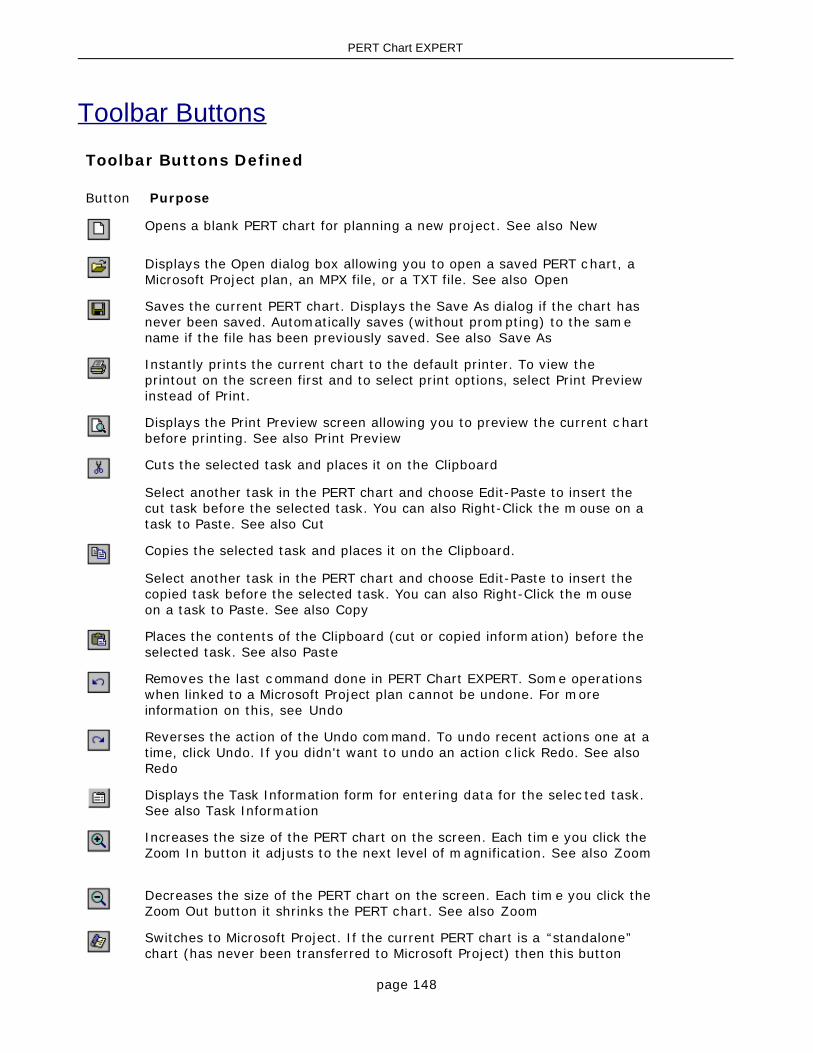
page 148
PERT Chart EXPERT
Toolbar Buttons
Toolbar Buttons Defined
Button Purpose
Opens a blank PERT chart for planning a new project. See also New
Displays the Open dialog box allowing you to open a saved PERT chart, aMicrosoft Project plan, an MPX file, or a TXT file. See also Open
Saves the current PERT chart. Displays the Save As dialog if the chart hasnever been saved. Automatically saves (without prompting) to the samename if the file has been previously saved. See also Save As
Instantly prints the current chart to the default printer. To view theprintout on the screen first and to select print options, select Print Previewinstead of Print.
Displays the Print Preview screen allowing you to preview the current c hartbefore printing. See also Print Preview
Cuts the selected task and places it on the Clipboard
Select another task in the PERT chart and choose Edit-Paste to insert thecut task before the selected task. You can also Right-Click the m ouse on atask to Paste. See also Cut
Copies the selected task and places it on the Clipboard.
Select another task in the PERT chart and choose Edit-Paste to insert thecopied task before the selected task. You can also Right-Click the mouseon a task to Paste. See also Copy
Places the contents of the Clipboard (cut or copied information) before theselected task. See also Paste
Removes the last command done in PERT Chart EXPERT. Some operationswhen linked to a Microsoft Project plan cannot be undone. For moreinformation on this, see Undo
Reverses the action of the Undo command. To undo recent actions one at atime, click Undo. If you didn't want to undo an action c lick Redo. See also Redo
Displays the Task Information form for entering data for the selec ted task.See also Task Information
Increases the size of the PERT chart on the screen. Each time you click theZoom In button it adjusts to the next level of magnification. See also Zoom
Decreases the size of the PERT chart on the screen. Each time you click theZoom Out button it shrinks the PERT chart. See also Zoom
Switches to Microsoft Project. If the current PERT chart is a “standalone”chart (has never been transferred to Microsoft Project) then this button
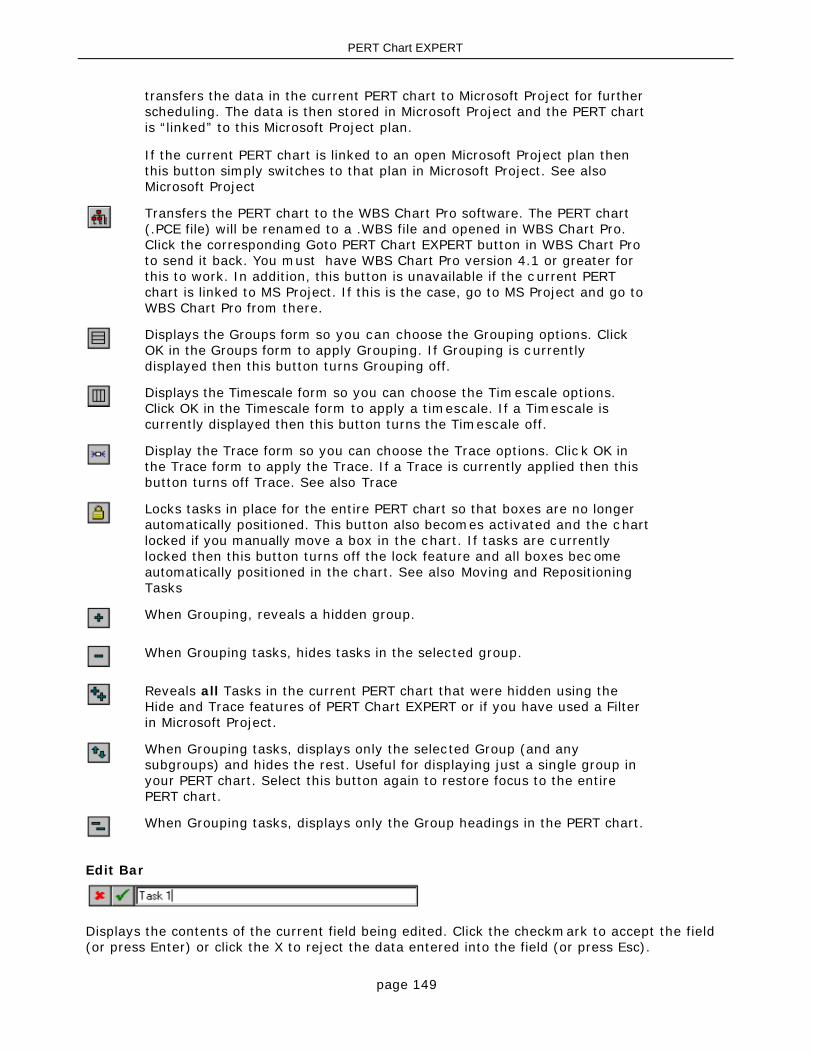
page 149
PERT Chart EXPERT
transfers the data in the current PERT chart to Microsoft Project for furtherscheduling. The data is then stored in Microsoft Project and the PERT chartis “linked” to this Microsoft Project plan.
If the current PERT chart is linked to an open Microsoft Project plan thenthis button simply switches to that plan in Microsoft Project. See also Microsoft Project
Transfers the PERT chart to the WBS Chart Pro software. The PERT chart(.PCE file) will be renamed to a .WBS file and opened in WBS Chart Pro.Click the corresponding Goto PERT Chart EXPERT button in WBS Chart Proto send it back. You must have WBS Chart Pro version 4.1 or greater forthis to work. In addition, this button is unavailable if the c urrent PERTchart is linked to MS Project. If this is the case, go to MS Project and go toWBS Chart Pro from there.
Displays the Groups form so you can choose the Grouping options. ClickOK in the Groups form to apply Grouping. If Grouping is currentlydisplayed then this button turns Grouping off.
Displays the Timescale form so you can choose the Timescale options.Click OK in the Timescale form to apply a timescale. If a Timescale iscurrently displayed then this button turns the Timescale off.
Display the Trace form so you can choose the Trace options. Clic k OK inthe Trace form to apply the Trace. If a Trace is currently applied then thisbutton turns off Trace. See also Trace
Locks tasks in place for the entire PERT chart so that boxes are no longerautomatically positioned. This button also becomes activated and the c hartlocked if you manually move a box in the chart. If tasks are currentlylocked then this button turns off the lock feature and all boxes bec omeautomatically positioned in the chart. See also Moving and RepositioningTasks
When Grouping, reveals a hidden group.
When Grouping tasks, hides tasks in the selected group.
Reveals all Tasks in the current PERT chart that were hidden using theHide and Trace features of PERT Chart EXPERT or if you have used a Filterin Microsoft Project.
When Grouping tasks, displays only the selected Group (and anysubgroups) and hides the rest. Useful for displaying just a single group inyour PERT chart. Select this button again to restore focus to the entirePERT chart.
When Grouping tasks, displays only the Group headings in the PERT chart.
Edit Bar
Displays the contents of the current field being edited. Click the checkmark to accept the field(or press Enter) or click the X to reject the data entered into the field (or press Esc).

page 150
PERT Chart EXPERT
View Bar
Displays the current View that is applied to the PERT chart. Click the Left or Right arrow totoggle through the list and display different Views. Click the … button to display the list ofViews to Create, Delete, Rename, Copy, Import and Export Views. See also Views
Status Bar
The Status Bar is the strip of information located at the bottom of the PERT Chart EXPERTscreen. The left part of the Status Bar displays messages about current operations, shortdescriptions of the Toolbar buttons as your cursor is placed over the buttons, and shortdescriptions of the menu items as they are highlighted.
The right side of the Status Bar contains six small box areas that describe the current state ofa chart. They are, from left to right:
1. The total number of tasks in the current chart plus the number of hidden tasks.
2. The current Zoom factor (scale) of the current chart.
3. The Linked status of the PERT chart. If the current PERT chart is linked to a datasource(such as a Microsoft Project plan), the word LINKED is displayed.
4. Displays CAP if Cap Lock is on.
5. Displays NUM if Num Lock is on.
6. Displays SCRL if Scroll Lock is on.
page 151
PERT Chart EXPERT
Frequently Asked Questions
Frequently Asked Questions
After using PERT Chart EXPERT I noticed several .TMP and .TXT files listed inMicrosoft Project’s File menu. What are these and can I stop them from appearing?
When PERT Chart EXPERT tells Microsoft Project to transfer data to create a PERT chart ituses various .TMP and .TXT files for this process. As PERT Chart EXPERT opens and c losesthese temporary files they appear in Microsoft Project’s File menu. Unfortunately, there is noway to prevent these files from appearing. We realize that they are ugly but they won ’tcause any harm and we do as much as we can minimize the number of files that have toappear.
In Print Preview, can I show more then two pages on the screen at once?
No, in Print Preview you can only show a single page or two pages of the printout at onc e.However, if you close Print Preview and choose View-Page Layout (Page Layout mode) thisdisplays how the PERT chart appears on each page for the selected printer and selectedpaper size. In Page Layout mode, you can see all page breaks on the sc reen and even movetasks around to better position them to avoid page breaks. You can also tell PERT ChartEXPERT to automatically avoid page breaks by selecting the “Adjust for Page Breaks”option in File-Page Setup.
What happens if I rename a Microsoft Project plan that is linked to a PERT chart?
A saved PERT chart linked to a specific Microsoft Project plan remembers the exact nameand location of the Microsoft Project plan. If you rename or move the Microsoft Project thanthe PERT chart can no longer link to this plan. To relink a saved PERT chart to itscorresponding Microsoft Project plan:
1. If you rename the Microsoft Project plan while the PERT is c urrently open you will receivea message when the PERT chart is activated that the chart needs to be resynchronized.Simply select the third option to relink to a renamed Microsoft Project plan.
2. If you rename the Microsoft Project plan while the PERT chart is closed, open PERT ChartEXPERT and select File-Open. Select the PERT chart file and choose “link to anotherdatasource”. Choose Open and select the corresponding Microsoft Project plan.
Can I display Critical Tasks across the top of my chart?
Yes, go to the Format Menu, select Chart and choose “Top Down - Critical First” from the BoxArrangement list. The default placement of tasks (“Top Down From Left) is by Successor andId order. This means that if a task has two successors it will place them to the right of thepredecessor task placing the lowest Id task first. The “Top Down - Critical First” optiondisplays critical successors first thus displaying the critical tasks at the top of the chart whenpossible.
page 152
PERT Chart EXPERT
PDF Files – What are they and how can I use them in PERT Chart EXPERT?
A .PDF file is a document (chart) that anyone can read on their c omputer using a PDF “reader”. Think of a PDF file as a chart that was printed to a file rather then on paper using aprinter. A PDF file can be viewed by opening it in a PDF reader. Multiple page c harts appearacross multiple pages in the document and you scroll from page to page in the PDF reader.
You can create a PDF file and send (email) this file to anyone who has a PDF reader. Tocreate a PDF file you would need to purchase Adobe Acrobat. The steps to creating a PDF fileare the same as printing a chart. Once Adobe Acrobat is installed, you configure the chart,preview it (if you want) but instead of printing directly to a printer you print to a PDF file byselecting the PDF writer as your printer. This produces a file that can be opened using thePDF reader.
The PDF writer (Adobe Acrobat) is not included as part of Microsoft Project nor is it inc ludedwith Microsoft Windows like other printer drivers. You must purchase it from Adobe.
The PDF reader is free software that anyone can install to read .PDF files. For m oreinformation about this process and to download the Ac robat Reader from Adobe, see theirwebsite at: www.adobe.com.
How can I stop it from displaying NA in my date fields?
Select the Tools-Chart Settings menu, select the Settings tab and enter a blank spaceinto the “Show unknown dates as” field. Any character displayed in a date field in PERTChart EXPERT that is not a valid date is an “Unknown Date” and can be converted intoanother word or removed by putting a space into the “Show unknown dates as” field. Forexample, Microsoft Project displays an NA for any task that does not have an Actual Start orActual Finish. If you wish to display these fields in PERT Chart EXPERT and rem ove this NA,use this procedure.
When using the Save as Web Pages option, why does it produce so many pages ofoutput?
The Save as Web Pages feature uses a Template that, by default, limits the HTML output tobe no bigger then a single Browser page based on a sc reen resolution of 1024x768. If yourPERT chart is bigger then one page then it will produce multiple, one page HTML documentsthat you can toggle through using the buttons at the bottom of each HTML page. This wayyou can view one page at a time in your Browser rather then having to scroll the Browser toview the entire chart.
If you want to increase or decrease the size of each output page you can edit thePERTTemplate.html file and increase/decrease the numbers in the line that reads:
PERTChart:chart width="975" height="490"
If you want the Save as Web Pages feature to produce one big PERT chart in the HTMLdocument, select the PERTTemplate2.html file in the Save as Web Pages dialog box. Thistemplate does not specify the Width and Height of a chart but produces one PERT chartimage in the HTML document.
I am using the Demo version of PERT Chart EXPERT and I cannot print even though it
page 153
PERT Chart EXPERT
says I should be able to print using the Demo. Why can’t I print?
You can print using the Demo version of PERT Chart EXPERT as long as there are not m orethen 50 tasks in the PERT chart. Certain features of the Demo program like creating tasks,printing and saving are disabled when there are more then 50 tasks. Even though you c ancreate a PERT chart from a Microsoft Project plan with more then 50 tasks you cannot print itonce it gets past 50 tasks.
Note that even though you can’t print more then 50 tasks you can still use Print Preview tosee how the PERT chart would be printed. For a c omplete explanation of the Demo program,see Demo Limits

page 154
PERT Chart EXPERT
Error Messages and Prompts
Microsoft Project Messages
These are messages that you might see when working with PERT Chart EXPERT and MicrosoftProject.
This PERT chart is currently self-contained
This message appears when you press the Goto Project button or when you c hoose GotoProject from the Tools-Microsoft Project menu. This means you are attempting to send aPERT chart to Microsoft Project. If this is a standalone PERT chart this involves transferringthe data to this Microsoft Project plan. For a complete explanation, see Transferring a PERTchart to Microsoft Project
Unable to Start Microsoft Project
This message appears when the PERT Chart EXPERT program cannot start Mic rosoft Projector cannot communicate with Microsoft Project. PERT Chart EXPERT uses DDE and OLE tocommunicate with Microsoft Project and if for some reason this communication is notworking, this message will appear
First, try closing all open applications and turn your computer completely off and then backon again. This may reinitialize the necessary files needed to communicate with MicrosoftProject.
If this does not work, try reinstalling Microsoft Project. Microsoft Projec t should install all ofthe necessary files for this communication to take place so reinstalling Microsoft Project mayhelp solve this problem if these files were deleted or overwritten.
If, after reinstalling Microsoft Project it still fails, try contacting Critical Tools tec hnicalsupport. See Support
Cannot save - file already open in Microsoft Project
This message appears when you attempt to save to a Microsoft Project plan that is currentlyopen in Microsoft Project. When you transfer a PERT chart to Microsoft Project the plan m ustbe saved in Microsoft Project for the PERT chart to be linked to the Microsoft Project plan.Part of the process of transferring the PERT chart to Microsoft Project is to save that file inMicrosoft Project. It cannot save to a Microsoft Project plan that is open so you m ust eithersave to a different Microsoft Project filename or close the open file in Microsoft Project andtry again.
Microsoft Project has not been configured for a seamless integration
This message appears when you attempt to transfer PERT chart information to MicrosoftProject and Microsoft Project has not been configured for use with PERT Chart EXPERT. Inorder to interact seamlessly with Microsoft Project, it is necessary to copy some Tables,Views, a Macro and Toolbar button to Microsoft Project. These are then stored in MicrosoftProject (if you have access to change Microsoft Project) for future interaction with PERTChart EXPERT. For more information on configuring Microsoft Project see Configuring MSProject for use with PERT Chart EXPERT
Resynchronize PERT chart
This message appears when you access a PERT chart that was linked to a Microsoft Project

page 155
PERT Chart EXPERT
and the Microsoft Project is no longer available. If you have just closed the Microsoft Projectplan and are in the process of closing the PERT chart, then choose the Close PERT chartoption. If you need to make additional changes to the PERT chart then it must reopen theMicrosoft Project plan and you must choose the Re-activate option to do this. If you haverenamed the Microsoft Project plan then the current PERT chart can no longer find the plan itwas linked to and you must choose the third option to relink to this newly nam ed MicrosoftProject plan.
The Active project has not been saved so the PERT chart won’t be linked
This message appears when you attempt to create a PERT chart from a Microsoft Projectplan that has not been saved. To create a PERT chart from a Microsoft Project you shouldfirst save the Microsoft Project plan and then create a PERT chart from the Microsoft Projectplan.
Wrong Version of Microsoft Project Responding
This message can appear when you have two different versions of Microsoft Project on thesame computer and you attempt to send a PERT chart to a specific version of MicrosoftProject. PERT Chart EXPERT is trying to communicate with a specific version of MicrosoftProject and another is incorrectly responding. For example, if you had Project 98 and Projec t2000 on the same computer and you attempted to send a PERT chart to Microsoft Projec t 98,Project 2000 would probably respond and you would receive this error. To resolve this issue,try opening the specific version of Microsoft Project that you are attem pting to use (andclose other versions of Project). If the version of Microsoft Project is already open when PERTChart EXPERT attempts to communicate with it then there is less chance for amiscommunication.
page 156
PERT Chart EXPERT
Unable to Open Linked Data File
There are two variations of this message, each is explained below.
Unable to Open Linked Data File – This data file is already in use by another chart.
This message appears when you attempt to open a PERT chart that is linked to a datasourc eand this datasource is already in use by another PERT chart.
For example, you cannot open a PERT chart that is linked to Microsoft Project plan xxx.mppif another PERT chart is currently open and is linked to Microsoft Projec t xxx.mpp. Close thefirst PERT chart if you wish to open the second PERT chart linked to xxx.mpp.
Unable to Open Linked Data File – The data file could not be found.
This message appears when you attempt to open a PERT chart that is linked to a datasourc eand it can’t find the datasource. It could be that you deleted the datasource file, m oved it orrenamed it. If you moved or renamed the datasource, you can relink the PERT c hart to theappropriate file. Choose Yes to browse for the datasource file or No to cancel the Openoperation.
page 157
PERT Chart EXPERT
Invalid Data
You have entered data into a field that is not valid for that field. Below are the m ost commonof these messages and a short explanation of each.
Invalid Currency – Enter a valid currency amount. You don’t have to include the currencysymbol but you must enter an amount that can be converted into a currenc y value.
Invalid Date – Enter a valid date.
Invalid Dependency – Enter a valid dependency.
Invalid Duration – Enter a valid Duration. You must use a valid duration unit such as Minute,Hour, Day, Week or Month or the abbreviations M, H, D, W or MO. For example, type 5d for 5days, or 2w for 2 weeks.
Invalid File – Enter a valid filename avoiding characters like *, ? or /.
Invalid Flag – Enter a valid Flag value. Flag fields can only accept Yes or No. There areseveral other Yes/No fields that work this way and you may get the Invalid Flag message eventhough they are not Flag fields. If you receive this message and the field you are editing is nota Flag field it means that it is simply a Yes/No field and you can only enter Yes or No into thatfield.
Invalid Folder – Enter a valid folder.
Invalid Measurement – Enter a valid measurement.
Invalid Number – Enter a valid number. You cannot enter text into a field that only acceptsnumbers.
Invalid Percent – Enter a valid Percent such as .50 or 50%.
Invalid Resource – Enter a valid resource from the list of Resources (as defined inTools-Resources). When assigning resources in the Task Information form, you must enter theexact name of an existing resource or you will receive the “Invalid Resource” message. Tryusing the Resources button to assign resource instead of typing them. To add, delete orchange the names of resources, use the Resources form in the Tools menu.
Invalid Time – Enter a valid time, including AM or PM if you are using the 12 hour format.

page 158
PERT Chart EXPERT
Cannot Merge
This message is displayed when you are attempting to open a View (*.PCV file) or a PageLayout (*.PCP) when there is no PERT chart open to merge the View or Page Layout into.
If you have a PERT chart currently displayed and you open a View (*.PCV) or Page Layout(*.PCP) then this file will be merged (imported) into the open PERT c hart. To merge a View orPage Layout into the open PERT chart, choose the File-Open menu and choose “Files of Type”Views or Page Layouts. This is another way to Import a View or Page Layout into a PERT chart.However, you must have an existing PERT chart open in order to import a View or PageLayout.

page 159
PERT Chart EXPERT
No Calendar Available
This message appears when you choose Calendar from the Tools menu in PERT Chart EXPERTand you are currently linked to a Microsoft Project plan. For technical reasons PERT ChartEXPERT cannot update a calendar in Microsoft Project while a chart is linked. To m odify thecalendar, return to Microsoft Project and select Tools-Change Working Time.

page 160
PERT Chart EXPERT
Opening Old PERT charts
You cannot use PERT Chart EXPERT version 2 to directly open a PERT chart file created inPERT Chart EXPERT version 1.x. To transfer a version 1.x PERT chart to PERT Chart EXPERTversion 2, do the following:
1. Open the PERT chart in PERT Chart EXPERT version 1.x.
2. Save it as an MPX file.
3. Start PERT Chart EXPERT version 2 and open this MPX file.
Templates created in PERT Chart EXPERT version 1.x are not transferable to PERT ChartEXPERT 2. You must recreate all templates (now called Views) in PERT Chart EXPERT version2.0.
page 161
PERT Chart EXPERT
HTML Template
This message appears when you are in the Save As Web Pages dialog box and no tem plate islisted in the HTML Template File field or if the template listed could not be found. If notemplate is listed, use the Browse button to locate a template. If a template is listed and it wasmoved to a different folder, renamed or deleted, use the Browse button to locate anothertemplate.
See also Save As Web Pages

page 162
PERT Chart EXPERT
Confirm Unlink
This message allows you to confirm that you want to remove the link to the datasource. For acomplete description of this topic, see Unlink
page 163
PERT Chart EXPERT
Unable to Save Image
This message appears when you are attempting to save the PERT chart as a picture and PERTChart EXPERT cannot save this image. This may be due to a lack of available memory. Savingimages requires a large amount of memory for a temporary bitmap image to be saved beforethe specified image file is saved. Therefore, even if the ultimate PNG, JPEG or TIFF file isrelatively small, it may require a bigger temporary file then the available memory allows.
Try reducing the size of the PERT chart or in the Save Picture dialog box, try selec ting aGrayscale or Black & White image.

page 164
PERT Chart EXPERT
Overwriting HTML Files
This message appears when you use the Save As Web Pages dialog box to save a set of HTMLdocuments to the same name in the same folder. Saying Yes to update the HTML files willdelete all files with the same name from the specified folder and create new HTML files of thelatest PERT chart. Select No to save the Web Pages to a new nam e or to a new folder.
See also Save As Web Pages

page 165
PERT Chart EXPERT
Demo Limits Exceeded
You are currently using the Demonstration version of PERT Chart EXPERT and you haveexceeded the limits of this Demo version.
The Demo version of PERT Chart EXPERT is limited to 50 tasks and expires 30 days afterinstallation. The 50 task limit applies to Creating/Modifying tasks, Printing, Saving andTransferring PERT charts to Microsoft Project. The 50 task limit does not apply when youcreate a PERT chart from a Microsoft Project plan. Therefore, you can use the Demo version totest how your large Microsoft Project plans are displayed and you can even use Print Preview tosee how they would be printed.
Remember: You can use the Demo version just like the Full version for projec ts up to 50 tasks.This means you can Create, Print, Save and Transfer PERT charts to Microsoft Project. If youcreate a PERT chart that exceeds 50 tasks than Creating/Modifying Tasks, Printing, Saving andTransferring PERT charts to MS Project are disabled.
The Demo version of PERT Chart EXPERT can be turned into the Full version of PERT ChartEXPERT at any time, including while you are currently running the Demo version.
To turn the Demo version of PERT Chart EXPERT into a Full version:
1. Within PERT Chart EXPERT, choose Help-About PERT Chart EXPERT.
2. Choose Register and fill out the User Name, Organization and Product ID fields.
You must have a valid Product ID to turn the Demo into the Full version. To purchase PERTChart EXPERT and obtain a Product ID, contact Critical Tools at: Company Address

page 166
PERT Chart EXPERT
Program Registration
In order to use the full PERT Chart EXPERT product you must enter a valid Project ID. Thisnumber is either displayed on the inside front cover of the PERT Chart EXPERT doc umentation,on the CD envelope or was emailed to you. The format of the Product ID is this:
123-12345-1234-123456
Note: You must include the dashes between the numbers.
If you do not have a Product ID you can only use the PERT Chart EXPERT as a Demonstrationversion. The Demo version of PERT Chart EXPERT is limited to 50 tasks and expires 30 daysafter installation. The 50 task limit applies to Creating/Modifying Tasks, Printing, Saving andTransferring PERT charts to Microsoft Project. The 50 task limit does not apply when youcreate a PERT chart from a Microsoft Project plan. Therefore, you can use the Demo version totest how your large Microsoft Project plans are displayed and you can even use Print Preview tosee how they would be printed.
The Demo version of PERT Chart EXPERT can be turned into the Full version of PERT ChartEXPERT at any time, including while you are currently running the Demo version.
To turn the Demo version of PERT Chart EXPERT into a Full version:
1. Within PERT Chart EXPERT, choose Help-About PERT Chart EXPERT.
2. Choose Register and fill out the User Name, Organization and Product ID fields.
To purchase PERT Chart EXPERT and obtain a valid Product ID, contact Critical Tools at: Company Address
page 167
PERT Chart EXPERT
Displays a blank PERT chart from MS Project plans
No PERT chart (all tasks "Hidden" per the message at the bottom of the screen)
If you attempt to create a PERT chart from a MS Project plan and PERT Chart EXPERT displaysa blank screen, this is due to using Project 2003 SP2 or SP3. Microsoft decided to add a featurewith these Service Packs that must be turned off. Reinstalling PERT Chart EXPERT should fixthis (reboot first and do not start any other Office applications before reinstalling PERT ChartEXPERT).
If reinstalling does not work, try the following:
For Project 2003 SP3:
1. Open Project 2003 SP3.2. Go to Tools-Options-Security. 3. Click the bottom option to "Allow loading files with Legacy or non default file formats".
For Project 2003 SP2 (only if reinstalling does not fix it):
1. Close Project 2003.2. Choose Start and select Run...3. Type Regedit and click OK. 4. Doubleclick HKEY_CURRENT_USER and then
Software\Microsoft\Office\11.0\MS Project\Security5. Doubleclick the LegacyFiles item on the right and set the number to 2. If you do not
see a LegacyFiles option on the right (if it only has Default and Level) then you needto add this entry. To do this select Edit-New-DWORD Value. Type LegacyFiles asthe new name for this option and doubleclick it to open the form. Enter a 2 in theValue Data field and click OK.
6. Exit the Registry.
page 168
PERT Chart EXPERT
Contacting Critical Tools, Inc.
Company Address
Critical Tools, Inc. makes and distributes the Windows-based project management software, WBS Chart Pro and PERT Chart EXPERT.
Contact: Critical Tools, Inc. 7308 West Rim DriveAustin, Texas 78731USA
Phone: 512-342-2232
Fax: 512-342-2234
Website: www.criticaltools.com
Our website contains a detailed description of our products plus downloadable demo versions,online ordering and the latest product announcements.
Sales Email: [email protected]
SupportEmail:
Critical Tools, Inc. is a Microsoft Certified Partner. In addition, Critic al Tools has fulfilled allrequirements and is active in the ISV/Software Solutions Competency of the Mic rosoft CertifiedPartner program. As part of this process, Critical Tools' software was independently tested andcertified. Testing was conducted independently by VeriTest, a testing service of LionbridgeTechnologies.

page 169
PERT Chart EXPERT
Support
Critical Tools, Inc. offers free support for the current version of the PERT Chart EXPERTsoftware. You can obtain support in the following ways:
Phone Support: 512-342-2232
Support Hours: 8:00am – 5:00pm US Central Time (Monday – Friday)
Email Support: [email protected]
The majority of the time we can respond to your email inquiries the same day. Less frequentlyit will take us up to 24 hours. If you do not hear from us in 24 hours, we suggest you emailagain or call us at the number above.
page 170
PERT Chart EXPERT
Index
- C -Cascade 141Company Address 168
- S -Show Subtasks 98
- H -Hide Subtasks 99
- F -Focus 101
- P -Progress Marks 103
- Z -Zoom 105
- F -Fields
- B -Borders 111
- L -Lines 115
page 171
PERT Chart EXPERT
- R -Resources 129
- F -Field Names 133
- T -Toolbar 95
- O -Options 139
- G -Goto 90
- T -Tile 142
- A -Arrange Icons 143
- L -List of Projects 144
- A -About PERT Chart EXPERT 147
- F -Frequently Asked Questions 151
- P -PDF Files 151
page 172
PERT Chart EXPERT
- C -Configuring a Network Version of MS Project 13Creating a PERT chart from your MS Project plans 45
- M -Moving Tasks 29
- D -Displaying Fields in Task Boxes 31
- S -Saving PERT charts 41
- W -What is PERT Chart EXPERT? 5
- M -Microsoft Project 136
- P -Page Layouts 59, 61
- W -What is a PERT chart? 6
- S -System Requirements 7
- I -Installing on a Local PC 8Installing on a Network 9

page 173
PERT Chart EXPERT
- A -Adding New Tasks 19
- C -Configuring Microsoft Project 10
- N -New 49
- O -Open 50
- C -Close 52
- S -Save 53Save As 54
- V -Views 96
- S -Save As Web Pages 57Support 169
- P -Page Setup 64Print 67Print Preview 69Properties 71
- M -Most Recently Used Files (1 2 3 4) 74

page 174
PERT Chart EXPERT
- E -Exit 75
- U -Undo 76
- C -Cut 78Copy 79
- P -Paste Before 80
- I -Insert Before 81
- D -Delete 82
- S -Save As Picture 56
- G -Grouping 32
- P -Printing 39
- C -Confirm Unlink 162Cannot Merge 158
page 175
PERT Chart EXPERT
- U -Unable to Save Image 163
- O -Overwriting HTML Files 164
- U -Unable to Open Linked Data File 156
- F -Find 88Find Next 89
- B -Border Names 135
- D -Demo Limits Exceeded 165
- P -Product Registration 166
- O -Opening Old PERT charts 160
- C -Calendar 127
- M -Microsoft Project Messages 154
- T -
page 176
PERT Chart EXPERT
Timescale 35, 119Trace 131
- D -Dependencies 21
- G -Group 121
- L -Lock Box Positions 124Layout Selected 125
- T -Tracing Tasks 37
- C -Critical Path 28
- T -Transferring a PERT chart to WBS Chart Pro 44
- G -Goto WBS Chart Pro 138
- N -No Calendar Available 159
- H -Hyperlink Symbols 104
- S -Scheduling & Critical Path 23
page 177
PERT Chart EXPERT
- T -Task Information 83
- O -Overview of Creating a PERT chart 18
- T -Toolbar Buttons 148
- Z -Zoom In Toolbar Button 148Zoom Out Toolbar Button 148
- T -Tips when using PERT Chart EXPERT with MS Project 47
- S -Show All Subtasks 100
- C -Chart 114
- F -Fields in PERT Chart EXPERT 38
- C -Custom Box Settings 117
- D -Displays a blank PERT chart from MS Project plans 167
- P -
page 178
PERT Chart EXPERT
Project Settings 126
- H -HTML Template 161Hyperlinks 83
- R -Renumber Tasks 132
- S -Select 91
- M -Microsoft Project Setup 137
- S -Show Only Summary Tasks 102
- U -Unlink 70
- N -Normal 92
- P -Page Layout 93
- O -Online Layout 94
- C -Content and Index 145

page 179
PERT Chart EXPERT
- T -Tip of the Day 146Transferring a PERT chart to Microsoft Project 43Terminology and Basic Concepts 15
- I -Invalid Data 157
- R -Redo 77

© Critical Tools, Inc. 2010w w w .criticaltools.com