Permanent Link: Research Collection Rights / License ...48462/... · Nicolas Bircher Submitted in...
56
Research Collection Master Thesis Silvicultural Measures for the Conservation of the Capercaillie in the Special Forest Reserve of Amden - A first assessment of effectiveness a first assessment of effectiveness Author(s): Bircher, Nicolas Publication Date: 2011 Permanent Link: https://doi.org/10.3929/ethz-a-006525916 Rights / License: In Copyright - Non-Commercial Use Permitted This page was generated automatically upon download from the ETH Zurich Research Collection . For more information please consult the Terms of use . ETH Library
-
Upload
hoangnguyet -
Category
Documents
-
view
216 -
download
2
Transcript of Permanent Link: Research Collection Rights / License ...48462/... · Nicolas Bircher Submitted in...

Research Collection
Master Thesis
Silvicultural Measures for the Conservation of the Capercailliein the Special Forest Reserve of Amden - A first assessment ofeffectivenessa first assessment of effectiveness
Author(s): Bircher, Nicolas
Publication Date: 2011
Permanent Link: https://doi.org/10.3929/ethz-a-006525916
Rights / License: In Copyright - Non-Commercial Use Permitted
This page was generated automatically upon download from the ETH Zurich Research Collection. For moreinformation please consult the Terms of use.
ETH Library

Silvicultural Measures for the Conservation of the
Capercaillie in the Special Forest Reserve of Amden
A first assessment of effectiveness
Master Thesis
Nicolas Bircher
Submitted in January 2011
Department of Environmental Sciences, ETH Zurich
Conducted at the Swiss Federal Research Institute WSL
Advisor: Prof. Dr. Harald Bugmann, Forest Ecology, Institute of Terrestrial
Ecosystems, ETH Zurich
Co-Advisor: Dr. Kurt Bollmann, Conservation Biology, Swiss Federal Research
Institute WSL

Cover picture: Capercaillie cock Tetrao urogallus
(source: http://www.surfbirds.com/blog/bbc/9836/Updates.html; date accessed: January 14th 2011)

Silvicultural Measures for the Conservation of the
Capercaillie in the Special Forest Reserve of Amden
A first assessment of effectiveness
Master student:
Nicolas Bircher
Luegislandstrasse 23
CH-8051 Zürich
Advisor:
Prof. Dr. Harald Bugmann
Institut für Terrestrische Ökosysteme
ETH Zürich
Universitätstrasse 16
CH-8092 Zürich
Co-Advisor:
Dr. Kurt Bollmann
Biodiversität und Naturschutzbiologie
Eidgenössische Forschungsanstalt WSL
Zürcherstrasse 111
CH-8903 Birmensdorf

Abstract
The Capercaillie Tetrao urogallus is a habitat specialist, which is resident in the boreal
and mountainous coniferous forests of Europe. Habitat loss and fragmentation in
combination with a high susceptibility to human disturbances have put Capercaillie
populations under considerable pressure all over Europe. In Switzerland, the species’
numbers significantly declined as well between 1968/71 and 2001, and are split into small
subpopulations. In the context of the Swiss National Action Plan for the Capercaillie
launched by the Federal Office for the Environment, the municipality of Amden has
established a special forest reserve for the conservation of the Capercaillie in 2006. Since
then, silvicultural measures were conducted specifically to increase the proportion of
suitable habitat for this endangered grouse species. This study is a first assessment of
how these measures affected the small-scaled habitat quality of the treated forest
patches and whether they are accepted as habitat by the Capercaillie in summer. 2010, a
species survey was conducted on 33 treated forest patches. This survey provided
evidence, by finding of feathers, about the use (presence) or the no-use (absence) of the
treated forest patches by the Capercaillie. Moreover, an assessment of vegetation
composition and structure was conducted on the same forest patches. Values of factors,
which were induced by Capercaillie ecology, were compared between presence and
absence patches. The important predictors of Capercaillie presence were determined by
logistic regression. Generally, presence patches were higher situated than absence
patches and had a higher proportion of coniferous trees, bilberry Vaccinium myrtillus and
suitable habitat in the vicinity of the patch. In addition, canopy cover on patches with use
by the Capercaillie was lower. Suitable habitat in the vicinity to the forest patch, canopy
cover and bilberry cover were the decisive factors for Capercaillie occurrence on the
treated forest patches. Bilberry cover was the most powerful determinant. This study
concludes that the conducted silvicultural measures have had the desired effect.
However, a more selective approach for the future selection of forest patches is favored
so that measures are primarily conducted where they promise to be most effective. The
application of the habitat suitability classification after Schroth, so far the only selection
criterion, should be supplemented by further criteria. Not only the low suitability of the
forest patch itself but also the suitability of its surroundings should be taken into
consideration for patch selection. The priority should also be higher on the upper
montane fir-spruce forests than on the montane fir-beech forests since bilberry, as major
determinant, is distinctively stronger associated with forest sites of the upper montane
vegetation zone. Silvicultural measures promise to have a faster and more sustainable
effect in this zone than in the fir-beech forests where the effect of thinning is neutralized
after a short time by the ingrowth of beech trees.
Keywords: Special forest reserve, Capercaillie, Tetrao urogallus, species conservation,
habitat selection, logistic regression, forestry measures, Switzerland

Zusammenfassung
Das Auerhuhn Tetrao urogallus ist ein Habitatsspezialist, der in den borealen und
alpinen Nadelwäldern Europas beheimatet ist. Lebensraumverlust und -fragmentierung
sowie eine hohe Empfindlichkeit gegenüber menschlichen Störungen haben den
Auerhuhnbeständen europaweit stark zugesetzt. In der Schweiz haben die
Auerhuhnpopulationen zwischen 1968/71 und 2001 ebenfalls stark abgenommen und
sind in kleine Bestände aufgeteilt. Im Rahmen des vom Bundesamt für Umwelt (BAFU)
lancierten Aktionsplans für das Auerhuhn wurde 2006 in der Gemeinde Amden ein
Sonderwaldreservat für dessen Erhaltung und Förderung ausgewiesen. Seither führte
man gezielt forstliche Eingriffe durch, um den Anteil an geeignetem Lebensraum zu
erhöhen. Diese Studie untersuchte zum ersten Mal, wie sich diese Eingriffe auf die
kleinräumige Habitatsqualität der behandelten Waldbestände auswirken und ob diese
vom Auerhuhn als Lebensraum im Sommer angenommen werden. 2010 wurde in 33
behandelten Waldbeständen eine Spurentaxation durchgeführt, die anhand von
Federfunden Hinweise auf deren Nutzung (Präsenz) bzw. Nicht-Nutzung (Absenz) durch
das Auerhuhn lieferte. Zudem wurde in denselben Flächen die
Vegetationszusammensetzung und –struktur standardisiert erfasst. Werte von Faktoren,
die für die Ökologie des Auerhuhns relevant sind, wurden anschliessend auf Präsenz und
Absenzflächen verglichen. Mittels logistischer Regression wurden die entscheidenden
Einflussgrössen für die Anwesenheit des Auerhuhns ermittelt. Präsenzflächen waren in
der Regel höher gelegen als Absenzflächen und verfügten über einen höheren Anteil an
Nadelbäumen, Heidelbeersträucher Vaccinium myrtillus und gut geeignetem Lebensraum
in der Umgebung. Zudem wiesen die durch das Auerhuhn genutzten Flächen einen
deutlich tieferen Baumdeckungsgrad auf. Gut geeigneter Lebensraum in der Umgebung,
der Baumdeckungsgrad sowie der Deckungsgrad der Heidelbeersträucher stellten sich
als die ausschlaggebenden Faktoren für die Anwesenheit des Auerhuhns in den
behandelten Waldbeständen heraus. Der Deckungsgrad der Heidelbeersträucher war
dabei die stärkste Einflussgrösse. Diese Studie kommt zum Schluss, dass die
durchgeführten forstlichen Massnahmen die beabsichtigte Wirkung erzielten. Einen
selektiveren Ansatz bei der Auswahl der Eingriffsflächen wäre aber zu favorisieren, damit
Massnahmen vorwiegend dort durchgeführt werden, wo sie am effektivsten sind. So
sollte die Anwendung der Lebensraum-Klassifizierung nach Schroth, bisher das einzige
Auswahlkriterium, noch durch weitere Kriterien ergänzt werden. Nicht nur die geringe
Eignung der Forstfläche selber sondern auch die Qualität der angrenzenden Waldflächen
sollte bei der Planung berücksichtigt werden. Es wird weiter empfohlen, im Waldreservat
Amden den Fokus mehr auf die hochmontanen Tannen-Fichtenwälder als auf die
montanen Tannen-Buchenwälder zu legen, denn die Heidelbeere als entscheidende
Komponente ist deutlich stärker mit Waldstandorten der hochmontanen Höhenstufe
assoziiert. Forstliche Eingriffe versprechen da also eine schnellere Wirkung, welche
zudem noch nachhaltiger ist als in Tannen-Buchenwälder, wo die Wirkung von
Auflichtungen schon nach kurzer Zeit durch das Einwachsen der Buche neutralisiert wird.
Keywords: Sonderwaldreservat, Auerhuhn, Tetrao urogallus, Artenschutz, Habitatswahl,
logistische Regression, forstliche Massnahmen, Schweiz
Contents
1. Introduction ........................................................................................................... 1
2. Methods ................................................................................................................. 6
2.1 Study area ......................................................................................................... 6
2.2 Sampling design................................................................................................ 8
2.2.1 Criteria for selecting study patches ............................................................. 8
2.2.2 Study patch selection ............................................................................... 10
2.3 Data collection ................................................................................................ 10
2.3.1 Search of indirect evidence ...................................................................... 11
2.3.2 Search of direct evidence ......................................................................... 12
2.3.3 Habitat data .............................................................................................. 12
2.4 Data analysis .................................................................................................. 18
3. Results ................................................................................................................. 20
3.1 Characteristics of forest patches with and without use by Capercaillie ........... 20
3.2 Univariate analysis .......................................................................................... 22
3.3 Multivariate analysis ........................................................................................ 23
4. Discussion .......................................................................................................... 25
5. Implications for the management of the special forest reserve of Amden .... 32
Acknowledgements ................................................................................................ 33
References .............................................................................................................. 34
Appendix ................................................................................................................. 39


1
1. Introduction
For decades, the Capercaillie populations across Europe have been decreasing
(Mollet et al., 2003; Storch, 2007). Although the reasons for this long ongoing
process are diverse (Bollmann, 2006; Storch, 2007), some factors are especially
pivotal for the tremendous decline of the Capercaillie: the loss of habitat area and
quality within its main range, the boreal forests of Scandinavia and Russia as well as
mountainous coniferous forests in Central Europe (Klaus et al., 1989), are primarily
attributed to changes in forest management in the 20th century (Storch, 2007). In
Scandinavia, old-growth forests were prescribed burned and thinned, wet forest sites
drained on a large scale and in this way transformed into production forests with
uniform age-classes and altered, even exotic tree species composition (Östlund et
al., 1997). Germany faced a similar transformation by planting monotonous needle
forests after clear-cuts. Nowadays, forest stands lack a diverse structure and
composition, with just a few contiguous forests still in existence (Küchli, 1997). In
contrast, Swiss forests experienced a decrease in use particularly during the second
half of the 20th century (Bürgi, 1997; 1999), as wood was cut less and less.
Therefore, as these forests matured, wood stock consistently increased (Brassel and
Brändli, 1999; Brändli, 2010), forest stands became dark and dense and, their
structure became more uniform since a late seral stage has not been reached yet. In
addition to habitat alteration, the Capercaillie faces declining genetic diversity as the
exchange between subpopulations is impeded by increased landscape fragmentation
caused by impassable barriers, including settlements, highways or areas with intense
agriculture (Storch, 2007; Mollet et al., 2008). Moreover, remaining populations
experience increased human disturbance both in summer and in winter due to
outdoor activities like hiking, biking or snowshoeing, which bring people to originally
remote and undisturbed areas (Thiel et al., 2008).
These developments are problematic for the Capercaillie as a habitat specialist with
high demands to its living space (see Appendix A). This grouse species inhabits
boreal coniferous forest across the northwestern and central Palearctic region
(Eiberle, 1974; Rolstad and Wegge, 1987). It requires old-growth, well structured
forests with an intermediate canopy cover (40-70%) (Storch, 1993; Graf et al., 2007)
and a good ground vegetation (Picozzi et al., 1992; Bollmann et al., 2008a), including
bilberry Vaccinium myrtillus (Storch, 1993; Schroth, 1994) as an important food
source in summer (Klaus et al., 1989). Especially during the breeding season, the
ground nesting Capercaillie depends on sufficient cover that is within close range of
its food source. Only a rich herbaceous vegetation layer (Baines et al., 2004), with a
high level of structural elements, such as basal-branched trees, root plates or clumps
of young spruces, along with edge habitat (Bollmann et al., 2008a), i.e. changes
between different habitat/vegetation types, guarantee sufficient protection and
nutrition on a very fine scale. Once detected by a predator, Capercaillies fly across
gaps in forest stands to escape. Therefore, a good abundance of forest aisles

2
(Bollmann et al., 2008a) is necessary for the largest grouse species (Rolstad et al.,
1988; Klaus et al., 1989) to maneuver.
The discussion about annual home range use is quite controversial. While in some
areas the summer and winter habitat can be distinctively separated or just slightly
overlapping (Storch, 1995,1999), they coincide nearly completely in other regions
(Imhof, 2007). However, in general it is agreed that Capercaillies neither migrate nor
do they show any strong tendency to move great distances (Klaus et al., 1989;
Storch, 1995; Segelbacher and Storch, 2002). Therefore, their ecological
requirements for the winter season have to be covered on the same small-scale area,
which also serves as a summer habitat or at least within its vicinity.
From spring to fall, Capercaillies feed on leaves, shoots, buds, seeds, berries and
fruits. During winter time, they shift their diet completely to coniferous needles (Klaus
et al., 1989), preferably those of Scots pine Pinus sylvestris or silver fir Abies alba
(Picozzi et al., 1992; Mollet and Marti, 2001). Due to this low-energy food they reduce
their level and range of activity to a minimum (Gjerde and Wegge, 1987). This
requires habitat features that allow roosting, feeding and resting all in one. Basal-
branched trees, preferably silver fir or Norway spruce Picea abies, and trees with
strong horizontal branches in the upper third are preferred (Lanz and Bollmann,
2008). Both during the summer season while nesting on the ground and during the
winter time while they keep activity low (Gjerde and Wegge, 1987), Capercaillies are
very susceptible to any disturbance caused by predators and, most notably, humans
(Storch, 1999).
Narrow habitat preferences and the low tolerance of human activities within their
home range have put many Capercaillie populations in Europe under considerable
pressure. In Switzerland, Capercaillie populations have declined particularly
significantly since the end of the seventies. During surveys conducted from 1968 to
1971, at least 1100 cocks could be recorded (Glutz von Blotzheim et al., 1973; Mollet
et al., 2003). In similar surveys conducted in 2001, only 450 to 500 cocks and the
corresponding numbers of hens were detected (Bollmann, 2006; Mollet et al., 2008).
Today, it is assumed that the Swiss Capercaillie population is divided in at least five
regional populations (see Appendix B) (Mollet et al., 2008). However, there is little to
no exchange between these populations (Mollet et al., 2003). These regional
populations are split into smaller local populations (Bollmann and Graf, 2008) and
they are partially isolated from each other due to urban and agricultural areas, high
mountain ranges and dense forests, which are unsuitable habitats (Mollet et al.,
2008).
Efforts to protect and conserve the Capercaillie in Switzerland began in the seventies
(Mollet et al., 2008). In 1977, the bird was put on the red list for endangered animal
species for the first time (Bruderer and Thönen, 1977). Currently, it is still classified
as “endangered“ (Keller et al., 2010). During the last 10 years several Capercaillie
research projects have contributed to an increased knowledge of its conservation

3
(Bollmann et al., 2008b). However, until recently a nationwide coordination of needed
conservation measures was lacking. In 2008 the Swiss Action Plan for the
Capercaillie, as part of the Swiss conservation program of priority bird species, was
published. It defines the national strategy for the protection and conservation of the
Capercaillie in Switzerland and provides information about the goals, measures,
organization and the financial framework (Mollet et al., 2008; Stadler et al., 2008).
The main goal is to halt the Capercaillie’s decline and the recovery of existing
populations. Over the longer term, until 2035, the populations should achieve the size
and range present between 1968 to 1971(Mollet et al., 2008). For this purpose, the
Swiss Action Plan groups promising areas into two categories of priority for
conservation interventions:
Areas of first priority need to have both sufficient habitat potential based on the
model of Graf et al. (2004), with substantial current Capercaillie populations
(Bollmann et al., in press). These regions are seen as source populations, centers for
the resettlement of adjacent potential areas (Mollet et al., 2008).
Areas of second priority do not hold a current Capercaillie population, but they show
good habitat potential in close proximity and within the dispersal range of existing
populations (Mollet et al., 2008).These areas can function as stepping stones,
allowing existing subpopulations to connect (Graf et al., 2004; Stadler et al., 2008).
Nevertheless, for an efficient conservation strategy, the regional circumstances have
to be taken into consideration. Therefore, the Swiss Action Plan provides specified
guidelines and information for every Capercaillie region (Mollet et al., 2008).
A promising instrument for the Capercaillie conservation in first priority areas is the
establishment of special forest reserves (Bollmann et al., 2008b). In natural forest
reserves, the focus lies on natural dynamics, excluding management interventions
(Bollmann, 2006). However, in special forest reserves conservation measures are
stipulated in an article and purposefully conducted to aid recovery. Therefore, it is
possible to attain ecological conditions, which under natural circumstances would
take much longer to occur.
Some special forest reserves specifically for Capercaillie conservation have already
been established in the cantons of Schwyz, Glarus, St.Gallen (Mollet et al., 2008),
Vaud, Bern, Neuchâtel, Obwalden, Zug and Grison (K. Bollmann, personal
comment). Since the Capercaillie has been shown to be a remarkable umbrella
species (Suter et al., 2002; Bollmann et al., 2004), the implementation of a special
forest reserve promises a high effectiveness for general conservation purposes as
well. An umbrella species is considered to be a representative of a particular
community whose conservation is expected to also have positive effects on other
species (Roberge and Angelstam, 2004; Bollmann, 2006). In this case other
endangered bird species of subalpine forests (e.g. Three-toed Woodpecker, Pygmy
Owl, Woodcock) may also profit from Capercaillie conservation (Suter et al., 2002;
Pakkala et al., 2003).

4
In 2006, the municipality of Amden in the Canton St.Gallen established an agreement
with the canton to create a special forest reserve (Ehrbar et al., 2011). The main goal
is the conservation, and if necessary, the improvement of forest quality as a habitat
for the Capercaillie. Beside the Capercaillie populations in the Canton of Schwyz, the
forests of the Canton St.Gallen are home to the next largest and most important
subpopulations in the north-eastern Prealps (Region 4a, see Appendix B) (Mollet et
al., 2008). Within the Canton of St.Gallen, the forests of Amden belong to the largest
and most important Capercaillie areas (Bollmann, 2006) with the largest regional
population (Kormann, 2009). Since the area is both currently settled by the
Capercaillie and shows a potentially suitable habitat, (Graf et al., 2004) it is identified
as a first priority area (Mollet et al., 2008). Moreover, Jacob (2006) and Kormann
(2009) showed that the area is in a genetic exchange with populations from the
Toggenburg region, and it not only acts as a source population, but also as a
stepping stone biotope (Bollmann, 2006; Ehrbar et al., 2011).
Several planning tools exist to assess priority forest stands for habitat improvement.
First, in Amden, a new forest stand map was published. Furthermore, the entire
forest area was mapped and classified concerning Capercaillie habitat suitability
(Fürer, 2001; Ehrbar et al., 2011). For that, the method of Schroth (1994) was used,
which assigns a value from 1 (optimally suitable) to 5 (unsuitable) to each forest
stand. The method takes into consideration factors including summer food, ground
cover and stand structure as crucial criteria. According to this map, one third of the
forest reserve of Amden was classified as unsuitable Capercaillie habitat, with
another third as less suitable. The final third of the area consisted of forest stands
classified as suitable to optimally suitable (Ehrbar et al., 2011).
Necessary measures were derived by means of two methodologies. The first
identified specific descriptions of forest stand structure and composition (target state);
the second used carefully chosen indicator plots (“Weiserflächen”) to determine the
actual state of the different forest areas. These indicator plots are representative of
the entire forest reserve. Subsequently, after comparing actual and target states,
necessary silvicultural measures were defined. Further information and details can be
found in Ehrbar et al. (2011). Forest stands or patches which, according to the habitat
suitability map, were classified as less suitable or unsuitable (Schroth category 4 and
5), were treated as a priority. According to (Ehrbar et al., 2011) from 2006 to the end
of 2009, 52 interventions (e.g. planting, logging, tending) were conducted.
One fundamental component of efficient and long-term work in special forest
reserves is the assessment of the impact and success of conservation measures
taken with regard to the main goal. In the case of Amden, it serves the period
examination of the measure’s effects concerning conservation and recovery of the
Capercaillie populations (Stadler et al., 2008). Such project-related, small-scaled
control of habitat quality is required by the Swiss Action Plan and realized in defined
time intervals (normally a couple of years) (Mollet et al., 2008). In the case of the

5
Amden special forest reserve, a first encompassing assessment is planned for 2016,
i.e. 10 years after the start of the project (Ehrbar et al., 2011). Beside this control,
which includes the entire forest reserve, the treated forest patches are separately
examined for habitat use by Capercaillie in shorter time intervals. Therefore, every
two to three years on average after a silvicultural intervention, there should be a
control whether these treated forest patches are accepted as habitat or not (Ehrbar et
al., 2011).
This master thesis examines, for the first time since the start of the project in 2006,
33 treated forest patches for use by the Capercaillie. The survey is based on a
search for molt feathers in summer within a set of study patches as a measure of
Capercaillie presence or absence. Additionally, as a second component, an
assessment of forest stand parameters in the same set of study patches was
conducted. It was the goal of this study to answer the following questions: 1) In which
treated forest patches do Capercaillies occur and in which do they not? 2) How do
composition and characteristics of forest stands with evidence of the Capercaillie
differ from stands without evidence? 3) Based on these insights, what first feedback
can be given to the responsible persons of the forest reserve Amden? Are the
planned and conducted measures actually target-aimed? 4) Can any
recommendations be made about possible adjustments of the measures respectively
about adjustments of the prioritization of the forest stands?

6
2. Methods
2.1 Study area
The study area was located in the special forest reserve of Amden in the canton of
St. Gallen, biogeographically associated to the Capercaillie region 4a (Mollet et al.,
2003) (see Appendix B). The reserve’s perimeter covered an area of 1772 hectares,
55 percent (975 hectares) of it being forest (Ehrbar et al., 2011). The reserve spans
the large woodlands of the municipality of Amden from the lake Walen towards the
Obertoggenburg on both sides of the watershed of the rivers Thur and Linth (see
Figure 1). The stocked area is dominated by fir-spruce (36%) and fir-beech (47%)
forest stands.
Figure 1: Location of the special forest reserve of Amden with the forest patches (blue) that
were treated between 2006 and 2009. Patches that were investigated in this study are orange
framed.
The region’s climate is oceanic. The average annual precipitation of 1930 mm is
characteristic due to the location at the northern edge of the Alps (Ehrbar et al.,

7
2011). The remarkable amount of rain in combination with impermeable soils is the
reason for the occurrence of many mires and wetlands, which intersperse the forest
area and cause a diversely structured landscape (Brülisauer, 2006) (see Figure 2). In
total, 70 hectares of bogs and 220 hectares of fens exist within the reserve perimeter
(Ehrbar et al., 2011). The rest of the area includes forest, alpine pastures and tundra
grassland. The reserve stretches from its lowest point at 1040 meters a.s.l. to an
altitude of 2101 meters a.s.l. (peak of the Leistchamm). The upper tree-line is at
about 1800 meters a.s.l. (Ehrbar et al., 2011). This altitudinal range is
phytosociologically corresponding to the “montane,” “upper montane” and “subalpine”
zone according to the classification of altitudinal vegetation zones in Frehner et al.
(2005) and Ott et al. (1997). Overall 253 different forest stand units including
transitions and tessellated patches were mapped in the reserve (Ehrbar et al., 2011),
indicating a high variety of site conditions.
a)
b)
Figure 2: Characteristic for Amden is a
diversely structured landscape with a mosaic
of forest, wetland and alpine vegetation.
a) / b) fen/meadow at Vorder Höhi, c) bog at
Hinter Höhi (Photos by Nicolas Bircher).
c)

8
2.2 Sampling design
2.2.1 Criteria for selecting study patches
The patches that were examined in this thesis (“study patches”) were selected from
all forest patches that silvicultural measures were conducted on (“treated forest
patches”) between 2006 and 2009 (see Figure 1). Habitat suitability map, forest
stand data and management plan were provided as GIS layers by Rolf Ehrbar, head
of the regional forestry commission office Waldregion 4 See. The data show the
treatment state and process of the reserve management at the end of 2009.
Measures conducted after this point in time were not considered in this study.
To be approved as a study patch, a treated forest patch had to fulfill the following
criteria:
Patch had to pass spatial stratification
Logging had to be the conducted silvicultural measure
Patch had to contain raster cells for the Capercaillie search
Patch had to contain sampling plots for the assessment of forest stand
variables
Patch size had to be ≥900m2
These five criteria are explained in detail:
Spatial stratification
Treated forest patches were distributed across the entire special forest reserve of
Amden and occurred on both sides of the watershed. For this study, only treated
forest patches on one side of the watershed in the catchment area of the Thur
(towards the Toggenburg region) were included. By doing so, the investigations were
focused on the core distribution of Capercaillies in the reserve for the past ten years
and neglected sporadic occurrence on the other side of the watershed (K.Bollmann,
pers. comm.).
Silvicultural measure
Forest patches were treated very differently (planting, thicket resp. pole wood
tending, logging, salvage logging). In this thesis, only forest patches where logging
was the conducted measure were considered in order to avoid any bias caused by
different measures and to draw conclusions for one concrete treatment.
Raster cells for Capercaillie search
For the Capercaillie search, a raster of 50m x 50m cells was applied. Initially, this
raster was placed over the entire forest reserve. Only cells that covered a treated

9
forest patch to at least 50 percent were included in the study (Figure 3). They were
applied to guarantee a systematic and proportionally appropriate survey of the study
patch. The Capercaillie search was conducted within these raster cells. Parts of
raster cells which were located outside of a forest patch, were not controlled of
course.
Sampling plots for assessment of forest stand variables
The variable assessment had to be done independently from the search for
Capercaillie since its purpose was not to characterize the habitat right where
evidence of Capercaillie was found, but to describe the treated forest patch in
general. Bollmann et al. (2005) recommend a minimum area of 500m2 to adequately
measure forest structure in subalpine spruce forests. For this study, quadratic study
plots of 30m x 30m (900m2) were chosen. A point layer with 30m x 30m resolution
(30 meters distance between points) was randomly put over the forest reserve.
These points were planned to function as plot centers (see yellow dots in Figure 3).
Only points situated within treated forest patches were relevant. Since the sampling
plots of 30 to 30 meters had to be situated completely within the forest patch, the set
of points was reduced again to those with a distance of at least 21.2 meters (half the
diagonal of a 30m x 30m square) to the patch edge.
Figure 3: Treated forest patch (orange area) with 50m x 50m raster cells for the Capercaillie
search (purple hatched) and points (yellow) as centres of sampling plots for the assessment of
forest stand variables.
Due to limited time for the field work, the assessment of forest stand variables could
not be conducted completely proportional to the forest patch size.
Eventually, a compromise was found by implementing one sampling plot per 15’000
square meters, i.e. area size = 900 - 15’000m2 1 sampling plot; area size =
15’001m2 - 30’000m2 2 sampling plots etc. In this way, the amount of sampling
plots was kept to a manageable number while guaranteeing a certain degree of
proportional representation as well.

10
Forest patch size
Forest patches with an area < 900m2 (30m x 30m) were neglected from the start
since they were not large enough for at least one sampling plot.
2.2.2 Study patch selection
After selecting 31 treated forest patches which fulfilled the criteria mentioned above,
one patch was excluded later during the field season because just a light treatment
had been conducted recently and signs of it were hardly visible. Therefore, a
comparison with other forest patches with much stronger treatments did not seem
appropriate.
Out of the 30 remaining patches, three were split into two separate parts for the
statistical analysis. Due to a considerable altitude gradient among other things, these
particular patches showed a clear heterogeneity in the sense of tree species
composition, ground vegetation cover and forest structure across the treated area.
Quite problematic was the fact that evidence of Capercaillie was found in one part of
each patch, which, in its habitat character, considerably differed from the rest of the
forest stand. By splitting, the forest patches were divided into a patch with
Capercaillie presence resp. into one with absence and the data from the forest stand
assessment could be applied appropriately and more accurately to the concerning
parts
Eventually, the sampling size amounted to 33 study patches (Figure 1) with a total of
226 raster cells for the Capercaillie search and 55 sampling plots for the assessment
of forest stand variables. All study patches together covered an area of 57.6 hectares
within the forest reserve. The altitude of the study patches ranged from 1150 meters
a.s.l. to 1517 meters a.s.l.. Patch size was rather heterogeneous and varied from
2’248 square meters to 50’802 square meters while the average patch area was
17’467 square meters.
2.3 Data collection
Data were collected between August 3rd and October 8th 2010. Late summer is a
convenient time to search for feathers, since Capercaillie conduct its molt during July
and August (Klaus et al., 1989). According to Mollet and Bollmann (2009) the
probability of finding feathers in August in the forest reserve is much higher than in
July. Therefore, the survey within the predefined raster cells took place in August. In
September and in the beginning of October, the forest variable assessment of the
study patches was conducted.
11
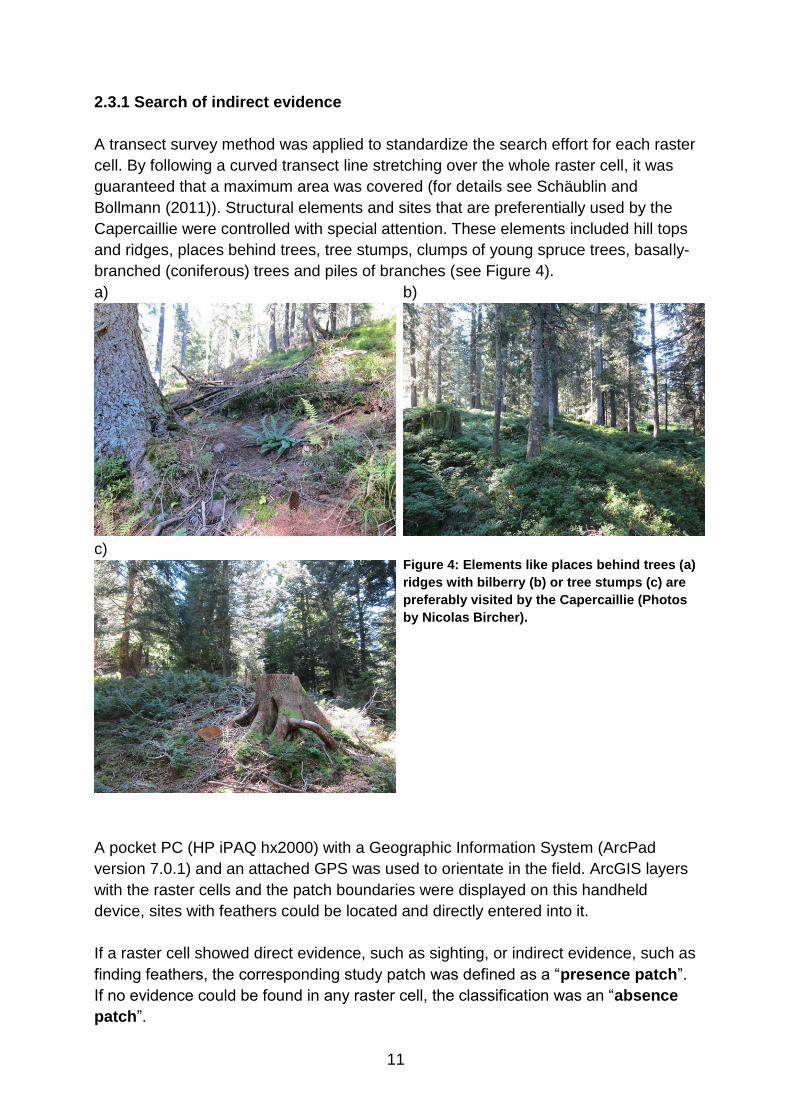
2.3.1 Search of indirect evidence
A transect survey method was applied to standardize the search effort for each raster
cell. By following a curved transect line stretching over the whole raster cell, it was
guaranteed that a maximum area was covered (for details see Schäublin and
Bollmann (2011)). Structural elements and sites that are preferentially used by the
Capercaillie were controlled with special attention. These elements included hill tops
and ridges, places behind trees, tree stumps, clumps of young spruce trees, basally-
branched (coniferous) trees and piles of branches (see Figure 4).
a)
b)
Figure 4: Elements like places behind trees (a)
ridges with bilberry (b) or tree stumps (c) are
preferably visited by the Capercaillie (Photos
by Nicolas Bircher).
c)
A pocket PC (HP iPAQ hx2000) with a Geographic Information System (ArcPad
version 7.0.1) and an attached GPS was used to orientate in the field. ArcGIS layers
with the raster cells and the patch boundaries were displayed on this handheld
device, sites with feathers could be located and directly entered into it.
If a raster cell showed direct evidence, such as sighting, or indirect evidence, such as
finding feathers, the corresponding study patch was defined as a “presence patch”.
If no evidence could be found in any raster cell, the classification was an “absence
patch”.

12
A first allocation of found feathers to the bird species already happened in the field.
One feature which is very characteristic for grouse species (Tetraonidae) and helpful
for their identification is the so called aftershaft (Figure 5). This downy feather grows
from the underside of the base of the main feather shaft (Erritzoe et al., 2007).
Figure 5: Body feathers with aftershaft, modified from Mollet and Marti (2001).
In addition to the aftershaft, Capercaillie can also be identified by the mere size and
coloration of the feather as well as the habitat of its discovery (see Appendix F). Size
and coloration even allow the gender of the Capercaillie to be determined (Klaus et
al., 1989). All feathers were examined again after the field season by the author and
K. Bollmann in the laboratory. Four of the feathers showed features of the grouse
family, but could not definitely be allocated to the Capercaillie (K. Bollmann, pers.
comm.; R.Winkler, written comm.). Therefore, they were not considered as evidence
of presence.
2.3.2 Search of direct evidence
No basic search for direct evidence was conducted since Capercaillies are very
secret and shy birds (Maumary et al., 2007). Therefore, the probability of detection is
very low. Nevertheless, during the field work some encounters with Capercaillies
happened by chance and were considered to be evidence as well.
2.3.3 Habitat data
In total, 44 habitat parameters were recorded to characterize the study patches
(Table 1). 34 of these parameters were measured or derived from field data for each
of the 55 sampling plots. If a study patch contained more than one sampling plot, a
mean value was derived.
Temperature, precipitation and solar radiation data were provided by Niklaus
Zimmermann from the Swiss Federal Research Institute WSL. They were available
as ArcGIS data with a raster cell size of 25m x 25m. Slope was derived from a digital
elevation model (dhm25) from swisstopo (2010).
aftershaft

13
Six parameters – age of the study patch, study patch size, suitable surroundings,
unsuitable surroundings, fir-spruce forest and fir-beech forest – were not derived from
the field data, but from the forest stand data and the management plan: the age of
the forest patch is understood as the length of time since the measures were
conducted (i.e. 2010 – year of treatment). The variables “suitable” and “unsuitable”
surroundings were extracted from GIS data. They were calculated in ArcMap (version
9.3.1) using the habitat suitability map by delineating a 50m buffer around each patch
and assessing the proportion in terms of the area within this buffer for both classes
“suitable” and “unsuitable” (see Figure 6). These two classes were derived from the
five suitability categories of Schroth (1994): Suitable surroundings included the
Schroth categories “optimally suitable” (1) and “suitable” (2), unsuitable surroundings
included the Schroth categories “still suitable” (3), “less suitable” (4) and “unsuitable”
(5). A third category had to be implemented for patches within the buffer that were
not classified with the Schroth method. Reasons why they were not assigned with a
Schroth category were:
Outside of the forest area
Outside of the forest reserve
Within another treated forest patch so that due to the conducted treatment the
suitability classification was not accurate anymore (habitat qualification was
conducted in 2000 (Fürer, 2001; Bollmann, 2006)
Figure 6: Design for the determination of the variables suitable and unsuitable surroundings.
Ehrbar et al. (2011) grouped upper classes of vegetation site communities from the
directives for sustainability in protection forests (NaiS project) (Frehner et al., 2005)
into three types of treatment: montane fir-beech forests, upper montane fir-spruce
forests and others. If these types react differently to silvicultural measures this may
have consequences for their treatment and the selection of new forest patches.
Therefore, there is a high interest regarding the use of fir-beech and fir-spruce forests
by Capercaillie in the Amden forest reserve (Ehrbar et al., 2011). Thus, the
proportions of these two types of treatment (variables “Fir-beech forest” and “Fir-
spruce forest”) were measured by means of GIS data for every study patch.
50m

14
In the field, plot centers were located with a GPS. If a plot center was situated at an
inaccessible location (e.g. creek, steep slope) or its surrounding area did not
correspond with the character of the actual treated forest patch (e.g. swampy hollow
without logging) then it was moved 10 to 15 meters to an appropriate place. At the
center, the altitude was measured with the GPS. Then, the plot was marked out
parallel to the slope.
A full callipering was conducted for the entire plot. In a callipering, all trees in a
defined area with a diameter equal or larger than a certain threshold are identified
and their diameters measured. For this study, a dbh (diameter at breast height i.e.
1.3m above ground) of 12 centimeters was chosen (Keller, 2005). The tree species
present were Norway spruce Picea abies, silver fir Abies alba, beech Fagus
sylvatica, rowan Sorbus aucuparia, sycamore maple Acer pseudoplatanus and Scots
elm Ulmus glabra. From this callipering, several variables could be derived: the total
stem number per plot, respectively the stem numbers of each species (tree density),
the total basal-area per plot as well as the basal area of each tree species per forest
patch (dominance). Furthermore, the importance value (relative tree density +
relative dominance) was calculated for each tree species according to Kuers
(2005).This last variable integrates the phytosociologically important parameters tree
density and tree dominance into one measure. It is an indicator for the relative
importance and dominance of a tree species in a particular forest stand (Barker et al.,
2002).
To analyze the growth structure of the forest stands two variables were defined: one
variable called “succession,” which was expressed as the ratio of the number of trees
on a study patch with a dbh above the median and the number of trees with a dbh
below the median. The median of dbh was calculated over all surveyed study
patches and amounted to 35 centimeters. This variable served as an indicator
whether the forest patch was rather characterized by thinner trees (dbh<35cm) or
thicker i.e. “older” trees (dbh>35cm). The second variable was named “very large
trees,” which was expressed as the number of trees on a study patch above a certain
dbh threshold. As threshold the 90% percentile (59 centimeters) of the dbh
distribution over all surveyed forest patches was chosen.

15
Table 1: Name, abbreviation and definition of variables used to quantify forest patches.
Group Variable Abbreviation Unit Definition
Site
parameters
Age AGE number Number of years since forest measures were conducted (2010 - year of treatment)
Size SIZE (m2) Size of the study patch
Slope SLOPE degree (°) Slope in degrees
Temperature TEMP (1/100°C) Monthly mean of average temperature (1961-1990) in degrees C (Zimmermann and Kienast, 1999; Zimmermann and Roberts, 2001)
Precipitation PRECIP (1/10mm) Monthly mean precipitation sum (1961-1990) (Zimmermann and Kienast, 1999; Zimmermann and Roberts, 2001)
Solar radiation SOLRAD kJ/day Monthly global potential shortwave radiation kJ/day = monthly potential diffuse shortwave radiation (Kumar et al., 1997) + monthly potential direct shortwave radiation (Kumar et al., 1997)
Altitude ALT (m) Altitude in meters above sea level (a.s.l.)
Habitat structure
Fir-spruce forest
FIRSPR (%) Proportion of the treatment type upper montane fir-spruce forests on the study patch
Fir-beech forest
FIRBEE (%) Proportion of the treatment type montane fir-beech forests on the study patch
Total stem number
N_tot number Total number of alive tree stems within sampling plot
Stem number spruce
N_SPR
number
Number of alive stems of particular species within sampling plot
Stem number fir
N_FIR number
Stem number beech
N_BEE number
Stem number rowan
N_ROW number
Stem number sycamore maple
N_SMA number
Stem number Scots elm
N_ELM number
Total basal area
G_tot (m2) Sum of the cross-sectional areas at a height
of 1.3 m (DBH) of all trees of a sampling plot

16
Basal area spruce
G_SPR (m2)
Sum of the cross-sectional areas at a height of 1.3 m (DBH) of a particular tree species
Basal area fir G_FIR (m2)
Basal area beech
G_BEE (m2)
Basal area rowan
G_ROW (m2)
Basal area syc. maple
G_SMA (m2)
Basal area Scots elm
G_ELM (m2)
Importance value spruce
IV_SPR value (density of particular tree species/ sum of all densities)*100 + (total basal area of each individual species/ sum of the basal areas of all species)*100
Importance value fir
IV_FIR value
Importance value beech
IV_BEE value
Importance value rowan
IV_ROW value
Importance value syc. maple
IV_SMA value
Importance value Scots elm
IV_ELM value
Suitable surroundings
SUIT (%) Proportion of suitable habitat (Schroth categories 1 and 2) within a 50 meter buffer area around the study patch
Unsuitable surroundings
UNSUIT (%) Proportion of unsuitable habitat (Schroth categories 3, 4 and 5) within a 50 meter buffer area around the study patch
Coniferous trees
CONIFTR (%) Proportion of coniferous trees (number of coniferous trees / total tree number) per sampling plot
Deciduous trees
DECIDTR (%) Proportion of deciduous trees (number of deciduous trees / total tree number) per sampling plot
Very large trees
LARGETR number Number of trees with dbh above 59 centimeters (90% percentile) in a sampling plot
Succession SUCC value Ratio of the number of trees with dbh above 35 centimeters (median) to the number of trees with dbh below 35cm
Canopy cover estimated
CANCO_EST (%) Estimated ground area covered by tree layers
Canopy cover measured
CANCO_MES (%) Proportion of 25 points within a sampling plot covered by the crown of trees

17
Shrub/ ground cover
Shrub cover SHRCO (%) Area covered by shrubs estimated in categories for a sampling plot: 1= <1%, 2= 1-9%, 3= 20-20%, 4= 21-35%, 5= 36-50%, 6= 51-75%, 7= 76-100%
Ground vegetation cover
GRVECO (%) Area covered by ground vegetation estimated in categories for a sampling plot: 1= <1%, 2= 1-9%, 3= 20-20%, 4= 21-35%, 5= 36-50%, 6= 51-75%, 7= 76-100%
Cover of Vaccinium species
VACCO (%) Area covered by Vaccinium species estimated in categories for a sampling plot: 1= <1%, 2= 1-9%, 3= 20-20%, 4= 21-35%, 5= 36-50%, 6= 51-75%, 7= 76-100%
Bilberry cover BILBCO (%) Area covered by bilberry Vaccinium myrtillus estimated in categories for a sampling plot: 1= <1%, 2= 1-9%, 3= 20-20%, 4= 21-35%, 5= 36-50%, 6= 51-75%, 7= 76-100%
Edge lines Clumps/Basal-branched trees
CLUBBTR (m) Total boundary length of clumps of young spruce trees and basal-branched coniferous trees in meters
Root plates ROOTPL (m) Total length of root plate diameters
Comfort Ant hills ANTHILL number Number of ant hills within a sampling plot
Canopy cover was estimated for each sampling plot. However, the variable was
slightly modified compared to the method of the Swiss National Forest Inventory (LFI)
(Keller, 2005) by considering every tree layer (upper, middle and lower layer) and not
only the upper layer. Since the Capercaillie depends on good ground vegetation,
every tree layer influencing the amount of light reaching the forest floor has to be
considered. Besides estimating canopy cover, this variable was also measured using
a vertical densitometer at 25 points, which were systematically distributed along five
transects within the sampling plot (see Appendix C). At each point, it was assessed
whether the spot vertically above was covered or not covered by the canopy. The
proportion of the covered spots resulted in the canopy cover. This method was
implemented for having a standardized procedure besides estimating and increasing
the confidence into data accuracy. However, this concern showed to be unfounded,
since estimates and measures of canopy cover in the plots were highly correlated
(Pearson correlation = 0.875).
A group of variables was recorded on five 2m x 2m subplots (see Appendix C).
These variables included the shrub cover, ground vegetation cover, cover of
Vaccinium species and bilberry cover in particular. Modified classes of the National
Forest Inventory (LFI) (Keller, 2005) were used for these variables. After Keller
(2005), the shrub layer is defined to be all woody plants with a height between 0.5
and 3 meters. For this study, the variable was modified including all woody plants
with a height between 0.5 and 5 meters. The shrub layer is seen as an element of
hindrance for the Capercaillie since it impedes the detection of predators and
maneuvering during flight (Bollmann et al., 2008a). This variable, however, turned out
to be barely analyzable for two reasons: first, well-developed shrub vegetation hardly

18
existed on the study patches after the recent logging and, therefore, only some data
could be collected. Second, the modification of the variable definition proved to be
unfortunate because confusion arose between counting a 4 or 5 meter tall plant as a
shrub or a tree. For these reasons, the shrub cover, although recorded as accurately
as possible, was not used in the further analyses.
Ground vegetation cover was defined following Keller (2005). Berries from the
Vaccinium species, particularly from bilberry, are an important food source for the
Capercaillie in summer and fall (Klaus et al., 1989; Storch, 1993). During the field
survey, bilberry proved to be the only Vaccinium plant occurring in a significant
amount. The only other Vaccinium plant found on the plots was lingonberry
Vaccinium vitis-idaea in some sparse single shoots. Therefore, the variable “cover of
Vaccinium species” was discarded and only bilberry cover used for further analysis.
As important hideout elements for the Capercaillie, basally-branched trees and
clumps of young coniferous trees were combined to one variable. Since silvicultural
measures have been conducted just a short while ago, there has not been enough
time yet for the development of regeneration and trees with distinctive basal
branches in the formerly dark and dense forest stands. Consequently, these
elements were hardly found on the study patches. Root plates were really scarce in
the treated patches as well. Therefore, these variables could not be considered for
the statistical analysis due to small numbers. The same applies to ant hills, which
were hardly found.
2.4 Data analysis
Capercaillie presence and absence was used as the response variable, while habitat
data served as the explanatory variables. All statistical analyses were conducted with
the statistic software SPSS 17. First, a descriptive statistic approach was chosen to
analyze the current situation on the study patches. Second, the habitat variables with
the highest explanatory potential for Capercaillie presence and absence were
identified using logistic regression. These variables were then used to build a
multivariate model to predict Capercaillie occurrence.
For presence and absence patches, means and standard errors were calculated
separately for each independent variable. The non-parametric hypothesis Mann–
Whitney U test was used to analyze whether these values were significantly different.
Since all independent variables were continuous, no other test had to be applied. The
level of significance was p<0.05.
To avoid over fitting and limited interpretability (Guisan and Zimmermann, 2000), the
original set of 44 independent variables had to be reduced for model-building in
several steps:

19
First, bivariate correlations were analyzed to check for multicollinearity between the
explanatory variables, a factor which according to Hosmer and Lemeshow (2000) can
restrict the power of logistic regression models. Fielding and Haworth (1995) used a
threshold of 0.7 to determine high correlation. According to their recommendation,
variable pairs with high correlation (Pearson correlation >0.7) were further scrutinized
and the variable with less explanatory potential considering Capercaillie occurrence
was excluded from further analysis.
The second step included the calculations of univariate models for all explanatory
variables. These logistic regression models served to exclude all variables whose
explanatory potential did not significantly (p>0.05) explain the variance in the data
(Hosmer and Lemeshow, 2000). For regression analysis, Fowler et al. (1990)
recommend to transform proportion data. Proportions may cause problems since
both distribution tails are truncated on a scale between zero and one. According to
Gotelli and Ellison (2004) an arcsin-transformation was used to increase the
accuracy of the model.
In a last step, the significant univariate variables were joined in any possible
combination. To attain the final model, the various variable combinations were ranked
according to the Akaike Information Criterion (AIC) ) (Akaike, 1974; Mazerolle, 2006).
The AIC considers the number of parameters and the overall fit of the actual model
(log-likelihood). The higher the log-likelihood and the fewer parameters involved, the
better is the model according to AIC (Mazerolle, 2006). To compare different models,
two measures derived from the AIC value can be used. First, the delta AIC (AIC)
corresponds to the difference among a particular model with the “best” model.
Generally, a AIC < 2 can be considered as support for the model, while values from
3 upwards indicate the model to be rather unlikely (Mazerolle, 2006). Second, Akaike
weight () is a probability indicator for a particular model to be “the best among the
whole set of candidate models” (Mazerolle, 2006, p.173).
For the multivariate analysis only habitat structure parameters (see Table 1) were
considered. These variables primarily influence the habitat suitability for the
Capercaillie on a small-scale, like a forest patch. They can directly be influenced by
forest management and measures. Site parameters were analyzed in the univariate
analysis, but they were not further used in the multivariate approach.

20
3. Results
3.1 Characteristics of forest patches with and without use by
Capercaillie
In 12 out of 33 studied forest patches feathers from the Capercaillie were detected
(Figure 7). In three patches only once evidence was found, in the other nine patches,
several sites with feathers were discovered. Feathers were found at 45 sites in total,
about one quarter of them stem from hens and all the rest were from cocks.
Figure 7: Forest patches with and without evidence of Capercaillie.
The time period since the treatment was not related to the occurrence of Capercaillie
on the forest patches. Both just recently treated forest patches and patches with a
treatment three or four years ago were used and not used by the Capercaillie.
Among the site parameters, four variables showed significant differences between
study patches with Capercaillie presence and absence, respectively (Table 2). Study
patches where evidence of Capercaillie was found were on average higher situated
(1408±23 (S.E.) m a.s.l. vs. 1278±14 m a.s.l.) than study patches without evidence.
Presence patches showed a higher monthly mean precipitation sum with
198.44±1.64 mm compared to absence patches (189.73±1.72mm). Corresponding to
the altitude, temperature was obviously lower on forest patches which were used by
the Capercaillie (9.4°C) than on absence patches (10.0°C). Presence patches were
surrounded by a significantly higher proportion of suitable Capercaillie habitat (18%)
than absence patches (3.3%). The proportion of the treatment type fir-spruce forests
(FIRSPR) was significantly higher on forest patches with Capercaillie occurrence
(59.26±10.47 %) than on patches without occurrence (13.17±4.60 %). In contrast, the

21
proportion of fir-beech forest (FIRBEE) was significantly higher in absence patches
(69.62±5.99 %) than in presence patches (33.10±10.20 %).
Table 2: Variables of examined forest patches with a significant difference between patches
used (presence) and non-used (absence) by Capercaillie. All data refer to a quadratic plot size
of 900 m2.
Capercaillie presence Capercaillie absence Mann-Whitney U Test
Variable (Abbr.) Mean (n=12) ±Std. Error Mean (n=21) ±Std. Error Z-value p
ALT 1407.92±23.24 (m a.s.l.) 1277.77±14.45 (m a.s.l.) −3.799 <0.001
TEMP 936.38±12.29 (1/100°C) 1005.90±8.09 (1/100°C) −3.687 <0.001
PRECIP 1984.46±16.43 (1/10mm) 1897.39±17.22 (1/10mm) −3.144 0.002
SUIT 17.92±4.51 (%) 3.33±1.90 (%) −3.078 0.002
FIRBEE 33.10±10.20 (%) 69.62±5.99 (%) −2.662 0.008
FIRSPR 59.26±10.47 (%) 13.17±4.60 (%) −3.432 0.001
N_BEE 4.46±1.88 6.96±0.97 −1.973 0.049
N_SMA 0.04±0.04 1.63±0.54 −2.846 0.004
CONIFTR 82.92±6.27 (%) 68.48±4.01 (%) −2.137 0.033
DECIDTR 17.08±6.27 (%) 31.52±4.01 (%) −2.137 0.033
G_SMA 0 (m2) 0.06±0.03 (m
2) −2.649 0.008
IV_SMA 0 0.07±0.02 −2.737 0.006
CANCO_MES 47.83±2.40 (%) 62.83±3.19 (%) −2.831 0.005
BILBCO 20.59±3.96 (%) 4.22±0.98 (%) −3.41 0.001
The current forest structure and composition of presence and absence patches is
clearly different (see Table 2). In general, the proportion of coniferous trees was
significantly higher in presence patches (~83%) than in absence patches (~68%).
Absence patches showed higher stem numbers of beech (Mann-Whitney U-Test, Z=
−1.973, p= 0.049) and sycamore maple (Mann-Whitney U-Test, Z= −2.846, p= 0.004)
than presence patches. Horizontal patch structure differed among absence and
presence patches with regard to canopy cover. Mean canopy cover in presence
patches amounted to 48% and 63% in absence patches, respectively. A conspicuous
difference occurred between presence and absence patches in ground vegetation
composition. Forest patches with use by the Capercaillie had a bilberry cover of 21%
on average, patches without Capercaillie use had only 4% (see Table 2).
The mean of total stem number was not significantly different between presence and
absence patches. However, the minimum stem number in absence patches (11

22
trees/900 m2) was lower than the minimum in presence patches (15). Presence
patches also showed a higher maximum stem number (58) than absence patches
(45).
Figure 8: Box plots with median, minimum and maximum of the number
of very large trees in patches with and without use by the Capercaillie.
The mean number of very large trees per patch did not significantly differ between
forest patches with and without use by Capercaillies. By tendency, there were more
trees with a dbh >59 centimeters in presence patches (median: 2.8 vs. 1.3) (Figure
8).The maximum number of very large trees was six in both categories. Opposite to
absence patches, presence patches always contained at least one very large tree.
3.2 Univariate analysis
Six parameters showed significant differences among presence and absence
patches in the univariate logistic regression models (Table 3). Four of these
variables, which are related to the small-scaled habitat use of the Capercaillie, were
subject to further (multivariate) analysis. All variables yielded surprisingly high
explanatory power, with temperature and bilberry cover at the top (R2>0.5). Bilberry
cover also had the strongest influence on Capercaillie occurrence (=9.63) closely
followed by canopy cover (=−9.3).

23
Table 3: Significant variables, their regression coefficients, p-values and R2 from the univariate
analysis.
Variable p Nagelkerke R2
TEMP −0.041 0.003 0.555
PRECIP 0.016 0.008 0.346
SUIT 4.707 0.005 0.349
CONIFTR 3.307 0.030 0.216
CANCO_MES −9.299 0.011 0.342
BILBCO 9.629 0.003 0.522
3.3 Multivariate analysis
The four habitat parameters being significant in the univariate analysis were used in
any possible combination to build multivariate models (Table 4). The first four models
(Nr.1-4) only contain one variable and have already been part of the univariate
analysis (see chapter 3.2). Although they can be regarded as rather simple, they
were, however, included into the model selection by AIC. As recommended by
Mazerolle (2006) AIC and were used to select the best models. The models no. 3,
8, 10 and 14 (marked grey in Table 4) showed both a AIC < 2 and the highest
values. Therefore, they were considered to be the best models and the subject of
further analyses.
Table 4: 15 models, built with all possible combinations of the 4 significant variables from the
univariate analysis. Their AICc value, AIC and are displayed. The four best models are
highlighted in grey.
No. Model AICc ∆AIC ω
1 CONIFTR 39.717 10.810 0.0011
2 CANCO 35.768 6.867 0.0080
3 BILBCO 29.557 0.656 0.1794
4 SUIT 35.687 6.786 0.0084
5 CONIFTR+CANCO 35.705 6.804 0.0083
6 CONIFTR+BILBCO 31.589 2.688 0.0650
7 CONIFTR+SUIT 35.805 6.904 0.0079
8 CANCO+BILBCO 28.901 0 0.2491
9 CANCO+SUIT 34.719 5.818 0.0136
10 BILBCO+SUIT 29.549 0.648 0.1802
11 CONIFTR+CANCO+BILBCO 31.297 2.396 0.0752
12 CONIFTR+CANCO+SUIT 35.764 6.863 0.0081
13 CONIFTR+BILBCO+SUIT 31.888 2.987 0.0559
14 CANCO+BILBCO+SUIT 30.547 1.646 0.1094
15 CONIFTR+CANCO+BILBCO+SUIT 33.106 4.205 0.0304

24
Table 5 describes the best models obtained by the selection according to AIC. The
explanatory power of all four models is relatively high (0.522≤R2≤0.611) as are the
correct prediction rates (84.8 ‒ 87.9%). Out of the four initial parameters, the variable
“coniferous trees” does not occur any more in any of the four models. On the other
side, “bilberry cover” (BILBCO) is represented in each of them. Moreover, its
coefficient is always the largest one (7.499≤≤9.629) showing a strong positive
relation to Capercaillie occurrence.
Table 5: Results of the logistic regression models 3, 8, 10 and 14 with coefficients, standard
errors and P values. Moreover, the Nagelkerke R2 and the correct prediction rates of the four
models are reported.
Model Nr. R
2 Correct prediction Coefficients S.E. P
3 0.522 84.8 Intercept −3.413 1.085 0.002
BILBCO 9.629 3.19 0.003
8 0.593 87.9 Intercept 2.404 3.644 0.509
CANCO −6.453 4.134 0.119
BILBCO 8.128 3.289 0.013
10 0.578 84.8 Intercept −3.589 1.163 0.002
BILBCO 8.207 3.306 0.013
SUIT 3.045 2.048 0.137
14 0.611 87.9 Intercept 0.905 3.969 0.820
CANCOV −4.871 4.326 0.260
BILBCO 7.499 3.367 0.026
SUIT 1.989 2.283 0.384
The influence of the suitable surroundings is positive for the occurrence of
Capercaillies as well. In contrast, canopy cover shows a negative relation to
Capercaillie presence. However, only the variable bilberry cover contributes
significantly (p<0.05) to the models. The other two variables do not reach the
significance level in any of the four models (Table 5).

25
4. Discussion
This study shows that Capercaillie accepts treated forest patches already a few years
after forest measures have been conducted. On about one third of the 33 examined
forest patches evidence for use by the Capercaillie was found. The time period since
the intervention did not have an essential influence on Capercaillie presence.
Evidence was found both on patches with treatments dating from 2006 and on such
with interventions in 2009. Rudmann (2001) had similar experiences in the
Toggenburg region where treated forest patches were colonized already two years
after a treatment. Bollmann et al. (2008a) conclude that Capercaillie reacts to
changes in small-scaled forest structure. However, the way the preferred habitat
structure is achieved, whether naturally or by forest management, does not really
matter. Nevertheless, the applied measures in the forest reserve of Amden were
successful in the way that forest patches which, according to the method of Schroth
(1994) were classified as “unsuitable” or “less suitable” in 2006, were now accepted
as habitat.
Here the question arises whether the habitat structure on the treated forest patches
has changed so heavily in such a short period that it got suitable for the Capercaillie.
Or is it possible that the needs of this grouse species are not taken correctly into
consideration by the categories respectively the criteria of the habitat suitability map
after Schroth and, therefore, the map’s classification is not appropriate? This study
represents just a snapshot. Therefore, it cannot determine how much the habitat
structure on the examined forest patches has changed since the treatment was
conducted. A quantification of the change on the treated forest patches over time
requires several subsequent controls to build up a time series respectively at least a
second control for a proper comparison. In 2016 at the latest, within a comprehensive
assessment, a new suitability map shall reveal whether the treated patches have
improved as a habitat for the Capercaillie (Ehrbar et al., 2011).
The habitat suitability assessment with the Schroth method (Schroth, 1994) mainly
focuses on the needs of Capercaillie in the summer season: vital bilberry layer, good
cover, structure richness, edge lines and enough space to fly. According to Ehrbar et
al. (2011), the habitat suitability map was the only criterion for the selection of the
forest patches to be treated at the beginning of the project. Based only upon this
map, the interventions were conducted across the entire forest reserve. The species
survey (search for feathers) conducted within this study in August 2010 however
shows that the distribution of presence and absence patches does not follow the
same pattern of the interventions’ distribution. Patches with evidence of Capercaillie
were situated in distinctly higher locations (average of 1410 meters a.s.l.) than
patches without use (av. 1280 meters a.s.l.). This result is confirmed by the variables
temperature and precipitation. Both variables were highly correlated with altitude in
this study and, according to the regression analysis, were significantly interrelated
with the presence respectively absence of Capercaillie on the forest patches. The

26
variable “suitable surroundings” yielded results that should influence the planning of
coming interventions. On average, presence patches were surrounded by 18% of
suitable Capercaillie habitat, absence patches only by 3.3%. This variable was also
an essential predictor of Capercaillie occurrence in the regression analysis. These
results are interesting in two ways. On the one hand, they are an indication that the
mapping according to Schroth identifies the suitable Capercaillie habitat correctly.
Moreover, the knowledge about the positive relation between the proportion of
suitable surroundings and the occurrence probability of the Capercaillie on the forest
patches extends the application potential of the habitat suitability map. For the future
planning, not only the habitat suitability of the concerned forest patch but also the
suitability of its surroundings should be taken into consideration.
In presence patches, canopy cover amounted to 48% on average. This result agrees
with canopy cover values from other studies and opinions from experts (Klaus et al.,
1989; Storch, 1994; 2007; von Hessberg and Beierkuhnlein, 2000; Graf et al., 2007).
Bollmann et al. (2008a) defined a canopy cover between 30 and 70% (optimally 40-
60%) as one requirement for suitable Capercaillie habitat. Canopy cover on absence
patches was significantly higher (on average 70%), it lay at the upper end of the
recommended range. According to this thesis, logging as a treatment measure
seems to have the desired effect. However, an average value of 70% is distinctly
above the optimal range between 40 and 60%. Furthermore, some forest patches
showed canopy cover values up to 80% and so, clearly missed the optimum of the
cover range. For the Prealps, Graf et al. (2007) identified canopy cover as a
significant predictor for the occurrence of Capercaillie. They also interpret canopy
cover and its variation as an indicator for the proportion of inner edge lines. Based on
the regression analysis, this study also identified canopy cover as a crucial variable
for the occurrence of Capercaillies. According to the results, the probability of
occurrence considerably increases with decreasing canopy cover. The relationship
between canopy cover and edge lines was not part of the analysis in this thesis. The
assumption of Graf et al. (2007) appears to be plausible though. Due to increased
incidence of light a low canopy cover positively influences the proportion of edge
lines within the forest stand.
Total stem number was not a significant predictor for Capercaillie habitat use. This is
somewhat surprising as Imhof (2007) argues that there is a relationship between
canopy cover, stem number and maneuverability in flight within the patch: The larger
the stem number, the higher the canopy cover, the worse the maneuverability in flight
for the Capercaillie. Supporting Imhof’s statement, this study found a positive relation
between canopy cover and stem number as well (Pearson correlation = 0.555).
However, total stem number could not be confirmed as an important predictor.
According to observations during the field season, one explanation could be that
logging was not conducted evenly across the entire selected forest patch.
Sometimes, it happened clumped so that aisles or corridors were cut out.
Capercaillies use them for starting and landing and as an escape route as well (Lanz
and Bollmann, 2008). Therefore, as long as forest aisles were available, even forest

27
patches with a relatively high tree density could be flown and used by the
Capercaillie. The range of stem numbers on presence patches from 15 to 58 trees is
another indication that not the mere number but the spatial stem distribution is
decisive.
Bilberry cover turned out to be the major determinant for the occurrence of
Capercaillie on the treated forest patches. The four best models of the multivariate
regression analysis retained bilberry cover as a significant and the most powerful
predictor. The importance of bilberry for the Capercaillie as food during the
vegetation period is well-known (Klaus et al., 1989). A well-developed bilberry layer
provides this grouse species with both an energy-rich food source and cover on the
ground (Storch, 1993). This vegetation type is often also rich in invertebrates, which
are the primary diet of the chicks (Atlegrim and Sjöberg, 1995; Wegge et al., 2005;
Wegge and Kastdalen, 2008). In their spring habitat model for Capercaillie in the
Central Alps, Bollmann et al. (2005) could not retain bilberry cover as an explanatory
variable. They concluded that the occurrence of Capercaillie in spring is not bound to
a minimal degree of bilberry cover. Rolstad et al. (1988) observed that the use of
forest stands in a stadium of late succession by Capercaillie increased gradually
during the summer, probably related to the increasing importance of the associated
well-growing bilberry as a food source. In addition to the season, regional factors
seem to play a role as well. Research from Bollmann et al. (2005; 2008a) in several
study areas in the Swiss Alps about the small-scale habitat use of the Capercaillie did
not show bilberry as a significant explanatory variable although Capercaillie occurred
there as well. A reason for that may be that in the Central Alps, the proportion of
subalpine forests is higher than in the Prealps. Subalpine forests generally show a
lower productivity resulting in a lower stem density (Brassel and Brändli, 1999). It is
assumed that this open forest structure allows the development of a distinct ground
vegetation whose dwarf shrubs and herbaceous plants (e.g. Melampyrum sp.
(Friedrich, 2006)) might compensate the rare bilberry occurrence (Bollmann et al.,
2005; 2008a). Bilberry rather occurs in higher abundance in the more productive
upper montane coniferous forests like those widely distributed in the Prealps
(Bollmann et al., 2005). This study can confirm this statement by having identified
bilberry as a predictor for the occurrence of the Capercaillie in the Amden forest
reserve during the breeding season. Baines et al. (2004) showed a positive
relationship between bilberry cover and Capercaillie breeding success. Bollmann et
al. (2008a) propose an extensive bilberry cover as an essential habitat element for
the species’ management. Regarding bilberry cover in the forest reserve Amden, the
differences between the examined forest patches were striking. Presence patches
showed a mean value of 20.6%, which is quite satisfactory and lies in the range of a
“well suitable” habitat according to the method of Schroth (1994). The increased
incidence of light, which is attributable to the conducted logging, seems to favor
bilberry growth on these forest patches. On the other side, the average value of
bilberry cover on absence patches was substantially lower (4.2%). Apparently, on
these sites the conducted measures have not had the desired effect (yet).

28
Bilberry grows preferentially on acidic and nutrient-poor soils (Ott et al., 1997; Grey-
Wilson, 2006). These conditions can be found in spruce and fir-spruce forests of the
subalpine and upper montane vegetation zones so that bilberry is mainly associated
with them (Ott et al., 1997; Rudmann, 2001). Bilberry is not so abundant in the lower
situated montane fir-beech forests. Often, extensive beech regeneration inhibits the
development of a herbaceous layer and the development of bilberry. In terms of area,
especially the upper montane fir-spruce forests as well as the montane fir-beech
forests are important for the Amden forest reserve. This study shows that forest
patches with a high proportion of coniferous trees were preferably used by the
Capercaillie. Presence patches contained a significantly higher percentage of
conifers than absence patches. The proportion of coniferous trees was not retained
by the final model of the multivariate analysis. However, the regression analysis of
the single variable showed a significant positive relationship between the proportion
of conifers and the occurrence probability of Capercaillie. Evidence suggests that, for
the conservation of Capercaillie in the Amden forest reserve, the focus for habitat
measures should be on the upper montane fir-spruce forests. According to the
experiences of Rudmann (2001), forest sites of the upper montane zone can reach
good habitat suitability after silvicultural measures have been conducted, while
montane fir-beech forests rather lack this ability. Since a well-developed bilberry
cover is the main criterion to distinguish Schroth classes (Schroth, 1994), Rudmann’s
perception makes sense.
Fir-beech forests not only have shortcomings concerning habitat suitability, it also
appears that silvicultural measures do no attain the same strong and temporally
persistent effect as in fir-spruce forests. Both beech and sycamore maple were
significantly more numerous on absence patches. Observations during the field work
indicate that beech and maple trees in the middle and the upper layer close gaps in
the canopy, which were caused by the logging, already after a few years. This
perception is corroborated by Ott et al. (1997). Therefore, an increased incidence of
light on the forest ground is provided for just a short time. Probably, it is too short for
an extensive herbaceous layer and a sufficient amount of bilberry to develop.
However, if an intervention of greater dimension is conducted to get larger gaps,
beech regeneration arises extensively and inhibits the development of lush ground
vegetation as well. Moreover, dense beech regeneration in the shrub layer can
heavily restrict mobility and maneuverability of the Capercaillie (Bollmann et al.,
2008a). Experiences from the Toggenburg point out that, without regular tending,
forest sites with fast regeneration of beech retransformed again to unsuitable habitat
in a short time (Rudmann, 2001).
Discussion of methodology
This master thesis presents the first assessment of the impact of forest measures to
improve habitat suitability in the special forest reserve of Amden. Of course, the
selection and treatment of the patches has been conducted from a forest

29
management perspective. The challenge for this study was to develop a design,
which applies to the variety of treated patches in the sense of size, location and
forest structure. In this work, the study patches were not freely selectable according
to scientific criteria, but corresponded in form and composition to the management
plan of the forestry of Amden. Solely, the number of patches to be examined was
self-defined. For reason of time limitation, a complete assessment of all treated forest
patches was not realizable. The part of the forest reserve within the catchment area
of the river Linth was neglected in this study. As already mentioned, regular habitat
use in summer by the Capercaillie has not been recorded there for 10 years.
Therefore, this stratification was considered to be appropriate. Out of the remaining
patch set, all patches where logging has been conducted were deliberately chosen,
since this is the primary thinning measure. The area of the 33 studied forest patches
represents with 57.6 hectares more than a third of the total area that was treated until
2009. Therefore, the obtained findings and the derived recommendations should be
relevant for the entire special forest reserve of Amden.
For the assessment of forest stand variables, a plot size of 30 m x 30 m proved to be
very suitable. On the one hand, the plot was sufficiently large to describe the
character as well as the structure of a forest stand appropriately (Bollmann et al.,
2005). On the other hand, the survey was still feasible with an acceptable
expenditure of time. Furthermore, this plot size allowed integrating smaller forest
patches into the study as well. The set of forest stand variables that were recorded
and analyzed consist on one side of parameters induced by Capercaillie ecology
(e.g. proportion of conifers, ground vegetation cover). On the other side, parameters
were included which, to my knowledge, have been hardly surveyed for Capercaillie
research but were relevant more often in studies linked to forest ecology (e.g. basal
area or importance value). Previous studies related to Capercaillie research have
already conducted assessments of forest stand variables (e.g. Picozzi et al., 1992;
Bollmann et al., 2005). However, this work, with its standardized and systematically
conducted survey together with the broad range of recorded parameters, strongly
based on the practical orientated forestry, may still extend the perspective of
Capercaillie experts and conservationists. For instance, a full callipering to survey a
forest stand is an established methodology among foresters but bridging the gap to
Capercaillie ecology is a recent approach.
The description and characterization of the treated forest patches on the basis of
sampling plots was quite a challenge. Ideally, the number of sampling plots per forest
patch would have been proportional to patch size. But the required number of
sampling plots would have been too large for this master thesis. Therefore, the forest
patches had to be grouped into size categories and attributed with a limited number
of sampling plots. Although, some forest patches may not have been recorded in all
their heterogeneity, this approach should still guarantee an appropriate
representation.

30
The search for feathers proved to be a suitable methodology to find evidence of
Capercaillie in summer. In winter, the search for droppings is an effective way, when
the dark dropping is easily detectable on the frozen, white snow layer (Klaus et al.,
1989; Imhof, 2007). However, in the summer season, droppings are hard to detect
within the ground vegetation, while feathers lie normally on the vegetation. The
systematic search within predefined raster squares was time consuming, but on the
other side, a rigorous cover in terms of surface area was ensured. Raster squares of
50m x 50m were large enough to allow the use of a GPS with an inaccuracy of a few
meters for orientation. On the other side, the raster square size still allowed to keep
an overview about all structural elements within it and to search them properly.
The classification of the treated forest patches into presence and absence patches
carried the risk that, by mistake, a forest patch was declared an absence patch
although it was used as a habitat by the Capercaillie. During the field work, the
experience was made that feathers were mainly found around the structural elements
that were already mentioned. These structural elements were checked on every
forest patch with the same thoroughness. It can be assumed that feathers would
have been found, if they had been there. Therefore, the risk of misclassification
seems to be very low.
The number of examined treated forest patches represents the entire treated area of
the reserve very well. However, statistically a sampling size of 33 is relatively small.
This had consequences for the variable analysis. According to Harrell et al. (cited in:
Guisan and Zimmermann, 2000) not more than n/10 predictors should be retained in
the final model whereas n is the number of samplings. The reduction of the
explanatory variables was therefore consequently conducted. Moreover, the site
parameters were not integrated into the multivariate analysis although they certainly
have an explanatory potential and are important for principal management decisions
in the special forest reserve of Amden. For the variable reduction, instead of an
univariate approach, variables could have been selected from functional groups e.g.
groups of need like food, cover, roosting. The univariate approach was chosen
because it is conducted unbiased by any previous knowledge or expectations and
mitigates the risk of losing an important parameter in this stage of the analysis.
The final models point out the crucial factors for Capercaillie occurrence on the
treated forest patches. However, an interpretation has to be done carefully because a
model validation was not possible due to the lack of similar data from other study
areas or forest reserves.
Outlook
A comprehensive assessment of the forest reserve is planned for 2016 including
several different surveys and controls: an effect analysis on the indicator plots, a
control of the habitat suitability, an analysis of Capercaillie distribution in the forest
reserve and population estimates (Ehrbar et al., 2011). Besides broad investigations

31
like in 2016, subsequent studies are necessary for a continuous control of treated
forest stands and their use by the Capercaillie. A quantification of structure changes
on the forest patches would be possible with a series of controls existing. The
controls provide the forest management with valuable feedbacks about efficiency and
effect of their conducted measures. Changes or adaptations to the management plan
could be done swiftly and flexibly.
Concern is growing about a lack of Capercaillie leks in the special forest reserve of
Amden. At least for now, there is no knowledge about leks which are actively used
(R.Ehrbar, pers. comm.). Research is necessary to localize and protect possibly still
existing leks.
The trade-off of forest roads for the Capercaillie should be part of closer investigation.
Forest roads play a controversial role since their use by the foresters for habitat
improvement is on one side beneficial for the Capercaillie. On the other side, these
roads are also used for recreational activities e.g. hiking, biking or snowshoeing.
Capercaillies are susceptible to human disturbances both in summer and winter
(Storch, 1999; Thiel et al., 2008). It would be interesting to assess how much these
human activities influence the occurrence of Capercaillie in the forest reserve of
Amden and whether there is a threshold of minimal distance between their habitat
and infrastructural facilities such as forest roads.

32
5. Implications for the management of the special forest
reserve of Amden
If conservation of the Capercaillie is expected to be successful, its preferred habitat
has to be conserved and extended in the vicinity of occupied habitat patches (Storch,
1994; Bollmann et al., 2008c; Mollet et al., 2008). This study showed that
Capercaillies favor restored habitat patches in coniferous forests with an intermediate
canopy cover and a rich layer of bilberry. Logging is a promising measure, since
forest stands are thinned and canopy cover therefore decreased. This causes the
amount of light reaching the ground to increase, stimulating the development of rich
ground vegetation. Forestry practitioners of Amden successfully treated forest
patches to improve the habitat quality. This thesis showed that a third of the
examined forest patches were used by the Capercaillie after the treatment within the
first years. The results further show that the habitat suitability map is a useful and
valid tool to set priorities and to select forest patches to be treated. However, the
results suggest that it should not be the only selection factor. So far treated forest
patches were distributed across the entire forest reserve. This thesis recommends a
more selective approach, since upper montane fir-spruce forests turned out to be
more promising for Capercaillie conservation than the montane fir-beech forests.
Forest managers should focus on these coniferous forests since they are often
associated with bilberry. The effect of logging lasts longer than in montane fir-beech
forests where measures need to be conducted repeatedly and are, therefore, more
expensive. Moreover, new treatments should be done in vicinity to forest patches that
are already suitable habitat for Capercaillie. Consequently, conservation measures
are better to be focused on a particular altitudinal belt of the special forest reserve
Amden. The advantage is that existing contiguous areas of good habitat quality are
extended and, at the same time, new forest patches are turned into suitable
Capercaillie habitat with increased efficiency.

33
Acknowledgements
I would like to thank Kurt Bollmann for his competent and motivating support
throughout my entire master thesis. I was lucky to have had a supervisor with so
much dedication and willingness to give advice whenever a question came up. My
advisor Harald Bugmann showed large interest in the thesis’ procedure and gave me
valuable and constructive feedbacks. Rolf Ehrbar was my contact to the special
forest reserve of Amden and provided me with the forest stand data and the
management plan. My fellow students Lukas Glanzmann and Tobias Tschopp did not
hesitate to assist me during the physically demanding assessment of the forest stand
variables. Raffael Winkler from the natural history museum of Basel gave feedback
about some feathers that were hard to identify. Adrian Lanz at WSL gave me useful
tips for the statistical analysis. I specially thank Jim Comiskey from the U.S. National
Park Service’s Mid-Atlantic Network and Ellen Ferrante from the U.S. National
Science Foundation for proofreading my work.

34
References Akaike, H. (1974). New look at statistical-model identification. IEEE Trans. Autom.
Control AC 19, 716-723.
Atlegrim, O., Sjöberg, K. (1995). Lepidoptera larvae as food for capercaillie chick (Tetrao urogallus): a field experiment. Scandinavian Journal of Forest Research 10, 278-283.
Baines, D., Moss, R., Dugan, D. (2004). Capercaillie breeding success in relation to forest habitat and predator abundance. J. Appl. Ecol. 41, 59-71.
Barker, J.R., Ringold, P.L., Bollman, M. (2002). Patterns of tree dominance in coniferous riparian forests. For. Ecol. Manage. 166, 311-329.
Bollmann, K. (2006). Das Auerhuhn: imposant und gefährdet. In: Ehrbar, R. (Ed.), Veränderungen als Chance für den Wald: Ortsgemeinde Amden. Sophie und Karl Binding Stiftung, Basel, pp. 200–221.
Bollmann, K., Friedrich, A., Fritsche, B., Graf, R.F., Imhof, S., Weibel, P. (2008a). Kleinräumige Habitatnutzung des Auerhuhns im Alpenraum. Der Ornithologische Beobachter 105, 53-61.
Bollmann, K., Graf, R.F. (2008). Der Einfluss von Lebensraumangebot und -fragmentierung auf die Verbreitung von Lokalpopulationen. Der Ornithologische Beobachter 105, 45-52.
Bollmann, K., Graf, R.F., Debrunner, R., Suter, W. (2004). The capercaillie as indicator of high species richness: potential and limitations of the umbrella species concept. In: Smithers, R. (Ed.), 12th annual IALE(UK) conference "Landscape ecology of trees and forests". Woodland Trust, Cirencester, UK, pp. 200–207.
Bollmann, K., Graf, R.F., Jacob, G., Thiel, D. (2008b). Von der Forschung zur Auerhuhnförderung: eine Projektsynthese. Der Ornithologische Beobachter 105, 107-116.
Bollmann, K., Graf, R.F., Suter, W. (in press). Quantitative predictions for patch occupancy of capercaillie in fragmented habitats. Ecography.
Bollmann, K., Perrin, N., Jenni, L., Suter, W. (2008c). Naturschutzforschung am Auerhuhn in der Schweiz: eine Übersicht. Der Ornithologische Beobachter 105, 5-16.
Bollmann, K., Weibel, P., Graf, R.F. (2005). An analysis of central Alpine capercaillie spring habitat at the forest stand scale. For. Ecol. Manage. 215, 307-318.
Brändli, U.-B. (2010). Schweizerisches Landesforstinventar. Ergebnisse der dritten Erhebung 2004-2006. Eidgenössische Forschungsanstalt für Wald, Schnee und Landschaft, Bundesamt für Umwelt (BAFU), Birmensdorf, Bern.
Brassel, P., Brändli, U.-B. (1999). Schweizerisches Landesforstinventar. Ergebnisse der Zweitaufnahme 1993-1995. Eidgenössische Forschungsanstalt für Wald, Schnee und Landschaft, Bundesamt für Umwelt, Wald und Landschaft, Birmensdorf, Bern.
Bruderer, B., Thönen, W. (1977). Rote Liste der gefährdeten und seltenen Vogelarten der Schweiz. Schweizerisches Landeskomitee für Vogelschutz und Schweizerische Vogelwarte, Sempach.

35
Brülisauer, A. (2006). Die Moore von Amden. In: Ehrbar, R. (Ed.), Veränderungen als Chance für den Wald: Ortsgemeinde Amden. Sophie und Karl Binding Stiftung, Basel, pp. 76-87.
Bürgi, M. (1997). Waldentwicklung im 19. und 20. Jahrhundert. Veränderungen in der Nutzung und Bewirtschaftung des Waldes und seiner Eigenschaften als Habitat am Beispiel der öffentlichen Waldungen im Zürcher Unter- und Weinland von Matthias Bürgi. PhD thesis, Swiss Federal Institute of Technology ETH Zurich, Zurich.
Bürgi, M. (1999). A case study of forest change in the Swiss lowlands. Landscape Ecology 14, 567-576.
Ehrbar, R., Bollmann, K., Mollet, P. (2011). Ein Sonderwaldreservat für das Auerhuhn - das Beispiel Amden (Kanton St.Gallen). Schweizerische Zeitschrift für Forstwesen 162, 11-21.
Eiberle, K. (1974). Waldkundliche Aspekte der Forschung an Rauhfusshühnern. Schweizerische Zeitschrift für das Forstwesen 125, 147–170.
Erritzoe, J., Kampp, K., Winker, K., Frith, C.B. (2007). The Ornithologist's Dictionary. Lynx Edicions, Barcelona.
Fielding, A.H., Haworth, P.F. (1995). Testing the generality of bird-habitat models. Conservation Biology 9, 1466-1481.
Fowler, J., Cohen, L. (1990). Practical Statistics for Field Biology. Wiley, Chichester.
Frehner, M., Wasser, B., Schwitter, R. (2005). Nachhaltigkeit und Erfolgskontrolle im Schutzwald. Wegleitung für Pflegemassnahmen in Wäldern mit Schutzfunktion, Vollzug Umwelt. Bundesamt für Umwelt, Wald und Landschaft, Bern.
Friedrich, A. (2006). Das Auerhuhn in Mittelbünden: Verbreitung und geschlechterspezifische Nutzung des Lebensraums im Sommer. Master thesis, Swiss Federal Institute of Technology Zurich ETH, Zurich.
Fürer, D. (2001). Wie weit kann die Auerhuhn-Lebensraumkartierung durch die Analyse der bestandes- und pflanzensoziologischen Karte ersetzt werden?- Fallbeispiel Amden (SG). Diploma thesis, Swiss Federal Institute of Technology ETH Zurich, Zurich.
Gjerde, I., Wegge, P. (1987). Activity patterns of Capercaillie, Tetrao urogallus, during winter. Ecography 10, 286-293.
Glutz von Blotzheim, U.N., Bauer, K.M., Bezzel, E. (1973). Handbuch der Vögel Mitteleuropas, Band 5: Galliformes und Gruiformes. Akademische Verlagsgesellschaft, Wiesbaden.
Gotelli, N.J., Ellison, A.M. (2004). A Primer of Ecological Statistics. Sinauer, Sunderland, Massachusetts, USA.
Graf, R.F., Bollmann, K., Bugmann, H., Suter, W. (2007). Forest and landscape structure as predictors of capercaillie occurrence. J. Wildl. Manage. 71, 356-365.
Graf, R.F., Bollmann, K., Suter, W., Bugmann, H. (2004). Using a multi-scale model for identifying priority areas in capercaillie (Tetrao urogallus) conservation. IALE (UK), INT ASSOC LANDSCAPEECOL, Lymm.

36
Grey-Wilson, C. (2006). Wildpflanzen. Dorling Kindersley, Starnberg.
Guisan, A., Zimmermann, N.E. (2000). Predictive habitat distribution models in ecology. Ecol. Model. 135, 147-186.
Hosmer, D.W.J., Lemeshow, S. (2000). Applied Logistic Regression. Wiley, New York.
Imhof, S. (2007). Verbreitung und Habitatnutzung des Auerhuhns im Waldreservat Amden. Master thesis, University of Zurich, Zurich.
Jacob, G. (2006). Conservation Genetics of the Capercaillie (Tetrao urogallus) in the Swiss Alps. PhD thesis, University of Zurich, Zurich.
Keller, M. (Ed.). (2005). Schweizerisches Landesforstinventar. Anleitung für die Feldaufnahmen der Erhebung 2004 - 2007. Eidg. Forschungsanstalt WSL, Birmensdorf.
Keller, V., Gerber, A., Schmid, H., Volet, B., Zbinden, N. (2010). Rote Liste Brutvögel. Gefährdete Arten der Schweiz, Stand 2010. Bundesamt für Umwelt BAFU, Schweizerische Vogelwarte, Bern, Sempach.
Klaus, S., Andreev, A.V., Bergmann, H.-H., Müller, F., Porkert, J., Wiesner, J. (1989). Die Auerhühner. A. Ziemsen Verlag, Wittenberg Lutherstadt.
Kormann, U. (2009). Landscape genetics in Capercaillie (Tetrao urogallus L.): Combining direct and indirect methods to quantify dispersal and functional connectivity in a mountain landscape. Master thesis, University of Bern, Bern.
Küchli, C. (1997). Wälder der Hoffnung. Verlag Neue Zürcher Zeitung, Zurich.
Kuers, K. (2005, 25 July). "Ranking Species Contribution to Forest Community Composition: Calculation of Importance Values." Retrieved 3rd of January 2011, from http://www.sewanee.edu/Forestry_Geology/watershed_web/Emanuel/ImportanceValues/ImpVal_SET.html.
Kumar, L., Skidmore, A.K., Knowles, E. (1997). Modelling topographic variation in solar radiation in a GIS environment. Int. J. Geogr. Inf. Sci. 11, 475-497.
Lanz, M., Bollmann, K. (2008). Eigenschaften der Schlaf-, Ruhe- und Äsungsbäume des Auerhuhns Tetrao urogallus im Waldreservat Amden. Der Ornithologische Beobachter 105, 63-75.
Maumary, L., Vallotton, L., Knaus, P. (2007). Die Vögel der Schweiz. Schweizerische Vogelwarte, Nos Oiseaux, Sempach, Montmollin.
Mazerolle, M.J. (2006). Improving data analysis in herpetology: using Akaike's Information Criterion (AIC) to assess the strength of biological hypotheses. Amphibia-Reptilia, 169-180.
Mollet, P., Badilatti, B., Bollmann, K., Graf, R.F., Hess, R., Jenny, H., Mulhauser, B., Perrenoud, A., Rudmann, F., Sachot, S., Studer, J. (2003). Verbreitung und Bestand des Auerhuhns Tetrao urogallus in der Schweiz 2001 und ihre Veränderungen im 19. und 20. Jahrhundert. Der Ornithologische Beobachter 100, 67-86.
Mollet, P., Bollmann, K. (2009). Sonderwaldreservat Amden SG - Ermittlung der Auerhuhn-Verbreitung auf Schlagflächen 2009. Swiss Ornithological Institute, Sempach.
37
Mollet, P., Marti, C. (2001). Auerhuhn und Waldbewirtschaftung. BUWAL, Vollzug Umwelt, pp. 21.
Mollet, P., Stadler, B., Bollmann, K. (2008). Aktionsplan Auerhuhn Schweiz. Bundesamt für Umwelt BAFU, Schweizerische Vogelwarte, Schweizer Vogelschutz SVS/BirdLife Schweiz, Bern.
Östlund, L., Zackrisson, O., Axelsson, A.-L. (1997). The history and transformation of a Scandinavian boreal forest landscape since the 19th century. Canadian Journal of Forest Research, 1198 - 1206.
Ott, E., Frehner, M., Frey, H.-U., Lüscher, P. (1997). Gebirgsnadelwälder: Ein praxisorientierter Leitfaden für eine standortgerechte Waldbehandlung. Haupt, Bern.
Pakkala, T., Pelikka, J., Linden, H. (2003). Capercaillie Tetrao urogallus - a good candidate for an umbrella species in taiga forests. Wildlife Biology 9, 309-316.
Picozzi, N., Catt, D.C., Moss, R. (1992). Evaluation of Capercaillie habitat. J. Appl. Ecol. 29, 751-762.
Roberge, J.-M., Angelstam, P. (2004). Usefulness of the umbrella species concept as an conservation tool. Conservation Biology 18, 76-85.
Rolstad, J., Wegge, P. (1987). Distribution and size of capercaillie leks in relation to old forest fragmentation. Oecologia 72, 389–394.
Rolstad, J., Wegge, P., Larsen, B.B. (1988). Spacing and habitat use of Capercaillie during summer. Can. J. Zool.-Rev. Can. Zool. 66, 670-679.
Rudmann, F. (2001). 26 Jahre Auerhuhnschutz im Forstkreis Toggenburg, Kanton St. Gallen. Schweizerische Zeitschrift für Forstwesen 152, 305–311.
Schäublin, S., Bollmann, K. (2011). Winter habitat selection and conservation of Hazel Grouse (Bonasa bonasia) in mountain forests. Journal of Ornithology 152, 179-192.
Schroth, K.-E. (1994). Zum Lebensraum des Auerhuhns (Tetrao urogallus L.) im Nordschwarzwald. Mitteilungen der Forstlichen Versuchs- und Forschungsanstalt Baden-Württemberg 178, pp. 133.
Segelbacher, G., Storch, I. (2002). Capercaillie in the Alps: genetic evidence of metapopulation structure and population decline. Molecular Ecology 11, 1669-1677.
Stadler, B., Schnidrig, R., Mollet, P., Spaar, R., Rehsteiner, U., Bollmann, K. (2008). Der Aktionsplan Auerhuhn Schweiz - Die nationale Strategie zum Schutz und zur Förderung des Auerhuhns Tetrao urogallus in der Schweiz. Der Ornithologische Beobachter 105, 117-121.
Storch, I. (1993). Habitat selection by Capercaillie in summer and autumn - Is bilberry important? Oecologia 95, 257-265.
Storch, I. (1994). Habitat and survival of capercaillie Tetrao urogallus nests and broods in the Bavarian Alps. Biological Conservation 70, 237–243.
Storch, I. (1995). Annual home ranges and spacing patterns of Capercaillie in Central Europe. J. Wildl. Manage. 59, 392-400.
Storch, I. (1999). AUERHUHNSCHUTZ: Aber wie? Wildbiologische Gesellschaft München e.V., pp. 43.

38
Storch, I. (Ed.). (2007). Grouse: Status Survey and Conservation Action Plan 2006–2010. WPA/BirdLife/SSC Grouse Specialist Group. IUCN, Gland, Switzerland and Fordingbridge, UK and the World Pheasant Association, Reading, UK.
Suter, W., Graf, R.F., Hess, R. (2002). Capercaillie (Tetrao urogallus) and Avian Biodiversity: Testing the Umbrella-Species Concept. Conservation Biology 16, 778-788.
swisstopo. (2010). digital elevation model (dhm25). Federal Office of Topography, Wabern.
Thiel, D., Jenni-Eiermann, S., Jenni, L. (2008). Der Einfluss von Freizeitaktivitäten auf das Fluchtverhalten, die Raumnutzung und die Stressphysiologie des Auerhuhns Tetrao urogallus. Der Ornithologische Beobachter 105, 85-96.
von Hessberg, A., Beierkuhnlein, C. (2000). Vegetationsstrukturen in den Habitaten des Auerhuhns Tetrao urogallus im Fichtelgebirge. Ornithologischer Anzeiger 39, 159–174.
Wegge, P., Kastdalen, L. (2008). Habitat and diet of young grouse broods: resource partitioning between Capercaillie (Tetrao urogallus) and Black Grouse (Tetrao tetrix) in boreal forests. Journal of Ornithology 149, 237-244.
Wegge, P., Olstad, T., Gregersen, H., Hjeljord, O., Sivkov, A.V. (2005). Capercaillie broods in pristine boreal forest in northwestern Russia: the importance of insects and cover in habitat selection. Can. J. Zool.-Rev. Can. Zool. 83, 1547-1555.
Zimmermann, N.E., Kienast, F. (1999). Predictive mapping of alpine grasslands in Switzerland: Species versus community approach. Journal of Vegetation Science 10, 469-482.
Zimmermann, N.E., Roberts, D.W. (2001). Final report of the MLP climate and biophysical mapping project. Scientific project report. Swiss Federal Institute for Forest, Snow and Landscape Research WSL, Birmensdorf.

39
Appendix
Appendix A: Small-scaled habitat requirements of the Capercaillie
Appendix B: Distribution of the Capercaillie in Switzerland in 2001
Appendix C: Form for cover measurement / Sampling plot structure
Appendix D: Main form for the assessment of forest stand variables
Appendix E: Form for callipering
Appendix F: Capercaillie feathers
Appendix G: Some impressions of examined forest patches

40
Appendix A: Small-scaled habitat requirements of the Capercaillie
(Mollet and Marti, 2001)
Appendix B: Distribution of the Capercaillie in Switzerland in 2001
(Mollet et al., 2008) (The distribution areas are black shaded and
insuperable zones grey marked.)
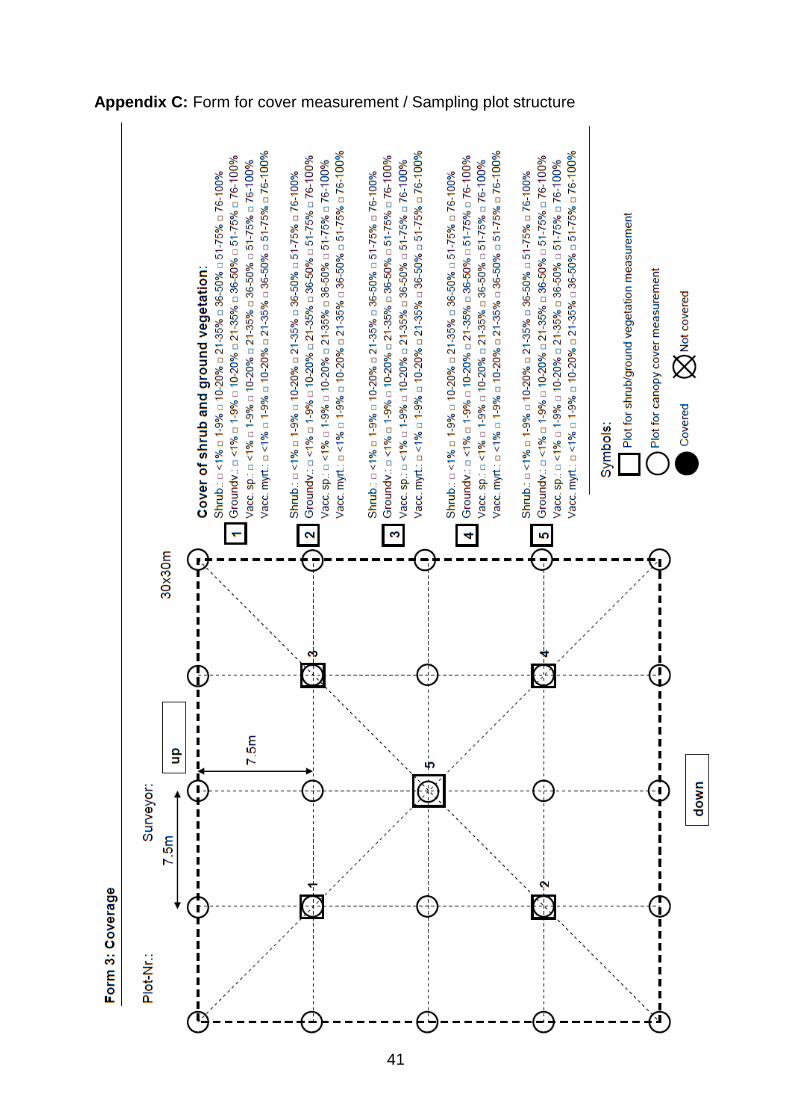
41
Appendix C: Form for cover measurement / Sampling plot structure

42
Appendix D: Main form for the assessment of forest stand variables

43
Appendix E: Form for callipering

44
Appendix F: Capercaillie feathers (Klaus et al., 1989)
Feathers of the Capercaillie cock
44

45
Feathers of the Capercaillie hen

46
Appendix G: Some impressions of examined forest patches (Photos by Nicolas
Bircher)

47