Performance*Measurementfor*the* Healthcare*Supply*Chain...
72
Performance Measurement for the Healthcare Supply Chain & the Requirements of Hospital A;esta<ons under the BPSAA
Transcript of Performance*Measurementfor*the* Healthcare*Supply*Chain...

Performance Measurement for the Healthcare Supply Chain & the
Requirements of Hospital A;esta<ons under the BPSAA

1. Welcome & Introduc<ons
2. What is performance measurement?
3. How do you implement good prac<ces to measure your organiza<ons
performance?
4. Performance Measurement
1. Defini<on 2. KPI’s / Performance metrics 3. Matching Service Levels with Performance Metrics 4. Performance Metrics Measurement Reports
5. Accountability Framework
1. Hospital A;esta<ons 2. What your CEO needs to know
Agenda

• 09:00 to 09:15 Introduc<ons
• 09:15 to 10:15 Performance Measurement
• 10:20 to 10:35 Break
• 10:35 to 11:10 Scorecards
• 11:10 to 11:45 BPSAA A;esta<ons
• 11:45 to 12:00 Wrap Up / Ques<ons
Outline

To achieve supply chain excellence, hospitals need to: • Establish and adhere to documented opera<ng standards; • Establish an organiza<onal structure with commi;ed
resources and clear roles and responsibili<es to support this informa<on;
• Establish specific performance metrics; and • Measure and access current performance against established
benchmarks. *Performance Measurement Phase II-‐ A framework for Ac<on
Supply Chain Excellence*

Making Supply Chain Strategic – Last stage ensure best value for the organiza<on
Shid focus from employees on transac<onal competence to strategic excellence.

• Under the sponsorship of OntarioBuys, the Hospital Supply Chain Working Group was established in November 2005 with the purpose of developing a vision and measurement framework to support improvements in supply chain capability across the Ontario Healthcare sector.
• A key part of this project was the iden<fica<on and development of a set of metrics which could be adopted consistently across the Province and used as a baseline for measuring performance.
• SUPPLY CHAIN VISION “Contribu)ng to the highest standard of pa)ent care through
comprehensive supply chain excellence”
Supply Chain Metrics Working Group

• 2006 – Phase I report-‐ set out key performance metrics standards and a framework 48 metrics & 21 standards
• January 2009 – Phase II report and user guide expand on core metrics to supply chain transac<onal efficiency -‐ 20 metrics and 12 standards – a sub set of first report
• November 2009 – Phase III readiness assessment • 2010 – Supply Chain Guidelines • 2011 – Broader Public Sector Procurement Direc<ves Copies of the reports and user guides are available through BPS Supply chain secretariat. • h;p://www.doingbusiness.mgs.gov.on.ca/mbs/psb/psb.nsf/A;achments/BPSBPerformanceMetrics-‐Report-‐
pdf-‐eng/$FILE/BPSBPerformanceMetrics-‐Report-‐eng.pdf
Performance Measurement Background

Performance Measurement Background
• Recommenda<ons from Working Group: – Most hospitals have not implemented metrics – The addi<on, dele<on and modifica<on of a number of metrics was recommended
– Need to consider conduc<ng peer to peer benchmarking to provide meaningful results
– Implemen<ng will be resource intensive if not impossible in some ins<tu<ons

Guiding Principles Relevance: Is the measure relevant to the organizaGons performance goals? Validity: Does the measure actually measure what it is suppose to? AKribuGon: Does it relate to factors that decision makers can affect? Clarity: Is it understandable? Accuracy: Does it provide correct informaGon in accordance with accepted standards? Comparability: Can the data be used to make comparisons (over Gme/similar acGviGes) Consistency: Does it relate to the same factors in all cases at all Gmes? Timeliness: Can data be collected & processed within a useful Gmeframe? Cost: Is its value greater than the data collecGon costs?

• Why keep score at a ball game?
• Why do engineers concern themselves with tolerances?
• Why do we manage an earning statement? • Why do we track supplier quality?
To Improve performance toward a goal
Why Measure?

How to implement: – Adopt metrics framework in principle-‐ execu<ve champion – Evaluate current state of your supply chain – Assess which metrics are in place today in your organiza<on – Assess which ones you would like to measure (can you measure)-‐manually/automated
– Create a baseline – Put measures in place, – Implement – Build upon moving to next level.
Metrics: how do we measure, track and report

• Goal Awareness (Why are we doing what we are doing?)
• Goal Alignment (Do I care? Intrinsic & personal)
• Role Defini<on (How do I contribute and add value?)
• Resource Availability (Do I have the tools? Physical & Intellectual?)
What it takes to get from have to, to want to:

Performance Measurement & Review
• Internal – Target seong – Measurement & repor<ng – Benchmarking
• External – Key rela<onships – Con<nuous improvement models – Benchmarking

A good measure is……….
– aligned to long term business objec<ves – has a long ‘shelf life’ (measures key areas of on-‐going day to day ac<vity) – monitors trends and provides data for benchmarking ‘value’ – cheap to collect / prepare / report – ra<onal / repeatable / consistent / reliable – not easily manipulated – easy to understand / interpret – makes it easy to determine what should be done next – encourages desirable behaviours / ac<vi<es – achievable
How do we idenGfy a “Good” measure? A measure is ...
“a basis for comparison; a reference point against which other things can be evaluated”

Performance Measurement
Target setting Performance measurement
Performance improvement
• With consistent measurement we will drive world class performance and con<nuously improve
Why?
• This performance informa<on is also essen<al in demonstraGng value
delivery to our customers

Performance Measurement
Directly affects bo;om line, e.g. reduced manpower, reduced specific cost elements
Indirectly affects bo;om line, e.g. <me savings, faster cycle <me, do it once for Global re-‐use
Strategic benefits, e.g. customer sa<sfac<on, company image, compliance
Tangible
Intangible
Qualitative
$ Types

Performance Metrics Concepts
• It’s about opera<onal performance • Repor<ng leads to process improvement which leads to consistent
alignment with strategic vision of organiza<on • Integrate PM’s into management programs • Understand the associated risks…
– Organiza<onal iner<a – Funding availability – Data availability – Lack of skills necessary to implement process improvement
• Strong execu<ve sponsorship is cri<cal to resolve issues, some feel that Leadership should also be part of the balanced scorecard

Benefits of Metrics Utilizing performance metrics allows Sourcing to answer:
ü Are the end customer needs being met? ü Are all stakeholders satisfied? ü Are the purchases compliant? ü How effective is the contract? ü What is the spend relationship? (actual versus budget versus calculated) ü Are we on track and how are we trending? ü How capable is the supplier? ü What is the quality, delivery and responsiveness of the supplier? ü What benefits are being realized? (financial, process, relationship) ü What is the total cost of ownership? ü Should the contract be renewed? ü How are risks being managed? (safety, supply, security, financial) ü How does the supplier experience inform future Market Analyses? ü How does the end customer experience inform future Needs Assessments?

Seong Targets • Geong to a;ainable and realis<c is the most cri<cal component of measurement seong… … and the most difficult
• Begin with a collabora<ve and itera<ve process • By the end of the itera<ons you will have established: – Goal awareness and process understanding – Role defini<on and expecta<on clarity – Resource availability or limita<ons – Goal alignment

• First step is a challenge for many hospitals, exis<ng supply chains vary; measurement systems are inconsistent; some systems are more advanced than others.
• Ontario hospitals come in all shapes and sizes and therefore so do their supply chain goals.
• Measurement needs to be collected from data that is easily available, accurate, can be analyzed, applicable and <mely.
• Need a baseline • Most hospitals are data rich, informa<on poor. • Need to ensure we adopt the same metrics and standards so we
are comparable. • Suppliers use metrics all the <me to be more efficient and customer
focused.
Challenges:

Measurement Difficul<es • Tendency for purchasing to be assessed against monetary savings only – Some benefits provided by purchasing do not directly impact on the P&L
– Some benefits are not easily visible or quan<fiable
• Stakeholder reluctance to sign-‐off savings – Because this will mean a reduc<on in their budget / status
– Because the saving may be based on forecasted ac<vity rather than actuals
– Because of concerns about the baseline data

Examples of Metrics
• $ of savings achieved • % of spend on contract • % on-‐<me delivery • % complete orders • % payments as per terms • % of supplier evalua<ons completed on-‐<me • # of contract extensions invoked where no contract
extension existed in the RFX • # of returns • # of quality defects

• The balanced scorecard is a set of measures, dials and indicators that integrates mul<ple perspec<ves
• The balanced scorecard created by Robert Kaplan and David Norton, Harvard business school integrates four sets of measurement: – Financial Perspec<ve: How do we look to shareholders? – Internal Business Perspec<ve: What must we excel at? – Customer Perspec<ve: How do our customers see us? – Innova<on: Can we con<nue to improve and create value?
• Works as a management tool by seong out explicit outcomes to support the organiza<ons mission, vision and values
• Also provides a way to measure progress towards those outcomes • Given the complexi<es of the needs of the hospitals, the working group
created a six parameter scorecard addressing the structural founda<ons of organiza<ons and the importance of stakeholders

Balanced Scorecard
• Measurement must be: – Consistent – Reliable – Ac<onable – Credible
• Need to look at most important outcomes to improving supply chain performance over next three to five years (clinical and cost usually at the top, flexibility and social responsibility lowest)
Fundamental Drivers
Key Stakeholders

Balanced Scorecard • Scorecards are effec<ve in aligning an organiza<on's business areas
and ac<vi<es with its overall strategy, iden<fying cri<cal financial and non financial measures, iden<fying cause and effect rela<onships among measures and encourage accountability across the organiza<on
• Implementa<on of a balanced scorecard presents opportuni<es for a performing organiza<on to look at exis<ng programs, services, and processes. – Are the right services being performed?
• Are we doing the right things? – Are the processes effec<ve?
• Are we doing things right?

Balanced Scorecard-‐ Governance & Process
What must we excel at? • Purchasing produc<vity • Purchasing accuracy • Receipt accuracy • Inventory accuracy • Contract compliance • On / Off contract Purchase ra<o • Supply chain managed inventory • Supply chain managed spend ra<o • Quality – errors, defects, rework • Speed, cost, <me • Produc<vity

Balanced Scorecard -‐ Financial
How do we look to shareholders? – Days cash on hand – Days inventory on hand – Return on assets – Budget vs Actual budget results – Supply cost per_____ – Supply cost trend vs CPI – Total non labour cost

Balanced Scorecard-‐ Customers How do customers see us?
– Fill rate – Inventory: stock cycle <me – Inventory accuracy – Requisi<ons: Receipt cycle <me – Returns – Stock / Non Stock ra<o – Customer calls/ Complaints – Customer Sa<sfac<on Score
• Supply availability • Staff courtesy / helpfulness • Staff Responsiveness • Access to Informa<on

Balanced Scorecard -‐ People
Can we con<nue to improve and create value? • Innova<ons log • Employee sugges<ons • Employee reten<on • Employee capabili<es • Employee produc<vity • Con<nuing educa<on
– Formal educa<on – Cer<ficates – Conferences – Books

While scorecards must reflect the organiza<on, environment and strategic goals, a number of common principles guide their design.
• Report different measures for different audiences • Track staff poten<al, development and progress • Align with business unit priori<es • Iden<fy opportuni<es for realloca<ng resources • Link individual to func<onal and hospital performance • Measure performance in rela<ve terms • Focus beyond transac<onal measures to effec<veness and total
value crea<on
Scorecards

Scorecard Basics Cri<cal success factors for scorecards are: • Quickly and clearly indicates the current state of affairs/trends
• Metrics add value, are indicators and support business objec<ves
• Metrics calcula<ons are determined and outlined
• Targets are established and indicated
• Use of on track/off track indicators (ex., green, yellow, red)
• Period comparisons are used to provide more context (e.g., last quarter, current period vs. same period of previous year)

Department:Site:
Month reporting:Scorecard completed date:
2011Metric April May June Q1 Avg July Aug Sept Q2 Avg
Total # of procurements (incl. Consulting Services)60
# of non-competitive 2# of open competitive 5
# of open competitive exceptions 1# of invitational competitive 11
# of informal 41Total $ contract value of procurements $10,500,000
non-competitive $1,000,000open competitive $7,400,000
open competitive exceptions $100,000invitational competitive $1,000,000
informal $1,000,000
Metric April May June Q1 Avg July Aug Sept Q2 Avg# of single sourcing 1# of sole sourcing 1# of times the sign-off was as per AAS 1# of approval forms rejected 1
Metric April May June Q1 Avg July Aug Sept Q2 AvgTotal # of procurement for Consulting Services 4
# via open competitive 1# via invitational competitive 2
# of exceptions 1Total $ contract value of procurement for Consulting Services $2,500,000
# of times the sign-off was as per AAS 3
Metric April May June Q1 Avg July Aug Sept Q2 Avg# of RFP's submitted with a bid dispute process 1# of Bid Disputes submitted 4# of Bid Disputes resolved 0# of Vendor Debriefings requested 15# of Vendor Debriefings completed 5
# of addenda issued 4# of procurements with bid response time = 15 business days 2# of procurements with bid response time > 15 business days 3
Metric April May June Q1 Avg July Aug Sept Q2 AvgTotal # of contracts/agreements underway 3
# of contracts/agreements underway that commenced before both parties signed 1
# of contracts/agreements underway that commenced using an interim PO or
contract/agreement signed by both parties 2Total # of contracts/agreements with extensions available to be invoked 4
MONTHLY DATA SCORECARD
Contr
act M
anag
emen
tOp
en Co
mpeti
tive P
rocess
Cons
ulting
Servi
cesNo
n-Co
mpeti
tive
Procu
remen
t Typ
e

Department:Site:
Month reporting:Scorecard completed date:
2011Metric April May June Q1 Avg July Aug Sept Q2 Avg
Total # of procurements (incl. Consulting Services)60
% of non-competitive 3%% of open competitive 8%
% of open competitive exceptions 2%% of invitational competitive 18%
% of informal 68%Total $ contract value of procurements $10,500,000
non-competitive 10%open competitive 70%
open competitive exceptions 1%invitational competitive 10%
informal 10%
Metric April May June Q1 Avg July Aug Sept Q2 Avg% of single sourcing 50%% of sole sourcing 50%% sign-off was as per AAS 100%% of approval forms rejected 50%
Metric April May June Q1 Avg July Aug Sept Q2 AvgTotal # of procurement for Consulting Services 4
% via open competitive 25%% via invitational competitive 50%
% exceptions 25%Total $ contract value of procurement for Consulting Services $2,500,000
% the sign-off was as per AAS 75%
Metric April May June Q1 Avg July Aug Sept Q2 Avg# of RFP's submitted with a bid dispute process 0# of Bid Disputes submitted 4% of Bid Disputes resolved 0%# of Vendor Debriefings requested 15% of Vendor Debriefings completed 33%
# of addenda issued 4% of procurements with bid response time = 15 business days 40%% of procurements with bid response time > 15 business days 60%
Metric April May June Q1 Avg July Aug Sept Q2 AvgTotal # of contracts/agreements underway 3
% of contracts/agreements underway that commenced before both parties signed 33%
% of contracts/agreements underway that commenced using a letter of intent, MOU or
interim PO prior to contract/agreement signature or both parties signed 67%
Contr
act Ma
nagem
ent
OPERATIONAL PROCUREMENT SCORECARD
Procur
ement
Type
Non-
Comp
etitive
Consu
lting S
ervice
sOp
en Co
mpetit
ive Pr
ocess

Quarter reporting:Scorecard completed date:
Metric
% Capture Rate
% Process Compliance
% Sign-off as per AAS
# of Exceptions
Metric
Total # of Single/Sole Sourcing
% Process Compliance
% Sign-off as per AAS
MetricTotal # of procurements for Consulting Services
% Process Compliance
% Sign-off as per AAS
# of Exceptions
Metric
% Contracts commencing without a signed agreement or interim PO
% Contract Extensions invoked were in original RFP
CONSOLIDATED PROCUREMENT SCORECARD
Cons
ultin
g Se
rvice
s Fiscal Year: April 1, 2011 to March 31, 2012
1
83%
Please provide details on the exceptions
83%
67%
Q1 Q3Q2
2
100%
Open
Com
petit
iveNo
n-Co
mpe
titive
Please provide details on the exceptions
Q1 Q2 Q3
50%
75%
1
Department Y engaged Consulting Services valued at $5,000 via informal procurement
Q3 Q4Q2Q1
Department X ran $100,000 bid as
invitational
4
Q4
Q4
100%
Q1 Q2 Q3 Q4
33%
50%Cont
ract
Ma
nage
men
t

STRATEGIC PRIORITY
Measurement: Target: Trend December 2012 30 Day Actions to Improve Outcomes:
PO Invoice Processing
% of Invoices with NO PO per Hospital % Vendor A Invoices paid within terms (based on invoice date) Total # invoices at PROcure that cannot be processed
Goal-‐< 20% Target –<30% Goal -‐100% Target – 80% Goal – 0% Target – < 10%
% of Vendor A Invoices with NO PO -‐29% BWH-‐17 % (14) CKHA-‐ 13% (13) HDGH-‐17% (17) LDMH-‐8% (7) WRH-‐ 40% (46) Invoices paid within terms-‐63.2% (51) PO – 44.8% (33.4) Non-‐PO – 18.4% (17.6) Total # of invoices unprocessed with a PO-‐Sept-‐ 339 (205) % open by Hospital Sept BWH-‐ 30% (26) CKHA-‐ 23% (29) HDGH-‐ 27% (25) LDMH-‐ 1 (3) WRH-‐19% (17)
Total number invoices – October 15,125 (Vendor A total is 13,099) Total # of Vendor A No PO invoices for October is 3,849. Decrease from September report (Sept was 33%). Meeting target for majority of hospitals and overall. WRH Engineering department went live in early November. WRH Pharmacy department booked to have full time purchasing specialist on site for two weeks in January to assist with “go live” -‐send our no PO reports weekly to Hospitals -‐meeting with hospitals individually to capture non PO items. 89.0% of invoices are paid within terms from enter date. Sites remove payments from cash requirement i.e. CHIS, Capital. Hospitals have been reminded to ensure that all invoices are sent directly to PROcure. Concerns still to address: invoices are still not addressed here; sites are not forwarding invoices to PROcure. Invoices that PROcure has on site but cannot be processed Due to goods not received by Hospitals. This has improved for two hospitals and trending negatively for three. We are addressing with Hospitals on individual basis. Accruals are caught up. -‐Scott and Bob will address with individual sites as to why there are increases. *Previous month % in brackets


Who should be involved?
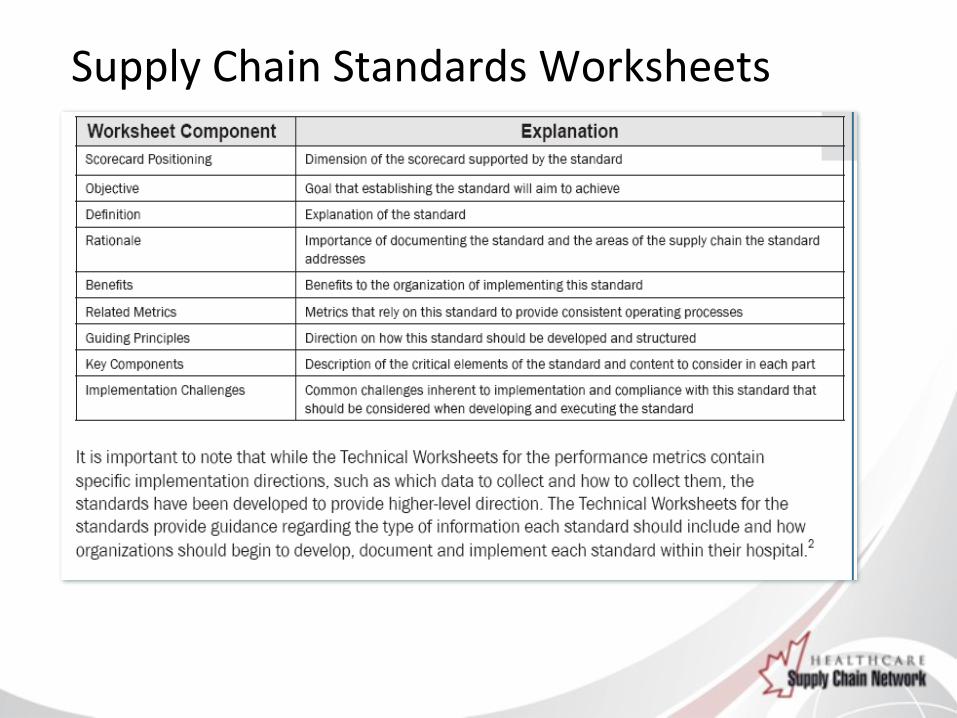
Supply Chain Standards Worksheets

Technical Metric Worksheet

Readiness Assessment

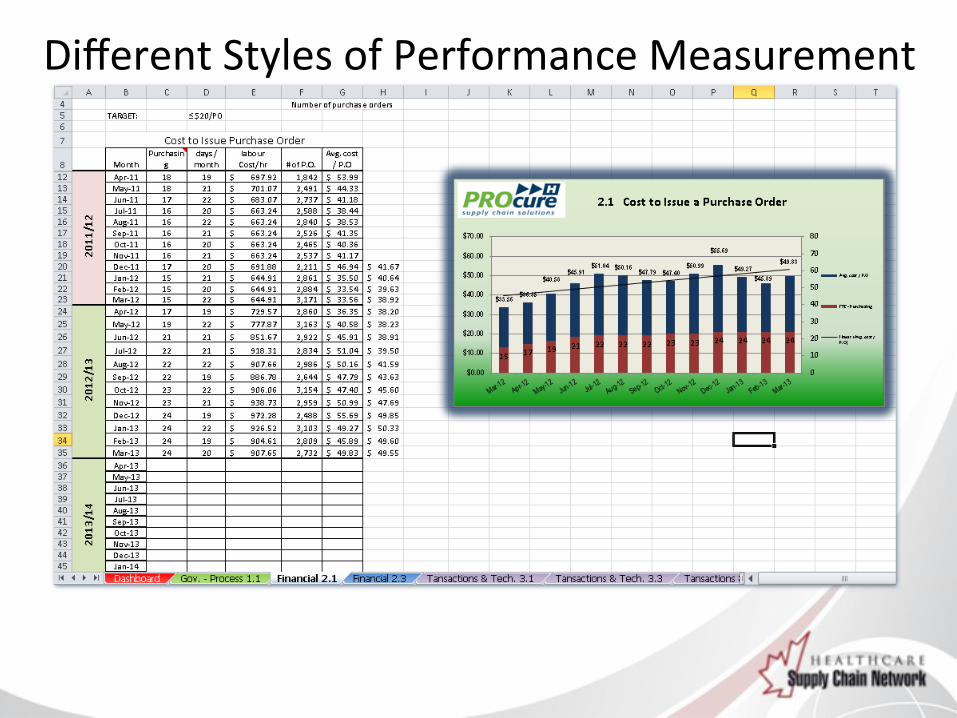
Different Styles of Performance Measurement

Different Styles of Performance Measurement

Different Styles of Performance Measurement

Key Performace Indicators: Erie/St.Clair Integrated Supply Chain
Baseline March 31, 2007 June 30, 2007 September 30, 2007 December 31, 2007 March 31, 20081 Lines per month (picked&filled))2 SKU's per inventory3 Inventory value year end4 Inventory turns5 Fill rates to end users6 Compliance with GPO Contracts7 Top 10 suppliers & dollar spend8 Invoices paid without a PO9 Cost to issue a PO10 Operating Cost as a Proportion of Expenditure
Definitions: (as per OntarioBuys Hospital Supply Chain Metrics report except 10, as per HIT tool)1 Lines Picked & filled per month 6 Compliance with GPO Contracts
inventory items only Per Medbuy
4 Inventory Turns: 8 Invoices paid without a POTotal annual spend on stock items excludes Physician and staff expenses
Annual inventory value in stock9 Cost to issue a PO:
5 Fill rates to end users Annual operating expense for supply chainNumber of items replenished Total number of PO's per annum
Number of items ordered10 Operating cost as a proportion of Expenditure:
Use HIT tool item #1 F/C Operating Expense to Facility Operating Expense

Different Styles of Performance Measurement
Different Styles of Performance Measurement

Different Styles of Performance Measurement

Different Styles of Performance Measurement

Customer Survey Tools & Processes

Supplier Performance Scorecard
2011
KPI Calcula<on Q4 2010 Q1 Q2 Q3
Total spend total $ paid $522,401 $448,798 $502,203 $402,213
Target
Quality rejects # rejected <=5 10 7 2
% On-‐<me delivery total shipments on <me/total shipments 96% 98.0% 97.3% 98.0%
% Correc<ve ac<ons completed on <me
ac<ons completed on <me/ac<ons scheduled 100% 10% 30% 60%
Was supplier evalua<on completed on <me
evalua<ons completed/evalua<ons scheduled yes yes n/a no

Strategic Sourcing Performance Scorecard 2011
KPI Calcula<on Q4 2010 Q1 Q2 Q3
Total spend from compe<<ve procurement
total $ paid from compe<<ve $30,000,000 $20,000,000 $35,000,000 $15,000,000
Total spend from non-‐compe<<ve procurement
total $ paid from non-‐compe<<ve $5,000,000 $2,000,000 $0 $500,000
Target
Savings (baseline price-‐current price) * baseline volume $1,000,000 $200,000 $500,000 $20,000
% spend on contract spend on contract/total
spend 80% 10% 30% 60%
% supplier evalua<ons completed on <me
evalua<ons completed/evalua<ons scheduled 100% 20% 100% 70%
# of contract extensions invoked where contract extension did not exist in the RFX
# of contracts 0 4 1 0

Broader Public Sector Accountability Act (BPSAA)
• The Broader Public Sector Accountability Act, 2010 (BPSAA) was introduced on October 20, 2010 and received Royal Assent on December 8, 2010. The BPSAA establishes new rules and higher accountability standards for hospitals, Local Health Integra<on Networks (LHINs) and broader public sector organiza<ons.
• The BPSAA: – Bans the prac<ce of hiring lobbyists using public funds – Increases accountability for hospitals and LHINs – Establishes new procurement and expense rules for certain large BPS
organiza<ons – Adds accountability measures related to compliance and expenses
rules – Brings hospitals under the Freedom of Informa;on and Protec;on of
Privacy Act (FIPPA)

Broader Public Sector Accountability Act (BPSAA)
• BPSAA-‐Issued By Minister of Health and Long-‐Term Care -‐ effecGve April 1, 2011 h;p://www.health.gov.on.ca/en/common/legisla<on/bpsa/
bps_hospitals_repor<ng_direc<ve.pdf
• BPS Expense DirecGve h;p://www.mgs.gov.on.ca/en/Spotlight2/STDPROD_098054.html
• BPS Procurement DirecGve h;p://www.doingbusiness.mgs.gov.on.ca/mbs/psb/psb.nsf/English/BPSSC-‐Sec
• BPS Perquisite DirecGve h;p://www.mgs.gov.on.ca/en/Spotlight2/STDPROD_098054.html
All issued by Ministry of Government Services – effecGve April 1, 2011

Broader Public Sector Accountability Act (BPSAA)
As of April 1, 2011, under the Act every hospital, in compliance with the direc<ve(s) issued by the Minister of Health and Long-‐Term Care (the Minister), is required to:
• Prepare reports on the hospitals use of consultants – Sec<on 6
• Publicly post expense claim informa<on – Sec<on 8 • Prepare compliance a;esta<ons – Sec<on 15

Report on Use of Consultants Background: • This Direc<ve outlines the requirements with respect to: • (a) the informa<on that every hospital must include in its Reports; • (b) to whom the Reports shall be submi;ed; and • (c) the form, manner and <ming of the Reports.
Submission of Reports: Every hospital shall submit its Reports to the relevant LHIN, by June 30th every year, star<ng in 2012.
ReporGng Period: The first Repor<ng Period will be April 1, 2011 to March 31, 2012. The Repor<ng Period for all subsequent years will be April 1 to the following March 31.
Form of Report: A report table template is a;ached to this Direc<ve as Appendix A. Every hospital is required to submit its Reports using this report table.

Report on Use of Consultants For every project for which the hospital retained a consultant
during the Repor<ng Period, every hospital is required to report on the following informa<on:
1. ConsulGng Firm Retained by the Hospital 2. Name and Title of ConsulGng Contract 3. Contract term 4. Total Procurement Value ($) / Total Paid 5. Consultant SelecGon Process 6. ModificaGons to Agreements

Report on Use of Consultants

Pos<ng of Expenses for Hospital Types of expense claims that must be posted: Every hospital must post the required informa<on about expense claims
made for the following types of expenses: • Travel – mileage, train or air travel, taxi or public transporta<on, accommoda<on
and travel incidents (insurance, parking , tolls) • Meal • Hospitality
Whose expense claims must be posted: Every hospital must post the required informa<on made by the following
individuals: • Every member of the Board of Directors • CEO/President/Administrator/Superintendent • Every member of hospital’s senior management team that reports directly to the
above

Pos<ng of Expenses for Hospital
• Every Hospital shall post the following informa<on in respect to expense claims: • Type of expense claim • Date on which the expense was incurred • Amount claimed • Descrip<on
• Every Hospital must post the required informa<on about expense claims on its website that is clearly and readily accessible to public
• Must be posted semi-‐annual, must be available for two years from date expense posted: claims appear in period posted – April 1 to September 30 – posted by November 30 – October 1 to March 31 – posted by May 31

Pos<ng of Expenses for Hospital

Compliance Reports -‐ A;esta<ons
Every Hospital is required to prepare a;esta<ons, a;es<ng to: • The comple<on and accuracy of reports required on the use
of consultants • Compliance with the prohibi<on on engaging lobbyist services
using public funds • Compliance with expense claim direc<ves issued by
Management Board of Cabinet • Compliance with procurement direc<ves issued by
Management Board of Cabinet

A;esta<on Requirements
• Pursuant to sec<on 15 of the BPS Accountability Act, every hospital is required to prepare a;esta<ons
• Form, Timing and Submission: — Annual basis — April 1 to the following March 31 — Approved by the Board — Submi;ed to the LHIN — By June 30th of every year — In the format set out in the Direc<ve — Post Board approved a;esta<ons on public website by
Aug 31st — Remain public for one year

Compliance Reports -‐ A;esta<ons

A;esta<on Procedure
Hospital VP Sign off
SSO Sign off
Hospital Review
CEO Sign off
Board Finance Committee
Review & Approval
Board Approval

CEO A;esta<on to the Chair of the Board On behalf of (the Hospital) I a;est to: 1. the comple<on and accuracy of reports required of the Hospital pursuant to sec<on 6 of the BPSAA on the use of consultants; 2. the Hospital’s compliance with the prohibi<on in sec<on 4 of the BPSAA on engaging lobbyist services using public funds; 3. the Hospital’s compliance with any applicable expense claims direc<ves issued under sec<on 10 of the BPSAA by the Management Board of Cabinet; 4. the Hospital’s compliance with any applicable perquisite direc<ves issued under sec<on 11.1 of the BPSAA by the Management Board of Cabinet; and 5. the Hospital’s compliance with any applicable procurement direc<ves issued under sec<on 12 of the BPSAA by the Management Board of Cabinet, during the Applicable Period. I further cer<fy that any material excep<ons to this a;esta<on are documented in the a;ached Schedule A.

Vice President A;esta<on • Suppor<ng Data provided by Shared Service Organiza<on to
enable signoff includes: — All expenses paid out for the fiscal year — All vendor payments for the fiscal year
• Also receive drad version of Organiza<on’s Report on Use of
Consultants — Need to validate completeness and accuracy of Consultant list
• Each VP will receive data at year end for their cost centres • Condi<onal format will draw a;en<on to spend >$100,000

Vice President A;esta<on On behalf of (Insert Hospital) I a;est to: • the comple<on and accuracy of reports required of the Hospital pursuant to sec<on 6 of the BPSAA on the use of consultants; • the Hospital’s compliance with any applicable expense claims direc<ves issued under sec<on 10 of the BPSAA by the Management Board of Cabinet; • the Hospital’s compliance with any applicable procurement direc<ves issued under sec<on 12 of the BPSAA by the Management Board of Cabinet, during the Applicable Period.
In making this a;esta<on, I have exercised care and diligence that would reasonably be expected of a Vice President in these circumstances, including making due inquiries of Hospital staff that have knowledge of these ma;ers.
I further cer<fy that any material excep<ons to this a;esta<on are documented in the a;ached Schedule A.

SSO A;esta<on • SSO provides list of consultant use to each Hospital
VP (in format as per BPSAA) • A;est to the compliance of 25 Procurement
Direc<ves and no<fy of any non compliant ac<ons • 8 Expense Direc<ve Categories – a;est to the
compliance of properly authorized expense reports and documenta<on (direc<ve 5, 7, 8). Hospitals need to ensure compliance with 8 direc<ve categories — In accordance with corporate policies for procurement and expenses
• Declara<on of any known material excep<ons

BPS DirecGves – 25 Procurement DirecGve Requirements Approval Authority Levels 1.Segrega<on of Du<es 2.Approval Authority Procurement Thresholds 3.Compe<<ve Procurement Thresholds CompeGGve Procurement 4.Informa<on Gathering 5.Supplier Pre-‐Qualifica<on Purchasing 6.Pos<ng Compe<<ve Procurement Documents 7. Timeline for Pos<ng Compe<<ve Procurements EvaluaGon 8. Bid Receipt 9. Evalua<on Criteria 10. Evalua<on Process Disclosure 11. Evalua<on Team 12. Evalua<on Matrix
13. Winning Bid 14. Non Discrimina<on Contract Award 15. Execu<ng the Contract 16. Establishing the Contract 17. Termina<on Clauses 18. Term of Agreement Modifica<ons 19. Contract Award No<fica<on 20. Vendor Debriefing Non-‐CompeGGve Procurement 21. Non-‐Compe<<ve Procurement Procurement Documents and Records RetenGon 22. Contract Management 23. Procurement Records Reten<on Conflict of Interest 24. Conflict of Interest Dispute ResoluGon Process 25. Bid Dispute Resolu<on

1 Accountability Framework The expense rules must include an accountability framework to ensure that there is appropriate governance, and that everyone understands the authority for approvals.
2 Posting The expense rules must be posted on the organization’s website, so they are available to the public. The rules must be available in accessible formats.
3 Alcohol The expense rules must provide direction on the circumstances in which alcohol can be claimed and reimbursed. The rules should be very specific as to the process for obtaining approval for the use of alcohol, and for approving a claim for reimbursement.
4 Hospitality This means that hospitality may never be offered solely for the benefit of anyone covered by this directive, or by the OPS Travel, Meal and Hospitality Expenses Directive. Examples would be: office social events, retirement parties and holiday lunches.
5 Documentation The expense rules must require that good record-keeping practices be maintained for verification and audit purposes.
6 Consultants and Other Contractors The expense rules must provide direction on the circumstances in which a consultant or contractor can claim and be reimbursed for expenses. The rules should set out what is an allowable expense. In no circumstances can hospitality, incidental or food expenses be considered allowable expenses for consultants and contractors under the rules or in any contract between an organization and a consultant or contractor.
7 Individuals Making Claims Claimants must be required in the expense rules to:- obtain all appropriate approvals before incurring expenses; - submit original, itemized receipts with all claims;- submit claims within the timeframe specified by the organization’s rules;- if the information above is not available or is not possible, submit a written explanation - repay any overpayments – it is considered a debt owing to the organization;- if leaving employment with an organization, submit any claims for expenses before leaving the organization.
8 Individuals Approving Claims Approvers must be prohibited in the expense rules from approving their own expenses, and the rules must note that expenses for a group can only be claimed by the most senior person present – expenses cannot be claimed by an individual that are incurred by his/her approver (e.g., an executive who reports to the CEO cannot submit a claim that includes the cost of the CEO’s lunch even if they were at the same event, with the result that the CEO would thereby approve his/her own expenses).
BPS DirecGves – 8 Expense DirecGve Requirements

A;esta<on Time Lines Step What Who When 1 Send Fiscal 2012/13 data and sign-‐off sheet to VPs –
Consultants report, a;esta<on to compliance with 25 Procurement Direc<ves and 8 Expense Direc<ves
SSO May 17, 2013
2 VPs send known material excep<ons and sign-‐offs to CEO.
VP’s TBD by Hospital
4 CEO consolidates package and completes CEO signoff CEO TBD by Hospital
5 Presenta<on of CEO signoff to F&A for approval VP/CEO TBD by Hospital
6 F&A recommenda<on to Board(s) for approval F&A Chairs TBD by Hospital
8 Sent to LHIN By June 30
9 Coordinate communica<on with Board and LHIN CFO/CEO Before June 30th 10 Post Board approved a;esta<on on Website Communica<ons Before Aug 31st

Ques<ons