Networks: Token Ring and FDDI 1 Token Ring and Fiber Distributed Data Interface (FDDI)
Upload
truongdiepCategory
view
218download
0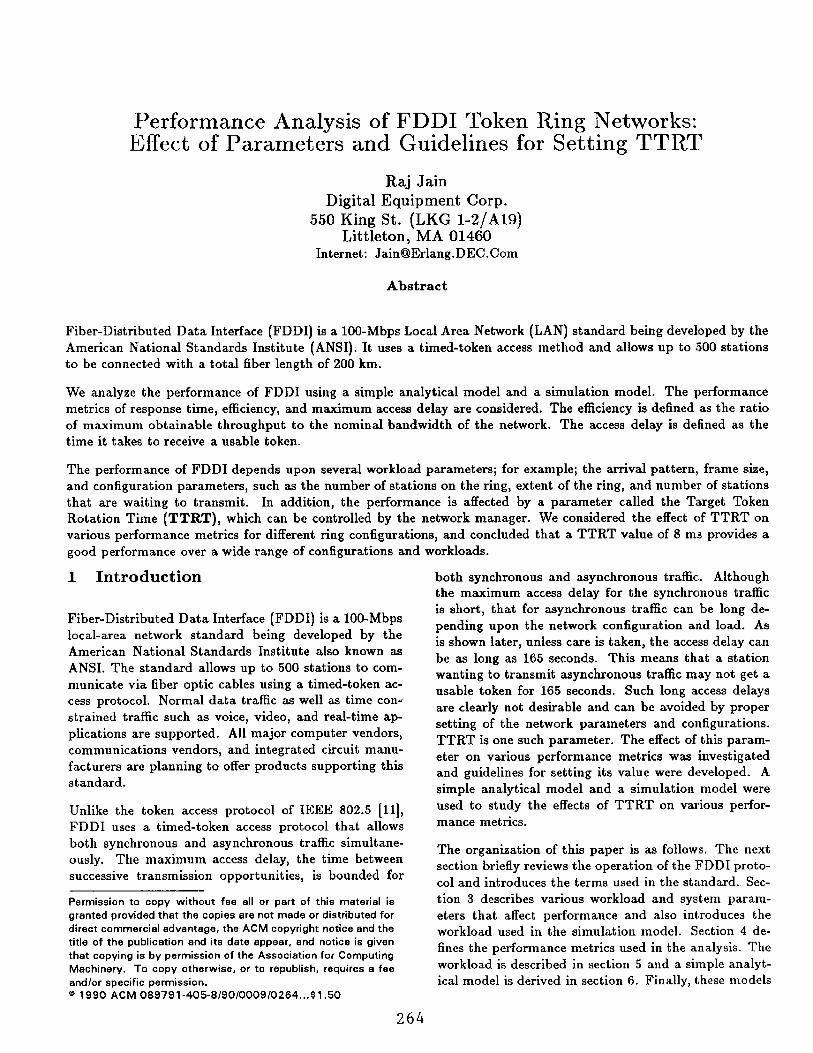
Performance Analysis of FDDI Token Ring Networks: Effect of Parameters and Guidelines for Setting TTRT
Raj Jain Digital Equipment Corp.
550 King St. (LKG l-2/A19) Littleton, MA 01460
Internet: JainOErlang.DEC.Com
Abstract
Fiber-Distributed Data Interface (FDDI) is a lOO-Mbps Local Area Network (LAN) standard being developed by the American National Standards Institute (ANSI). It uses a timed-token access method and allows up to !jOO stations to be connected with a total fiber length of 200 km.
We analyze the performance of FDDI using a simple analytical model and a simulation model. The performance metrics of response time, efficiency, and maximum access delay are considered. The efficiency is defined as the ratio of maximum obtainable throughput to the nominal bandwidth of the network. The access delay is detined as the time it takes to receive a usable token.
The performance of FDDI depends upon several workload parameters; for example; the arrival pattern, frame size, and configuration parameters, such as the number of stations on the ring, extent of the ring, and number of stations that are waiting to transmit. In addition, the performance is affected by a parameter called the Target Token Rotation Time (TTRT), which can be controlled by the network manager. We considered the effect of TTRT on various performance metrics for different ring configurations, and concluded that a TTRT value of 8 m.3 provides a good performance over a wide range of configurations and workloads.
1 Introduction
Fiber-Distributed Data Interface (FDDI) is a lOO-Mbps local-area network standard being developed by the American National Standards Institute also known as ANSI. The standard allows up to 500 stations to com- municate via fiber optic cables using a timed-token ac- cess protocol. Normal data traffic as well as time con& strained traffic such as voice, video, and real-time ap- plications are supported. All major computer vendors, communications vendors, and integrated circuit manu- facturers are planning to offer products supporting this standard.
Unlike the token access protocol of IEEE 802.5 [ll], FDDI uses a timed-token access protocol that allows both synchronous and asynchronous traffic simultane- ously. The maximum access delay, the time between successive transmission opportunities, is bounded for
Permission to copy without fee all or part of this material is granted provided that the copies are not made or distributed for direct commercial advantage, the ACM copyright notice and the title of the publication and its date appear, and notice is given that copying is by permission of the Association for Computing Machinery. To copy otherwise, or to republish, requires a fee and/or specific permission. @ 1990 ACM 089791-405-8190/000910264...$1.50
both synchronous and asynchronous traffic.. Although the maximum access delay for the synchronous traffic is short, that for asynchronous traffic can be long de- pending upon the network configuration and load. As is shown later, unless care is taken, the access delay can be as long as 165 seconds. This means that a station wanting to transmit asynchronous traffic may not get a usable token for 165 seconds. Such long access delays are clearly not desirable and can be avoided by proper setting of the network parameters and configurations. TTRT is one such parameter. The effect of this param- eter on various performance metrics was investigated and guidelines for setting its value were developed. A simple analytical model and a simulation model were used to study the effects of TTRT on various perfor- mance metrics.
The organization of this paper is as follows. The next section briefly reviews the operation of the FDDI proto- col and introduces the terms used in the standard. Sec- tion 3 describes various workload and system param- eters that affect performance and also introduces the workload used in the simulation model. Section 4 de- fines the performance metrics used in the analysis. The workload is described in section 5 and a simple analyt- ical model is derived in section 6. Finally, these models
264

are used to study the effects of various parameters.
2 Timed-Token Access Method
A token access method, for example, the one used on IEEE 802.5, works as follows. A token is circulated around the ring. Whenever a station wants to trans- mit, it waits for the token arrival. Upon receiving a token, it can transmit for a fixed interval called the To- ken Holding Time (THT). After the transmission, the station either releases the token immediately or after the arrival of all the frames it transmitted. Using this scheme, a station on an n station ring may have to wait as long as an nxTHT interval to receive a token. This may be unacceptable for some applications if n or THT is large. For example, for voice traffic and real-time ap- plications, this interval may be limited to the lo-20 ms range. Using the token access method severely limits the number of stations on the rings.
The timed-token access method, invented by Grow [9], solves this problem by ensuring that all stations on the ring agree to a ‘target’ token rotation time and limit their transmissions to meet this target as much as possi- ble. There are two modes of transmission: synchronous and asynchronous. Time-constrained applications such as voice and real-time traffic use the synchronous mode. Traffic that does not have time constraints uses the asynchronous mode. The synchronous traffic can be transmitted by a station whenever it receives a token. The total time of transmission per opportunity is, how- ever, short, and it is allocated at the ring initialization. The asynchronous traffic can be transmitted only if the token rotation time is less than the target.
The basic algorithm for the asynchronous traffic is as follows. Each station on the ring measures the time since it last received the token. The time interval be- tween two successive receptions of the token by a station is called the Token Rotation Time (TRT). On a token arrival, if a station wants to transmit, it computes a Token Holding Time (THT):
THT = TTRT - TRT
Here, TTRT is the target token rotation time as agreed by all stations on the ring. If THT is positive, the sta- tion can transmit for this interval. At the end of trans- mission, it releases the token. If a station does not use the entire THT allowed, other stations on the ring can use the remaining time by using the same algorithm.
Notice that even though the stations attempt to keep TRT below the target, they do not always achieve their
goal. It is possible for TRT to exceed the target by as much as the sum of all synchronous transmission-time allocations. Actually, the synchronous time allocations are limited so that their sum is less than TTRT. This en- sures that the TRT is always less than two times TTRT.
The above discussion represents only an essence of the timed-token access method used in FDDI. There are several details that have been intentionally omitted to keep the discussion simple. The standard documents [7,6] provide these details. Overviews of FDDI can be found in [19,20]. Sevcik and Johnson [22] and Johnson (151 have proven various timing properties of the proto- col.
On FDDI, the originating station is also responsible for removing the frames from the ring as the frames come back after going around the ring. The frames have a source and a destination address field, which identify the originator and the intended recipient of the frame. The frame removal is called ‘stripping.’
At the time of ring initialization, each station on the ring requests a particular value for TTRT, which is called Treq. The minimum of such requested values is used as the operational value of TTRT for the ring and is called T-opr in the standard documents.
A number of articles on FDDI performance have ap- peared in the liter- ature [1,2,3,4,5,8,10,14,16,17,18,21,23]. Here, we build on the results presented in these articles to answer the question: What should the TTRT value be? This is an important question for the users and managers of FDDI networks. In the absence of clear direction, many pro- curement guidelines have recently required that the de- fault TTRT, requested by all stations on an FDDI, be 165 ms, which is the default maximum allowed value. We wanted to study the impact of this requirement and found that the access delay - the time to get a usable token - may be too long with this value of TTRT.
3 Performance Parameters
The performance of any system depends upon the work- load as well as the system parameters. There are two kinds of parameters: fixed and user settable. Fixed pa- rameters are those that the network manager has no control over. These parameters vary from one ring to the next. Examples of fixed parameters are cable length and number of stations. It is important to study per- formance with respect to these parameters since, if it is found that performance is sensitive to these, a differ- ent guideline may be used for each set of fixed parame- ters. The settable parameters, which can be set by the
265

Comes End
A.,;- Hzd p,“,fv. Bgn Bgn Bgn End End End of Q Trans Trans Ret Strip Trans I lee Strip
t1 62 t3 t4 t5 tG t7 t8 t9 ,f
Figure 1: Sequence of events in a frame transmission on FDDI.
network manager or the individual station manager, in- clude various timer values. Most of these timers affect the reliability of the ring and the time to detect mal- function. The key parameters that affect a performance are the TTRT and the synchronous time allocations.
The workload also has a significant impact on system performance. One set of parameters may be preferable for one workload but not for another. The key parame- ters for the workload are: the number of active stations and the load per station. By active we mean stations that are either transmitting or waiting to transmit on the ring. There may be a large number of stations on the ring, but only a few of these are generally active at any given time. The active stations include those that have frames to transmit and are waiting for the access right, that is, for a usable token to arrive along with the currently transmitting station, if any.
In this paper, the performance has been studied under asynchronous traffic only. The presence of synchronous traffic will further restrict the choice of TTRT.
4 Performance Metrics
The quality of service provided by a system is measured by its productivity and responsiveness (131. For FDDI, productivity is measured by its throughput and respon- siveness is measured by the time needed to satisfy a transmit request. The time can be measured in a num- ber of ways. To understand important time metrics, consider Figure 1, which shows the sequence of events that occur when transmitting a frame on an FDDI net- work. The events are sequentially numbered as shown in the figure. The various events and their corresponding times are as follows:
tl The frame arrives at a station for transmisGon.
tz The frame arrives at the head of the queue containing frames to be transmitted. This is also the instant the transmission of the previous frame begins.
t3 The transmission of the previous frame finishes. The next frame is now eligible for transmission.
t4 The station obtains rights to transmit the new frame. If the Token Holding Timer (THT) permits, this can happen immediately after the transmission of the previous frame; otherwise, the station may have to wait until the next usable token arrives.
t5 The first bit of the frame arrives at the destination, which begins receiving the frame.
ts The first bit of the frame arrives back at the source station, which begins to strip (remove) it.
t7 The last bit of the frame is transmitted.
ts The last bit of the frame is received at the destina- tion.
tg The last bit of the frame is stripped at the source.
In must be pointed out that the events may not always happen in this order. In particular, it is possible the transmission to end before the beginning of reception.
A number of ‘responsiveness’ metrics have been consid- ered in the literature. Some of the familiar ones are:
1.
2.
3.
4.
5.
6.
Queueing Time: The time between the arrival of the frame and the end of previous transmission: t3 - t1.
Access Delay: The time between the end of the previous transmission and the beginning of a new transmission: t4 - t3.
Transmission Time: The time between t,he trans- mission of the first bit and the last bit; t7.-t4. This time is determined entirely by the frame size.
Propagation Delay: The time required for the a bit to travel from the source to the destination station. Measuring it for the last bit, this time is t8 - t7. This is determined by the 1ocat:ion of the source and the destination stations on the ring.
Response Time: The time between the arrival of the frame and the completion of its transmission: t7 - t1.
Transfer Delay: The time between the arrival of the frame and the reception of its last bit at the destination.
266

Of the above, the access delay and the response time are the key metrics. Given response time and access delay, the queueing time can easily be computed. The trans- mission time and propagation time can be computed from the frame size and the station location, and they are not affected by the network parameters. Notice that the response time, as defined here, is measured from the ‘first-bit-in’ to the ‘last-bit-out.’ The access delay is de- fined as the ‘want-token’ to the ‘get-token’ interval.
It must be pointed out that response time is a mean- ingful metric only if the ring is not saturated. At loads near or above capacity, the response time reaches in- finity and does not offer any information. With these loads, the access delay is more meaningful.
The productivity metric that the network manager may be concerned with is the total throughput of the ring in Mbps. Over any reasonable interval, the throughput is equal to the load. That is, if the load on the ring is 40 Mbps, the throughput is also 40 Mbps. This, of course, does not hold if the load is high. For exam- ple, if there are three stations on the ring, each with a 100 Mbps load, the total arrival rate is 300 Mbps and the throughput is obviously much less. Thus, the key metric is not the throughput under low load but the maximum obtainable throughput under high load. This latter quantity is also called the usable bandwidth of the network. The ratio of the usable bandwidth to nominal bandwidth (100 Mbps for FDDI) is defined as the eficiency. Thus, if for a given set of network and workload parameters, the usable bandwidth on FDDI is never more than 90 Mbps, the efficiency is 90% for that set of parameters.
Another metric that is of interest for a shared resource, such as FDDI, is the fairness with which the resource is allocated. Fairness is particularly important under heavy load. However, the FDDI protocols have been shown to be fair provided the priority levels are not im- plemented 1141. G iven a heavy load, the asynchronous bandwidth is equally allocated to all active stations. In the case of multiple priority implementation, Dykeman and Bux [4] have shown that the protocol is not fair in the sense that it is possible for two stations with the same priority and same load to get different throughput depending upon their location. Low-priority stations closer to high-priority stations may get a better service than those further down stream. A single priority imple- mentation is assumed here to keep the analysis simple. Such implementations have no fairness problems and, therefore, this metric will not be of concern anymore in this paper.
Two different methods have been used to analyze perfor- mance: simulation and analytical modeling. Analytical modeling is used to compute the efficiency and access
delay under heavy load. A simulation model is used to analyze the response time at loads below the usable bandwidth. The response time does depend upon the arrival pattern and, therefore, a particular workload is used, which is described in the next section.
5 Simulation Workload
Workload is probably the most controversial part of ev- ery performance evaluation project. No workload can represent all possible usage patterns. Regardless of what workload is selected, it is easy to find situations under which that workload is not representative of the actual usage. The conclusions reached here regarding response time appear valid for a variety of workloads. However, rather than discussing the representativeness of the workload used in this study, the workload is de- scribed so that others can reproduce the results if nec- essary.
The workload used here is based on an actual mea- surement of traffic at a customer site. The chief ap- plication at this site was Warehouse Inventory Control (WE). Hence, the workload is called the ‘WIC Work- load.’ Measurements on networks have shown that when a station wants to transmit, it generally transmits not one frame, but a burst of frames. This was found to be true in WIC workloads as well. Therefore, a ‘bursty Poisson’ arrival pattern is used in the simulation model. The interburst time used was 1 milliseconds and each burst consisted of five frames. The frames had only two sizes: 65% of the frames were small (100 bytes) and 35% were large (512 bytes). A simple calculation shows that this workload constitutes a total load of 1.23 Mbps. Forty stations, each executing this load, would load an FDDI to 50% utilization. Higher load levels can be obtained either by reducing the interburst time or by increasing the number of stati0ns.l
6 A Simple Analytical Model
A simple model to compute the access delay and effi- ciency of the FDDI analytically will now be described. These metrics are meaningful only under heavy load and, therefore, it is assumed that there are n active sta- tions and that each one has enough frames to keep the FDDI fully loaded.
It is shown that for an FDDI network with a ring la-
‘The measured inter-burst time was approximately 8 millisec- onds. It was scaled down to represent more powerful processors and to get meaningful results while keeping the number of stations in the simulation small.
267

tency of D and a TTRT value of T, the efficiency and maximum access delay are:
Efficiency = n(T - D) nT+D
Maximum access delay = (n - l)T + 20 (2)
Equations 1 and 2 constitute the analytical model. The derivation is simple and is given below. Readers not interested in the derivation can go directly to the end, which is marked by a q symbol.
Derivation: First consider a ring with three active stations, as shown in Figure 2. Later, the general case of n active stations will be considered. The figure shows the space-time di- agram of various events on the ring. The space is shown horizontally and the time is shown vertically. The token is shown by a thick horizontal line. The transmission of frames is indicated by a thick line along the time axis.
Assume that all stations are idle until t = D when the three active stations suddenly get a large (infinite) burst of frames to transmit. The sequence of events is as follows.
1.
2.
3.
4.
5.
6.
7.
t = 0: Station Sr receives the token and resets its Token Rotation Timer (TRT). Since it has noth- ing to transmit, the token proceeds to the next station.
t = t12: Station Sz receives the token and resets its TRT. Here tlz is the signal propagation delay from stations Sr to Sz.
t = t13: Station Sa receives the token and resets its TRT. Here t13 is the signal propagation delay from stations Sr to Ss.
t = D: Station Si receives the token. Since it now has an infinite supply of frames to transmit, it captures the token and determines that the TRT (time elapsed since the last time it received the token) is D, and so it can hold the token for the TTRT-TRT=T-D interval.
t = T: Token Holding Timer (THT) at station Sr expires. Sr releases the token.
t = T + t12. Station Sz receives the token. It last received the token at t = trz. The time elapsed since then (and hence its TRT) is T. The station finds that the token is unusable at this time and lets it go.
t = T + trs: Station Ss receives the token. It last received the token at t = t13 and so its TRT is also T. It finds the token unusable and lets it go.
D
I
f T-D
3T+D
!
;ir);l,
Sl s2 s3
I 4 I I
6 I n I I--- --______ . L
--------M--__________ --.,.___ I 3 A.4 ____.________...- --I------- ___----- .----v
Token : I I I I
Frames I I I I
c I I
~------‘.~-~~~~~~~~ --.“I...mm --...e____
’ 19 I __~ _._____- ---.--- --w
f
..-------------------i-- I I I I I
15
18
I I I
Figure 2: Space-time diagram of events with three ac- tive stations on an FDDI network. The numbers refer to the event numbers in the text.
8. t = T + D: Station Sr receives the token. It last received the token at t = D and so its ‘TRT is T.’ It finds the token unusable and lets it go.
9. t = T + D + tlz: Station Sz receives the to- ken. Since TRT is only D, it sets the THT to the remaining time, namely, T - D. It trans- mits for that interval and releases the token at t=T+D+t12+(T-D)
2Notice that the TRT is measured from the instant the token arrives at a station’s receiver, that is, event 4 for Station S1 in this case, and not from the instant it leaves a station’s transmitter (event 5).
268

11. t = 2T + t13: Station Ss receives the token. Since TRT is T, it lets the token go.
12. t = 2T + D: Station S1 receives the token. Since TRT is T, it lets the token go.
13. t = 2T + D + t12: Station S2 receives the token. Since TRT is T, it lets the token go.
14. t = 2T + D + t13: Station Ss receives the token. Since TRT is only D, it transmits for T - D and releases the token at t = 2T + D -t- t13 + (T - D). The token passes through stations S1, S2, and Ss, all of which find it unusable. (Events 14, 15 and 16.)
19. t = 3T + 20: Station S1 captures the token, and the cycle of events repeats starting with event 4 above.
The above discussion illustrates that the system goes through a cycle of events and that the cycle time is 3T + D. During each cycle, the three stations transmit for T - D intervals each for a total transmission time of 3(T - D). The number of bits transmitted during this time is 3(T- D) x lo8 bits and the throughput is 3(T - D) x 108/(3T+ D) b’t / 1 s second. The efficiency (ratio of throughput to the bandwidth) is 3(T - D)/(3T + D).
During the cycle, each station waits for an interval of 2T + 20 after releasing the token. This interval is the maximum access delay. At lower loads, the access delay will be lower.
Thus, for a ring with three active stations, the efficiency and access delay are:
Efficiency = ‘i: 1;)
Maximum access delay = (3 - 1)T + 20
The above analysis can be generalized to n active sta- tions. Replacing 3 by n, Equations I and 2 result. This complet,es the derivation of the formulae.
0
Equations 1 and 2 can be used to compute the maxi- mum access delay and the efficiency for any given FDDI ring configuration. For example, consider a ring with 16 stations and a total fiber length of 20 km.3 Light waves travel along the fiber at a speed of 5.085 ps/km. The station delay, the delay between receiving a bit and re- peating it on the transmitter side, is of the order of 1
3Using a two-fiber cable, this would correspond to a cable length of 10 km.
ps per station. The ring latency can, therefore, be com- puted as follows:
Ring Latency D = (20 km) x (5.085 ps/km)
+(16 stations) x (1 ps/station)
= 0.12 ms
Assuming a TTRT of 5 ms, and all 16 active stations, the efficiency and maximum access delay are:
Efficiency = w - O-12) = g, 5% ’ 16 x 5 +0.12
Maximum access delay = (16 - 1) x 5 + 2 x 0.12
= 75.24 ms
Thus, on this ring the maximum possible throughput is 97.5 Mbps. If the load is more than this for any substantial length of time, the queues will build up, the response time will become very long, and the stations may start dropping the frames. The maximum access delay is 75.24 ms, that is,it is possible for asynchronous stations to take as long as 75.24 ms to get a usable token.
The key advantage of this model is its simplicity, which allows us to immediately see the effect of various param- eters on the performance. With only one active station, which is usually the case, the efficiency is:
T-D Efficiency with one active station = -
T-i-D
As the number of active stations increases, the efficiency increases. With a very large number of stations (n = oo), the efficiency is:
Maximum efficiency = 1 - g
This formula is easy to remember and can be used for ‘back-of-the-envelop’ calculation of the FDDI perfor- mance. This special case has already been presented by Ulm [23].
Equation 2 also indicates that the maximum access de- lay with one active station (n = 1) is 2D. That is, a sin- gle active station may have to wait as long as two times the ring latency between successive transmissions. This is because every alternate token that it receives would be unusable.
7 Guidelines for Setting TTRT
The FDDI standard specifies a number of rules that must be followed for setting TTRT. These rules are:
269
1.
2.
3.
4.
The token rotation time can be as long as two times the target. Thus, a synchronous station may not see the token for 2xT. Therefore, synchronous
stations should request a TTRT value of one half the required service interval. For example, a voice station wanting to see a token every 20 ms or less should ask for a TTRT of 10 ms.
TTRT should allow at least one mazimum size frame along with the synchronous time allocation,
if any. That is:
TTRT 2 Ring Latency + Token Time
+ Max frame time
+ Synchronous allocation
The maximum size frame on FDDI is 4500 bytes (0.360 ms). The maximum ring latency is 1.773 ms. The token time (11 bytes including 8 bytes of preamble) is 0.00088 ms. This rule, therefore, prohibits setting the TTRT at less than 2.13 ms plus the synchronous allocation.
Violating this rule, for example, by over allocating the synchronous bandwidth, results in unfairness and starvation [17].
No station should request a TTRT less than
T-m&, which is a station parameter. The default maximum value of T-min is 4 ms. Assuming that there is at least one station with Tmin=4 ms, the TTRT on a ring should not be less than 4 ms.
No station should request a TTRT more than
T-maz, which is another station parameter. The default minimum value of T-max is 165 ms. As- suming that there is at least one station with T_max=165 ms, the TTRT on a ring cannot be more than this value. (In practice, many stations will use a value of 222 x 40 ns = 167.77216 ms, which can be conveniently derived from the sym- bol clock using a 22-bit counter.)
In addition to these rules, the TTRT values should be chosen to allow high-performance operation of the ring. These performance considerations are now discussed.
Figure 3 shows a plot of efficiency as a function of TTRT. Three different configurations called ‘Typical,’ ‘Big,’ and ‘Largest’ are shown.
The ‘Typical’ configuration consists of 20 single attach- ment stations on a 4 km fiber ring. The numbers used are based on an intuitive feeling of what a typical ring would look like and not based on any survey of actual installations. Twenty offices located on a 50 mx50 m floor would require a 2 km cable or a 4 km fiber.
The ‘Big’ configuration consists of 100 stations on a 200 km fiber. Putting too many stations on a lsingle ring increases the probability of bit errors [12). The ‘Big’ configuration is assumed to represent a reasonably large ring with acceptable reliability.
The ‘Largest’ configuration consists of 500 dual- attachment dual-MAC stations on a ring ,that is as- sumed to have wrapped. Thus, the LAN consists of 1000 MACs in a single logical ring. This is the largest number of MACs allowed on an FDDI. Exceeding this number would require recomputation of all default pa- rameters specified in the specifications.
3 B .m u i;: a
o.ooo 1 I I I I L 5 10 15 -+
TTRT in ms
Figure 3: Efficiency as a function of the TTRT.
Figure 3 shows that for all configurations, the efficiency increases as the TTRT increases. At TTRT values close to the ring latency, the efficiency is very low, and it in- creases as the TTRT increases. This is one reason why the minimum allowed TTRT on FDDI T-min is 4 ms. This may lead some to the conclusion that the chosen TTRT should be chosen as large as possible. However, notice also that the gain in efficiency by increasing the TTRT (that is, the slope of the efficiency curve) de- creases as the TTRT increases. The ‘knee’ of the curve depends upon the ring configuration. For larger config- urations, the knee occurs at larger TTRT values. Even for the ‘Largest’ configuration, the knee o,ccurs in the 6 to 10 ms range. For the ‘Typical’ configuration, the TTRT has very little effect on efficiency as long as the TTRT is in the allowed range of 4 ms to 165 Ins.
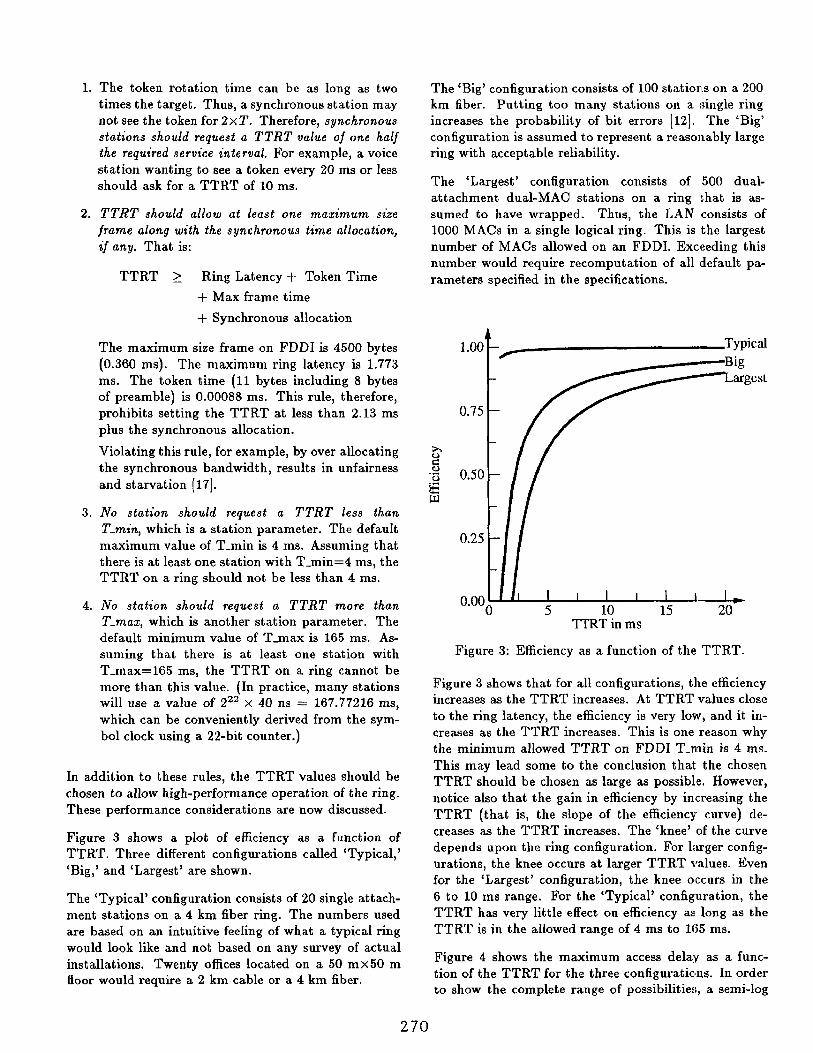
Figure 4 shows the maximum access delay as a func- tion of the TTRT for the three configurations. In order to show the complete range of possibilities, a semi-log
270
graph was used. The vertical scale is logarithmic while the horizontal scale is linear. The figure shows that in- creasing TTRT increases the maximum access delay for all three configurations. On the largest ring, using a TTRT of 165 ms would cause a maximum access de- lay as long as 165 seconds. This means that in a worst situation a station on such a ring may have to wait a few minutes to get a usable token. For many applica- tions, this could be considered unacceptable, therefore, a smaller number of stations or a smaller TTRT may be preferable.
1 .E+05
t-
101 0 5 10 15 20
TTRT in ms
Figure 4: Access delay as a function of the TTRT.
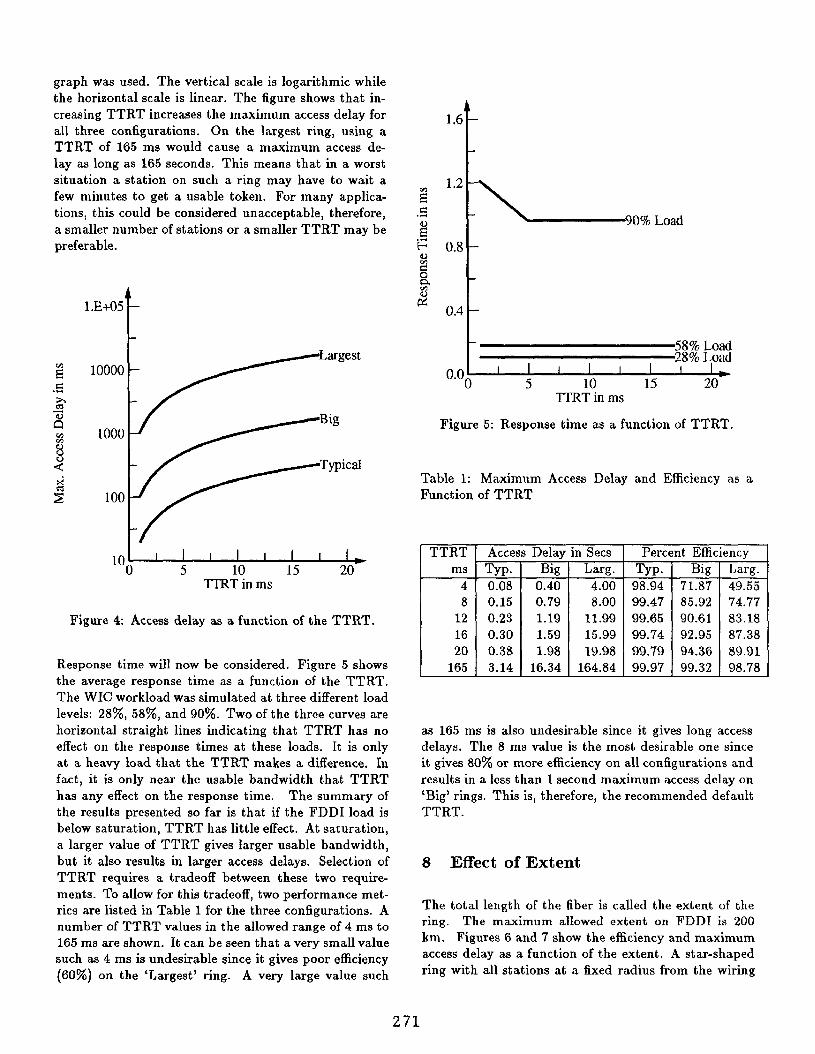
Response time will now be considered. Figure 5 shows the average response time as a function of the TTRT. The WIC workload was simulated at three different load levels: 28%, 58%, and 90%. Two of the three curves are horizontal straight lines indicating that TTRT has no effect on the response times at these loads. It is only at a heavy load that the TTRT makes a difference. In fact, it is only near the usable bandwidth that TTRT has any effect on the response time. The summary of the results presented so far is that if the FDDI load is below saturation, TTRT has little effect. At saturation, a larger value of TTRT gives larger usable bandwidth, but it also results in larger access delays. Selection of TTRT requires a tradeoff between these two require- ments. To allow for this tradeoff, two performance met- rics are listed in Table 1 for the three configurations. A number of TTRT values in the allowed range of 4 ms to 165 ms are shown. It can be seen that a very small value such as 4 ms is undesirable since it gives poor efficiency (60%) on the ‘Largest’ ring. A very large value such
1.6
1
la2 LO% Load 0.8
0.4
1 58% Load 28% Load
o.oo I I I I I * 5 10 15 20
TTRT in ms
Figure 5: Response time as a function of TTRT.
Table 1: Maximum Access Delay and Efficiency as a Function of TTRT
TTRT ms
4 8
12 16 20
165
l- Access Delay
TYP- 0.08 0.15 0.23 0.30 0.38 3.14
Big 0.40 0.79 1.19 1.59 1.98
16.34
n Sets Larg.
4.00 8.00
11.99 15.99 19.98
164.84
99.47 85.92 99.65 90.61
I- 99.74 92.95 99.79 94.36 99.97 99.32
Percent Efficiency
as 165 ms is also undesirable since it gives long access delays. The 8 ms value is the most desirable one since it gives 80% or more efficiency on all configurations and results in a less than 1 second maximum access delay on ‘Big’ rings. This is, therefore, the recommended default TTRT.
8 Effect of Extent
The total length of the fiber is called the extent of the ring. The maximum allowed extent on FDDI is 200 km. Figures 6 and 7 show the efficiency and maximum access delay as a function of the extent. A star-shaped ring with all stations at a fixed radius from the wiring
271

ms) is acceptable. b
1 .oo 7TRT=8 ms
20 MACs 100 MACs
0.75 - 1000 MACs
ox 8 .r( 2 0.50 & W
0.25
1
t
0.00 I 0 50 100 150 200
Total Fiber Length (km)
Figure 6: Efficiency as a function of the extent of the ring.
1 .E+05 TTRT=8 ms
loooo t- 1000 MACs
‘Ooo I- 100 MACs
10' 0 50 100 150 200
Total Fiber Length (km)
Figure 7: Access delay as a function of extent.
closet is assumed. The total cable length, shown along the horizontal axis, is calculated as 2xRadiusxNumber of stations. From the figures, it can be seen that larger rings have a slightly lower efficiency and longer access delay.4 In all cases, the performance (with TTRT=B
‘The increase on access delay is not visible due to the logarithm scale on the vertical axis.
9 Effect of the Total Number of Sta- tions
The total number of stations includes active as well as inactive stations. In general, increasing the number of stations increases the ring latency due to increasing fiber length and increasing the sum of station delays.
b 1.00
TTRT=8 ms, Radius=O. 1 Km
0.75 -
0.25
t
t
000~’ * 0 250 500 750 1000 Total Number of Stations
Figure 8: Efficiency as a function of the number of sta- tions on the ring.
Figures 8 and 9 show the efficiency and maximum access delay as a function of the total number of stations on the ring. Again, a star-shaped ring with a radius of 100 m is used. The figures show that a larger number of stations on one ring results in a lower efficiency and longer access delay. Another problem with a larger number of stations on a ring is the increased bit-error rate. Once again, it is preferable not to construct very large rings.
10 Effect of the Number of Active Sta- tions
As the number of active stations increases, the total load on the ring increases. Figures 10 and 11 show the ring performance as a function of the active number of stations on the ring. A maximum size ring with a TTRT value of 8 ms is used. The figures show that a larger number of active stations on a ring results in a better
272

1 .E+OS TTRT=8 ms, Radius=O. 1 Km
250 Total Number of Stations
1 .E+05 I’RT=8 ms, Ring Latency=1.773 ms
250 Number of Active Stations
Figure 9: Access delay as a function of the number of Figure 11: Access delay as a function of the number of stations on the ring. active stations.
A 0.8 -
l’TRT=B ms, Ring Latency=l.773 ms
o.ooI 250 500 750 1000
Number of Active Stations
Figure 10: Efficiency as a function of the number of active stations.
Efficiency = nkF
n(kF+D)+D
efficiency and a longer access delay. It is, therefore, preferable to segregate active stations on separate rings.
11 Effect of Frame Size
It is interesting to note that frame size does not appear in the simple models of efficiency and access delays bea- cuse frame size has little impact on FDDI performance. In this analysis, no ‘asynchronous overflow’ is assumed, that is, the transmission stops instantly as the THT ex- pires. Actually, the stations are allowed to finish the transmission of the last frame. The extra time used by a station after THT expiry is called ‘asynchronous over- flow.’ Assuming all frames are of fixed size, let F denote the frame transmission time. On every transmission op portunity an active station can transmit as many as k frames:
k= T-D [ 1 F
Here, 11 is used to denote rounding up to the next inte- ger value. The transmission time is kF, which is slightly more than T - D. With asynchronous overflow, the modified efficiency and access delay formulae become:
Access delay = (n - l)(kF + D) + 2D
Notice that substituting kF = T-D in the above equa- tions results in the same formulae as in Equations 1 and 2.
Figures 12 and 13 show the efficiency and access delay as function of frame size. Frame size has only a slight
273
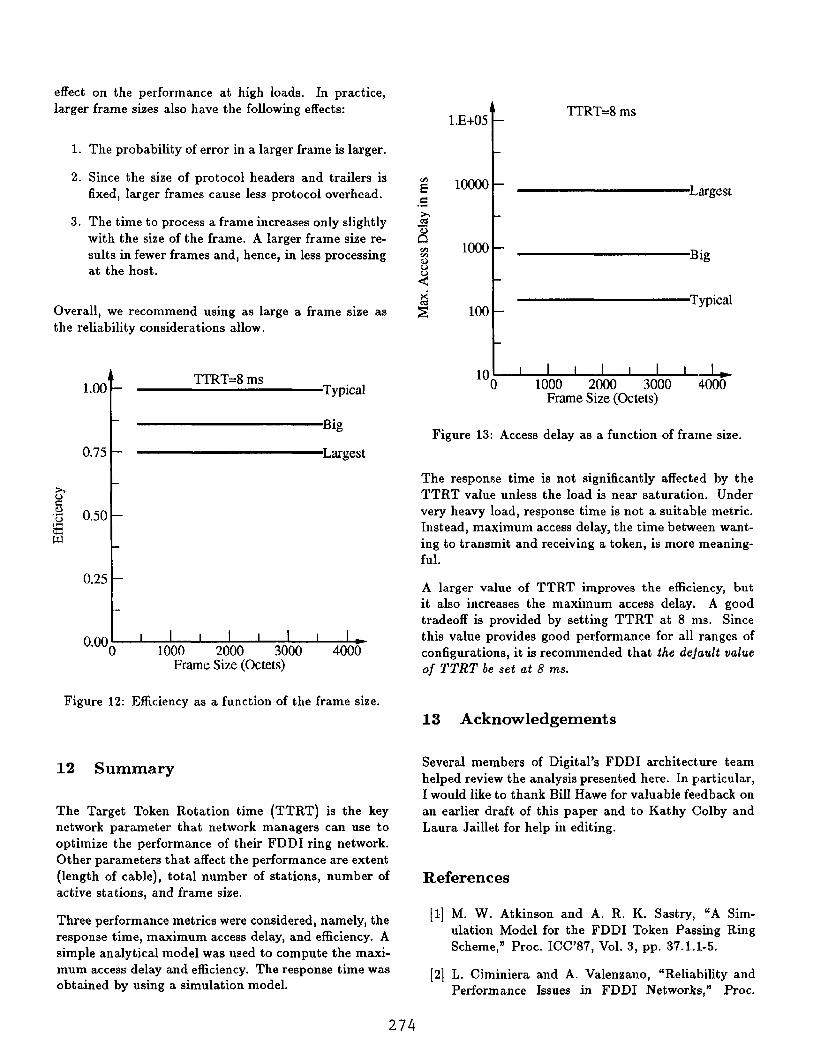
effect on the performance at high loads. In practice, larger frame sizes also have the following effects:
1.
2.
3.
The probability of error in a larger frame is larger.
Since the size of protocol headers and trailers is fixed, larger frames cause less protocol overhead.
The time to process a frame increases only slightly with the size of the frame. A larger frame size re- sults in fewer frames and, hence, in less processing at the host.
Overall, we recommend using as large a frame size as the reliability considerations allow.
TTRT=8 ms Typical
Big
Largest
t-
0.25
1
OOOI - 0 1000 2000 3000 4000 Frame Size (Octets)
1 .E+05 TTRT=8 ms
2 10000 e
Largest .e
3sx
6
3 1000 8
2
.
4 100
I
Big
Typical
Frame Size (Octets)
Figure 13: Access delay as a function of frame size.
The response time is not significantly affected by the TTRT value unless the load is near saturation. Under very heavy load, response time is not a suitable metric. Instead, maximum access delay, the time between want- ing to transmit and receiving a token, is more meaning- ful.
A larger value of TTRT improves the efficiency, but it also increases the maximum access delay. A good tradeoff is provided by setting TTRT at 8 ms. Since this value provides good performance for all ranges of configurations, it is recommended that the deja& value of TTRT be set at 8 ms.
Figure 12: Efficiency as a function of the frame size.
13 Acknowledgements
12 Summary
The Target Token Rotation time (TTRT) is the key network parameter that network managers can use to optimize the performance of their FDDI ring network. Other parameters that affect the performance are extent (length of cable), total number of stations, number of active stations, and frame size.
Three performance metrics were considered, namely, the response time, maximum access delay, and efficiency. A simple analytical model was used to compute the maxi- mum access delay and efficiency. The response time was obtained by using a simulation model.
Several members of Digital’s FDDI architect,ure team helped review the analysis presented here. In particular, I would like to thank Bill Hawe for valuable feedback on an earlier draft of this paper and to Kathy Colby and Laura Jaillet for help in editing.
References
[I] M. W. Atkinson and A. R. K. Sastry, “A Sim- ulation Model for the FDDI Token Passing Ring Scheme,” Proc. ICC’87, Vol. 3, pp. 37.1.1-5.
[2] L. Ciminiera and A. Valenzano, “Reliability and Performance Issues in FDDI Networks,” Proc.
274

PI
(41
I51
PI
PI
PI
PI
PI
Pll
WI
P31
PI
PI
Symp. on the Simulation of Computer Networks, Colorado Springs, CO, 1987, pp. 94-101.
A.G. Daghi, “Performance Simulation Results for an FDDI Controller,,, Proc. FOC/LAN’87, Ana- heim, CA, 1987, pp. 74-79.
D. Dykeman and W. Bux, “An Investigation of the FDDI Media-Access Control Protocol,,, Pro- ceedings of the Fifth European Fibre Optic Com- munications & Local Area Networks Exposition, EFOC/LAN’87, Basel, Switzerland, June 3-5, 1987, pp. 229-236.
D. Dykeman and W. Bux, “Analysis and Tuning of the FDDI Media Access Control Protocol,” IEEE Journal on Selected Areas in Communications, Vol. 6, No. 6, July 1988, pp. 997-1010.
FDDI Media Access Control (MAC-M), Mainte- nance Revision, ANSI X3T9.5/88-129, Rev. 1, Oc- tober 1, 1988,60 pp.
Fiber-Distributed Data Interface (FDDI) Token Ring Media Access Control (MAC), American Na- tional Standard, ANSI X3.139-1987, November 5, 1986, 60 pp.
L. Green, “Performance Analysis of FDDI,” Proc. COMPCON Spring ‘87, San Francisco, CA, 1987, pp. 441-443.
R. M. Grow, “A Timed-Token Protocol for Local Area Networks,,, Presented at Electro’82, Token Access Protocols, Paper 17/3, May 1982.
M.N. Huber, K. Sauer, and W. Schodl, ‘QPSX and FDDI-II Performance Study of High Speed LANs,” Proc. EFOC/LAN-88, Amsterdam, Netherlands, 1988, pp. 316-21.
Token Ring Access Method and Physical Layer Specifications, IEEE Standard 802.5-1985, 89pp.
R. Jain, UError Characteristics of Fiber Distributed Data Interface (FDDI),” IEEE Trans. on Commu- nications, August 1990, to appear.
R. Jain, The Art of Computer Systems Per- formance Analysis, ISBN 0471-50336-3, Wiley- Interscience, New York, November 1990, 576~~.
M. J. Johnson, uFairness of Channel Access for Non-Time-Critical Traffic Using the FDDI Token Ring Protocol,,, Nasa Ames Research Center, RI- ACS TR 86.9, March 1986, 12 pp.
M. J. Johnson, “Proof that Timing Requirements of the FDDI Token Ring Protocol are Satisfied,,, IEEE Trans. on Communications, Vol. COM-35, No. 6, June 1987, pp. 620-625.
PI
1171
PI
t191
PO1
PI
WI
1231
M.J. Johnson, uPerformance Analysis of FDDI,” Proc. EFOC/LAN-88, Amsterdam, Netherlands, 1988, pp. 295-300.
D. Karvelas and A. Leon-Garcia, ‘A Performance Comparison of Voice/Data Token Ring Protocols,,, Proc. IEEE INFOCOM’87, 1987, pp. 846-855.
J. W. M. Pang and F. A. Tobagi, “Throughput Analysis of a Timer Controlled Token Passing Pro- tocol under Heavy Load,,, IEEE Trans. on Commu- nications, Vol. 37, No. 7, July 1989, pp. 694-702.
F. E. Ross and R. K. Moulton, “FDDI Overview - A 100 Mbit per Second Solution,, Presented at Electro’84, Paper 2/l, May 1984.
F.E. Ross, “FDDI - An Overview,,, Proc. COM- PCON Spring ‘87, San Francisco, CA, 1987, pp. 434-440.
A. Schill and M. Zieher, “Performance Analysis of the FDDI 100 Mbit/s Optical Token Ring,,, Proc. IFIP TC 6/WG 6.4 Intl. Workshop on High Speed Local Area Networks, Aachen, West Ger- many, 1987, pp. 53-74.
K. C. Sevcik and M. J. Johnson, “Cycle Time Prop- erties of the FDDI Token Ring Protocol,,, IEEE Transactions on Software Engineering, Vol. S&13, No. 3, March 1987, pp. 376-385.
J. N. Ulm, “A Timed-Token Ring Local Area Net- work and Its Performance Characteristics,,, Proc. 7th IEEE Conf. Local Comput. Networks, Feb. 1982, pp. 50-56.
275