Working-Fluid Selection for Minimized Thermal Resistance ...

processes
Article
Performance Analysis and Working Fluid Selectionfor Single and Two Stages Vapor CompressionRefrigeration Cycles
Bahaa Saleh 1,2,* , Ayman A. Aly 1,2, Mishal Alsehli 1, Ashraf Elfasakhany 1 andMohamed M. Bassuoni 3
1 Mechanical Engineering Department, College of Engineering, Taif University, P.O. Box 888, Taif 26571,Saudi Arabia; [email protected] (A.A.A.); [email protected] (M.A.); [email protected] (A.E.)
2 Mechanical Engineering Department, Faculty of Engineering, Assiut University, Assiut 71516, Egypt3 Mechanical Power Engineering Department, Faculty of Engineering, Tanta University, Tanta 31733, Egypt;
[email protected]* Correspondence: [email protected]; Tel.: +966-055-6131-761
Received: 29 July 2020; Accepted: 11 August 2020; Published: 20 August 2020�����������������
Abstract: Screening for alternative refrigerants with high energy efficiency and low environmentalimpacts is one of the highest challenges of the refrigeration sector. This paper investigates theperformance and refrigerant screening for single and two stages vapor compression refrigerationcycles. Several pure hydrocarbons, hydrofluorocarbons, hydrofluoroolefins, fluorinated ethers,and binary azeotropic mixtures are proposed as alternative refrigerants to substitute R22 and R134adue to their environmental impacts. The BACKONE equation of state is used to compute thethermodynamic properties of the candidates. The results show that the maximum coefficientsof performance (COP) for single and two stage cycles using pure substances are achieved usingcyclopentane with values of 4.14 and 4.35, respectively. On the other side, the maximum COP for thetwo cycles using azeotropic mixtures is accomplished using R134a + RE170 with values of 3.96 and4.27, respectively. The two-stage cycle presents gain in COP between 5.1% and 19.6% compared withthe single-stage cycle based on the used refrigerant. From the obtained results, among all investigatedrefrigerants, cyclopentane is the most suitable refrigerant for the two cycles from the viewpoint ofenergy efficiency. However, extra cautions should be taken due to its flammability.
Keywords: refrigeration cycle; pure refrigerants; azeotropic mixtures; flash intercooler;cycle performance
1. Introduction
Currently, refrigeration systems are widely used in domestic and commercial applications.Approximately, there are three billion refrigeration systems used in the world which represent about17% of the electrical power consumption over worldwide [1]. Accordingly, many researches have beenconducted for improving the energy efficiency of these systems or to reduce their environmental effects.A minor enhancement in the system performance might have a significant effect on energy consumption.
The single-stage vapor compression refrigeration cycle (VCRC) is the most conventionalrefrigeration cycle. Many alternative refrigeration cycles were introduced to improve the cycleperformance. These cycles may be different from the VCRC in their working principles such as theabsorption cycle or might simply make changes in the cycle construction as the ejector, injection andcascade cycles. Alternative cycles tend to increase not only their energy efficiency but also initialcosts and working complexity. Computational simulations permit to carry out a comparison betweendifferent alternative cycles in a cheap and fast way, introducing various options, assisting to decide if
Processes 2020, 8, 1017; doi:10.3390/pr8091017 www.mdpi.com/journal/processes

Processes 2020, 8, 1017 2 of 13
additional studies of some alternative cycles are worthwhile. Several studies have been conducted onalternative cycles to find the best energy-efficient cycle [1].
Many studies have reported that the vapor injection refrigeration cycle (VIRC) attains betterperformance than the VCRC. Heo et al. [2] carried out a comparison between a VCRC and VIRC.The study indicated that using vapor injection increases the cycle coefficient of performance (COP) by25%. Park et al. [3] and Xu et al. [4] presented the advantages of the flash tank with vapor injectioncompared with VCRC. Xu et al. [5] developed an integrated vapor injection heat pump system usingR32, R1234yf, and its binary mixtures and evaluated their heating performances. The study concludedthat the VIRC using R1234yf/R32 provided very significant performance enhancements for heatingperformance compared with no injection. Qi et al. [6] investigated a hybrid VIRC with subcoolingand flash chamber for air-source heat pumps. The study concluded that the COP utilizing R290 wasimproved by about 3% in comparison with the traditional subcooler VIRC. Tello-Oquendo et al. [7]offered a comprehensive study of the two-stage vapor compression refrigeration cycle (TSVCRC) usingmany refrigerants. Xu et al. [8] reported a new designed vapor injection heat pump utilizing R32.The study concluded that the heating COP was increased by nearly 13% in comparison with a cycleoperates with liquid injection.
Many studies proposed mixtures as potential refrigerants for refrigeration systems [1,9].Mohammad and Hoseyn [10] redesigned a TSVCRC by using the genetic algorithm and refrigerantanalyses. The results showed that the basic redesign of the cycle, with propylene as refrigerant,improved the COP from 1.42 to 2.01 in comparison to the available cycle. D’ Angelo et al. [11] carriedperformance evaluation of a VIRC utilizing R290/R600a mixture. The maximum COP (COPmax) wasobtained using a mixture of 40/60 wt%. The results showed that the COP of the VIRC was 16%~32%higher than that of the VCRC. Lee et al. [12] measured a drop-in performance of R134a, R1234yf,and R1234yf/R134a mixture in a heat pump bench tester. The results showed that the COP of R1234yfand R1234yf/R134a is equal to that of R134a. Shaik and Babu [13] carried out a theoretical analysisof window air conditioner utilizing R410A, R431A, R134a, R290, R1270, R419A, and 15 mixtures.The results exhibited that the COP using the mixture R134a/R1270/R290 (50/5/45 mass%) was 2.1%higher than that of both the investigated pure and mixed refrigerants.
In the present study, a comparison between the performance of VCRC and TSVCRC using varioustraditional and new pure components and azeotropic and near azeotropic (almost no temperatureglide) binary mixtures is conducted. The new pure and mixed refrigerants did not or seldom used inthe previous studies. Using different expansion ratios, the performance of TSVCRC is calculated andoptimized for COPmax. The refrigeration capacity, the compressor power, the compressor dischargetemperature (Tdis) and the COP are calculated and compared for the two cycles using all candidates.Fourteen pure components and sixteen mixtures are suggested and examined as refrigerants for VCRCand TSVCRC to substitute R22 and R134a due to their environmental impacts. The investigatedpure refrigerants are cyclopentane, R1233zd(E), R1234yf, R1234ze(E), R604, R603, R602a, R602, R601a,R601, R600, R600a, R245ca, and RE170. The inspected mixtures are R290 + R143a, R125 + R290,R600a + R236fa, R227ea + R600a, R134a + R290, R134a + R600a, R152a + R600a, R125 + R143a (R507A),R32 + R125 (R410A), R32 + R290, R32 + R143a, RE170 + R600a, RE170 + R290, R22 + R115 (R502),R134a + RE170, and R1270 + R134a.
2. Methodology
2.1. Single-Stage Vapor Compression Refrigeration Cycle Description
Figure 1 shows a schematic diagram of the VCRC and its corresponding pressure-enthalpy (P-h)diagram. The cycle consists of a compressor, condenser, expansion valve and evaporator. There is notemperature glide for pure and azeotropic mixture refrigerants during condensation and evaporationprocesses. The different cycle processes can be explained as follows: process (1–4) is a compressionthrough the compressor, process (4–5) is a heat rejection in the condenser, process (5–9) is an expansion

Processes 2020, 8, 1017 3 of 13
through the expansion valve, process (9–1) is a heat addition in the evaporator. The arrangement ofthe numbers 1–4–5–9 is because of the ones used in the two-stage cycle as will be described in thenext subsection.
Processes 2020, 8, x FOR PEER REVIEW 3 of 14
arrangement of the numbers 1–4–5–9 is because of the ones used in the two-stage cycle as will be described in the next subsection.
Figure 1. Schematic diagram of the VCRC and its P-h diagram.
2.2. Two-Stage Compression Refrigeration Cycle with Flash Intercooler
The COP of the refrigeration cycle can be increased by reducing the required compressor power. This can be achieved by multistage compression with intercooler. One arrangement for TSVCRC with flash intercooler and its corresponding P-h diagram are displayed in Figure 2. The TSVCRC differs from the VCRC by adding a second stage compression and a flash chamber which allows vapor injection between the two compression stages. Intercooling is accomplished by a direct contact heat exchanger. Saturated liquid refrigerant leaving the condenser at state 5 expands across the first expansion valve to the pressure of the flash chamber. The refrigerant enters the flash chamber as a liquid-vapor mixture at state 6. In the flash chamber, the vapor and liquid components separate into two streams. Relatively low-temperature saturated vapor stream exits the flash chamber and enters the heat exchanger at state 7, where it mixes with higher-temperature superheated refrigerant from the first stage compression at state 2 and the intercooling is achieved. A single stream leaves the heat exchanger at state 3 and is compressed by the second stage compressor to the condenser pressure at state 4. Saturated liquid stream leaving the flash chamber at state 8 expands across the second expansion valve to the evaporator pressure reaching the lowest temperature in the cycle, where it picks up heat from the refrigerated space. The refrigerant exits from the evaporator as saturated vapor at state 1 and enters the first stage compressor.
2.3. Refrigerant Selection
The ideal refrigerant achieves both high system performance and minimal environmental impacts. The refrigerant should have high latent heat of vaporization, promising heat transfer properties, and a wide operating temperature range [14]. The following general concerns are addressed during the refrigerant choice: (i) environmental impacts: global warming potential (GWP), ozone depletion potential (ODP), and atmospheric lifetime (ALT); (ii) safety features: flammability, auto ignition, and toxicity; and (iii) availability and cost.
A significant feature for the refrigerant classification is the shape of the saturated vapor line in the temperature against the entropy (T-s) diagram. The saturated vapor line may lead to three refrigerant types, i.e., (i) overhanging, if the saturated vapor line forms a positive slope. For overhanging refrigerants, the state after the compressor may be in the two-phase region, which is called wet compression. This may seriously influence the gas-dynamic process in the compressor and hence the compressor performance. In practice, wet compression can be averted by non-isentropic compression and if needful greater superheating before the compressor inlet; (ii) a bell-shaped coexistence curve, if the saturated vapor line constitutes a negative slope; and (iii) isentropic, if the
ṁ
9
𝑤
𝑄
5
Expansion valve
1
4
Compressor
Evaporator
Condenser
𝑄
4a Pcond
Peva
P
h
5 4s
9 1
Figure 1. Schematic diagram of the VCRC and its P-h diagram.
2.2. Two-Stage Compression Refrigeration Cycle with Flash Intercooler
The COP of the refrigeration cycle can be increased by reducing the required compressor power.This can be achieved by multistage compression with intercooler. One arrangement for TSVCRCwith flash intercooler and its corresponding P-h diagram are displayed in Figure 2. The TSVCRCdiffers from the VCRC by adding a second stage compression and a flash chamber which allowsvapor injection between the two compression stages. Intercooling is accomplished by a direct contactheat exchanger. Saturated liquid refrigerant leaving the condenser at state 5 expands across the firstexpansion valve to the pressure of the flash chamber. The refrigerant enters the flash chamber as aliquid-vapor mixture at state 6. In the flash chamber, the vapor and liquid components separate intotwo streams. Relatively low-temperature saturated vapor stream exits the flash chamber and entersthe heat exchanger at state 7, where it mixes with higher-temperature superheated refrigerant fromthe first stage compression at state 2 and the intercooling is achieved. A single stream leaves the heatexchanger at state 3 and is compressed by the second stage compressor to the condenser pressureat state 4. Saturated liquid stream leaving the flash chamber at state 8 expands across the secondexpansion valve to the evaporator pressure reaching the lowest temperature in the cycle, where it picksup heat from the refrigerated space. The refrigerant exits from the evaporator as saturated vapor atstate 1 and enters the first stage compressor.
2.3. Refrigerant Selection
The ideal refrigerant achieves both high system performance and minimal environmental impacts.The refrigerant should have high latent heat of vaporization, promising heat transfer properties, and awide operating temperature range [14]. The following general concerns are addressed during therefrigerant choice: (i) environmental impacts: global warming potential (GWP), ozone depletionpotential (ODP), and atmospheric lifetime (ALT); (ii) safety features: flammability, auto ignition,and toxicity; and (iii) availability and cost.
A significant feature for the refrigerant classification is the shape of the saturated vapor line in thetemperature against the entropy (T-s) diagram. The saturated vapor line may lead to three refrigeranttypes, i.e., (i) overhanging, if the saturated vapor line forms a positive slope. For overhangingrefrigerants, the state after the compressor may be in the two-phase region, which is called wetcompression. This may seriously influence the gas-dynamic process in the compressor and hence thecompressor performance. In practice, wet compression can be averted by non-isentropic compressionand if needful greater superheating before the compressor inlet; (ii) a bell-shaped coexistence curve,

Processes 2020, 8, 1017 4 of 13
if the saturated vapor line constitutes a negative slope; and (iii) isentropic, if the saturated vapor line isalmost vertical. For both bell-shaped and isentropic refrigerants, there is no phase change during thecompression process and the superheating before the compressor is not required. The notations o, b,and i are used hereafter for overhanging, bell-shaped, and isentropic refrigerants, respectively.
Processes 2020, 8, x FOR PEER REVIEW 4 of 14
saturated vapor line is almost vertical. For both bell-shaped and isentropic refrigerants, there is no phase change during the compression process and the superheating before the compressor is not required. The notations o, b, and i are used hereafter for overhanging, bell-shaped, and isentropic refrigerants, respectively.
Figure 2. Schematic diagram of the TSVCRC and its P-h diagram.
For several years, chlorofluorocarbons (CFCs) and hydrochlorofluorocarbons (HCFCs) have been used as refrigerants. In 1987, the Montreal Protocol was ratified and the use of CFCs and HCFCs was regulated. Consequently, they have been phased out due to their ODP and high GWP. This forced researchers to use hydrofluorocarbons (HFCs) as alternative refrigerants. The HFCs have zero ODP and have several of the promising properties. They have considerable features regarding stability, low toxicity, and safety, being suitable for large-scale refrigeration systems [15]. The regulations are becoming stricter in terms of environment protection; accordingly, using HFCs are now being regulated due to their large GWP.
Nowadays, the emphasis is on the utilization of natural refrigerants, such as hydrocarbons (HCs). The HCs have zero ODP, very small GWP, and superior thermophysical properties. They are highly soluble in traditional mineral oils, non-toxic, chemically stable, compatible with conventional materials used in the refrigeration systems [16]. However, the HCs are highly flammable, which limits their utilization [17]. Hydrofluoroolefins (HFOs) are considered promising alternative refrigerants because they are ozone-friendly. They can offer a balance among performance, durability, environmental effect, and safety [15]. Several HFOs are used as alternative refrigerants [18,19]. Both azeotropic and zeotropic mixtures have been examined as refrigerants in the literature. The azeotropic mixtures are catching increasing interest in refrigeration applications because of their zero temperature glide and particular thermophysical properties [9].
The fundamental thermodynamic properties of the inspected refrigerants such as molecular mass (M), normal boiling point (NBP), critical volume (vc), critical temperature (Tc), and critical pressure (Pc) are presented in Table 1 [20,21]. Also, the environmental and safety (lower flammability limit, % by volume in the air (LFL), and safety group) features are presented in Table 1.
ṁ
(m )
9
𝑤
𝑤
𝑄
8 Expansion
valve 2
Expansion valve 1
1
2
6
5
7 3 (m )
4
Compressor 1
Flash chamber
Compressor 2
Evaporator
Direct contact heat exchanger
Condenser
𝑄
2s
4s
2a
Pcond
Peva
P
h
7
6
8
5
3
4a
9 1
Figure 2. Schematic diagram of the TSVCRC and its P-h diagram.
For several years, chlorofluorocarbons (CFCs) and hydrochlorofluorocarbons (HCFCs) have beenused as refrigerants. In 1987, the Montreal Protocol was ratified and the use of CFCs and HCFCs wasregulated. Consequently, they have been phased out due to their ODP and high GWP. This forcedresearchers to use hydrofluorocarbons (HFCs) as alternative refrigerants. The HFCs have zero ODPand have several of the promising properties. They have considerable features regarding stability,low toxicity, and safety, being suitable for large-scale refrigeration systems [15]. The regulations arebecoming stricter in terms of environment protection; accordingly, using HFCs are now being regulateddue to their large GWP.
Nowadays, the emphasis is on the utilization of natural refrigerants, such as hydrocarbons (HCs).The HCs have zero ODP, very small GWP, and superior thermophysical properties. They are highlysoluble in traditional mineral oils, non-toxic, chemically stable, compatible with conventional materialsused in the refrigeration systems [16]. However, the HCs are highly flammable, which limits theirutilization [17]. Hydrofluoroolefins (HFOs) are considered promising alternative refrigerants becausethey are ozone-friendly. They can offer a balance among performance, durability, environmental effect,and safety [15]. Several HFOs are used as alternative refrigerants [18,19]. Both azeotropic and zeotropicmixtures have been examined as refrigerants in the literature. The azeotropic mixtures are catchingincreasing interest in refrigeration applications because of their zero temperature glide and particularthermophysical properties [9].
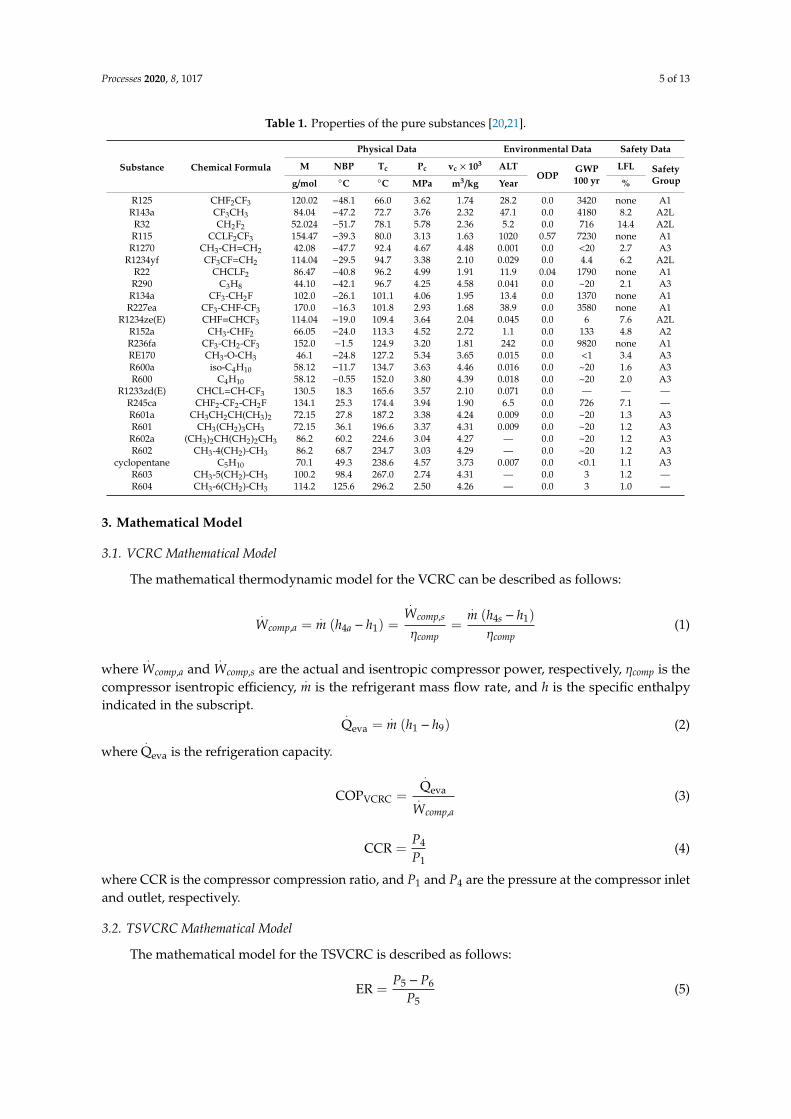
The fundamental thermodynamic properties of the inspected refrigerants such as molecular mass(M), normal boiling point (NBP), critical volume (vc), critical temperature (Tc), and critical pressure (Pc)are presented in Table 1 [20,21]. Also, the environmental and safety (lower flammability limit, % byvolume in the air (LFL), and safety group) features are presented in Table 1.
Processes 2020, 8, 1017 5 of 13
Table 1. Properties of the pure substances [20,21].
Substance Chemical Formula
Physical Data Environmental Data Safety Data
M NBP Tc Pc vc × 103 ALTODP
GWP100 yr
LFL SafetyGroupg/mol ◦C ◦C MPa m3/kg Year %
R125 CHF2CF3 120.02 −48.1 66.0 3.62 1.74 28.2 0.0 3420 none A1R143a CF3CH3 84.04 −47.2 72.7 3.76 2.32 47.1 0.0 4180 8.2 A2LR32 CH2F2 52.024 −51.7 78.1 5.78 2.36 5.2 0.0 716 14.4 A2LR115 CCLF2CF3 154.47 −39.3 80.0 3.13 1.63 1020 0.57 7230 none A1
R1270 CH3-CH=CH2 42.08 −47.7 92.4 4.67 4.48 0.001 0.0 <20 2.7 A3R1234yf CF3CF=CH2 114.04 −29.5 94.7 3.38 2.10 0.029 0.0 4.4 6.2 A2L
R22 CHCLF2 86.47 −40.8 96.2 4.99 1.91 11.9 0.04 1790 none A1R290 C3H8 44.10 −42.1 96.7 4.25 4.58 0.041 0.0 ~20 2.1 A3
R134a CF3-CH2F 102.0 −26.1 101.1 4.06 1.95 13.4 0.0 1370 none A1R227ea CF3-CHF-CF3 170.0 −16.3 101.8 2.93 1.68 38.9 0.0 3580 none A1
R1234ze(E) CHF=CHCF3 114.04 −19.0 109.4 3.64 2.04 0.045 0.0 6 7.6 A2LR152a CH3-CHF2 66.05 −24.0 113.3 4.52 2.72 1.1 0.0 133 4.8 A2R236fa CF3-CH2-CF3 152.0 −1.5 124.9 3.20 1.81 242 0.0 9820 none A1RE170 CH3-O-CH3 46.1 −24.8 127.2 5.34 3.65 0.015 0.0 <1 3.4 A3R600a iso-C4H10 58.12 −11.7 134.7 3.63 4.46 0.016 0.0 ~20 1.6 A3R600 C4H10 58.12 −0.55 152.0 3.80 4.39 0.018 0.0 ~20 2.0 A3
R1233zd(E) CHCL=CH-CF3 130.5 18.3 165.6 3.57 2.10 0.071 0.0 — — —R245ca CHF2-CF2-CH2F 134.1 25.3 174.4 3.94 1.90 6.5 0.0 726 7.1 —R601a CH3CH2CH(CH3)2 72.15 27.8 187.2 3.38 4.24 0.009 0.0 ~20 1.3 A3R601 CH3(CH2)3CH3 72.15 36.1 196.6 3.37 4.31 0.009 0.0 ~20 1.2 A3
R602a (CH3)2CH(CH2)2CH3 86.2 60.2 224.6 3.04 4.27 — 0.0 ~20 1.2 A3R602 CH3-4(CH2)-CH3 86.2 68.7 234.7 3.03 4.29 — 0.0 ~20 1.2 A3
cyclopentane C5H10 70.1 49.3 238.6 4.57 3.73 0.007 0.0 <0.1 1.1 A3R603 CH3-5(CH2)-CH3 100.2 98.4 267.0 2.74 4.31 — 0.0 3 1.2 —R604 CH3-6(CH2)-CH3 114.2 125.6 296.2 2.50 4.26 — 0.0 3 1.0 —
3. Mathematical Model
3.1. VCRC Mathematical Model
The mathematical thermodynamic model for the VCRC can be described as follows:
.Wcomp,a =
.m (h4a − h1) =
.Wcomp,s
ηcomp=
.m (h4s − h1)
ηcomp(1)
where.
Wcomp,a and.
Wcomp,s are the actual and isentropic compressor power, respectively, ηcomp is thecompressor isentropic efficiency,
.m is the refrigerant mass flow rate, and h is the specific enthalpy
indicated in the subscript..
Qeva =.
m (h1 − h9) (2)
where.
Qeva is the refrigeration capacity.
COPVCRC =
.Qeva.
Wcomp,a(3)
CCR =P4
P1(4)
where CCR is the compressor compression ratio, and P1 and P4 are the pressure at the compressor inletand outlet, respectively.
3.2. TSVCRC Mathematical Model
The mathematical model for the TSVCRC is described as follows:
ER =P5 − P6
P5(5)

Processes 2020, 8, 1017 6 of 13
where ER is the expansion ratio in the upper sub-cycle expansion valve, and P5 and P6 are the pressuresat the expansion valve inlet and outlet, respectively.
The refrigerant two streams mass flow rate outlet from the flash chamber can be calculated byapplying the mass and energy conservation principles as follows:
.m =
.m1 +
.m2 (6)
.m h6 =
.m1h8 +
.m2 h7 (7)
where.
m is the total mass flow rate in the upper sub-cycle, and.
m1 and.
m2 are the vapor and liquidmass flow rates exit from the flash chamber.
The specific enthalpy at the heat exchanger outlet (h3) can be found by applying energy balance tothe heat exchanger:
h3 =
.m1h2 +
.m2 h7
.m
(8)
.Wcomp1,a =
.m1 (h2a − h1) =
.Wcomp1,s
ηcomp1=
.m1 (h2s − h1)
ηcomp1(9)
.Wcomp2,a =
.m (h4a − h3) =
.Wcomp2,s
ηcomp2=
.m (h4s − h3)
ηcomp2(10)
.W =
.Wcomp1,a +
.Wcomp2,a (11)
.Qeva =
.m1 (h1 − h9) (12)
COPTSVCRC =
.Qeva
.W
(13)
4. Results and Discussion
4.1. Thermodynamic Data
The BACKONE equations are a family of physically-based equations of state which are able todescribe thermodynamic properties of nonpolar, dipolar and quadrupolar fluids with a very goodaccuracy. The BACKONE equations yield accurate thermodynamic properties of pure as well asmixed refrigerants. Because of their high predictive power the BACKONE equations are a reliabletool for the application to many different pure and mixed refrigerants, especially if there is a lack ofreliable data. The thermodynamic properties of many pure working fluids were described precisely byBACKONE [22–27]. Also, the thermodynamic properties of binary mixtures were described accuratelywith BACKONE [27–29]. One binary interaction parameter (k12) was fitted for each binary systemonly to binary vapor-liquid equilibrium (VLE) data. None of the previous studies which studied theTSVCRC with intermediate intercooler and flash tank used BACKONE to calculate the refrigerantsthermodynamic properties. In the present study, the thermodynamic properties of the investigatedpure and mixed refrigerants are computed by the BACKONE equation of state. Table 2 gives anoverview of the investigated mixtures and their phase behavior, where x1 denotes the concentration atazeotrope [29]. A computer program is developed to evaluate and compare the VCRC and TSVCRCperformances using all candidates under various operating conditions.
Some results for binary VLE data calculated by BACKONE are displayed in Figure 3 [23].The mixtures are divided into two categories, i.e., negative azeotrope and positive azeotrope.R134a + RE170 is an example of a distinctive negative azeotropic mixture as shown in Figure 3a.An azeotropic mixture at approximately 30 mole % R134a would be very suitable for an application as arefrigerant. R134a + R600a is an example of a typical positive azeotropic mixture as shown in Figure 3b.The azeotrope is at nearly 72 mole % R134a. The negative and positive azeotropes are depending on

Processes 2020, 8, 1017 7 of 13
negative or positive deviations from Raoult’s law. The mixtures of ethers with HFCs have typicallynegative deviation from Raoult’s law, while RE170 with the R290 or R600a show positive deviation fromRaoult’s law. The negative deviation is attributing to the hydrogen bonding of the ethers. The physicalbackground of BACKONE does not allow hydrogen bonding. However, the different deviations fromRaoult’s law are refracted in the parameter k12. Negative k12 yields negative deviations; positive k12
yields positive deviations from Raoult’s law. R125 + R143a is the only mixture without ether whichdisplays a negative deviation from Raoult and it has a negative k12.
4.2. Performance Analysis of VCRC
A comparison between the performance of the VCRC using various pure and mixed alternativerefrigerants is conducted. Fourteen pure components and sixteen mixtures are examined as alternativerefrigerants in VCRC. The evaporator and condenser temperatures are fixed at −10 ◦C and 35 ◦C,respectively. The compressor efficiency is kept constant at 80%. The refrigerant mass flow rate is fixedat 1 kg/s. The
.W,
.Qeva, COP, Tdis, and CCR are calculated and compared for each candidate.
Table 2. VLE of the investigated mixtures calculated by BACKONE.
Mixture Phase Behavior x1 k12
R290 + R143a azeotropic 0.35 0.077R125 + R290 azeotropic 0.65 0.083
R600a + R236fa azeotropic 0.56 0.081R227ea + R600a azeotropic 0.63 0.072R134a + R290 azeotropic 0.40 0.073
R134a + R600a azeotropic 0.71 0.073R152a + R600a azeotropic 0.74 0.071R125 + R143a near azeotropic 0.0:1.0 −0.032R32 + R125 near azeotropic <0.19, >0.69 0.006R32 + R290 azeotropic 0.68 0.033
R32 + R143a near azeotropic 0.85 0.003RE170 + R600a azeotropic 0.90 0.026RE170 + R290 azeotropic 0.1 0.028
R22 + R115 azeotropic 0.63 0.044R134a + RE170 azeotropic 0.30 −0.034R1270 + R134a azeotropic 0.81 0.051Processes 2020, 8, x FOR PEER REVIEW 8 of 14
Figure 3. Pressure-concentration diagrams for; negative azeotrope (a), and positive azeotrope (b).
Table 3 lists the results of Ẇ, 𝑄 , COP, Tdis, and CCR for the VCRC using the investigated pure refrigerants besides the refrigerant type. Cyclopentane accomplishes the uppermost Q of 351.2 kW. Cyclopentane and RE170 exhibited higher Ẇ than R22 and R134a, but their higher Q will compensate for this.
While examining alternative refrigerants the lifespan, compressor motor durability, and system consistency should be investigated. These parameters can be inspected by computing Tdis. The Tdis depends on refrigerant and system pressure, and it must be controlled to avert oil properties deterioration or even burnout the oil. High Tdis is harmful to the system performance and indicates high stress on the compressor and hence a shorter compressor life [30,31]. Table 3 shows that R22 achieves the highest Tdis. Thus, it indicates longer compressor life when using any inspected alternative refrigerant compared to R22. The Tdis for all investigated pure refrigerants is reduced by 4.21 °C to 31.66 °C compared to R22.
Table 3. Results for VCRC using investigated pure refrigerants.
Refrigerant Type Ẇ, kW 𝐐𝐞𝐯𝐚, kW COP Tdis, °C CCR cyclopentane o 84.8 351.2 4.14 62.48 7.20 R1233zd(E) i 39.5 154.4 3.91 43.79 6.08
R1234yf i 31.1 109.1 3.51 37.92 4.04 R1234ze(E) i 35.2 129.4 3.68 40.47 4.53
R22 b 42.0 158.1 3.77 66.69 3.82 R604 o 72.7 287.4 3.96 35.83 17.25 R603 o 72.8 288.0 3.96 36.10 12.31
R602a o 69.3 271.4 3.92 35.02 7.99 R602 o 73.1 288.7 3.95 36.68 8.82
R601a o 69.6 270.9 3.90 36.61 5.87 R601 o 73.8 290.0 3.93 38.03 6.43 R600 o 74.2 286.9 3.87 40.37 4.72
R600a o 68.0 257.3 3.78 39.11 4.29 R134a b 38.7 143.7 3.72 48.24 4.42 R245ca o 41.8 162.5 3.89 41.00 7.05 RE170 b 86.9 340.3 3.92 58.89 4.21
Figure 4 displays the COP of the VCRC using all examined pure candidates. Cyclopentane accomplishes the topmost COP of 4.14, while R1234yf attains the lowermost COP of 3.51. R22 and R134a achieve COP of 3.77 and 3.71, respectively. Cyclopentane achieves the best cycle performance and seems to be the best replacement for R22 and R134a. The COP of cyclopentane is 9.9% and 11.5% greater than those of R22 and R134a, respectively.
Figure 3. Pressure-concentration diagrams for; negative azeotrope (a), and positive azeotrope (b).
Table 3 lists the results of.
W,.
Qeva, COP, Tdis, and CCR for the VCRC using the investigatedpure refrigerants besides the refrigerant type. Cyclopentane accomplishes the uppermost
.Qeva of
351.2 kW. Cyclopentane and RE170 exhibited higher.
W than R22 and R134a, but their higher.
Qeva willcompensate for this.

Processes 2020, 8, 1017 8 of 13
While examining alternative refrigerants the lifespan, compressor motor durability, and systemconsistency should be investigated. These parameters can be inspected by computing Tdis. The Tdis
depends on refrigerant and system pressure, and it must be controlled to avert oil propertiesdeterioration or even burnout the oil. High Tdis is harmful to the system performance and indicateshigh stress on the compressor and hence a shorter compressor life [30,31]. Table 3 shows that R22achieves the highest Tdis. Thus, it indicates longer compressor life when using any inspected alternativerefrigerant compared to R22. The Tdis for all investigated pure refrigerants is reduced by 4.21 ◦C to31.66 ◦C compared to R22.
Table 3. Results for VCRC using investigated pure refrigerants.
Refrigerant Type.
W, kW.
Qeva, kW COP Tdis, ◦C CCR
cyclopentane o 84.8 351.2 4.14 62.48 7.20R1233zd(E) i 39.5 154.4 3.91 43.79 6.08
R1234yf i 31.1 109.1 3.51 37.92 4.04R1234ze(E) i 35.2 129.4 3.68 40.47 4.53
R22 b 42.0 158.1 3.77 66.69 3.82R604 o 72.7 287.4 3.96 35.83 17.25R603 o 72.8 288.0 3.96 36.10 12.31
R602a o 69.3 271.4 3.92 35.02 7.99R602 o 73.1 288.7 3.95 36.68 8.82
R601a o 69.6 270.9 3.90 36.61 5.87R601 o 73.8 290.0 3.93 38.03 6.43R600 o 74.2 286.9 3.87 40.37 4.72
R600a o 68.0 257.3 3.78 39.11 4.29R134a b 38.7 143.7 3.72 48.24 4.42R245ca o 41.8 162.5 3.89 41.00 7.05RE170 b 86.9 340.3 3.92 58.89 4.21
Figure 4 displays the COP of the VCRC using all examined pure candidates. Cyclopentaneaccomplishes the topmost COP of 4.14, while R1234yf attains the lowermost COP of 3.51. R22 andR134a achieve COP of 3.77 and 3.71, respectively. Cyclopentane achieves the best cycle performanceand seems to be the best replacement for R22 and R134a. The COP of cyclopentane is 9.9% and 11.5%greater than those of R22 and R134a, respectively.
Processes 2020, 8, x FOR PEER REVIEW 9 of 14
The CCR is a measure for the required compressor size. Accordingly, to use an alternative refrigerant as a replacement refrigerant in an existing system without changing the compressor, its CCR should be similar to that of the existing refrigerant. Figure 5 shows the COP and CCR values using pure refrigerants relative to reference refrigerants R22 and R134a. Figure 5a shows the COP and CCR values relative to R22. It can be detected that most of the examined pure refrigerants (12 refrigerant) have a higher COP than R22. R134a and R1234ze(E) have COP values a little lower than that of R22 while they have CCR values very close to that of R22. R600, R600a, and RE170 have COP values a little higher than that of R22 while having CCR very close to that of R22. Cyclopentane has the highest COP and its CCR is nearly 1.9 times that of R22.
Figure 4. The COP of VCRC using pure refrigerants.
Figure 5. Comparison of the COP and CCR of pure alternative refrigerants relative to R22 (a) and R134a (b).
Figure 5b displays the COP and CCR values relative to R134a. R600a, R600, and RE170 have COP values higher than that of R134a besides they have CCR values very close to that of R134a. R1234ze(E) has a similar CCR with that of R134a while achieves a lower COP. Cyclopentane has a much higher COP than that of R134a and its CCR 1.6 times that of R134a. From Figure 5, if it is desired to replace R22 or R134a in the already existing systems, RE170 may be considered the best alternative because it has the same CCR as R22 and R134a while it has a higher COP. For new systems, cyclopentane may consider as the best refrigerant to substitute R22 and R134a. Cyclopentane has zero ODP and very low GWP, appropriate to widespread materials used in refrigeration systems and soluble in common mineral oils. The most worry regarding the adoption of cyclopentane as a replacement for R22 and R134a is its flammability. It should be noticed that a huge amount of HCs are utilized safely each year all over the world for heating, cooking, aerosol propellants and powering vehicles. In such industries,
Figure 4. The COP of VCRC using pure refrigerants.
The CCR is a measure for the required compressor size. Accordingly, to use an alternativerefrigerant as a replacement refrigerant in an existing system without changing the compressor, its CCRshould be similar to that of the existing refrigerant. Figure 5 shows the COP and CCR values usingpure refrigerants relative to reference refrigerants R22 and R134a. Figure 5a shows the COP and CCRvalues relative to R22. It can be detected that most of the examined pure refrigerants (12 refrigerant)

Processes 2020, 8, 1017 9 of 13
have a higher COP than R22. R134a and R1234ze(E) have COP values a little lower than that of R22while they have CCR values very close to that of R22. R600, R600a, and RE170 have COP values a littlehigher than that of R22 while having CCR very close to that of R22. Cyclopentane has the highest COPand its CCR is nearly 1.9 times that of R22.
Processes 2020, 8, x FOR PEER REVIEW 9 of 14
The CCR is a measure for the required compressor size. Accordingly, to use an alternative refrigerant as a replacement refrigerant in an existing system without changing the compressor, its CCR should be similar to that of the existing refrigerant. Figure 5 shows the COP and CCR values using pure refrigerants relative to reference refrigerants R22 and R134a. Figure 5a shows the COP and CCR values relative to R22. It can be detected that most of the examined pure refrigerants (12 refrigerant) have a higher COP than R22. R134a and R1234ze(E) have COP values a little lower than that of R22 while they have CCR values very close to that of R22. R600, R600a, and RE170 have COP values a little higher than that of R22 while having CCR very close to that of R22. Cyclopentane has the highest COP and its CCR is nearly 1.9 times that of R22.
Figure 4. The COP of VCRC using pure refrigerants.
Figure 5. Comparison of the COP and CCR of pure alternative refrigerants relative to R22 (a) and R134a (b).
Figure 5b displays the COP and CCR values relative to R134a. R600a, R600, and RE170 have COP values higher than that of R134a besides they have CCR values very close to that of R134a. R1234ze(E) has a similar CCR with that of R134a while achieves a lower COP. Cyclopentane has a much higher COP than that of R134a and its CCR 1.6 times that of R134a. From Figure 5, if it is desired to replace R22 or R134a in the already existing systems, RE170 may be considered the best alternative because it has the same CCR as R22 and R134a while it has a higher COP. For new systems, cyclopentane may consider as the best refrigerant to substitute R22 and R134a. Cyclopentane has zero ODP and very low GWP, appropriate to widespread materials used in refrigeration systems and soluble in common mineral oils. The most worry regarding the adoption of cyclopentane as a replacement for R22 and R134a is its flammability. It should be noticed that a huge amount of HCs are utilized safely each year all over the world for heating, cooking, aerosol propellants and powering vehicles. In such industries,
Figure 5. Comparison of the COP and CCR of pure alternative refrigerants relative to R22 (a) andR134a (b).
Figure 5b displays the COP and CCR values relative to R134a. R600a, R600, and RE170 have COPvalues higher than that of R134a besides they have CCR values very close to that of R134a. R1234ze(E)has a similar CCR with that of R134a while achieves a lower COP. Cyclopentane has a much higherCOP than that of R134a and its CCR 1.6 times that of R134a. From Figure 5, if it is desired to replaceR22 or R134a in the already existing systems, RE170 may be considered the best alternative because ithas the same CCR as R22 and R134a while it has a higher COP. For new systems, cyclopentane mayconsider as the best refrigerant to substitute R22 and R134a. Cyclopentane has zero ODP and verylow GWP, appropriate to widespread materials used in refrigeration systems and soluble in commonmineral oils. The most worry regarding the adoption of cyclopentane as a replacement for R22 andR134a is its flammability. It should be noticed that a huge amount of HCs are utilized safely each yearall over the world for heating, cooking, aerosol propellants and powering vehicles. In such industries,procedures and standards have been established and adopted for safety. A similar approach is followedin the refrigeration industry as well.
Table 4 lists the results of.
W,.
Qeva, COP, Tdis, and CCR for the VCRC using the investigatedmixtures. R134a + RE170 and RE170 + R600a accomplish the topmost COP values of 3.96 and 3.94,respectively. The COP of R134a + RE170 is 5.0% and 6.6% higher than those of R22 and R134a,respectively. The two mixtures achieve approximately the same Tdis which is lower than that of R22 by11.5 ◦C and higher than that of R134a by about 7.1 ◦C. R125 + R290 achieves the lowermost COP of 3.06.
Figure 6a,b display the COP and CCR values using all investigated mixtures relative to R22 andR134a. It can be detected from Figure 6a that most of the examined mixtures (14 mixtures) have alower COP than R22. R152a + R600a and R22 have a similar COP and their CCR matches very well.The CCRs of both mixtures RE170 + R600a and R134a + RE170 are a little higher than that of R22,but they accomplish the highest COP. It can be observed from Figure 6b that most of the investigatedmixtures (13 mixtures) have a lower COP than that of R134a. The COP and CCR attained by R600a+ R236fa are approximately the same as those accomplished by R134a. The CCRs of RE170 + R600aand R134a + RE170 match very well with that of R134a while accomplishing the highest COP value.Accordingly, the two azeotropic mixtures RE170 + R600a and R134a + RE170 can be considered aspromising alternatives for R22 and R134a.

Processes 2020, 8, 1017 10 of 13
4.3. Performance Analysis of TSVCRC
To find the best working conditions for the TSVCRC for COPmax, an optimization procedurewas carried out to find the best ER. The procedure used in the optimization process is as follows.The condenser and evaporator temperatures were kept constant at 35 ◦C, −10 ◦C, respectively. The twocompressors isentropic efficiencies were kept constant at 80%. The refrigerant mass flow rate in thesecond compressor, condenser, and the first expansion valve was fixed at 1 kg/s. According to ER,the mass flow in the second expansion valve, evaporator, and the first compressor was calculated.The
.W,
.Qeva, and the COP were calculated and compared for each ER. The ER achieves the COPmax
was considered as optimum ER. The ER was examined in the range between 0.2 and 0.8. This rangeis selected because lower ER values make TSVCRC tends to VCRC, while higher ones are notpracticable. This procedure was followed for all candidates. A comparison between the performanceof TSVCRC using all candidates is conducted. The
.W,
.Qeva, and COP are calculated and compared for
each candidate.
Table 4. Results for VCRC using investigated mixtures.
Mixture.
W, kW.
Qeva, kW COP Tdis, ◦C CCR
R290 + R143a 42.3 138.6 3.28 49.66 3.40R125 + R290 30.9 94.5 3.06 45.26 3.42
R600a + R236fa 41.9 155.2 3.70 44.86 4.44R227ea + R600a 29.1 99.2 3.40 36.63 4.16R134a + R290 54.0 181.7 3.37 38.66 3.52
R134a + R600a 41.3 148.4 3.60 47.72 4.05R152a + R600a 59.8 225.2 3.76 53.03 4.12R125 + R143a 31.6 104.6 3.31 44.67 3.68R32 + R125 46.6 166.0 3.56 67.98 3.73R32 + R290 60.7 203.7 3.35 65.81 3.38
R32 + R143a 59.8 217.1 3.63 74.86 3.71RE170 + R600a 82.5 325.2 3.94 55.11 4.18RE170 + R290 74.1 273.6 3.69 48.95 3.55
R22 + R115 28.6 99.8 3.49 45.41 3.60R134a + RE170 63.2 250.0 3.96 55.29 4.33R1270 + R134a 59.7 216.5 3.63 53.20 3.49Processes 2020, 8, x FOR PEER REVIEW 11 of 14
Figure 6. Comparison of the COP and CCR of the inspected mixtures relative to R22 (a) and R134a (b).
The variations of COP of the TSVCRC with ER using all inspected pure and mixed refrigerants are presented in Figure 7a,b, respectively. Generally, for both pure and mixed refrigerants, the COP increases with the increase of ER until a maximum value then decreases with the continuous increase of ER. Among all investigated pure refrigerants as can be detected from Figure 7a, cyclopentane accomplishes the highest COP for all examined ER. With respect to mixtures as shown in Figure 7b, R134a + RE170 accomplishes the highest COP for all examined ER.
Figure 8 displays the COPmax of the TSVCRC using pure and mixed refrigerants. As shown in Figure 8a, cyclopentane achieves the highest COPmax. The COPmax using cyclopentane is 4.35 at an ER of 0.6 which is higher than those of R22 and R134a by about 6.9% and 5.8%, respectively. As shown in Figure 8b, R134a + RE170, and RE170 + R600a accomplish the highest COPmax. The COPmax using R134a + RE170, and RE170 + R600a are 4.27 and 4.25, respectively at an ER of 0.5. The COPmax using R134a + RE170 is higher than those of R22 and R134a by about 4.98% and 3.86%, respectively. The COP of the VCRC and TSVCRC using cyclopentane is 4.15, 4.35, respectively. The gain in COP of the TSVCRC using cyclopentane compared with that of VCRC is approximately 5.1%. On the other side, the COP of the VCRC and TSVCRC using R134a + RE170 is 3.96, 4.27, respectively. The gain in COP of TSVCRC using R134a + RE170 compared with that of VCRC is nearly 7.96%. The TSVCRC presented a gain in COP between 5.1% and 19.6% compared with the VCRC based on the refrigerant type.
Figure 6. Comparison of the COP and CCR of the inspected mixtures relative to R22 (a) and R134a (b).
The variations of COP of the TSVCRC with ER using all inspected pure and mixed refrigerants arepresented in Figure 7a,b, respectively. Generally, for both pure and mixed refrigerants, the COP increaseswith the increase of ER until a maximum value then decreases with the continuous increase of ER.Among all investigated pure refrigerants as can be detected from Figure 7a, cyclopentane accomplishes
Processes 2020, 8, 1017 11 of 13
the highest COP for all examined ER. With respect to mixtures as shown in Figure 7b, R134a + RE170accomplishes the highest COP for all examined ER.
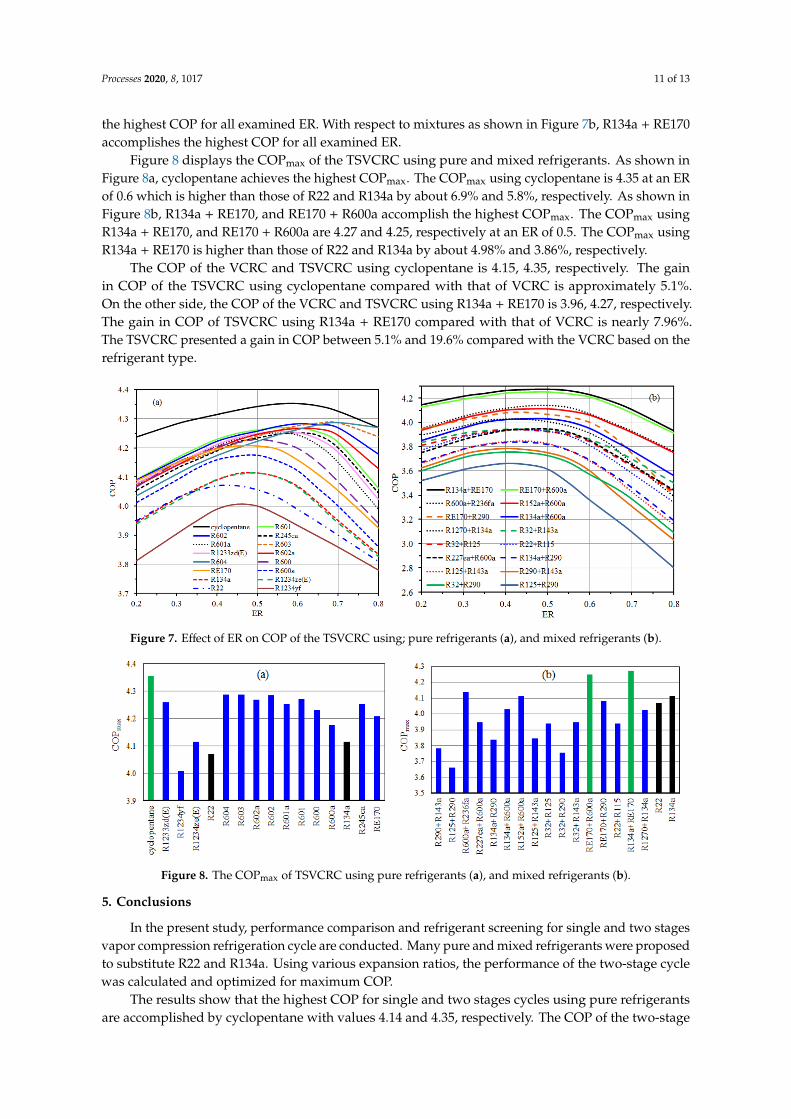
Figure 8 displays the COPmax of the TSVCRC using pure and mixed refrigerants. As shown inFigure 8a, cyclopentane achieves the highest COPmax. The COPmax using cyclopentane is 4.35 at an ERof 0.6 which is higher than those of R22 and R134a by about 6.9% and 5.8%, respectively. As shown inFigure 8b, R134a + RE170, and RE170 + R600a accomplish the highest COPmax. The COPmax usingR134a + RE170, and RE170 + R600a are 4.27 and 4.25, respectively at an ER of 0.5. The COPmax usingR134a + RE170 is higher than those of R22 and R134a by about 4.98% and 3.86%, respectively.
The COP of the VCRC and TSVCRC using cyclopentane is 4.15, 4.35, respectively. The gainin COP of the TSVCRC using cyclopentane compared with that of VCRC is approximately 5.1%.On the other side, the COP of the VCRC and TSVCRC using R134a + RE170 is 3.96, 4.27, respectively.The gain in COP of TSVCRC using R134a + RE170 compared with that of VCRC is nearly 7.96%.The TSVCRC presented a gain in COP between 5.1% and 19.6% compared with the VCRC based on therefrigerant type.
Processes 2020, 8, x FOR PEER REVIEW 11 of 14
Figure 6. Comparison of the COP and CCR of the inspected mixtures relative to R22 (a) and R134a (b).
The variations of COP of the TSVCRC with ER using all inspected pure and mixed refrigerants are presented in Figure 7a,b, respectively. Generally, for both pure and mixed refrigerants, the COP increases with the increase of ER until a maximum value then decreases with the continuous increase of ER. Among all investigated pure refrigerants as can be detected from Figure 7a, cyclopentane accomplishes the highest COP for all examined ER. With respect to mixtures as shown in Figure 7b, R134a + RE170 accomplishes the highest COP for all examined ER.
Figure 8 displays the COPmax of the TSVCRC using pure and mixed refrigerants. As shown in Figure 8a, cyclopentane achieves the highest COPmax. The COPmax using cyclopentane is 4.35 at an ER of 0.6 which is higher than those of R22 and R134a by about 6.9% and 5.8%, respectively. As shown in Figure 8b, R134a + RE170, and RE170 + R600a accomplish the highest COPmax. The COPmax using R134a + RE170, and RE170 + R600a are 4.27 and 4.25, respectively at an ER of 0.5. The COPmax using R134a + RE170 is higher than those of R22 and R134a by about 4.98% and 3.86%, respectively. The COP of the VCRC and TSVCRC using cyclopentane is 4.15, 4.35, respectively. The gain in COP of the TSVCRC using cyclopentane compared with that of VCRC is approximately 5.1%. On the other side, the COP of the VCRC and TSVCRC using R134a + RE170 is 3.96, 4.27, respectively. The gain in COP of TSVCRC using R134a + RE170 compared with that of VCRC is nearly 7.96%. The TSVCRC presented a gain in COP between 5.1% and 19.6% compared with the VCRC based on the refrigerant type.
Figure 7. Effect of ER on COP of the TSVCRC using; pure refrigerants (a), and mixed refrigerants (b).
Processes 2020, 8, x FOR PEER REVIEW 12 of 14
Figure 7. Effect of ER on COP of the TSVCRC using; pure refrigerants (a), and mixed refrigerants (b).
Figure 8. The COPmax of TSVCRC using pure refrigerants (a), and mixed refrigerants (b).
5. Conclusions
In the present study, performance comparison and refrigerant screening for single and two stages vapor compression refrigeration cycle are conducted. Many pure and mixed refrigerants were proposed to substitute R22 and R134a. Using various expansion ratios, the performance of the two-stage cycle was calculated and optimized for maximum COP.
The results show that the highest COP for single and two stages cycles using pure refrigerants are accomplished by cyclopentane with values 4.14 and 4.35, respectively. The COP of the two-stage cycle is greater than that of the single-stage cycle by about 5.1% using cyclopentane. The compressor compression ratio of cyclopentane matches well with those of R22 and R134a. On the other side, the maximum COP for single and two stages cycles using azeotropic mixtures are attained by R134a + RE170 with values 3.96 and 4.27, respectively. The gain in COP of the two-stage cycle using R134a + RE170 compared with that of the single-stage cycle is 7.96%. From the obtained results it can be concluded that, among the investigated pure and azeotropic refrigerants, cyclopentane is the most appropriate alternative for R22 and R134a for both cycles from the perspective of energy efficiency. However, its flammability needs extra precautions to be considered. As future work, an experimental test rig will be built to validate this theoretical study.
Author Contributions: Conceptualization, B.S.; data curation, A.A.A.; formal analysis, B.S.; funding acquisition, B.S.; investigation, B.S.; methodology, B.S.; project administration, B.S.; resources, M.B.; software, B.S.; supervision, B.S.; validation, B.S.; visualization, A.E.; writing—original draft, M.A.; writing—review & editing, B.S.. All authors have read and agreed to the published version of the manuscript.
Funding: This research was funded by Taif University under research grant number 1-439-6073.
Figure 8. The COPmax of TSVCRC using pure refrigerants (a), and mixed refrigerants (b).
5. Conclusions
In the present study, performance comparison and refrigerant screening for single and two stagesvapor compression refrigeration cycle are conducted. Many pure and mixed refrigerants were proposedto substitute R22 and R134a. Using various expansion ratios, the performance of the two-stage cyclewas calculated and optimized for maximum COP.
The results show that the highest COP for single and two stages cycles using pure refrigerantsare accomplished by cyclopentane with values 4.14 and 4.35, respectively. The COP of the two-stage

Processes 2020, 8, 1017 12 of 13
cycle is greater than that of the single-stage cycle by about 5.1% using cyclopentane. The compressorcompression ratio of cyclopentane matches well with those of R22 and R134a. On the other side,the maximum COP for single and two stages cycles using azeotropic mixtures are attained byR134a + RE170 with values 3.96 and 4.27, respectively. The gain in COP of the two-stage cycle usingR134a + RE170 compared with that of the single-stage cycle is 7.96%. From the obtained results it canbe concluded that, among the investigated pure and azeotropic refrigerants, cyclopentane is the mostappropriate alternative for R22 and R134a for both cycles from the perspective of energy efficiency.However, its flammability needs extra precautions to be considered. As future work, an experimentaltest rig will be built to validate this theoretical study.
Author Contributions: Conceptualization, B.S.; data curation, A.A.A.; formal analysis, B.S.; funding acquisition,B.S.; investigation, B.S.; methodology, B.S.; project administration, B.S.; resources, M.M.B.; software, B.S.;supervision, B.S.; validation, B.S.; visualization, A.E.; writing—original draft, M.A.; writing—review & editing,B.S. All authors have read and agreed to the published version of the manuscript.
Funding: This research was funded by Taif University under research grant number 1-439-6073.
Acknowledgments: This study is supported by Taif University under research grant 1-439-6073. The authorswould like to thank Taif University for the financial support.
Conflicts of Interest: The authors declare no conflict of interest.
References
1. Carvalho, S.M.R.; Massuchetto, L.H.P.; Nascimento, R.B.C.; Araujo, H.V.; D′Angelo, J.V.H. Optimization of avapor injection refrigeration cycle using hydrocarbon mixed refrigerants. Int. J. Refrig. 2019, 98, 109–119.[CrossRef]
2. Heo, J.; Jeong, M.W.; Kim, Y. Effects of flash tank vapor injection on the heating performance of aninverter-driven heat pump for cold regions. Int. J. Refrig. 2010, 33, 848–855. [CrossRef]
3. Park, C.; Lee, H.; Hwang, Y.; Radermacher, R. Recent advances in vapor compression cycle technologies.Int. J. Refrig. 2015, 60, 118–134. [CrossRef]
4. Xu, X.; Hwang, Y.; Radermacher, R. Refrigerant injection for heat pumping/air conditioning systems:Literature review and challenges discussions. Int. J. Refrig. 2011, 34, 402–415. [CrossRef]
5. Xu, S.; Fan, X.; Ma, G. Experimental investigation on heating performance of gas-injected scroll compressorusing R32, R1234yf and their 20wt%/80wt% mixture under low ambient temperature. Int. J. Refrig. 2017,75, 286–292. [CrossRef]
6. Qi, H.; Liu, F.; Yu, J. Performance analysis of a novel hybrid vapor injection cycle with subcooler and flashtank for air-source heat pumps. Int. J. Refrig. 2017, 74, 540–549. [CrossRef]
7. Tello-Oquendo, F.M.; Navarro-Perris, E.; Gonzalvez-Macia, J. A comprehensive study of two-stage vaporcompression cycles with vapor-injection for heating applications, taking into account heat sink of finitecapacity. Int. J. Refrig. 2018, 93, 52–64. [CrossRef]
8. Xu, S.; Niu, J.; Cui, Z.; Ma, G. Experimental research on vapor-injectetd heat pump using injection subcooling.Appl. Therm. Eng. 2018, 136, 674–681. [CrossRef]
9. Zhao, Y.; Li, Z.; Zhang, X.; Wang, X.; Dong, X.; Gao, B.; Gong, M.; Shen, J. Azeotropic refrigerants and itsapplication in vapor compression refrigeration cycle. Int. J. Refrig. 2019, 108, 1–13. [CrossRef]
10. Mohammad, T.; Hoseyn, S. Optimal design of a two-stage refrigeration cycle for natural gas pre-cooling in agas refinery considering the best allocation of refrigerant. Energy Convers. Manage. 2020, 210, 112743.
11. D′Angelo, J.V.H.; Aute, V.; Radermacher, R. Performance evaluation of a vapor injection refrigeration systemusing mixture refrigerant R290/R600a. Int. J. Refrig. 2016, 65, 194–208. [CrossRef]
12. Lee, Y.; Kang, D.; Jung, D. Performance of virtually non-flammable azeotropic HFO1234yf/HFC134a mixturefor HFC134a applications. Int. J. Refrig. 2013, 36, 1203–1207. [CrossRef]
13. Shaik, S.V.; Babu, T.P.A. Theoretical performance investigation of vapour compression refrigeration systemusing HFC and HC refrigerant mixtures as alternatives to replace R22. Energy Procedia 2017, 109, 235–242.[CrossRef]
14. Chen, J.; Havtun, H.; Palm, B. Screening of working fluids for the ejector refrigeration system. Int. J. Refrig.2014, 47, 1–14. [CrossRef]

Processes 2020, 8, 1017 13 of 13
15. Besagni, G.; Mereu, R.; Leo, G.D.; Inzoli, F. A study of working fluids for heat driven ejector refrigerationusing lumped parameter models. Int. J. Refrig. 2015, 58, 154–171. [CrossRef]
16. Calm, J.M. The next generation of refrigerants-Historical review, considerations, and outlook. Int. J. Refrig.2008, 31, 1123–1133. [CrossRef]
17. Gil, B.; Kasperski, J. Efficiency analysis of alternative refrigerants for ejector cooling cycles.Energy Convers. Manage. 2015, 94, 12–18. [CrossRef]
18. Molés, F.; Navarro-Esbrí, J.; Peris, B.; Mota-Babiloni, A.; Kontomaris, K. Thermodynamic analysis of acombined organic Rankine cycle and vapor compression cycle system activated with low temperature heatsources using low GWP fluids. Appl. Therm. Eng. 2015, 87, 444–453. [CrossRef]
19. Sethi, A.; Becerra, E.V.; Motta, S.Y. Low GWP R134a replacements for small refrigeration (plug-in) applications.Int. J. Refrig. 2016, 66, 64–72. [CrossRef]
20. Intergovernmental Panel on Climate Change (IPCC). Fifth Assessment Report: Climate Change; IPCC: Geneva,Switzerland, 2013.
21. Calm, J.M.; Hourahan, G.C. Physical, safety, and environmental data summary for current and alternativerefrigerants. In Proceedings of the 23rd International Congress of Refrigeration, Prague, Czech Republic,21–26 August 2011; pp. 1–22.
22. Saleh, B.; Weingerl, U.; Wendland, M. Description of the Thermodynamic Properties of Natural Refrigerantswith BACKONE Equations. In Proceedings of the IIR Conference on Thermophysical Properties and TransferProcesses of New Refrigerants, Paderborn, Germany, 3–5 October 2001; pp. 31–38.
23. Saleh, B.; Wendland, M. Screening of pure fluids as alternative refrigerants. Int. J. Refrig. 2006, 29, 260–269.[CrossRef]
24. Saleh, B.; Koglbauer, G.; Wendland, M.; Fischer, J. Working fluids for low temperature organic Rankine cycles.Energy 2007, 32, 1210–1221. [CrossRef]
25. Lai, N.A.; Wendland, M.; Fischer, J. Working fluids for high-temperature organic Rankine cycles. Energy2011, 36, 199–211. [CrossRef]
26. Saleh, B. Performance analysis and working fluid selection for ejector refrigeration cycle. Appl. Therm. Eng.2016, 107, 114–124. [CrossRef]
27. Saleh, B.; Wendland, M. Description of the Thermodynamic Properties of Fluorinate Ethers as Pure andMixed Refrigerants with BACKONE equations, abstract no. In Proceedings of the 17th IUPAC Conferenceon Chemical Thermodynamics, Rostock, Germany, 28 July–2 August 2002.
28. Saleh, B.; Wendland, M. Screening of mixture as alternative refrigerants. In Proceedings of the EurothermSeminar No. 72 on Thermodynamics, Heat and Mass Transfer of Refrigeration Machines and Heat Pumps,Valencia, Spain, 31 March–2 April 2003; pp. 331–336.
29. Lai, N.A.; Phan, T.T.H. Review of the BACKONE equation of state and its applications. Mol. Phys. 2017,115, 1041–1050. [CrossRef]
30. Bolaji, B.O.; Komolafe, D.O.; Ajayi, F.O.; Akinnibosun, E. Performance Assessment of Three Eco-FriendlyHydro-Fluorocarbon and Hydrocarbon Refrigerant Mixtures as R22 Alternatives in Refrigeration Systems.Middle East. J. Sci. Res. 2015, 23, 1677–1684.
31. Bolaji, B.O.; Oyelaran, O.A.; Okoye, O.C. Thermodynamic study of environment-friendly R429A, R435Aand R457A refrigerants as substitutes for ozone depleting R22 in refrigeration and air-conditioning systems.Sci. J. Marit. Res. 2017, 31, 45–52.
© 2020 by the authors. Licensee MDPI, Basel, Switzerland. This article is an open accessarticle distributed under the terms and conditions of the Creative Commons Attribution(CC BY) license (http://creativecommons.org/licenses/by/4.0/).