PDPM, Quality and Value: How to Succeed in 2019 and Beyond · •Facilities that fail to respond to...
25
3/12/2019 1 PDPM, Quality and Value: How to Succeed in 2019 and Beyond Presented by Maureen McCarthy, RN, BS, RAC-MT, QCP-MT, DNS-MT, RAC-MTA President, Celtic Consulting Maureen McCarthy, RN ,BS, RAC-MT, QCP-MT, DNS-MT, RAC-MTA Maureen is the President/CEO of Celtic Consulting, LLC. She has been a registered nurse for 30 years with experience as an MDS Coordinator, Director of Nursing, Rehab Director and a Medicare biller. McCarthy is a recognized leader and expert in clinical reimbursement in the skilled nursing facility environment. She is certified in the resident assessment process, QAPI and Director of Nursing Services, by nationally recognized organizations and holds Master Teacher status in all three certifications. She sits on the Board of Directors for the American Association of Post-Acute Care Nurses (AAPACN) and serves as an Expert Advisory Panel member for American Association of Nurse Assessment Coordination (AANAC). McCarthy was recently presented the ACHCA 2018 Education Award. • Maureen and her associates at Celtic Consulting regularly provide the following services for SNFs, state affiliates and provider organizations: • 5 Star Quality Improvement Program • Quality Auditing • Clinical Care Management • PDPM/MDS/CMI Services • Compliance Solutions • Medicare Compliance Auditing • Customized Education / In-Services 1 2
Transcript of PDPM, Quality and Value: How to Succeed in 2019 and Beyond · •Facilities that fail to respond to...
3/12/2019
1
PDPM, Quality and Value: How to Succeed in 2019 and
Beyond Presented by
Maureen McCarthy, RN, BS, RAC-MT, QCP-MT, DNS-MT, RAC-MTA
President, Celtic Consulting
Maureen McCarthy, RN ,BS, RAC-MT, QCP-MT, DNS-MT, RAC-MTA
Maureen is the President/CEO of Celtic Consulting, LLC. She has been a registered nurse for 30 years with experience as an MDS Coordinator, Director of Nursing, Rehab Director and a Medicare biller.
McCarthy is a recognized leader and expert in clinical reimbursement in the skilled nursing facility environment. She is certified in the resident assessment process, QAPI and Director of Nursing Services, by nationally recognized organizations and holds Master Teacher status in all three certifications. She sits on the Board of Directors for the American Association of Post-Acute Care Nurses (AAPACN) and serves as an Expert Advisory Panel member for American Association of Nurse Assessment Coordination (AANAC). McCarthy was recently presented the ACHCA 2018 Education Award.
• Maureen and her associates at Celtic Consulting regularly provide the following services for SNFs, state affiliates and provider organizations:• 5 Star Quality Improvement Program• Quality Auditing• Clinical Care Management• PDPM/MDS/CMI Services • Compliance Solutions• Medicare Compliance Auditing• Customized Education / In-Services
1
2
3/12/2019
2
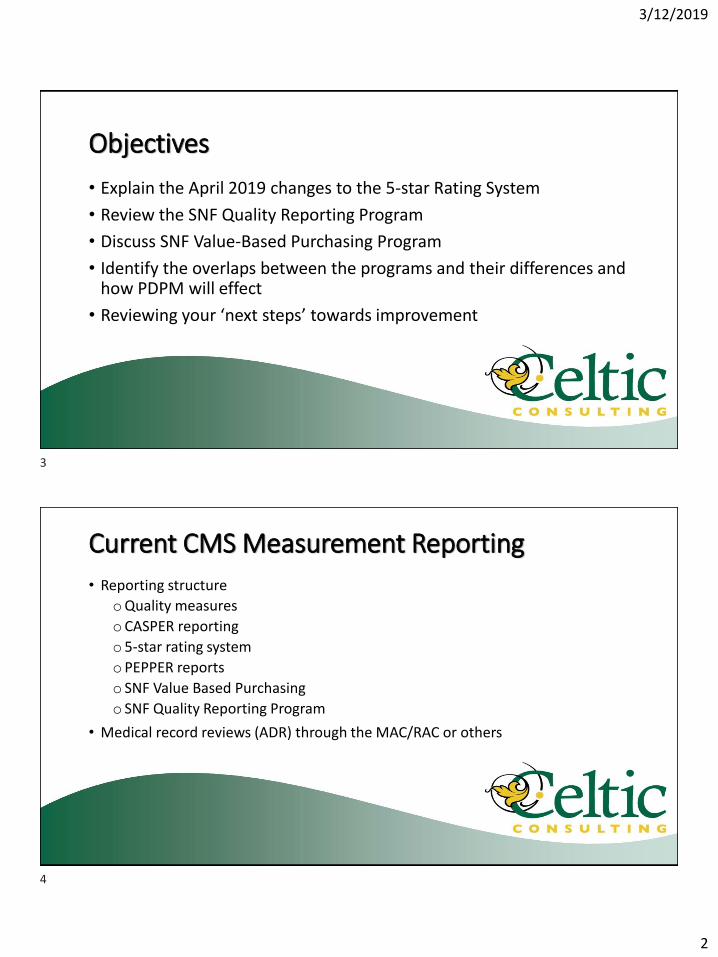
Objectives
• Explain the April 2019 changes to the 5-star Rating System
• Review the SNF Quality Reporting Program
• Discuss SNF Value-Based Purchasing Program
• Identify the overlaps between the programs and their differences and how PDPM will effect
• Reviewing your ‘next steps’ towards improvement
Current CMS Measurement Reporting
• Reporting structure
oQuality measures
oCASPER reporting
o5-star rating system
oPEPPER reports
o SNF Value Based Purchasing
o SNF Quality Reporting Program
• Medical record reviews (ADR) through the MAC/RAC or others
3
4

3/12/2019
3
5 Star Survey
Survey Weights-REVISED• 3 most recent annual inspections
• Includes substantiated complaint surveys
• Each deficiency is weighted by scope & severity
• More recent surveys weigh more heavily
• Most recent= ½ of survey score total
• 1st prior survey= 1/3 of survey score
• 2nd prior survey= 1/6 of survey score
5
6

3/12/2019
4
Complaint Surveys• Substantiated findings from last 36 months
• Within the last calendar year= ½ weight
• 13-24 months ago= 1/3 weight
• 25-36 months ago=1/6 weight
Re-survey for Compliance
7
8
3/12/2019
5
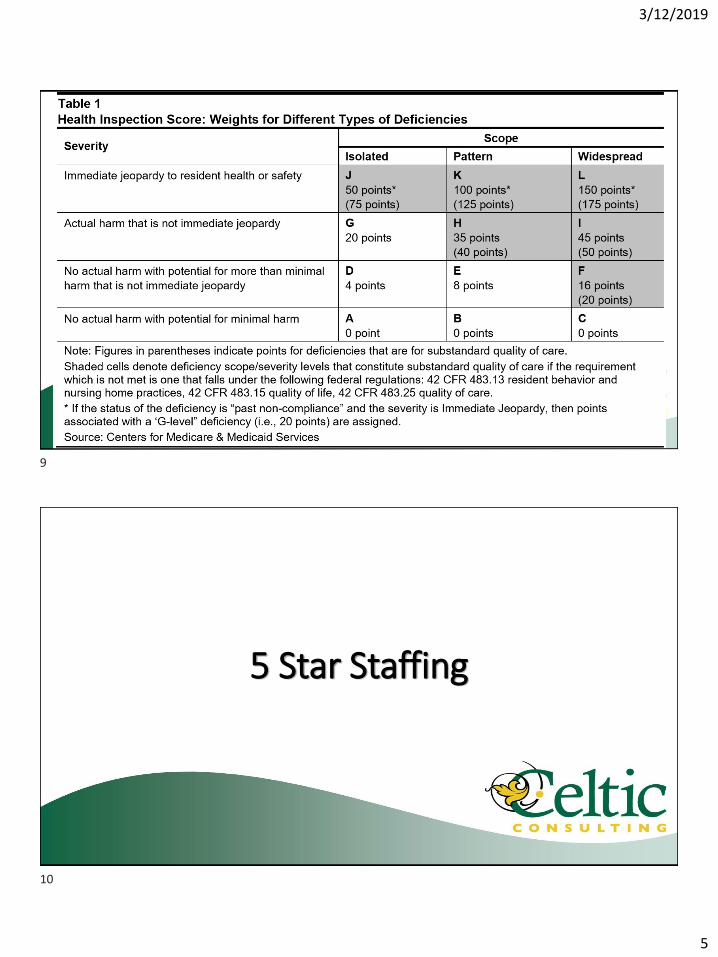
5 Star Staffing
9
10
3/12/2019
6
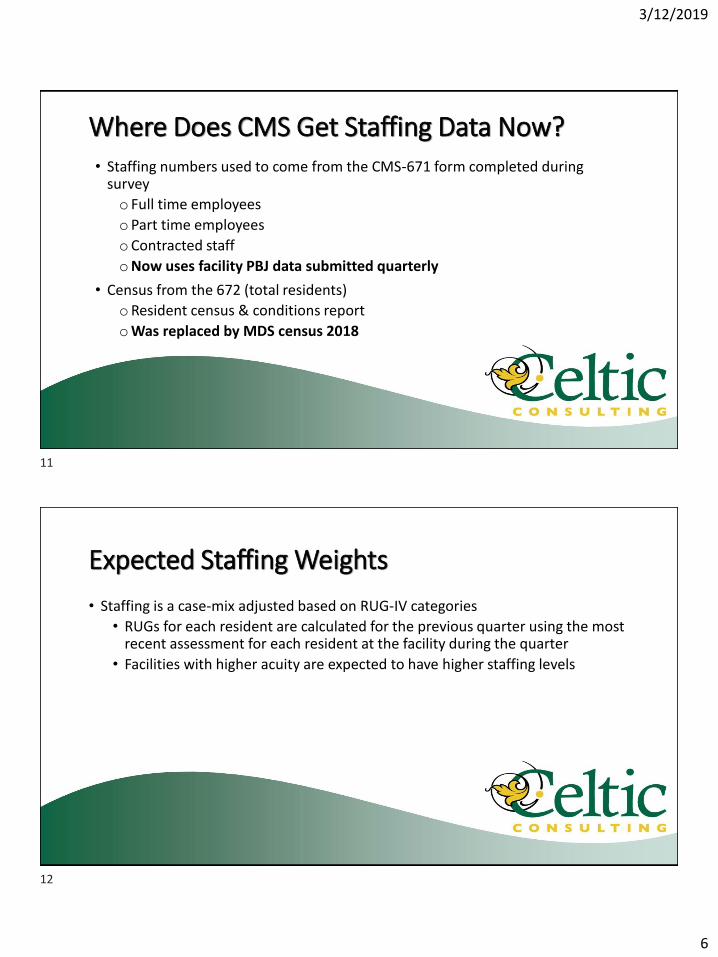
Where Does CMS Get Staffing Data Now?• Staffing numbers used to come from the CMS-671 form completed during
survey
o Full time employees
oPart time employees
oContracted staff
oNow uses facility PBJ data submitted quarterly
• Census from the 672 (total residents)
oResident census & conditions report
oWas replaced by MDS census 2018
Expected Staffing Weights
• Staffing is a case-mix adjusted based on RUG-IV categories
• RUGs for each resident are calculated for the previous quarter using the most recent assessment for each resident at the facility during the quarter
• Facilities with higher acuity are expected to have higher staffing levels
11
12

3/12/2019
7
PBJ Job Codes Used in the RN, LPN, and Nurse Aide Hours Calculations:• RN hours: Includes RN director of nursing (job code 5), registered nurses with
administrative duties (job code 6), and registered nurses (job code 7).
• LPN hours: Includes licensed practical/licensed vocational nurses with administrative duties (job code 8) and licensed practical/vocational nurses (job code 9)
• Nurse aide hours: Includes certified nurse aides (job code 10), aides in training (job code 11), and medication aides/technicians (job code 12)
The Daily Resident Census, is Derived From MDS Census and is Calculated as Follows:
1. Identify the reporting period (quarter) for which the census will be calculated (e.g., CY 2018 Q2: April 1 – June 30, 2018).
2. Extract MDS assessment data for all residents of a facility beginning one year prior to the reporting period to identify all residents that may reside in the facility (i.e., any resident with an MDS assessment may still reside in the facility). For example, for the CY 2018 Q2 reporting period, extract MDS data from April 1, 2017 through June 30, 2018
13
14
3/12/2019
8
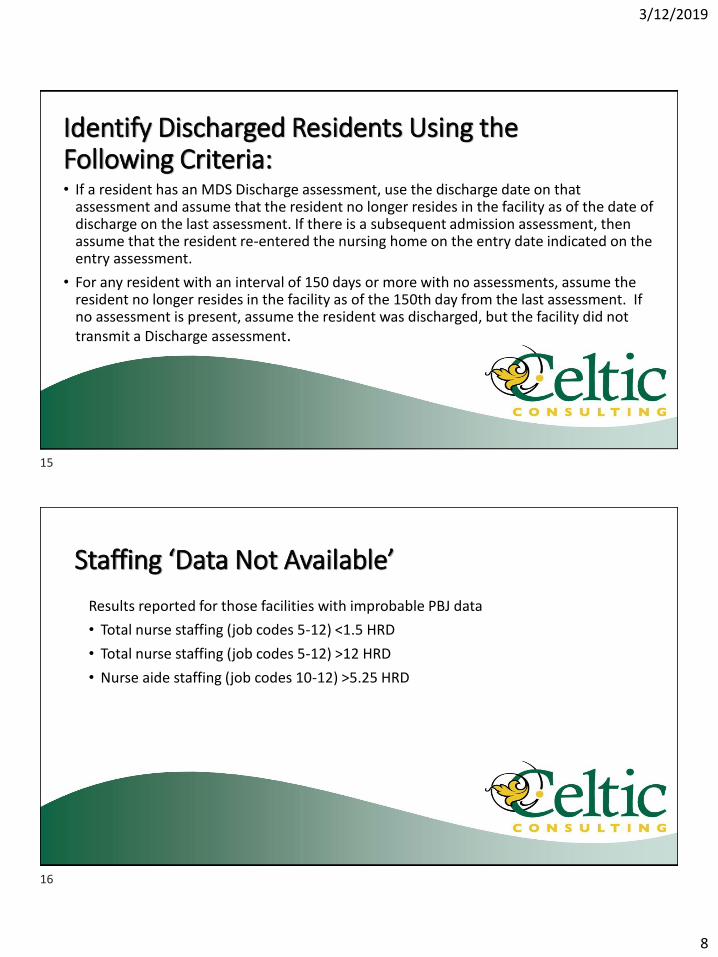
Identify Discharged Residents Using the Following Criteria:• If a resident has an MDS Discharge assessment, use the discharge date on that
assessment and assume that the resident no longer resides in the facility as of the date of discharge on the last assessment. If there is a subsequent admission assessment, then assume that the resident re-entered the nursing home on the entry date indicated on the entry assessment.
• For any resident with an interval of 150 days or more with no assessments, assume the resident no longer resides in the facility as of the 150th day from the last assessment. If no assessment is present, assume the resident was discharged, but the facility did not transmit a Discharge assessment.
Staffing ‘Data Not Available’
Results reported for those facilities with improbable PBJ data
• Total nurse staffing (job codes 5-12) <1.5 HRD
• Total nurse staffing (job codes 5-12) >12 HRD
• Nurse aide staffing (job codes 10-12) >5.25 HRD
15
16
3/12/2019
9
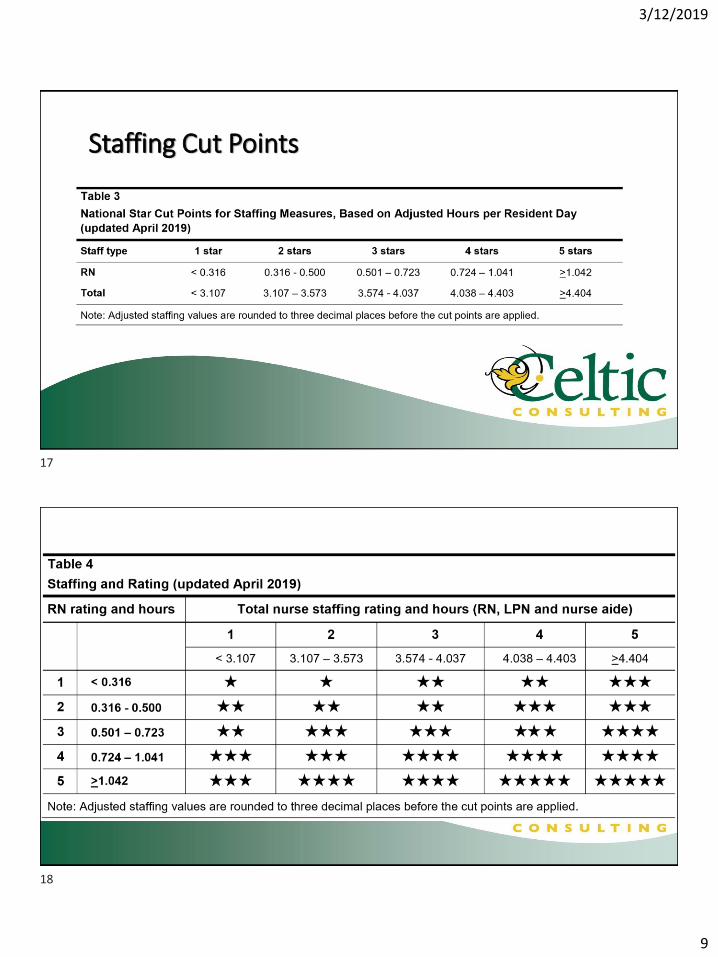
Staffing Cut Points
17
18

3/12/2019
10
Scoring Exceptions
• Providers that fail to submit any staffing data by the required deadline will receive a one-star rating for overall staffing and RN staffing for the quarter.
• Providers that submit staffing data indicating that there were four or more days in the quarter with no RN staffing hours (job codes 5-7) will receive a one-star rating for overall staffing and RN staffing for the quarter.
Scoring Exceptions• CMS conducts audits of nursing homes to verify the data submitted and to ensure
accuracy.
• Facilities that fail to respond to these audits and those for which the audit identifies significant discrepancies between the hours reported and the hours verified will receive a one-star rating for overall staffing and RN staffing for three months from the time at which the deadline to respond to audit requests passes or discrepancies are identified.
19
20
3/12/2019
11
5 Star Quality Measures
Measures for Long-Stay Residents • Percent of residents whose need for help with ADLs has increased
• Percent of residents whose ability to move independently worsened
• Percent of high-risk residents with pressure ulcers
• Percent of residents who have/had a catheter
• Percent of residents with a urinary tract infection
• Cut points have been recalculated- Deciles and Quintiles (15 or 20 point per level)
• Restraints removed
21
22

3/12/2019
12
Measures for Long-Stay Residents • Percent of residents experiencing one or more falls with major injury
• Percent of residents who self-report moderate to severe pain
• Percent of residents who received an antipsychotic medication
• Number of hospitalizations per 1,000 long-stay resident days*
• Number of outpatient emergency department (ED) visits per 1,000 long-stay resident days*
*claims based measures
Measures for Short-Stay Residents• Percent of residents who made improvement in function
• Percent of SNF residents with pressure ulcers that are new or worsened
• Percent of residents who self-report moderate to severe pain
• Percent of residents who newly received an antipsychotic medication
23
24
3/12/2019
13
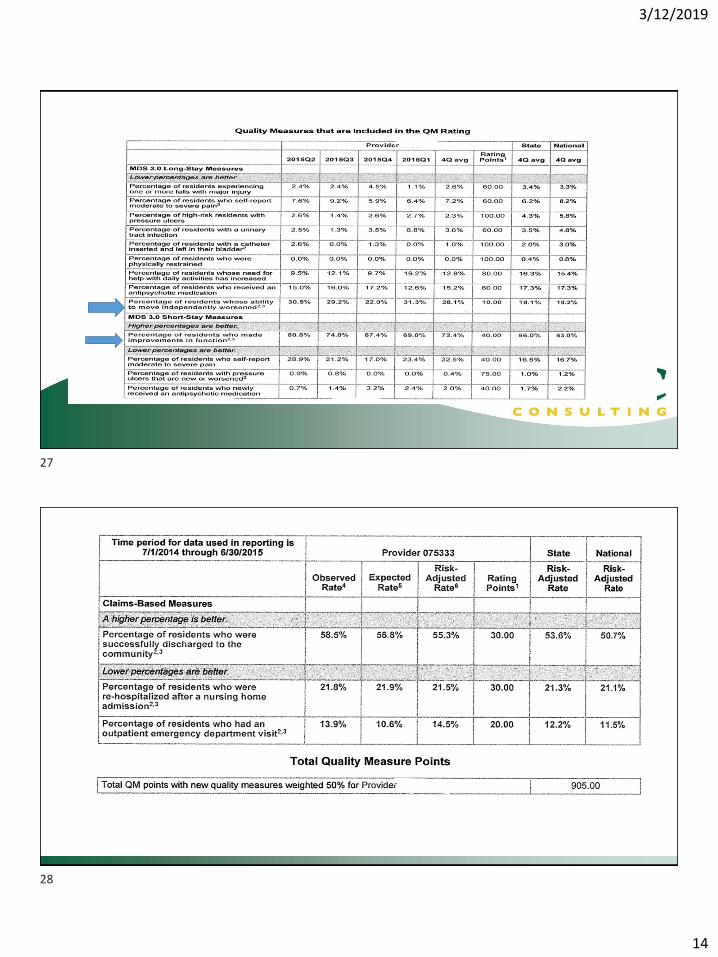
Measures for Short-Stay Residents-Claims• Percent of short-stay residents who were re-hospitalized after a nursing home
admission
• Percent of short-stay residents who have had an outpatient emergency department (ED) visit
• Rate of successful return to home and community from a SNF
• All of the claims-based measures are risk adjusted
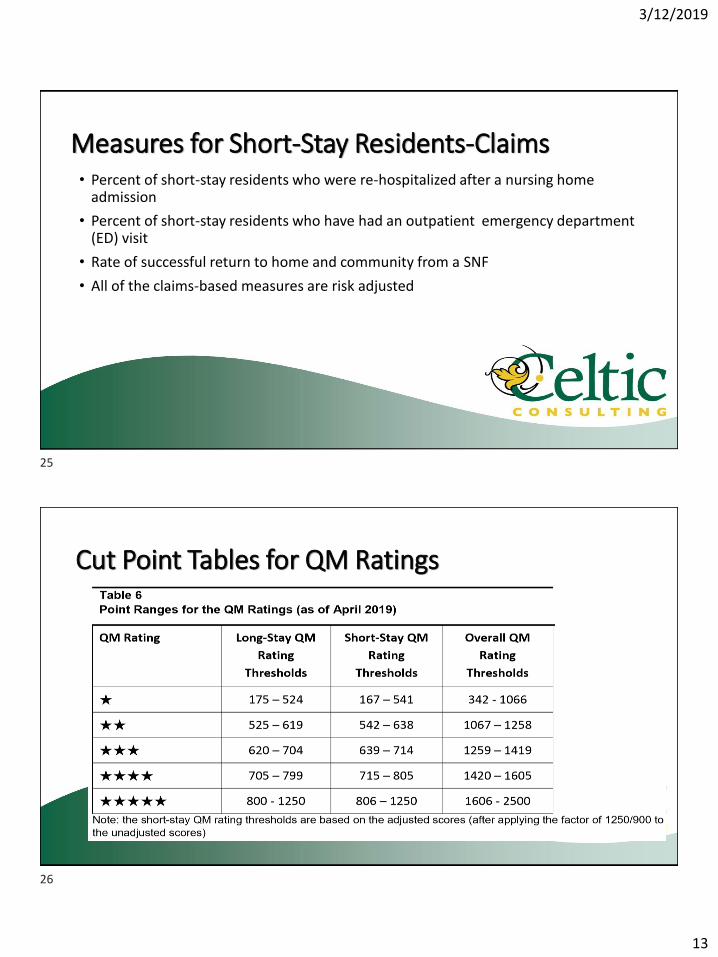
Cut Point Tables for QM Ratings
25
26
3/12/2019
14
27
28

3/12/2019
15
SNF Quality Reporting Program
QMs for SNFQRP Under IMPACT • 2016 MDS-Based Measures:
o Functional status and cognition changes from admit to d/c (10-1-16)o Skin integrity and changes: new or worsening pressure ulcers (10-1-16) *adding unstageable
pressure ulcers 10-1-18o Falls with major injury (10-1-16)
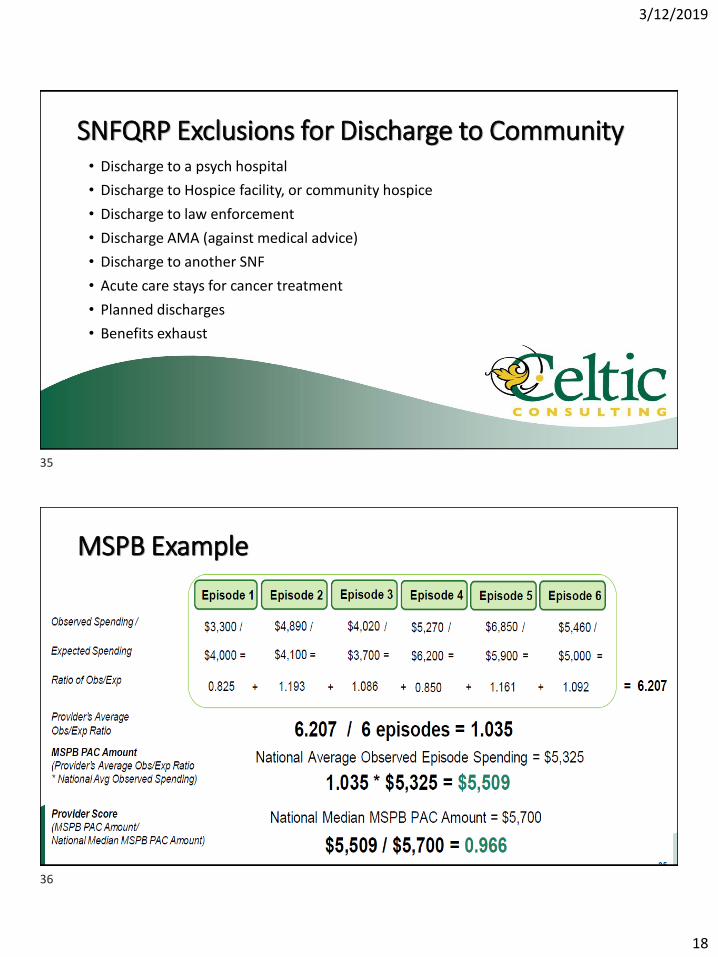
• 2017 Claims-Based Measures • MSPB-Medicare Spending per Beneficiary
• Discharge to Community
• Potentially Preventable Re-hospitalizations
• 2018 Additionso Medication reconciliation/Drug Regimen Review o Change in Self-Care Score for Medical Rehab Patientso Change in Mobility Score for Medical Rehab Patientso Discharge Self-Care Score for Medical Rehab Patientso Discharge Mobility Score for Medical Rehab Patients
• Care Plan- communication of health info (10-1-20?)
29
30
3/12/2019
16
Reporting Data• Collected through MDS submissions
oClaims data is not covered under this requirement
• At least 80% of all MDSs submitted must report this data (no dashes)
• DO NOT submit managed care MDSs unless they satisfy an OBRA (survey) MDS requirement, i.e. significant change, annual, admission, quarterly
• 2% penalty for not reporting per requirements
oPenalty is enforced for the entire fiscal year, annual payment update
Exclusions to PPR
• Discharge to another SNF/IRF/LTCH
• Residents who expire during their Medicare covered episode
• Discharges AMA (against medical advice)
• Acute care stay for cancer treatment or pregnancy
• Residents who exhaust their Medicare benefits
• Residents who were not Medicare beneficiaries for 12 months prior or 3 months after the stay
• Transfers to federal hospitals
• ESRD
31
32
3/12/2019
17
Most Common Reasons for Readmissions1. Inadequate management of chronic conditions
2. Inadequate management of infections
3. Inadequate management of other unplanned events
4. Inadequate injury prevention
*multiple SNF admissions during a 12 month period will all count
What’s Potentially Preventable?• Respiratory: COPD, asthma, aspiration PNA, bacterial PNA, flu
• Cardiac: CHF, hypo/hypertension, some arrhythmias
• Some diabetic complications
• Skin/Subcutanous: pressure ulcers, infections
• Septicemia
• GI/GU: UTI, Cdiff, dehydration, gastroenteritis, acute kidney failure, electrolyte imbalances, intestinal impaction
33
34
3/12/2019
18
SNFQRP Exclusions for Discharge to Community• Discharge to a psych hospital
• Discharge to Hospice facility, or community hospice
• Discharge to law enforcement
• Discharge AMA (against medical advice)
• Discharge to another SNF
• Acute care stays for cancer treatment
• Planned discharges
• Benefits exhaust
MSPB Example
35
36

3/12/2019
19
SNF Value Based Purchasing
37
38

3/12/2019
20
SNF VBPResult of PAMA of 2014 enacted 4-1-14 under Social Security Act
• Focus of the program:o Performance standards including ‘achievement’ and ‘improvement’ ratingso Rank SNFs for from low to high based on performanceo 2% of PPS/Medicare payment withheld to fund programo Incentive payments to providers must total 50-70% of amount withheldo Incentive payments=buying your money back
• Both measures are based on hospital readmissionso SNF RM- all-cause/condition, original measure (began 1-1-17)
• Payments affected 10/1/18
• SNF PPR- potentially preventable, risk adjusted (10/1/20?)
SNF VBP Re-hospitalization Measure RM
‘Improvement’ Rating up to 90 points
________________ 2018 your SNF
________________ 2016 your SNF
Better of the two, Improvement Rating or Achievement Rating
39
40
3/12/2019
21
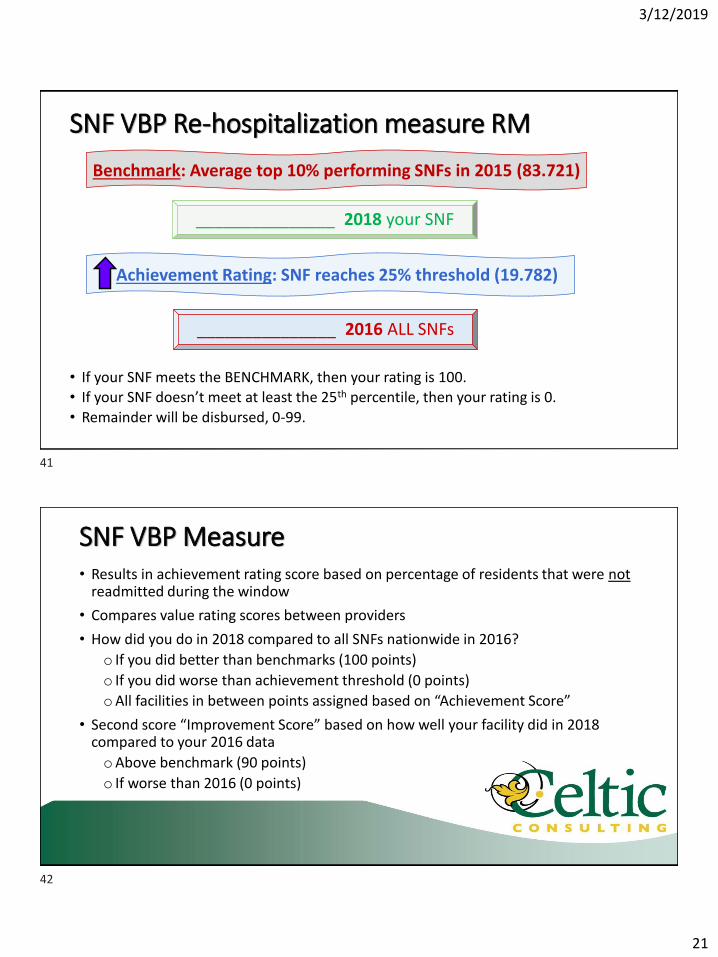
SNF VBP Re-hospitalization measure RM
• If your SNF meets the BENCHMARK, then your rating is 100. • If your SNF doesn’t meet at least the 25th percentile, then your rating is 0.
• Remainder will be disbursed, 0-99.
_______________ 2018 your SNF
_______________ 2016 ALL SNFs
Benchmark: Average top 10% performing SNFs in 2015 (83.721)
Achievement Rating: SNF reaches 25% threshold (19.782)
SNF VBP Measure• Results in achievement rating score based on percentage of residents that were not
readmitted during the window
• Compares value rating scores between providers
• How did you do in 2018 compared to all SNFs nationwide in 2016?
o If you did better than benchmarks (100 points)
o If you did worse than achievement threshold (0 points)
oAll facilities in between points assigned based on “Achievement Score”
• Second score “Improvement Score” based on how well your facility did in 2018 compared to your 2016 data
oAbove benchmark (90 points)
o If worse than 2016 (0 points)
41
42

3/12/2019
22
Performance Scores for FY20
The lower the readmission rate, the better.
Since a lower readmission rate is better, CMS has inverted every SNF’s readmission rate using (1 –readmission rate) for the purposes of the performance standards (i.e., benchmark and achievement threshold) and performance scoring.
• Standard 2016
• 25th Percentile 19.782%
• Achievement Threshold 80.218%
• Mean of the Best Decile 16.279%
• Benchmark 83.721%
Supplemental Workbook -Eligible Stays tab
PATIENT CHARACTERISTICS INDEX SNF INFORMATION PRIOR PROXIMAL HOSPITAL INFORMATION
ID Number HICN Sex Age
Admission Date
of Index SNF
Stay
Discharge Date
of Index SNF
Stay
Index SNF
Discharge
Status Code
Prior
Proximal
Hospital
CCN
Admission Date
of Prior
Proximal
Hospital Stay
Discharge Date
of Prior
Proximal
Hospital Stay
ICD Version of
Principal
Diagnosis (Prior
Proximal
Hospital)
Principal
Diagnosis of
Prior Proximal
Hospital Stay
43
44
3/12/2019
23
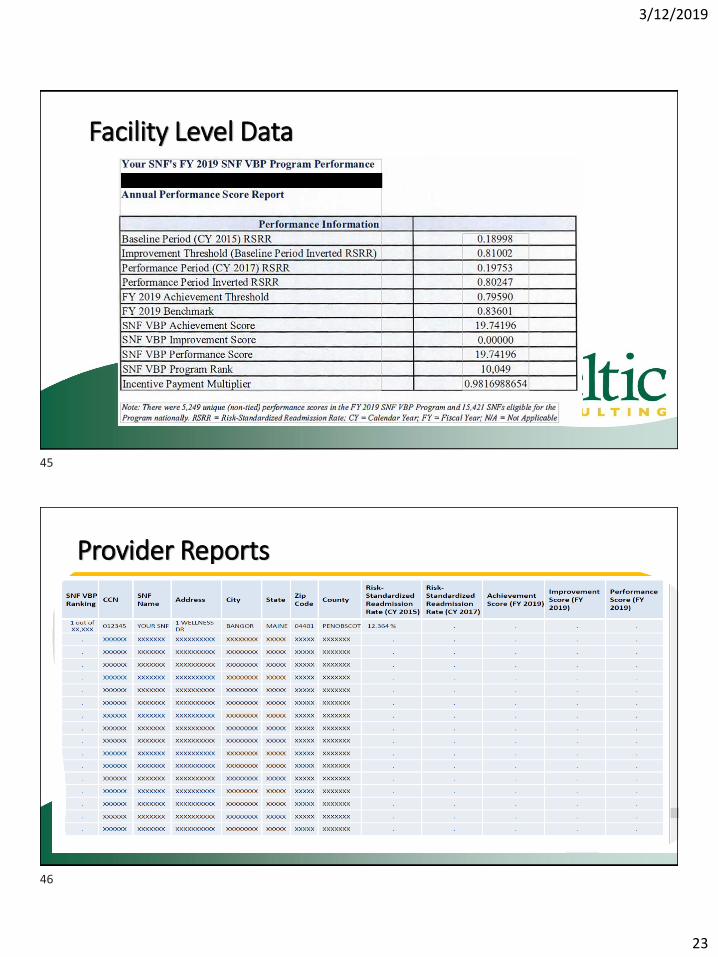
Facility Level Data
Provider Reports
45
46
3/12/2019
24
Next Steps• Monitor readmissions monthly- resident level
• Look for trends, patterns, specifics
• Identify opportunities to apply strategies to apply to residents with similar conditions
• Be aware of facility rankings in the SNFVBP program
• Keep an eye on readmission rates on a monthly basis to identify increases timely
47
PDPM Sweet Spot for SNFs
• The ‘carrot’ for SNF providers is to provide enough care and services to keep resident out of the hospital for 30 days
• Keep rehab costs down, but still achieve good outcomes
oRestorative nursing
oUtilize concurrent and group therapy
▪ Practice with managed care or other Non-RUG payers now
▪ Prepare for PDPM cost containment
47
48

3/12/2019
25
Questions??
Maureen McCarthy, RN, BS, RAC-MT, QCP-MT, DNS-MT, RAC-MTA
President, CEO
Phone (Office): 860-321-7413
Email: [email protected]
www.celticconsulting.org
49