Provider Activity Consumer Satisfaction Survey (Based … Recovery Centers, Inc. (ADRC) Connecticut...
18
Question Domain Satisfied % vs Goal% Satisfied % Goal % State Avg Participation in Treatment 94% 80% 92% Quality and Appropriateness 93% 80% 93% Overall 92% 80% 91% General Satisfaction 91% 80% 92% Access 89% 80% 88% Respect 89% 80% 91% Outcome 85% 80% 83% Recovery 84% 80% 79% (Based on 652 FY16 Surveys) Satisfied % 0-80% Goal % 80-100% Goal Met Under Goal Consumer Satisfaction Survey Ethnicity # % State Avg Non-Hispanic 1,436 72% 74% Hisp-Puerto Rican 460 23% 12% Hispanic-Other 63 3% 7% Unknown 37 2% 6% Hispanic-Cuban 6 0% 0% Hispanic-Mexican 5 0% 1% Age # % State Avg 18-25 177 9% 13% 26-34 568 28% 23% 35-44 475 24% 19% 45-54 545 27% 22% 55-64 211 11% 17% 65+ 31 2% 5% > 10% Under State Avg > 10% Over State Avg Unique Clients State Avg Client Demographics Gender # % State Avg Male 1,366 68% 59% Female 641 32% 41% Transgender 0% Race # % State Avg White/Caucasian 1,093 54% 65% Other 492 25% 13% Black/African American 397 20% 16% Asian 9 0% 1% Hawaiian/Other Pacific Islander 9 0% 0% Am. Indian/Native Alaskan 6 0% 1% Multiple Races 1 0% 1% Unknown 3% Discharges 2,241 2,529 -11% Admits 2,605 2,577 1% Service Hours 2,829 2,233 27% Bed Days 34,878 23,521 48% Monthly Trend Measure Actual 1 Yr Ago Variance % Unique Clients 2,007 1,991 1% > 10% Under 1Yr Ago > 10% Over 1 Yr Ago Clients by Level of Care Program Type Level of Care Type # % Addiction Residential Services 1,449 60.9% Outpatient 408 17.2% Employment Services 231 9.7% Case Management 145 6.1% Forensics Community-based 144 6.1% Other 2 0.1% Provider Activity Connecticut Dept of Mental Health and Addiction Services InterCommunity Recovery Centers, Inc. (ADRC) Reporting Period: July 2016 - December 2016 Provider Quality Dashboard Hartford, CT (Data as of Mar 21, 2017)
Transcript of Provider Activity Consumer Satisfaction Survey (Based … Recovery Centers, Inc. (ADRC) Connecticut...

Question Domain Satisfied % vs Goal% Satisfied % Goal % State Avg
Participation in Treatment 94% 80% 92%
Quality and Appropriateness 93% 80% 93%
Overall 92% 80% 91%
General Satisfaction 91% 80% 92%
Access 89% 80% 88%
Respect 89% 80% 91%
Outcome 85% 80% 83%
Recovery 84% 80% 79%
(Based on 652 FY16 Surveys)
Satisfied % 0-80%Goal % 80-100% Goal Met Under Goal
Consumer Satisfaction Survey
Ethnicity # % State Avg
Non-Hispanic 1,436 72% 74%
Hisp-Puerto Rican 460 23% 12%
Hispanic-Other 63 3% 7%
Unknown 37 2% 6%
Hispanic-Cuban 6 0% 0%
Hispanic-Mexican 5 0% 1%
Age # % State Avg
18-25 177 9% 13%
26-34 568 28% 23%
35-44 475 24% 19%
45-54 545 27% 22%
55-64 211 11% 17%
65+ 31 2% 5%
> 10% Under State Avg> 10% Over State AvgUnique Clients State Avg
Client DemographicsGender # % State Avg
Male 1,366 68% 59%
Female 641 32% 41%
Transgender 0%
Race # % State Avg
White/Caucasian 1,093 54% 65%
Other 492 25% 13%
Black/African American 397 20% 16%
Asian 9 0% 1%
Hawaiian/Other Pacific Islander 9 0% 0%
Am. Indian/Native Alaskan 6 0% 1%
Multiple Races 1 0% 1%
Unknown 3%
Discharges 2,241 2,529 -11%
Admits 2,605 2,577 1%
Service Hours 2,829 2,233 27%
Bed Days 34,878 23,521 48%
Monthly Trend Measure Actual 1 Yr Ago Variance %
Unique Clients 2,007 1,991 1%
> 10% Under 1Yr Ago> 10% Over 1 Yr Ago
Clients by Level of CareProgram Type Level of Care Type # %
AddictionResidential Services 1,449 60.9%
Outpatient 408 17.2%
Employment Services 231 9.7%
Case Management 145 6.1%
Forensics Community-based 144 6.1%
Other 2 0.1%
Provider Activity
Connecticut Dept of Mental Health and Addiction ServicesInterCommunity Recovery Centers, Inc. (ADRC)
Reporting Period: July 2016 - December 2016
Provider Quality DashboardHartford, CT(Data as of Mar 21, 2017)

Measure Actual 1 Yr Ago Variance %
Unique Clients 145 135 7%
Admits 102 99 3%
Discharges 87 102 -15%
Service Hours 418 161 160%
Program Activity
On-Time Periodic Actual State Avg
6 Month Updates 0% 45%
Data Entry Actual State Avg
Valid NOMS Data 88% 94%
Data Submission Quality
Connecticut Dept of Mental Health and Addiction ServicesCCAR - Hartford
Addiction - Employment Services - Employment Services Program Quality DashboardInterCommunity Recovery Centers, Inc. (ADRC)
Reporting Period: July 2016 - December 2016 (Data as of Mar 21, 2017)
* State Avg based on 7 Active Employment Services Programs
> 10% Over < 10% Under
Actual Goal Goal Met Below Goal
Jul Aug Sep Oct Nov Dec % Months Submitted
Admissions 100%
Services 100%
Discharges 100%
1 or more Records Submitted to DMHAS
Data Submitted to DMHAS by Month
RecoveryNational Recovery Measures (NOMS) Actual % vs Goal % Actual Actual % Goal % State Avg Actual vs Goal
Employed 60 39% 35% 36% 4%
Service UtilizationActual % vs Goal % Actual Actual % Goal % State Avg Actual vs Goal
Clients Receiving Services 36 55% 90% 80% -35%

Measure Actual 1 Yr Ago Variance %
Unique Clients 44 38 16%
Admits 31 27 15%
Discharges 29 23 26%
Service Hours 213 28
Program Activity
On-Time Periodic Actual State Avg
6 Month Updates 25% 45%
Data Entry Actual State Avg
Valid NOMS Data 100% 94%
Data Submission Quality
Connecticut Dept of Mental Health and Addiction ServicesCCAR - New London
Addiction - Employment Services - Employment Services Program Quality DashboardInterCommunity Recovery Centers, Inc. (ADRC)
Reporting Period: July 2016 - December 2016 (Data as of Mar 21, 2017)
* State Avg based on 7 Active Employment Services Programs
> 10% Over < 10% Under
Actual Goal Goal Met Below Goal
Jul Aug Sep Oct Nov Dec % Months Submitted
Admissions 100%
Services 100%
Discharges 83%
1 or more Records Submitted to DMHAS
Data Submitted to DMHAS by Month
RecoveryNational Recovery Measures (NOMS) Actual % vs Goal % Actual Actual % Goal % State Avg Actual vs Goal
Employed 19 42% 35% 36% 7%
Service UtilizationActual % vs Goal % Actual Actual % Goal % State Avg Actual vs Goal
Clients Receiving Services 11 69% 90% 80% -21%

Measure Actual 1 Yr Ago Variance %
Unique Clients 42 33 27%
Admits 33 26 27%
Discharges 26 14 86%
Service Hours 108 33
Program Activity
On-Time Periodic Actual State Avg
6 Month Updates 0% 45%
Data Entry Actual State Avg
Valid NOMS Data 99% 94%
Data Submission Quality
Connecticut Dept of Mental Health and Addiction ServicesCCAR - Willimatic
Addiction - Employment Services - Employment Services Program Quality DashboardInterCommunity Recovery Centers, Inc. (ADRC)
Reporting Period: July 2016 - December 2016 (Data as of Mar 21, 2017)
* State Avg based on 7 Active Employment Services Programs
> 10% Over < 10% Under
Actual Goal Goal Met Below Goal
Jul Aug Sep Oct Nov Dec % Months Submitted
Admissions 100%
Services 100%
Discharges 100%
1 or more Records Submitted to DMHAS
Data Submitted to DMHAS by Month
RecoveryNational Recovery Measures (NOMS) Actual % vs Goal % Actual Actual % Goal % State Avg Actual vs Goal
Employed 9 21% 35% 36% -14%
Service UtilizationActual % vs Goal % Actual Actual % Goal % State Avg Actual vs Goal
Clients Receiving Services 13 81% 90% 80% -9%

Measure Actual 1 Yr Ago Variance %
Unique Clients 32 28 14%
Admits 17 15 13%
Discharges 8 14 -43%
Bed Days 3,393 2,603 30%
Program Activity
On-Time Periodic Actual State Avg
6 Month Updates 0% 0%
Data Entry Actual State Avg
Valid NOMS Data 100% 97%
Valid TEDS Data 100% 99%
Data Submission Quality
Cooccurring Actual State Avg
MH Screen Complete 70% 95%
SA Screen Complete 74% 96%
Diagnosis Actual State Avg
Valid Axis I Diagnosis 100% 100%
Valid Axis V GAF Score 100% 94%
Connecticut Dept of Mental Health and Addiction ServicesClayton House 950400
Addiction - Residential Services - Transitional/Halfway House 3.1 Program Quality DashboardInterCommunity Recovery Centers, Inc. (ADRC)
Reporting Period: July 2016 - December 2016 (Data as of Mar 21, 2017)
* State Avg based on 11 Active Transitional/Halfway House 3.1 Programs
> 10% Over < 10% Under
Actual Goal Goal Met Below Goal
Jul Aug Sep Oct Nov Dec % Months Submitted
Admissions 100%
Discharges 50%
1 or more Records Submitted to DMHAS
Data Submitted to DMHAS by Month
Bed Utilization12 Months Trend Beds Avg LOS Turnover Actual % Goal % State Avg Actual vs Goal
Avg Utilization Rate 15 171 days 0.3 123% 90% 100% 33%
90-110%< 90% >110%
Actual % vs Goal % Actual Actual % Goal % State Avg Actual vs Goal
Treatment Completed Successfully 6 75% 85% 64% -10%
Actual % vs Goal % Actual Actual % Goal % State Avg Actual vs Goal
No Re-admit within 30 Days of Discharge 8 100% 85% 75% 15%
Actual % vs Goal % Actual Actual % Goal % State Avg Actual vs Goal
Follow-up within 30 Days of Discharge 1 17% 90% 61% -73%
Discharge Outcomes
RecoveryNational Recovery Measures (NOMS) Actual % vs Goal % Actual Actual % Goal % State Avg Actual vs Goal
Abstinence/Reduced Drug Use 32 100% 70% 88% 30%
Employed 21 66% 60% 34% 6%
Improved/Maintained Axis V GAF Score 12 75% 75% 83% 0%

Measure Actual 1 Yr Ago Variance %
Unique Clients 21 24 -13%
Admits 13 16 -19%
Discharges 10 15 -33%
Bed Days 1,968 1,801 9%
Program Activity
On-Time Periodic Actual State Avg
6 Month Updates 0% 13%
Data Entry Actual State Avg
Valid NOMS Data 100% 96%
Valid TEDS Data 100% 96%
Data Submission Quality
Cooccurring Actual State Avg
MH Screen Complete 85% 94%
SA Screen Complete 85% 95%
Diagnosis Actual State Avg
Valid Axis I Diagnosis 100% 100%
Valid Axis V GAF Score 100% 100%
Connecticut Dept of Mental Health and Addiction ServicesCoventry House 950401
Addiction - Residential Services - Intermediate/Long Term Res.Tx 3.5 Program Quality DashboardInterCommunity Recovery Centers, Inc. (ADRC)
Reporting Period: July 2016 - December 2016 (Data as of Mar 21, 2017)
* State Avg based on 40 Active Intermediate/Long Term Res.Tx 3.5 Programs
> 10% Over < 10% Under
Actual Goal Goal Met Below Goal
Jul Aug Sep Oct Nov Dec % Months Submitted
Admissions 83%
Discharges 100%
1 or more Records Submitted to DMHAS
Data Submitted to DMHAS by Month
Bed Utilization12 Months Trend Beds Avg LOS Turnover Actual % Goal % State Avg Actual vs Goal
Avg Utilization Rate 10 140 days 0.3 107% 90% 80% 17%
90-110%< 90% >110%
Actual % vs Goal % Actual Actual % Goal % State Avg Actual vs Goal
Treatment Completed Successfully 4 40% 70% 71% -30%
Actual % vs Goal % Actual Actual % Goal % State Avg Actual vs Goal
No Re-admit within 30 Days of Discharge 10 100% 85% 91% 15%
Actual % vs Goal % Actual Actual % Goal % State Avg Actual vs Goal
Follow-up within 30 Days of Discharge 3 75% 90% 63% -15%
Discharge Outcomes
RecoveryNational Recovery Measures (NOMS) Actual % vs Goal % Actual Actual % Goal % State Avg Actual vs Goal
Abstinence/Reduced Drug Use 16 73% 70% 74% 3%
Improved/Maintained Axis V GAF Score 9 75% 95% 82% -20%

Measure Actual 1 Yr Ago Variance %
Unique Clients 168 167 1%
Admits 164 164 0%
Discharges 148 158 -6%
Bed Days 3,414 3,094 10%
Program Activity
Connecticut Dept of Mental Health and Addiction ServicesGA Recovery House 950359
Addiction - Residential Services - Recovery House Program Quality DashboardInterCommunity Recovery Centers, Inc. (ADRC)
Reporting Period: July 2016 - December 2016 (Data as of Mar 21, 2017)
* State Avg based on 14 Active Recovery House Programs
> 10% Over < 10% Under
Actual Goal Goal Met Below Goal
Jul Aug Sep Oct Nov Dec % Months Submitted
Admissions 100%
Discharges 100%
1 or more Records Submitted to DMHAS
Data Submitted to DMHAS by Month

Measure Actual 1 Yr Ago Variance %
Unique Clients 359 162 122%
Admits 240 122 97%
Discharges 69 114 -39%
Service Hours 819 1,554 -47%
Program Activity
On-Time Periodic Actual State Avg
6 Month Updates 6% 40%
Data Entry Actual State Avg
Valid NOMS Data 71% 96%
Valid TEDS Data 93% 92%
Data Submission Quality
Cooccurring Actual State Avg
MH Screen Complete 34% 96%
SA Screen Complete 34% 96%
Diagnosis Actual State Avg
Valid Axis I Diagnosis 99% 100%
Valid Axis V GAF Score 99% 94%
Connecticut Dept of Mental Health and Addiction ServicesOP Counseling Center 950200
Addiction - Outpatient - Standard Outpatient Program Quality DashboardInterCommunity Recovery Centers, Inc. (ADRC)
Reporting Period: July 2016 - December 2016 (Data as of Mar 21, 2017)
* State Avg based on 116 Active Standard Outpatient Programs
> 10% Over < 10% Under
Actual Goal Goal Met Below Goal
Jul Aug Sep Oct Nov Dec % Months Submitted
Admissions 100%
Services 100%
Discharges 100%
1 or more Records Submitted to DMHAS
Data Submitted to DMHAS by Month
Actual % vs Goal % Actual Actual % Goal % State Avg Actual vs Goal
Treatment Completed Successfully 59 86% 50% 53% 36%
Discharge Outcomes
RecoveryNational Recovery Measures (NOMS) Actual % vs Goal % Actual Actual % Goal % State Avg Actual vs Goal
Abstinence/Reduced Drug Use 227 63% 55% 53% 8%
Stable Living Situation 266 73% 95% 85% -22%
Employed 66 18% 50% 42% -32%
Self Help 71 20% 60% 24% -40%
Not Arrested 104 29% 75% 84% -46%
Improved/Maintained Axis V GAF Score 88 58% 75% 60% -17%
Service UtilizationActual % vs Goal % Actual Actual % Goal % State Avg Actual vs Goal
Clients Receiving Services 167 57% 90% 74% -33%
Outpatient Actual % vs Goal % Actual Actual % Goal % State Avg Actual vs Goal
2 or more Services within 30 days 89 37% 75% 76% -38%
Service Engagement
Measure Actual 1 Yr Ago Variance %
Unique Clients 78 68 15%
Admits 75 69 9%
Discharges 66 66 0%
Bed Days 1,626 1,094 49%
Program Activity
Connecticut Dept of Mental Health and Addiction ServicesRecovery House 950348
Addiction - Residential Services - Recovery House Program Quality DashboardInterCommunity Recovery Centers, Inc. (ADRC)
Reporting Period: July 2016 - December 2016 (Data as of Mar 21, 2017)
* State Avg based on 14 Active Recovery House Programs
> 10% Over < 10% Under
Actual Goal Goal Met Below Goal
Jul Aug Sep Oct Nov Dec % Months Submitted
Admissions 100%
Discharges 67%
1 or more Records Submitted to DMHAS
Data Submitted to DMHAS by Month
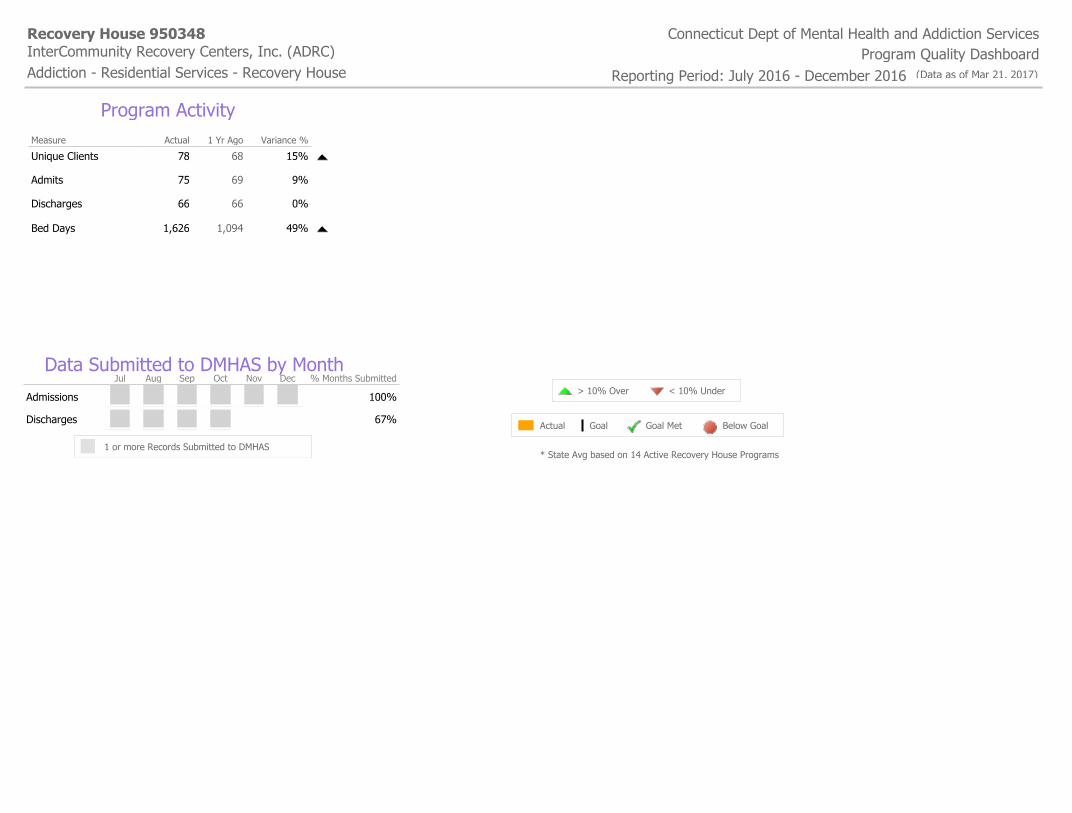
Measure Actual 1 Yr Ago Variance %
Unique Clients 1,166 1,315 -11%
Admits 1,400 1,602 -13%
Discharges 1,366 1,603 -15%
Bed Days 8,594 5,370 60%
Program Activity
On-Time Periodic Actual State Avg
6 Month Updates 100% 100%
Data Entry Actual State Avg
Valid NOMS Data 100% 98%
Valid TEDS Data 100% 98%
Data Submission Quality
Cooccurring Actual State Avg
MH Screen Complete 100% 99%
SA Screen Complete 99% 99%
Diagnosis Actual State Avg
Valid Axis I Diagnosis 100% 100%
Valid Axis V GAF Score 100% 99%
Connecticut Dept of Mental Health and Addiction ServicesResidential Detox 950600
Addiction - Residential Services - Medically Monitored Detox 3.7D Program Quality DashboardInterCommunity Recovery Centers, Inc. (ADRC)
Reporting Period: July 2016 - December 2016 (Data as of Mar 21, 2017)
* State Avg based on 8 Active Medically Monitored Detox 3.7D Programs
> 10% Over < 10% Under
Actual Goal Goal Met Below Goal
Jul Aug Sep Oct Nov Dec % Months Submitted
Admissions 100%
Discharges 100%
1 or more Records Submitted to DMHAS
Data Submitted to DMHAS by Month
Bed Utilization12 Months Trend Beds Avg LOS Turnover Actual % Goal % State Avg Actual vs Goal
Avg Utilization Rate 35 21 days 0.0 133% 90% 102% 43%
90-110%< 90% >110%
Actual % vs Goal % Actual Actual % Goal % State Avg Actual vs Goal
Treatment Completed Successfully 1,097 80% 80% 77% 0%
Actual % vs Goal % Actual Actual % Goal % State Avg Actual vs Goal
No Re-admit within 30 Days of Discharge 1,146 84% 85% 85% -1%
Actual % vs Goal % Actual Actual % Goal % State Avg Actual vs Goal
Follow-up within 30 Days of Discharge 537 49% 90% 56% -41%
Discharge Outcomes
Measure Actual 1 Yr Ago Variance %
Unique Clients 144 157 -8%
Admits 22 49 -55%
Discharges 24 47 -49%
Service Hours 55 -
Program Activity
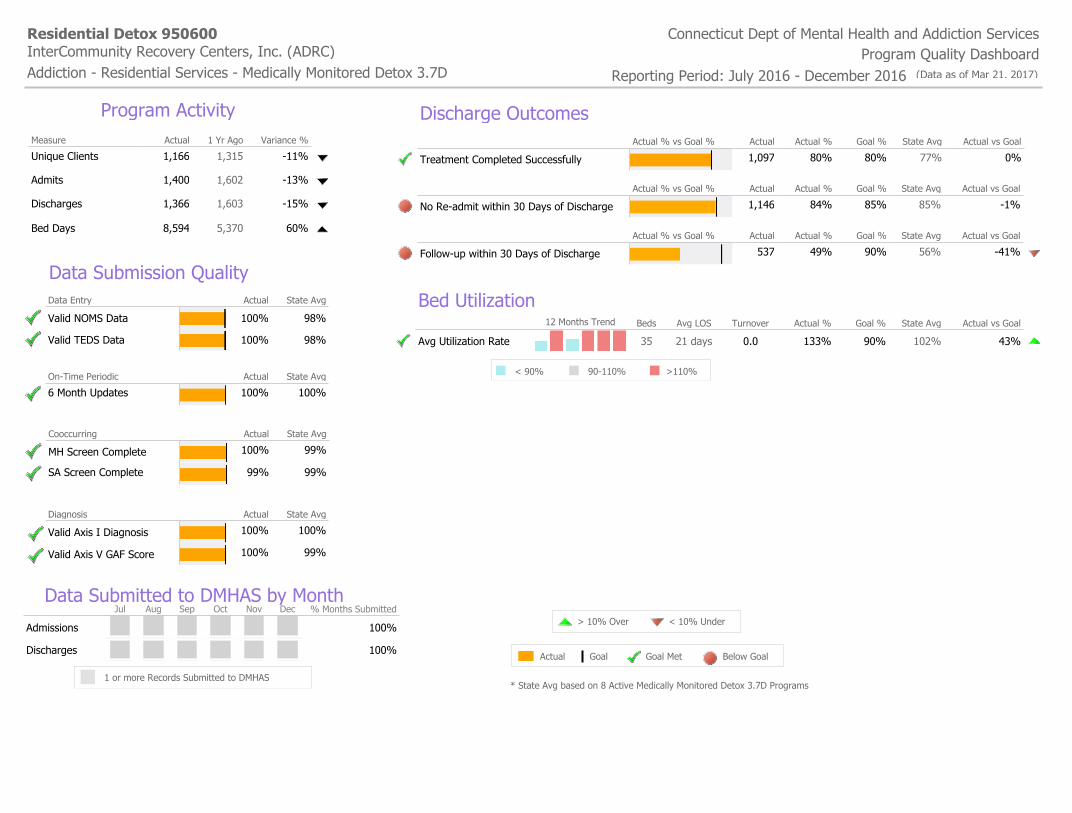
Connecticut Dept of Mental Health and Addiction ServicesSA Jail Diversion Program
Addiction - Forensics Community-based - Court Liaison-Jail Diversion Program Quality DashboardInterCommunity Recovery Centers, Inc. (ADRC)
Reporting Period: July 2016 - December 2016 (Data as of Mar 21, 2017)
* State Avg based on 2 Active Court Liaison-Jail Diversion Programs
> 10% Over < 10% Under
Actual Goal Goal Met Below Goal
Jul Aug Sep Oct Nov Dec % Months Submitted
Admissions 100%
Services 100%
Discharges 100%
1 or more Records Submitted to DMHAS
Data Submitted to DMHAS by Month
Jail DiversionActual % vs Goal % Actual Actual % Goal % State Avg Actual vs Goal
Follow-up Service within 48 hours 15 38% 0% 48% 38%
Service UtilizationActual % vs Goal % Actual Actual % Goal % State Avg Actual vs Goal
Clients Receiving Services 8 7% 90% 34% -83%
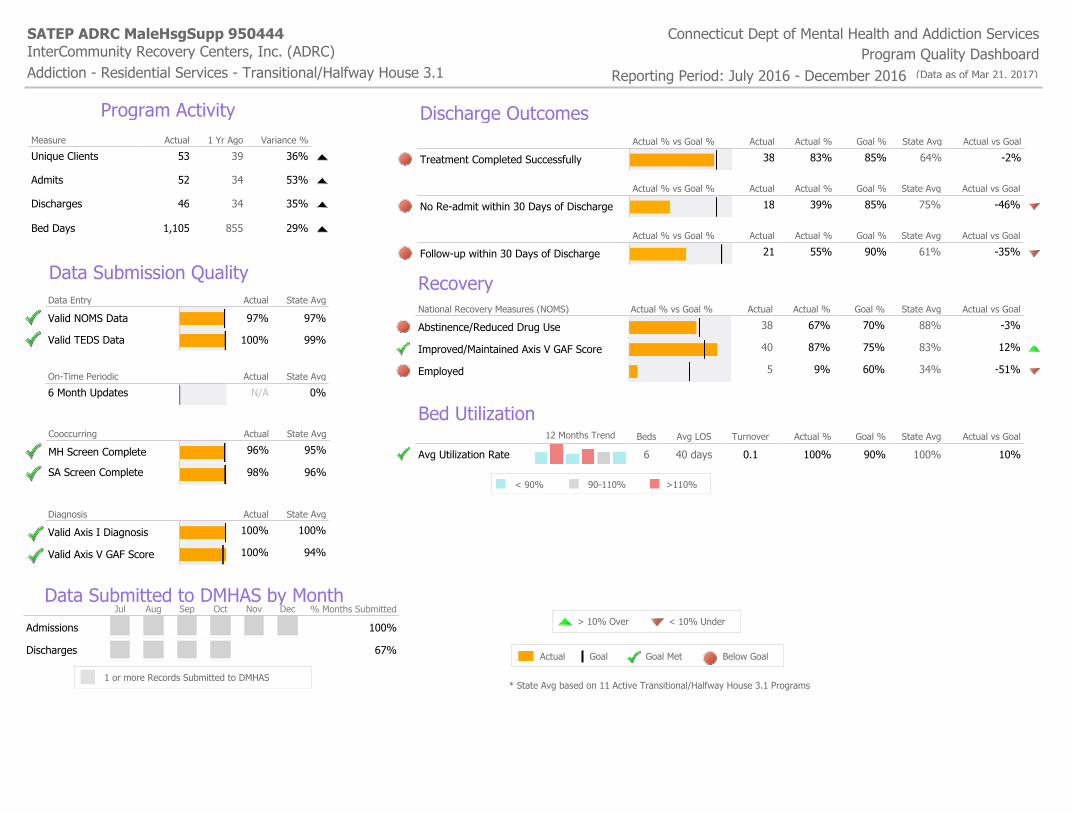
Measure Actual 1 Yr Ago Variance %
Unique Clients 53 39 36%
Admits 52 34 53%
Discharges 46 34 35%
Bed Days 1,105 855 29%
Program Activity
On-Time Periodic Actual State Avg
6 Month Updates N/A 0%
Data Entry Actual State Avg
Valid NOMS Data 97% 97%
Valid TEDS Data 100% 99%
Data Submission Quality
Cooccurring Actual State Avg
MH Screen Complete 96% 95%
SA Screen Complete 98% 96%
Diagnosis Actual State Avg
Valid Axis I Diagnosis 100% 100%
Valid Axis V GAF Score 100% 94%
Connecticut Dept of Mental Health and Addiction ServicesSATEP ADRC MaleHsgSupp 950444
Addiction - Residential Services - Transitional/Halfway House 3.1 Program Quality DashboardInterCommunity Recovery Centers, Inc. (ADRC)
Reporting Period: July 2016 - December 2016 (Data as of Mar 21, 2017)
* State Avg based on 11 Active Transitional/Halfway House 3.1 Programs
> 10% Over < 10% Under
Actual Goal Goal Met Below Goal
Jul Aug Sep Oct Nov Dec % Months Submitted
Admissions 100%
Discharges 67%
1 or more Records Submitted to DMHAS
Data Submitted to DMHAS by Month
Bed Utilization12 Months Trend Beds Avg LOS Turnover Actual % Goal % State Avg Actual vs Goal
Avg Utilization Rate 6 40 days 0.1 100% 90% 100% 10%
90-110%< 90% >110%
Actual % vs Goal % Actual Actual % Goal % State Avg Actual vs Goal
Treatment Completed Successfully 38 83% 85% 64% -2%
Actual % vs Goal % Actual Actual % Goal % State Avg Actual vs Goal
No Re-admit within 30 Days of Discharge 18 39% 85% 75% -46%
Actual % vs Goal % Actual Actual % Goal % State Avg Actual vs Goal
Follow-up within 30 Days of Discharge 21 55% 90% 61% -35%
Discharge Outcomes
RecoveryNational Recovery Measures (NOMS) Actual % vs Goal % Actual Actual % Goal % State Avg Actual vs Goal
Abstinence/Reduced Drug Use 38 67% 70% 88% -3%
Improved/Maintained Axis V GAF Score 40 87% 75% 83% 12%
Employed 5 9% 60% 34% -51%

Measure Actual 1 Yr Ago Variance %
Unique Clients 306 271 13%
Admits 290 250 16%
Discharges 223 255 -13%
Bed Days 9,839 4,648 112%
Program Activity
On-Time Periodic Actual State Avg
6 Month Updates N/A N/A
Data Entry Actual State Avg
Valid NOMS Data 99% 98%
Valid TEDS Data 100% 99%
Data Submission Quality
Cooccurring Actual State Avg
MH Screen Complete 99% 95%
SA Screen Complete 99% 96%
Diagnosis Actual State Avg
Valid Axis I Diagnosis 100% 100%
Valid Axis V GAF Score 100% 99%
Connecticut Dept of Mental Health and Addiction ServicesSATEP ADRC Res Intensive950601
Addiction - Residential Services - SA Intensive Res. Rehabilitation 3.7 Program Quality DashboardInterCommunity Recovery Centers, Inc. (ADRC)
Reporting Period: July 2016 - December 2016 (Data as of Mar 21, 2017)
* State Avg based on 12 Active SA Intensive Res. Rehabilitation 3.7 Programs
> 10% Over < 10% Under
Actual Goal Goal Met Below Goal
Jul Aug Sep Oct Nov Dec % Months Submitted
Admissions 100%
Discharges 100%
1 or more Records Submitted to DMHAS
Data Submitted to DMHAS by Month
Bed Utilization12 Months Trend Beds Avg LOS Turnover Actual % Goal % State Avg Actual vs Goal
Avg Utilization Rate 28 54 days 0.1 191% 90% 114% 101%
90-110%< 90% >110%
Actual % vs Goal % Actual Actual % Goal % State Avg Actual vs Goal
Treatment Completed Successfully 170 76% 80% 79% -4%
Actual % vs Goal % Actual Actual % Goal % State Avg Actual vs Goal
No Re-admit within 30 Days of Discharge 208 93% 85% 91% 8%
Actual % vs Goal % Actual Actual % Goal % State Avg Actual vs Goal
Follow-up within 30 Days of Discharge 114 67% 90% 62% -23%
Discharge Outcomes
RecoveryNational Recovery Measures (NOMS) Actual % vs Goal % Actual Actual % Goal % State Avg Actual vs Goal
Self Help 214 68% 60% 74% 8%
Abstinence/Reduced Drug Use 166 53% 70% 57% -17%
Improved/Maintained Axis V GAF Score 159 71% 75% 81% -4%

Measure Actual 1 Yr Ago Variance %
Unique Clients 46 36 28%
Admits 36 26 38%
Discharges 26 26 0%
Bed Days 2,754 1,814 52%
Program Activity
On-Time Periodic Actual State Avg
6 Month Updates 0% 13%
Data Entry Actual State Avg
Valid NOMS Data 99% 96%
Valid TEDS Data 100% 96%
Data Submission Quality
Cooccurring Actual State Avg
MH Screen Complete 98% 94%
SA Screen Complete 98% 95%
Diagnosis Actual State Avg
Valid Axis I Diagnosis 100% 100%
Valid Axis V GAF Score 100% 100%
Connecticut Dept of Mental Health and Addiction ServicesSATEP ADRC Res Intermed.950403
Addiction - Residential Services - Intermediate/Long Term Res.Tx 3.5 Program Quality DashboardInterCommunity Recovery Centers, Inc. (ADRC)
Reporting Period: July 2016 - December 2016 (Data as of Mar 21, 2017)
* State Avg based on 40 Active Intermediate/Long Term Res.Tx 3.5 Programs
> 10% Over < 10% Under
Actual Goal Goal Met Below Goal
Jul Aug Sep Oct Nov Dec % Months Submitted
Admissions 100%
Discharges 100%
1 or more Records Submitted to DMHAS
Data Submitted to DMHAS by Month
Bed Utilization12 Months Trend Beds Avg LOS Turnover Actual % Goal % State Avg Actual vs Goal
Avg Utilization Rate 10 97 days 0.2 150% 90% 80% 60%
90-110%< 90% >110%
Actual % vs Goal % Actual Actual % Goal % State Avg Actual vs Goal
Treatment Completed Successfully 17 65% 70% 71% -5%
Actual % vs Goal % Actual Actual % Goal % State Avg Actual vs Goal
No Re-admit within 30 Days of Discharge 24 92% 85% 91% 7%
Actual % vs Goal % Actual Actual % Goal % State Avg Actual vs Goal
Follow-up within 30 Days of Discharge 16 94% 90% 63% 4%
Discharge Outcomes
RecoveryNational Recovery Measures (NOMS) Actual % vs Goal % Actual Actual % Goal % State Avg Actual vs Goal
Abstinence/Reduced Drug Use 45 98% 70% 74% 28%
Improved/Maintained Axis V GAF Score 19 68% 95% 82% -27%

Measure Actual 1 Yr Ago Variance %
Unique Clients 61 21 190%
Admits 33 8 313%
Discharges 45 10 350%
Service Hours 232 50
Program Activity
On-Time Periodic Actual State Avg
6 Month Updates 25% 68%
Data Entry Actual State Avg
Valid NOMS Data 95% 98%
Data Submission Quality
Connecticut Dept of Mental Health and Addiction ServicesSATEP Cath Fam Svc CM 950480
Addiction - Case Management - Standard Case Management Program Quality DashboardInterCommunity Recovery Centers, Inc. (ADRC)
Reporting Period: July 2016 - December 2016 (Data as of Mar 21, 2017)
* State Avg based on 17 Active Standard Case Management Programs
> 10% Over < 10% Under
Actual Goal Goal Met Below Goal
Jul Aug Sep Oct Nov Dec % Months Submitted
Admissions 100%
Services 100%
Discharges 100%
1 or more Records Submitted to DMHAS
Data Submitted to DMHAS by Month
Actual % vs Goal % Actual Actual % Goal % State Avg Actual vs Goal
Treatment Completed Successfully 24 53% 50% 51% 3%
Discharge Outcomes
RecoveryNational Recovery Measures (NOMS) Actual % vs Goal % Actual Actual % Goal % State Avg Actual vs Goal
Employed 11 17% 20% 20% -3%
Stable Living Situation 47 73% 80% 84% -7%
Self Help 26 41% 60% 66% -19%
Service UtilizationActual % vs Goal % Actual Actual % Goal % State Avg Actual vs Goal
Clients Receiving Services 18 95% 90% 88% 5%

Measure Actual 1 Yr Ago Variance %
Unique Clients 26 23 13%
Admits 13 10 30%
Discharges 15 14 7%
Bed Days 2,185 2,242 -3%
Program Activity
On-Time Periodic Actual State Avg
6 Month Updates 0% 0%
Data Entry Actual State Avg
Valid NOMS Data 99% 97%
Valid TEDS Data 100% 99%
Data Submission Quality
Cooccurring Actual State Avg
MH Screen Complete 100% 95%
SA Screen Complete 100% 96%
Diagnosis Actual State Avg
Valid Axis I Diagnosis 100% 100%
Valid Axis V GAF Score 23% 94%
Connecticut Dept of Mental Health and Addiction ServicesSATEP Mercy, Women ALC 950446
Addiction - Residential Services - Transitional/Halfway House 3.1 Program Quality DashboardInterCommunity Recovery Centers, Inc. (ADRC)
Reporting Period: July 2016 - December 2016 (Data as of Mar 21, 2017)
* State Avg based on 11 Active Transitional/Halfway House 3.1 Programs
> 10% Over < 10% Under
Actual Goal Goal Met Below Goal
Jul Aug Sep Oct Nov Dec % Months Submitted
Admissions 83%
Discharges 83%
1 or more Records Submitted to DMHAS
Data Submitted to DMHAS by Month
Bed Utilization12 Months Trend Beds Avg LOS Turnover Actual % Goal % State Avg Actual vs Goal
Avg Utilization Rate 14 196 days 0.4 85% 90% 100% -5%
90-110%< 90% >110%
Actual % vs Goal % Actual Actual % Goal % State Avg Actual vs Goal
Treatment Completed Successfully 11 73% 85% 64% -12%
Actual % vs Goal % Actual Actual % Goal % State Avg Actual vs Goal
No Re-admit within 30 Days of Discharge 11 73% 85% 75% -12%
Actual % vs Goal % Actual Actual % Goal % State Avg Actual vs Goal
Follow-up within 30 Days of Discharge 8 73% 90% 61% -17%
Discharge Outcomes
RecoveryNational Recovery Measures (NOMS) Actual % vs Goal % Actual Actual % Goal % State Avg Actual vs Goal
Abstinence/Reduced Drug Use 20 77% 70% 88% 7%
Employed 7 27% 60% 34% -33%
Improved/Maintained Axis V GAF Score 1 5% 75% 83% -70%

Measure Actual 1 Yr Ago Variance %
Unique Clients 50 50 0%
Admits 28 33 -15%
Discharges 24 11 118%
Service Hours 155 263 -41%
Program Activity
On-Time Periodic Actual State Avg
6 Month Updates 73% 40%
Data Entry Actual State Avg
Valid NOMS Data 82% 96%
Valid TEDS Data 77% 92%
Data Submission Quality
Cooccurring Actual State Avg
MH Screen Complete 100% 96%
SA Screen Complete 100% 96%
Diagnosis Actual State Avg
Valid Axis I Diagnosis 100% 100%
Valid Axis V GAF Score 100% 94%
Connecticut Dept of Mental Health and Addiction ServicesSATEP-HBH OP 950201
Addiction - Outpatient - Standard Outpatient Program Quality DashboardInterCommunity Recovery Centers, Inc. (ADRC)
Reporting Period: July 2016 - December 2016 (Data as of Mar 21, 2017)
* State Avg based on 116 Active Standard Outpatient Programs
> 10% Over < 10% Under
Actual Goal Goal Met Below Goal
Jul Aug Sep Oct Nov Dec % Months Submitted
Admissions 100%
Services 100%
Discharges 100%
1 or more Records Submitted to DMHAS
Data Submitted to DMHAS by Month
Actual % vs Goal % Actual Actual % Goal % State Avg Actual vs Goal
Treatment Completed Successfully 6 25% 50% 53% -25%
Discharge Outcomes
RecoveryNational Recovery Measures (NOMS) Actual % vs Goal % Actual Actual % Goal % State Avg Actual vs Goal
Not Arrested 42 84% 75% 84% 9%
Stable Living Situation 38 76% 95% 85% -19%
Abstinence/Reduced Drug Use 16 32% 55% 53% -23%
Employed 9 18% 50% 42% -32%
Improved/Maintained Axis V GAF Score 21 60% 75% 60% -15%
Self Help 8 16% 60% 24% -44%
Service UtilizationActual % vs Goal % Actual Actual % Goal % State Avg Actual vs Goal
Clients Receiving Services 25 96% 90% 74% 6%
Outpatient Actual % vs Goal % Actual Actual % Goal % State Avg Actual vs Goal
2 or more Services within 30 days 16 57% 75% 76% -18%
Service Engagement

Measure Actual 1 Yr Ago Variance %
Unique Clients 87 44 98%
Admits 56 27 107%
Discharges 29 23 26%
Service Hours 830 145
Program Activity
On-Time Periodic Actual State Avg
6 Month Updates 36% 68%
Data Entry Actual State Avg
Valid NOMS Data 94% 98%
Data Submission Quality
Connecticut Dept of Mental Health and Addiction ServicesSenior Services
Addiction - Case Management - Standard Case Management Program Quality DashboardInterCommunity Recovery Centers, Inc. (ADRC)
Reporting Period: July 2016 - December 2016 (Data as of Mar 21, 2017)
* State Avg based on 17 Active Standard Case Management Programs
> 10% Over < 10% Under
Actual Goal Goal Met Below Goal
Jul Aug Sep Oct Nov Dec % Months Submitted
Admissions 100%
Services 100%
Discharges 83%
1 or more Records Submitted to DMHAS
Data Submitted to DMHAS by Month
Actual % vs Goal % Actual Actual % Goal % State Avg Actual vs Goal
Treatment Completed Successfully 10 34% 50% 51% -16%
Discharge Outcomes
RecoveryNational Recovery Measures (NOMS) Actual % vs Goal % Actual Actual % Goal % State Avg Actual vs Goal
Self Help 55 59% 60% 66% -1%
Stable Living Situation 72 77% 80% 84% -3%
Employed 10 11% 20% 20% -9%
Service UtilizationActual % vs Goal % Actual Actual % Goal % State Avg Actual vs Goal
Clients Receiving Services 44 69% 90% 88% -21%