PROSPECTING QUICK GUIDE 1: UNDERSTANDING …bquest/2014/guideone2014.pdf1 UNDERSTANDING FINANCIAL...
24
1 UNDERSTANDING FINANCIAL STATEMENTS: PROSPECTING QUICK GUIDE 1 BY DIANNA ROSS Dianna Ross [email protected] is an Instructor, Department of Accounting and Information Systems, Virginia Tech University. Abstract This quick guide is one of two articles by Dianna Ross appearing in this issue of B>Quest. Both it and a second one, Prospecting Quick Guide 2, are designed for
Transcript of PROSPECTING QUICK GUIDE 1: UNDERSTANDING …bquest/2014/guideone2014.pdf1 UNDERSTANDING FINANCIAL...

1
UNDERSTANDING FINANCIAL STATEMENTS:
PROSPECTING QUICK GUIDE 1
BY DIANNA ROSS
Dianna Ross [email protected] is an Instructor, Department of Accounting and Information Systems, Virginia Tech University.
Abstract
This quick guide is one of two articles by Dianna Ross appearing in this issue of B>Quest. Both it and a second one, Prospecting Quick Guide 2, are designed for

2
those who need briefings on how to understand and analyze financial statements. Quick Guide 1 combines narrative discussion with easy-to-use tables so that a reader can take away whatever is needed on the topic, whether it be basic explanations, or brief reminders of information previously encountered but not fully recalled. It offers a map to guide the reader, through the pitfalls and distractions of this challenging process, to the treasure that can be found in company reports.
The information in these guides is essential for those already in business and those studying business who are considering investing but who lack the necessary training or the experience to identify opportunities to create wealth. These guides provide an overview and supporting detail to assist would-be analysts in the challenging task of prospecting for valuable information about company health and profitability. This quest involves sifting through the mountain of material that publicly traded companies provide. Explanations contained in Quick Guide 1 are accompanied by summary tables that illuminate:
the labyrinth of reporting rules the analyst must navigate,
implications of the financial statements prepared according to these rules, as well as
company incentives and opportunities to enhance company appearance that the analyst must take into account.
The related Prospecting Quick Guide 2 offers:
techniques for identifying valuable information within the “ore” in which it may hide,
as well as general analysis tools to apply to the “mined” information.
Using information about the past and present to predict the future is not only a
legitimate approach; there is really no other trustworthy information available. The trick, of course, is to be able to extract the valuable from the less so. This Quick Guide emphasizes approaches to maximize successful prospecting, whether the analyst needs a primer or a refresher on this intersection of accounting and finance.
Challenges
Prospectors all: Who might want to understand financial statements? Perhaps, having taken accounting and finance courses, you now face a professional requirement to provide recommendations based on a company’s financial statements. Or perhaps you studied management or marketing or economics and now find yourself in a challenging multi-faceted job where you work as part of a team tasked with preparing a report on a company with which your company is considering a long-term relationship as a customer, supplier, lender, or investor. How can you contribute to that team’s task?

3
Or perhaps you succeeded in a field outside of business and now have money to invest, possibly in the stock market. How can you create wealth while minimizing risk? The probability of success in all these situations is improved by knowing enough about how companies report that one can discerningly read a given company’s reports, as well as knowing enough about how to process that data to turn it into valuable information.
“All that is gold does not glitter…” (J. R. R. Tolkien) “Truth, like gold, is to be obtained not by its growth, but by washing away from it all that is not gold.” (Leo Tolstoy)
(Looking) Back to (Look at) the Future: The only information that any company can report, even that released in the last few moments, can only provide information about the past. Interested parties analyze that historic information in order to:
understand the company’s recent health in order to
forecast the company’s future prospects in order to
make decisions, the success of which will depend on the complex interaction of various future events. Invest? Divest? Lend? Become trading partner? Become an employee, manager, director? Regulate? Tax? Sue? Acquire?
The better is your understanding of a company’s past and present, generally the
better is your forecast of the company’s future. The better is your forecast, generally the better are resulting decisions. Panning for the gold and gems that lead to cash: Although some decisions may be very limited in scope, the treasure sought by the analyst and the additional value provided by analysis relate to refining the complex amalgam of a company’s health initially mined by assessing two aspects:
profitability or operating health (level, sources, vulnerability to deterioration, opportunities for expansion) and
financial health (financing structure and resource strengths and weaknesses in the context of company plans).
This exploration is undertaken with an eye to understanding and forecasting the
probable quantities and timing of the cash flows likely to be available:
directly to the company and
indirectly to the decision maker.
Essential to success is a sophisticated understanding of standard company reports which allegedly describe its profitability and financial health. As company information is discovered and extracted from its surrounding material, the quality—
4
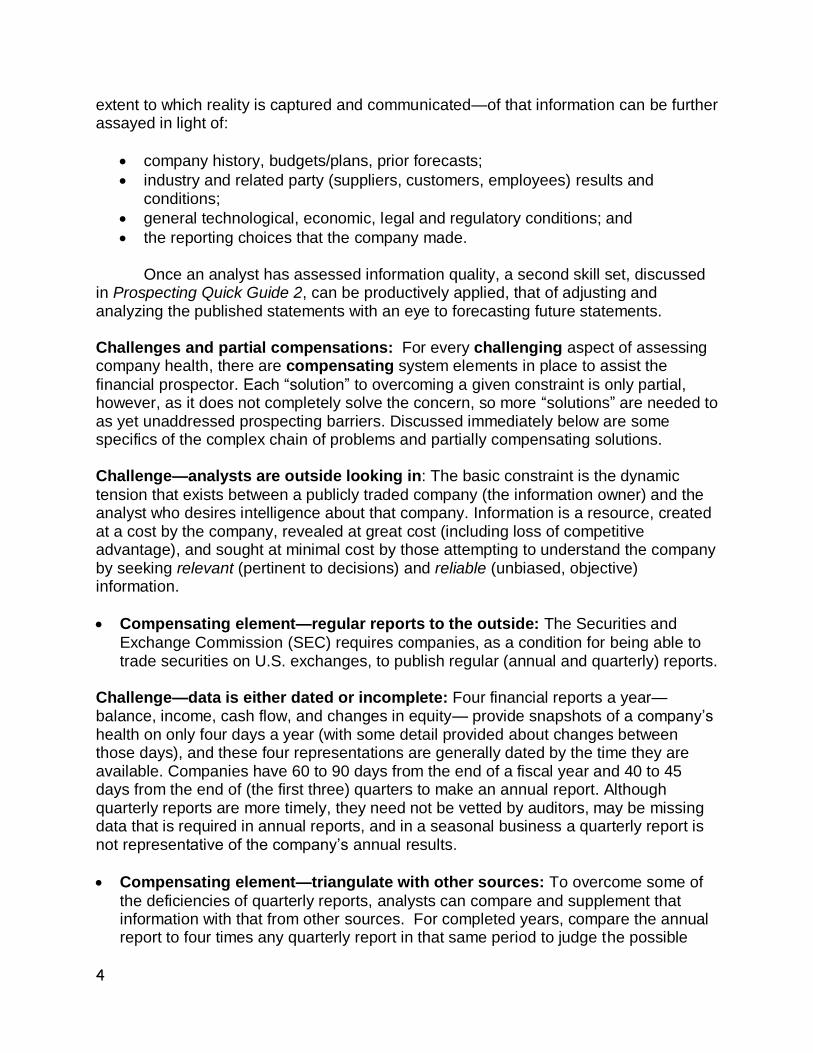
extent to which reality is captured and communicated—of that information can be further assayed in light of:
company history, budgets/plans, prior forecasts;
industry and related party (suppliers, customers, employees) results and conditions;
general technological, economic, legal and regulatory conditions; and
the reporting choices that the company made.
Once an analyst has assessed information quality, a second skill set, discussed in Prospecting Quick Guide 2, can be productively applied, that of adjusting and analyzing the published statements with an eye to forecasting future statements. Challenges and partial compensations: For every challenging aspect of assessing company health, there are compensating system elements in place to assist the
financial prospector. Each “solution” to overcoming a given constraint is only partial, however, as it does not completely solve the concern, so more “solutions” are needed to as yet unaddressed prospecting barriers. Discussed immediately below are some specifics of the complex chain of problems and partially compensating solutions. Challenge—analysts are outside looking in: The basic constraint is the dynamic
tension that exists between a publicly traded company (the information owner) and the analyst who desires intelligence about that company. Information is a resource, created at a cost by the company, revealed at great cost (including loss of competitive advantage), and sought at minimal cost by those attempting to understand the company by seeking relevant (pertinent to decisions) and reliable (unbiased, objective) information.
Compensating element—regular reports to the outside: The Securities and
Exchange Commission (SEC) requires companies, as a condition for being able to trade securities on U.S. exchanges, to publish regular (annual and quarterly) reports.
Challenge—data is either dated or incomplete: Four financial reports a year—balance, income, cash flow, and changes in equity— provide snapshots of a company’s health on only four days a year (with some detail provided about changes between those days), and these four representations are generally dated by the time they are available. Companies have 60 to 90 days from the end of a fiscal year and 40 to 45 days from the end of (the first three) quarters to make an annual report. Although quarterly reports are more timely, they need not be vetted by auditors, may be missing data that is required in annual reports, and in a seasonal business a quarterly report is not representative of the company’s annual results.
Compensating element—triangulate with other sources: To overcome some of
the deficiencies of quarterly reports, analysts can compare and supplement that information with that from other sources. For completed years, compare the annual report to four times any quarterly report in that same period to judge the possible

5
effect of seasonality and of accruals, which are those year-end adjustments made for annual reports to ensure capturing relevant information.(Accrued income and accrued expenses are income earned but not received and expenses incurred, but not paid.) In the future, real-time audited data may be more widely available.
Challenge—companies have already filtered the reported information:
Understandably, the motivations of the information provider and the information consumer differ. Individuals and economic entities in general prefer to report that which maximizes their own well-being, as distinct from maximizing the value to consumers of their reports.
Compensating element: Minimal specific report content is specified by the
Securities and Exchange Commission (SEC) and the Financial Accounting Standards Board (FASB), which operates under SEC-delegated authority. It behooves a financial analyst to be able to distinguish between compliance reporting (required for each company) and discretionary reporting (in which the company is accomplishing some other corporate goal).
Challenge— reporting requirements have been shaped by tremendous pressures from the companies themselves: Reporting requirements have not evolved in a vacuum, but have been responsive to lobbying from industry. Accordingly, some reporting rules favor the information hoarder. Additionally, the minimal content specified by the SEC and FASB is open to interpretation by companies. In order to provide for the diversity of reporting entities, reporting rules allow companies to select among permitted methods of estimating, summarizing, and explaining. This menu of options provides degrees of freedom to reporting companies, but it undermines the comparability of reports across companies—even those in the same industry. Also, managers often manage the information that companies release in order to smooth earnings over time, reasoning that this results in a more representative long-term picture to the analyst. All things being equal, managers generally prefer to avoid reporting (earnings volatility, earnings decreases, earnings which underperform forecasts, and any disclosures which would undermine any competitive advantage or penalize their near term compensation. And, of course, the company being required to report has every motivation to report in such a way that meets the minimum requirement while revealing the minimum.
Compensating element—full disclosure: Generally Accepted Accounting
Principles (GAAP) require that companies disclose whatever additional reliable information would be relevant to the theoretical user. However, the judgment of relevance is left to the discretion of the company, and the company is likely to have a wide range of users with differing information needs. Companies also have discretion as to how understandably that information is presented, and at what length. What typically results are voluminous footnotes and extensive management discussion in the Management and Discussion (MD&A) section of the company’s 10-K report—a report that the SEC requires be provided annually. (This is not the glossy annual report provided to impress current and possible future stockholders.)

6
Challenge—too much, too deep, too difficult to access: The analyst often finds that
the nuggets of information are difficult to identify and extract given the overburden of disclosures, some of which might be removed wholesale without information loss, and some of which must be sifted through to separate data of differing values. (An absent disclosure might be a pending lawsuit.)
Compensating element—competence. The best strategy to deal with information
overload is to take a patient, informed, and organized approach, enabling one to build expertise through experience. If an analyst has determined the questions which need to be answered, it is much easier to identify the answers. Over time, the list of questions will evolve and expand as analysts encounter information that answers questions that were not yet asked.
Challenge—some companies salt the mine with fool’s gold: Beyond taking
advantage of permitted reporting choices, some companies have used a variety of techniques to alter their appearance and further mislead analysts. The financial press over the years has documented company creativity in altering their appearance. (Readers are encouraged to further explore concepts of interest by accessing a wealth of user-friendly internet resources such as www.Investopedia.com.) Table 1 below briefly describe a few of the simpler techniques employed to mislead analysts. (Some compensating adjustments that can be made by analysts are discussed in Quick Guide 2.)
Table 1
General Reporting Techniques Designed To Fool The Analyst Misdirection draws the analyst’s attention away from significant concerns by emphasizing positive news or by putting a positive spin on bad news. Many companies, for instance, claim that heavy expenses or losses in one period will dramatically improve future performance. That may or may not be the expenditure’s intention, but analysts should independently judge the probability of the hoped-for results and compare that expectation to actual results later reported at the end of the period. One cynical, but safe, attitude is to assume that, where possible, the company has made choices to optimize their appearance. An analyst’s common sense and experience can suggest the nature, if not the scope, of this problem. Mistiming involves reporting revenues, gains, expenses, and/or losses in the period in which most benefit derives to the company; not necessarily in the period when they happened. A company in a bad year may include future revenue and gains to make the current period appear better or include future expenses and losses so that next year will appear better. Some of this timing manipulation can be done operationally, such as delaying discretionary expenditures (which may undermine operational efficiency), but some can simply be reporting amounts in different periods, such as recording revenue based on an agreement with customers rather than completion of earnings, ignoring the GAAP requirement that revenue be earned.

7
Aggregating involves including amounts in categories such as Other Assets and
Other Liabilities on the Balance Sheet, and Miscellaneous Expenses or Other Charges or Credits on the Income Statement. A company can successfully hide that information from the analyst by failing to provide details in the footnotes. Misestimating involves manager-biased estimates, to be reported directly or for use within calculations which produce reportable numbers. Examples include useful life and salvage values (for depreciable, depletable, or amortizable Assets) and discount rates for amounts which are reported at present value. Some Assets reported at market value must be estimated, although companies are required to disclose some details when they have done so. Of course, that is only helpful to the analyst who reads and considers those details. Non-reporting refers to the omission from the financial statements of information ranging from trivial to highly significant. Reported financial statements may exclude a required footnote disclosure (for instance, related-party transactions) or Asset or Liability amounts. A company may have legal rights and obligations under an operating lease but report neither the right to use the leased asset nor the long-term obligation to pay financing. The reader may recall the central role played by off-balance sheet entities hidden by Enron before its eventual and far-reaching collapse. (A company may have significant assets or liabilities which do not appear on their balance sheet.)
Compensating system—oversight: To counterbalance the opportunities for
hidden, missing, false, and otherwise misleading information, there is a complex system in place in the business world in which a hierarchy of individuals exercise oversight on company reporting.
Internal auditors, employed by the company, have the opportunity to identify inaccuracies that would affect their company reporting.
Also, managers and directors have specific oversight duties as to the reliability of their company reports.
Annually, external independent auditors review some of the systems and data underlying the reports and publish an audit opinion.
Beyond that, the SEC reviews submitted reports. Extreme cases of company misrepresentation have resulted in the SEC requiring restatement of company reports. (Information about these companies is available at www.SEC.org.)
Lastly, companies are subject to litigation by anyone who relied to their disadvantage on information reported by the company.
Challenge—oversight does not guarantee nothing is overlooked: Once the system of oversight is examined more closely one can understand how so many companies have published audited reports which later turned out to present a skewed picture of that company. Internal auditors, being company employees, may be hesitant to

8
challenge management decisions about reporting. Some managers may be in favor of inaccurate reporting, and directors may not have adequate understanding of the complex reporting rules to effectively oversee the process. External auditors, while theoretically independent from management, are still hired and can be fired by management, contributing to a conflict of interest that can undermine the reliability of the audit opinion and therefore of the associated reporting. Even more significant is the nature of the opinion that they provide. Examined closely, the most recent version of the standard audit report carefully limits the scope and therefore the usefulness of the opinion. Tables 2a and 2b below highlight the implications of these limits.
Table 2a Implications of Standard Audit Opinion 1st Paragraph Phrases
“We have audited the accompanying consolidated (reports) of (company) for the (periods specified).”
Reported data is for the combined economic entity of the named company plus subsidiary companies, which may be in diverse industries, different countries, initially using different currencies. Data for legally separate companies need not be reported. The list of subsidiaries is available to analysts in an exhibit filed with the company’s SEC-required annual 10-K, available at www.sec.gov/edgar. [EDGAR is SEC’s Electronic Data Analysis and Retrieval system.]
“These (reports) are the responsibility of the company’s management.”
Under the 2002 Sarbanes-Oxley (SOX) Act, executive management must certify the accuracy of the company financial statements, subject to significant fines and prison time. Sarbanes-Oxley Act, http://www.sec.gov/about/laws.shtml#sox2002.
“Our (auditor) responsibility is to express an opinion…based on our audits.”
Note that the responsibility is not to find fraud or errors, but to provide a subjective opinion based on evidence gathered by the audit.
“We conducted our audits in accordance with the standards of the Public Company Accounting Oversight Board (United States)… (which) require that we plan and perform the audits to obtain reasonable assurance…”
The assurance is not absolute and therefore not a guarantee of anything. “An auditor works within economic limits. The audit opinion, to be economically useful, must be formed in a reasonable time and at reasonable cost,” (http://www.ais-cpa.com/glosa.html).
“…about whether the (reports) are free of material misstatement,”
The opinion concerns significant (that is, material) misstatements only.

9
“An audit includes examining, on a test basis, the accounting principles used and significant estimates made by management…”
Test basis means that only samples of available data are audited. Auditors also examine those accounting principles and estimates that are disclosed by management and which are subject to manipulation by management.
“...as well as evaluating the overall (report) presentation.”
Report presentation is not specified by GAAP and so auditors are in the position of applying a reasonableness standard as to whether the account titles and levels of aggregation in reports are usable for their intended purpose: to usefully inform decision makers.
“We believe our audit provides a reasonable basis for our opinion.”
Given the practical constraints of auditing (cost-benefit, management disincentive to be forthcoming, examination of sampled data only, the lack of specific search for fraud), the limited approach used by auditors and the assurance provided to statement users is reasonable (defensible) but certainly not a guarantee of any kind.
Table 2b Implications of Audit Opinion 2nd and 3rd Paragraph Phrases
2nd paragraph:
“In our opinion, the (specified reports) present fairly the consolidated financial position, results of operations and their cash flows for (the specified periods) in conformity with accounting principles accepted in the United States of America.” Auditing standards specify that the opinion should be based on auditor “judgment as to whether (a) the accounting principles selected and applied have general acceptance; (b) the accounting principles are appropriate in the circumstances; (c) the financial statements, including the related notes, are informative of matters that may affect their use, understanding, and interpretation; (d) the information presented in the financial statements is classified and summarized in a reasonable manner, that is, neither too detailed nor too condensed; and (e) the financial statements reflect the underlying transactions and events…within a range of acceptable limits, that is, limits that are reasonable and practicable to attain in financial statements.” (http://pcaobus.org/standards/auditing/pages/au411.aspx#ftn.au_411_fn2)

10
3rd paragraph: “We have also audited, in accordance with the standards of the (PCAOB), the effectiveness of the company’s control over financial reporting as of (the specified dates), based on criteria established in Internal Control-Integrated Framework issued by the Committee of Sponsoring Organizations of the Treadway Commission, and our report dated (specified date) expressed an (unqualified or qualified or adverse or disclaimer of) opinion thereon. Internal controls over financial statements vary across companies.”
Any opinion on a company’s system of internal control is subject to concerns about audit scope, sampling, management manipulation, materiality choices. An analyst’s ability to assess the audit opinion on the financial statement controls would be enhanced by understanding the referenced criteria and organizations.
The annual reports submitted to the SEC are accompanied by their audit report. The SEC, knowing the constraints of auditing, may identify as-yet-unaddressed problems, but SEC review is also constrained by cost-benefit considerations. And litigation, although it may identify additional concerns, happens with such a lag that many decisions have already been made on the basis of erroneous reporting before the reporting inadequacy is identified.
Compensating elements—overview: The most important compensation on which
the would-be analyst can rely is to learn as much as possible about the intertwining chain of challenges and compensations well enough to support informed judgments about what is reported. Table 3 below briefly reviews the interaction of the challenges and compensations, discussed above.
Table 3 Summary Of Prospecting Challenges And Compensating Elements
Challenge
Partial solutions
Companies prefer to hoard their information.
The SEC requires regular reporting (quarterly and annually).
Reported data is not timely.
While waiting for the reporting environment to morph to real-time reporting, consider other unaudited data sources (e.g., financial press).
Reported data is highly aggregated.
Read the financial statement notes carefully
to determine, to the extent possible, the nature of amounts included in aggregated categories.
Quarterly data is unaudited, is missing data, and may reflect seasonality.
Compare quarterly report to annual reports. Triangulate with other data sources.

11
Motivations of info provider and analyst differ as to what data should be offered.
SEC and FASB specify minimum content.
Minimum rules are the result of lobbying and provide reporting choices (methods, estimates, terminology).
SEC and FASB require disclosure of
information choices and also of other information which would make a difference to an educated interested outsider. Read it thoughtfully.
Required information combined with discretionary disclosures risks information overload.
Informed experienced disciplined analysis can assist analysts in recognizing and extracting valuable information.
Companies may ‘salt the mine’ by using techniques beyond GAAP: by misdirection, by omission, by embellishment, by shifting timing of reporting.
The oversight system (internal auditors, external auditors, managers and directors, the SEC and courts) may identify fool’s gold and require correction of reports, albeit after decisions relied on the originally reported information.
Oversight system has own its constraints and interest conflicts.
PCAOB supervises the audit industry and requires use of minimum auditing principles.
Would-be analysts may have inadequate understanding of all of the above and so cannot undertake a sophisticated informed analysis of a company’s financial statements.
Use the treasure maps available in sources such as the Prospecting Quick Guides to become more informed and able to optimize the prospecting plan and consequences.
The geology of financial mines
Company information can be approached through four related financial statements (and their accompanying explanatory footnotes). But to understand these reports, it is essential to be familiar with the ground rules on which rests the entire reporting system. Companies are subject to a complex evolving system of rules for recording events and reporting the effects of those events on the company. Generally GAAP makes up the system which has been developed and is continuously revised by FASB under delegated authority from the SEC.
The particulars of GAAP at any given time comprise the system which over time
was deposited on top of the bedrock of four principles, four assumptions, and four constraints. Of the four principles upon which the GAAP system evolves, the first two: revenue recognition and matching, address when effects are recognized for reporting

12
purposes. The third principle: cost, addresses the amounts at which certain items have traditionally been measured and reported. It should be noted that this principle has increasingly been marginalized as GAAP is still evolving to require more market value, rather than original cost, information, which is thought to be more relevant, albeit less reliable than historic cost information. The fourth principle: full disclosure, addresses the information that should be provided in support of reported account balances. Tables 4 through 7 below provide definitions, general implications, exceptions and related concerns to provide context for the analysis of reported amounts.
Table 4 Revenue Recognition Principle
Generally, companies should record revenue (the increase from earnings to
profit and therefore to Equity) when completely earned (upon meaningful economic exchange with outsiders, in which the company has provided requested goods and services, and outsiders have at least promised to pay).
Implications for analysts: Revenue and cash may be reported in different periods. In any given period
What analyst should expect to see reported
Customer prepays but work not done yet.
No revenue yet (but company should report, in Liabilities, the value of the obligation to provide the item related to prepayment).
Work is finally completed. Revenue is reported instead of obligation.
Customer is billed after work provided.
Revenue and receivable reported.
Work provided, and customer pays in goods (rather than cash)
Revenue reported, as is the value of the goods received, if still owned at year end.
Work provided, and customer never pays.
Revenue reported with an offsetting cost related to the unpaid amount and (possibly in a different period) a reduction/write-off of the receivable.
Exceptions exist, as well as some situation–specific applications. The analyst
should be able to determine industry-specific or company-specific exceptions by reading the Significant Accounting Policy footnote.
Warning: Beware companies that ignore this principle and
o report revenue in some other period than the one in which it was earned, resulting in both periods being misreported and/or
o report revenue that has not been earned at all, such as based on purchase orders only or shipping unordered merchandise.

13
Table 5 Matching Principle
Generally, companies should record expenses (the decreases to profit and Equity from reporting the cost of consumed benefits) in the time period(s) when the company benefits from the cost.
Implication: For example, expenses related to a building paid for over 20 years,
but used over 40, would be reported in two parts, in different Income Statement sections. o The cost of the benefit of using the building would be reported as Depreciation
Expense (in Operating Expenses on the Income Statement) over 40 years. o The cost of borrowing money would be reported as (non-operating) Interest
Expense in every period where principal is outstanding (so 20 years in this instance).
Exceptions:
o In some instances, it is allowable to capitalize (record as an asset, then expense in later period(s)) portions of such costs that would otherwise be treated as expenses in the period of payment. Examples include interest reported as necessary cost of building or depreciation reported as manufacturing cost aggregated into Cost of Goods Sold.
Warning: Be aware of companies who report expenses in periods other than when benefits consumed, misreporting both periods.
Table 6 Cost Principle
Generally, companies should originally report long-lived Assets at their original cost and continue over the years to report that historic cost regardless of changes in their real value (although the cost may be reported met of subsequent depreciation, depletion or amortization if appropriate).
Implications: Land (non-depreciable) purchased for 1 million and later worth 10
million will still be reported at 1 million, although the higher figure may be disclosed in the footnotes.

14
Several exceptions exist, as some Assets (e.g., marketable securities) must be revalued at year-end to their market value, while others (e.g., Inventory and Goodwill) must be written down if they have lost value. The changes in value may affect reported income and will affect Equity.
Warning: Beware companies which misreport the amount of change to fair value,
the timing of change to fair value, or which report the change in a misleading manner.
Table 7 Full Disclosure Principle
Generally, companies should report whatever information would be relevant and reliable to the individuals analyzing the reports.
Implications: Reports are accompanied by extensive footnotes explaining details
of amounts reported.
Exceptions/Concerns: Each company determines the scope and content of
disclosures, leading to a challenging combination of information overload/complexity and missing details that might in fact be relevant to an understanding of a company’s health.
Warning: Analysis that does not consider all available information is incomplete.
Analysis of all information without appropriate skepticism and due diligence is dangerous.
Analysts also should keep the four GAAP assumptions in mind, because companies follow rules related to these assumptions. Listed below are some implications for analysts:
1. Generally, absent auditor notice to the contrary, reporting companies are assumed to be an ongoing concern (meaning a continuing business); so the GAAP principles should be expected to still be operating.
2. In the monetary unit assumption, reported dollar amounts are assumed not to have been adjusted for inflation. An implication of this is that resources may be have been purchased at different costs in different periods, resulting in an apple-orange totaling in the reports.
3. Assume that most dollar amounts are based at least in part on estimates, as
quarterly and annual reporting does not necessarily coincide with company business cycles (time period assumption).

15
4. And, of course, recall that consolidated reporting refers to an economic entity, not
a single legal entity, as it reports data combined with that of subsidiaries
Relevant to analysts are the four original GAAP constraints, conservatism, materiality judgments, cost-benefit considerations, and industry reporting practices.
1. Conservatism attempts to constrain the inflated reporting of income and resource value.
2. Materiality justifies company reporting of lesser events in a casual manner (such
as expensing it immediately, aggregating it with other amounts, disclosing little or nothing about it), while reporting more significant amounts in a more scrupulous manner; the size of an event’s effect on the company may therefore have determined how it was reported.
3. Cost-benefit directs companies to spend no more on reporting than would be
justified by the usefulness of the reported information to outsiders. This is quite a challenge to even ascertain, given the range of interested outsiders and decisions to be made.
4. Industry practice enables companies to report according to common practices
within their industry, further complicating the task of analysis, requiring the analyst to be familiar with how these practices may differ from the mainstream.
Note that how these constraints are applied is at the discretion of the company and may not be clearly disclosed in footnotes.
So the four principles, four assumptions and four constraints have been the ground on which the complex GAAP system has developed and continues to evolve. Since then, more specific guidance has been accumulating over time in response to changes in technology, financial instruments, business perceptions and practices, and the need to clarify existing guidance. Under political pressure from companies, these subsequent layers sometimes alter earlier guidance, resulting in later specific rules more to the liking of lobbying companies, and undermining the intent of the more general bedrock guidance. As time goes by, faults in the system become apparent, exposing inconsistencies and inadequacies, causing erosion of confidence in the applicability of earlier guidance, resulting in the depositing of yet more guidance. Becoming and remaining knowledgeable about this complex evolving system is challenging even for accountants, but analysts are advised to develop and maintain at least a general understanding of reporting guidance in order to be able to interpret what companies report.
Portals to the mine

16
The portals to company reporting, each providing access to different but related data, are the four (or five) related financial statements. The following listing of these statements, discussion, and tables provide perspective on the information available within these statements and their accompanying notes, listing the statement’s purpose, format, and contents (specifics of items reported in that statement and likely supplemental information provided). [Report-specific warnings, analysis strategy options, and pertinent calculations are presented in Prospecting Quick Guide 2 of this article.]
The balance sheet reports information about the company’s health on a specified
date, specifically the dollar amounts of company resources (assets) as well as the company’s financing structure which is composed of obligations to outsiders (liabilities) and to owners (equity). Equity is increased by the amount of earnings that are retained, rather than being paid out to owners. Details of changes to balance sheet accounts (since the last balance sheet date) are reported in additional statements. To understand the past health of a company (in order to forecast the likely future health of that company), it is essential to understand: the events which affected each of the reported items, the values at which they may be reported (and the methods by which these amounts could have been estimated), and possible manipulations by management.
The income statement and the statement of comprehensive income (which may
be combined) report profitability for the period, explaining some of the period’s changes to the balance sheet assets, liabilities and equity accounts. Comprehensive income (which includes net income and other amounts and also affects equity) should be primarily reported in its own statement or combined with the income statement. Details can be secondarily provided on the statement of changes in equity. Comprehensive Income results from events which change
equity, other than those events related to owners, and so includes effects of company earnings but not effects of selling corporate stock or paying dividends to owners.
The statement of cash flows provides details of cash changes, categorized within operating, investing, and financing categories enabling the analyst to determine the primary sources and uses of cash.(Sales and cost of goods sold are examples of sources and uses of cash.)
Companies also report some version of a statement of changes in equity,
enabling the analyst to determine the relative size and causes of the changes to equity brought about by retaining earnings and additional investment in the company by existing and/or new owners.
While the statements report dollar balances of and changes to asset, liability and
equity accounts, the footnotes provide some details of risks and resources, accounting methods and estimates, calculations underlying reported figures, and related nonfinancial facts. Each financial statement captures different consequences of the
17
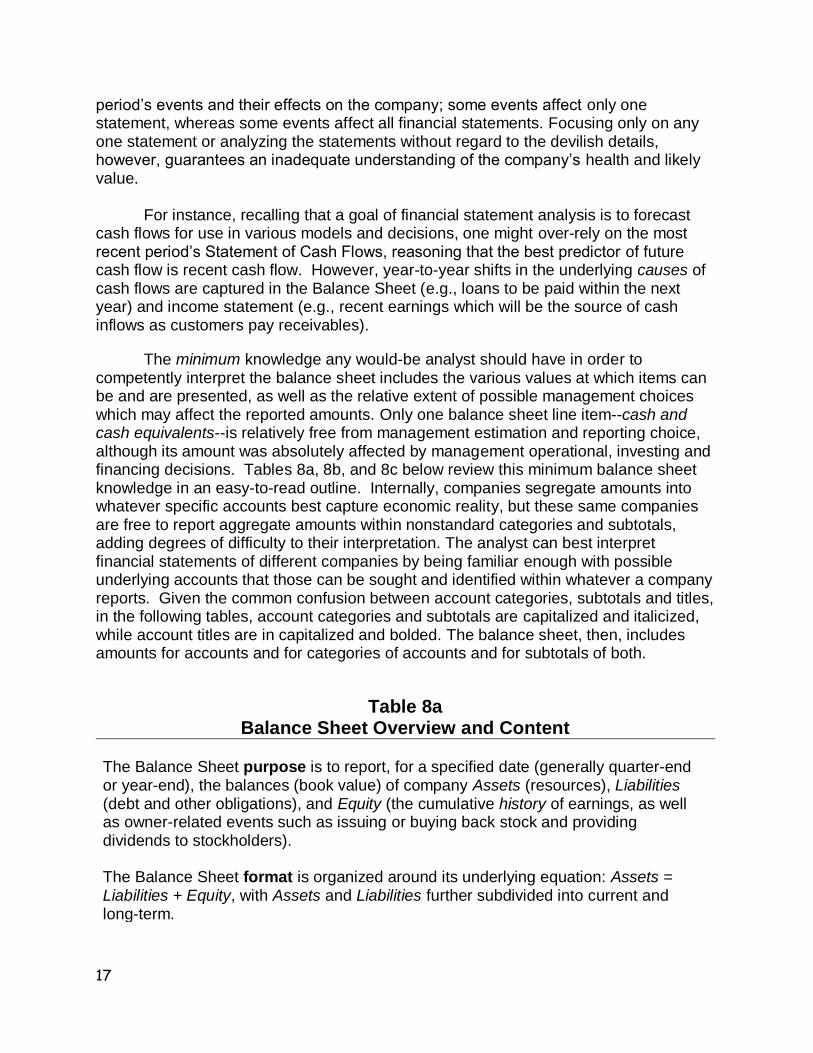
period’s events and their effects on the company; some events affect only one statement, whereas some events affect all financial statements. Focusing only on any one statement or analyzing the statements without regard to the devilish details, however, guarantees an inadequate understanding of the company’s health and likely value.
For instance, recalling that a goal of financial statement analysis is to forecast cash flows for use in various models and decisions, one might over-rely on the most recent period’s Statement of Cash Flows, reasoning that the best predictor of future cash flow is recent cash flow. However, year-to-year shifts in the underlying causes of cash flows are captured in the Balance Sheet (e.g., loans to be paid within the next year) and income statement (e.g., recent earnings which will be the source of cash inflows as customers pay receivables).
The minimum knowledge any would-be analyst should have in order to competently interpret the balance sheet includes the various values at which items can be and are presented, as well as the relative extent of possible management choices which may affect the reported amounts. Only one balance sheet line item--cash and cash equivalents--is relatively free from management estimation and reporting choice, although its amount was absolutely affected by management operational, investing and financing decisions. Tables 8a, 8b, and 8c below review this minimum balance sheet knowledge in an easy-to-read outline. Internally, companies segregate amounts into whatever specific accounts best capture economic reality, but these same companies are free to report aggregate amounts within nonstandard categories and subtotals, adding degrees of difficulty to their interpretation. The analyst can best interpret financial statements of different companies by being familiar enough with possible underlying accounts that those can be sought and identified within whatever a company reports. Given the common confusion between account categories, subtotals and titles, in the following tables, account categories and subtotals are capitalized and italicized, while account titles are in capitalized and bolded. The balance sheet, then, includes amounts for accounts and for categories of accounts and for subtotals of both.
Table 8a Balance Sheet Overview and Content
The Balance Sheet purpose is to report, for a specified date (generally quarter-end or year-end), the balances (book value) of company Assets (resources), Liabilities (debt and other obligations), and Equity (the cumulative history of earnings, as well as owner-related events such as issuing or buying back stock and providing dividends to stockholders). The Balance Sheet format is organized around its underlying equation: Assets = Liabilities + Equity, with Assets and Liabilities further subdivided into current and long-term.
18
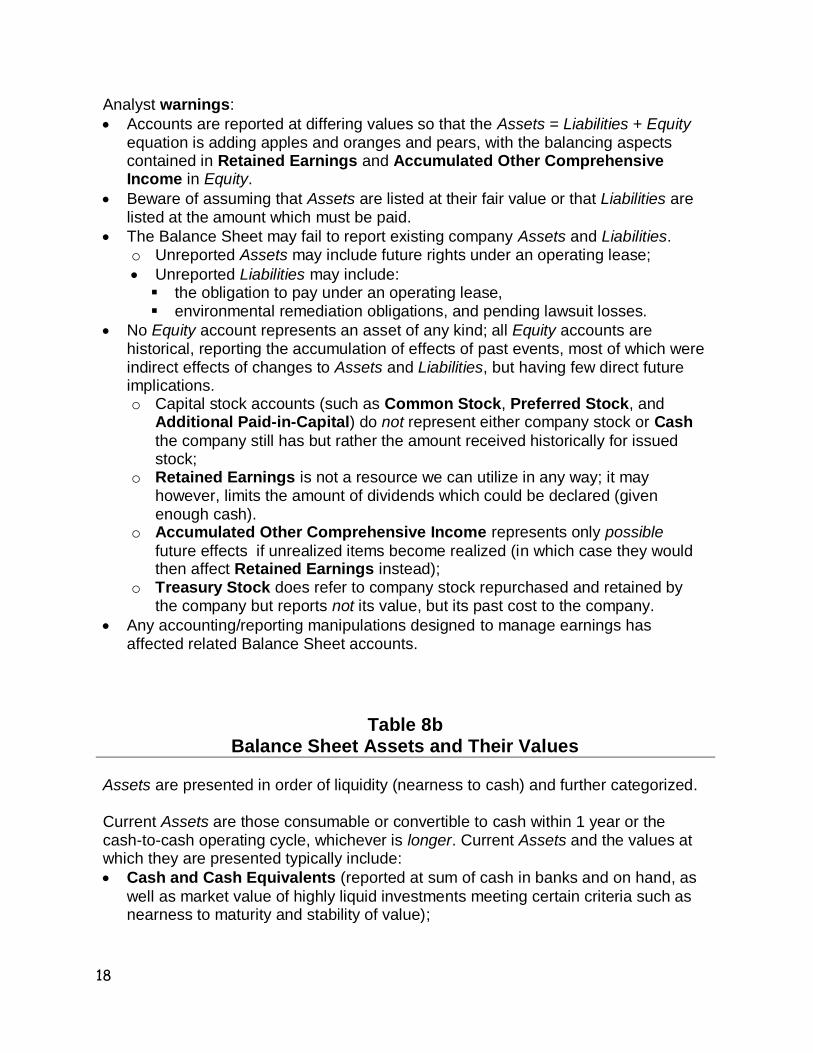
Analyst warnings:
Accounts are reported at differing values so that the Assets = Liabilities + Equity equation is adding apples and oranges and pears, with the balancing aspects contained in Retained Earnings and Accumulated Other Comprehensive Income in Equity.
Beware of assuming that Assets are listed at their fair value or that Liabilities are listed at the amount which must be paid.
The Balance Sheet may fail to report existing company Assets and Liabilities. o Unreported Assets may include future rights under an operating lease;
Unreported Liabilities may include: the obligation to pay under an operating lease, environmental remediation obligations, and pending lawsuit losses.
No Equity account represents an asset of any kind; all Equity accounts are historical, reporting the accumulation of effects of past events, most of which were indirect effects of changes to Assets and Liabilities, but having few direct future implications. o Capital stock accounts (such as Common Stock, Preferred Stock, and
Additional Paid-in-Capital) do not represent either company stock or Cash
the company still has but rather the amount received historically for issued stock;
o Retained Earnings is not a resource we can utilize in any way; it may however, limits the amount of dividends which could be declared (given enough cash).
o Accumulated Other Comprehensive Income represents only possible
future effects if unrealized items become realized (in which case they would then affect Retained Earnings instead);
o Treasury Stock does refer to company stock repurchased and retained by the company but reports not its value, but its past cost to the company.
Any accounting/reporting manipulations designed to manage earnings has affected related Balance Sheet accounts.
Table 8b Balance Sheet Assets and Their Values
Assets are presented in order of liquidity (nearness to cash) and further categorized. Current Assets are those consumable or convertible to cash within 1 year or the cash-to-cash operating cycle, whichever is longer. Current Assets and the values at which they are presented typically include:
Cash and Cash Equivalents (reported at sum of cash in banks and on hand, as
well as market value of highly liquid investments meeting certain criteria such as nearness to maturity and stability of value);

19
Accounts Receivable (reported at legally claimable amounts due from customers arising from trade, reduced by (net of) manager-estimated Allowance for Doubtful Accounts);
Inventories (reported at the lower value between cost or market value—with cost
calculated using method selected by management and market value affected by management choices);
Marketable Securities (reported at market value except for held-to-maturity debt
securities which are reported at amortized cost);
Prepaid Expenses (reported at amount of cash originally paid for remaining
benefits, which remainder may have been estimated by management). Long-term Asset categories, accounts and values at which they are presented typically are:
Property, Plant & Equipment (PP&E) which includes o depreciable Assets, e.g. Building and Equipment (reported at depreciated
cost = cost - accumulated depreciation calculated using straight-line or an accelerated method, selected by management, using manager-estimated useful life and salvage values), and
o non-depreciable Assets such as Land in use (reported at historic cost);
Natural Resources (depletable Assets such as Timber Stand and Coal Mine,
reported at depleted cost = cost - accumulated depletion generally calculated using an expected rate based on anticipated units of production);
Intangible Assets o amortizable Assets such as Patent and Franchise, reported at amortized cost
= historic cost - accumulated amortization, o Assets subject to impairment such as Goodwill, reported at original cost less
any subsequent impairments. [Goodwill is the amount paid for an acquired company over the fair value of identifiable Assets less Liabilities, so essentially an amount paid for an intangible that the purchased company developed but could not claim on its own Balance Sheet.]
Table 8c Balance Sheet Liabilities and Equity
Current Liabilities and the values at which they are presented typically include:
Accounts Payable (as invoiced), Accrued Liabilities (as estimated), Income Tax Payable (as calculated);
Long-term Liabilities generally reported at present value such as
Long term debt (e.g., Bonds payable) (present value when recorded – principal
already paid).

20
Balance Sheet amounts which are reported as either estimated Assets or Liabilities, depending:
Deferred Tax Assets (at expected amount of future tax deductions related to past taxable events) or Deferred Tax Liabilities (at expected amount of future tax
owed related to past taxable events); and
Pension Assets (at the excess of pension resources over anticipated obligations) or Pension Liability (at the excess of anticipated obligations over pension
resources).
Equity balances and the value at which they are presented typically in two categories: Capital Stock and Profit. Capital Stock accounts include:
Preferred Stock (consideration previously received from issuing preferred stock
up to its par value),
Common Stock (consideration previously received from issuing common stock
up to its par value),
Additional Paid In Capital (consideration previously received above par from
issuing company stock),
<Treasury stock> (negative Equity, at amount paid to buy back company stock,
not yet reissued or retired). Profit accounts include:
Retained Earnings (the sum of prior Net Incomes less net losses and dividends
to owners), and so typically a positive Equity account.
Accumulated Other Comprehensive Income (AOCI) is reported at the running
balance of cumulative changes in net Assets (that is, Assets - Liabilities) which bypassed the Income Statement and therefore Retained Earnings; the annual changes to AOCI are from Other Comprehensive Income or ‘dirty surplus” items’ which can result in AOCI being reported as positive or negative Equity.
Sources of supplemental information include:
Balance Sheet parenthetical comments at select account lines such as o Preferred Stock and Common Stock par or stated values; the number of
shares authorized, issued, and perhaps outstanding; any Preferred Stock dividend % (e.g., 8% meaning annual dividend = 8% of Preferred Stock par
value) and other characteristics (such as participating in any additional dividend available).
Footnotes, possibly providing additional information about any account.
The income statement is a bridging report, presenting elements of earnings
between balance sheet dates. This is the report that presents “the bottom line” of net income, also called net earnings and net profit, and also may present a company’s comprehensive income if the report is a combined statement of net and comprehensive
21
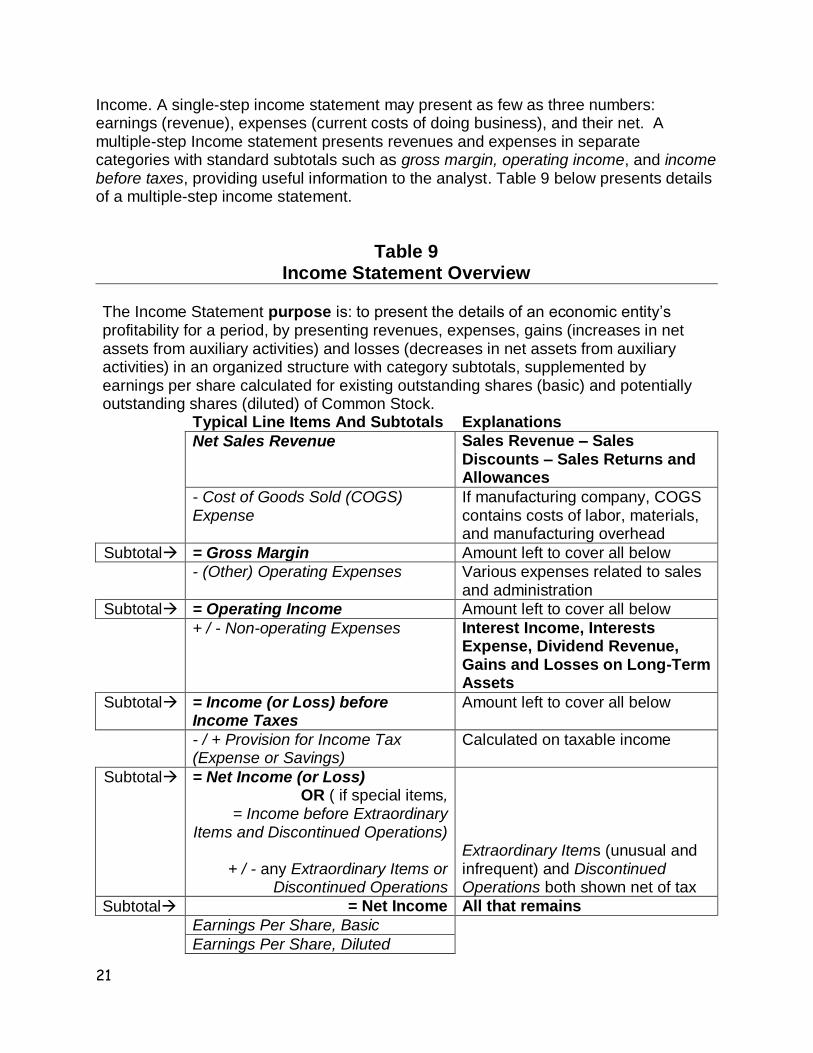
Income. A single-step income statement may present as few as three numbers: earnings (revenue), expenses (current costs of doing business), and their net. A multiple-step Income statement presents revenues and expenses in separate categories with standard subtotals such as gross margin, operating income, and income before taxes, providing useful information to the analyst. Table 9 below presents details of a multiple-step income statement.
Table 9 Income Statement Overview
The Income Statement purpose is: to present the details of an economic entity’s profitability for a period, by presenting revenues, expenses, gains (increases in net assets from auxiliary activities) and losses (decreases in net assets from auxiliary activities) in an organized structure with category subtotals, supplemented by earnings per share calculated for existing outstanding shares (basic) and potentially outstanding shares (diluted) of Common Stock. Typical Line Items And Subtotals Explanations
Net Sales Revenue Sales Revenue – Sales Discounts – Sales Returns and Allowances
- Cost of Goods Sold (COGS) Expense
If manufacturing company, COGS contains costs of labor, materials, and manufacturing overhead
Subtotal = Gross Margin Amount left to cover all below
- (Other) Operating Expenses Various expenses related to sales and administration
Subtotal = Operating Income Amount left to cover all below
+ / - Non-operating Expenses Interest Income, Interests Expense, Dividend Revenue, Gains and Losses on Long-Term Assets
Subtotal = Income (or Loss) before Income Taxes
Amount left to cover all below
- / + Provision for Income Tax (Expense or Savings)
Calculated on taxable income
Subtotal = Net Income (or Loss) OR ( if special items,
= Income before Extraordinary Items and Discontinued Operations)
+ / - any Extraordinary Items or
Discontinued Operations
Extraordinary Items (unusual and infrequent) and Discontinued Operations both shown net of tax
Subtotal = Net Income All that remains
Earnings Per Share, Basic
Earnings Per Share, Diluted

22
Net Income (and EPS) reports total profit generated by the economic entity (and indirectly by each share of that entity) during the period, after considering all earned Revenues, matched Expenses, Gains and Losses, other than those which bypass the Income Statement and go directly to AOCI in Equity. Comprehensive Income is comprised of Net Income and that period’s Other Comprehensive Income Items (OCI) which bypass the Income Statement and go directly to AOCI in Equity); accordingly Comprehensive Income
reports total profit, after considering all earned Revenues, matched Expenses, Gains and Losses (including those which bypassed the Income Statement)
and therefore accounts for all changes to Equity other than interactions with owners.
Related supplemental information typically provided (footnotes): accounting policies and estimates affecting reported amounts, calculations by segment.
An essential aspect of analysis concerns the timing, amounts, sources and uses of cash. Typically, analysis is in support of decisions which require the forecasting of cash flows to the company in order to forecast cash flows to the inquiring entity, such as the potential or actual investor, creditor, or employee. Auditors may use historic cash flow information to better assess the historic accrual information reported in the Income Statement. Taxing authorities may use reported cash flow to assess the company’s tax return. Regulatory agencies like the SEC may determine future company cash flow (such as that from permitted rates) based on historic cash flow information. The statement of cash flows (SCF) provides cash flow history to support cash flow analysis and forecasting. Table 10 below lists the SCF overview and standard contents; analysis recommendations are presented in Prospecting Quick Guide 2.
Table 10 Statement of Cash Flows (SCF) Overview.
1. The SCF for a given period reports an economic entity’s consolidated net change in
cash (and perhaps Cash Equivalents) as well as details of cash flows in and out, categorized as being related to operating, investing, or financing activities.
23
2. Cash Flow from Operations (CFO) presents cash flow related to the company’s primary business activities and can be presented using the direct method or the indirect method.
Direct method CFO presents cash inflows from customers and other sources and cash outflows for specific uses, such as for inventory, wages, interest and taxes. Each of these amounts can be calculated as an Income Statement amount adjusted by the change in one or more Balance Sheet accounts. Direct method CFO must be supplemented with a reconciliation between Net Income and CFO.]
Indirect method CFO, the method most commonly encountered in financial statements, calculates CFO by starting with Net Income and adjusting out various amounts that are not cash-related such as o noncash Income Statement amounts (Depreciation, Amortization, and
Depletion Expenses); o non-operating amounts (such as Gains and Losses on sale of long term
Assets); o effect of Balance Sheet changes in noncash current Assets (A/R, Inventory,
Prepaid Expenses) and current Liabilities (A/P, Wages Payable, etc.) as well as long term accounts clearly related to Operations (e.g. Deferred Tax Assets, Deferred Tax Liabilities).
o A generic formula for indirect method CFO is: Net Income + Losses on sale of LT Assets – Gains on sale of LT Assets + Equity Losses – Equity Earnings + Depreciation/Amortization/Depletion Expenses - increases (or + decreases) in current Assets (other than Cash, of course) + increases (or - decreases) in current Liabilities.
3. Investing cash flows (CFI) are presented as cash flows in from sale of long term
Assets and cash flows out for purchase of long term Assets, including receivables
such as loans to others; these amounts generally reconcile to long term asset changes on the Balance Sheet.
4. Financing cash flows (CFF) are presented as cash flows in from new debt (long term Liabilities) and from issuing the company’s stock and cash flows out for repayment of debt and payment to owners (either by repurchasing stock or paying dividends), amounts generally reconciling to BS changes.
The statement of equity (also called statement of owner’s equity or statement of changes in equity) may follow various formats but simply shows, for each equity account, the period’s beginning balance, causes and amounts of increases and decreases, and the period’s ending balance. For companies with simple equity (such as no AOCI and no changes to stock accounts), a statement of retained earnings can be presented, as that account would then report the only equity changes for the period.
Lastly, the footnotes really are an integral part of the statements, as each financial statement reminds the reader. A review of the statements without close reading of the notes shifts the balance of power closer to the company. The analyst can increase the power of analysis by carefully considering all available information,

24
particularly the note disclosures that are required to explain some of the slight-of-hand techniques which were used in the preparation of the reports. Thoughtfully reviewing the notes to the reports enables an analyst to discerningly and critically read the reports themselves. Once an analyst feels comfortable with the scope and format of these statements and their related notes, reviewing the reports and notes of any given company becomes a meaningful exercise in identifying relevant information about the company. Now the would-be analyst is ready for the next step: that of applying analysis techniques, discussed in Prospecting Quick Guide 2.
Summary
Financial statements can be rich sources of valuable data, often disguised and hidden in multiple layers of constraining, distracting, and misleading information designed by the company to impress the many users who will be attempting to ascertain the company’s recent health and profitability in order to make decisions which rely on at least an intuitive forecast of the company’s future. A wide range of decision makers are attempting to determine, among many other things, whether or not to invest or divest, whether to lend money, whether to seek employment with the company, whether to sign a long-term agreement as a customer or supplier. Would-be analysts can negotiate the difficulties described in this Prospecting Quick Guide 1 and then apply a thoughtful structured approach to analyzing the data using Prospecting Quick Guide 2, guided by understanding that not all that glitters is gold, and all that is gold does not glitter.
Note: Photograph of coins is by Carole E. Scott.