13th Year - Metlife Financial FY 2070-071...Final Fiscal Year - 2013/014 (2070/071) American Life...
41
-
Upload
truongngoc -
Category
Documents
-
view
218 -
download
1
Transcript of 13th Year - Metlife Financial FY 2070-071...Final Fiscal Year - 2013/014 (2070/071) American Life...
Final
Fiscal Year - 2013/014 (2070/071)
American Life Insurance Company
13th Year
Audited Financial Statements


Directors Reports
A. General Information about Insurer:
1. Date of Incorporation: 2058/04/18 ( August 02, 2001)
2. Date of receiving insurer registration certificate: 2058/04/18 ( August 02, 2001)
3. Type & category of insurance license received by the insurer: Life Insurance
4. Date of starting business: 2058/10/17 (30 January 2002)
5. Other information, as insurer finds important: ALICO is registered as a branch of foreign
company with Office of the Company Registrar on 2062/02/23 (June 05, 2005).
B. KpuwtgtÓu"Dqctf"qh Director Reports.
1. Eqorcp{"nkegpug"ku"rtqrgtn{"tgpgygf"xkfg"Kpuwtcpeg"DqctfÓu"ngvvgt"pq0"Pk0"Uc0"07/071/072 Cha.
No. 246 dated 2071/04/27 (12 August, 2014) & is valid for doing insurance business till the end
of Chaitra 2071 (13 April 2015).
2. Service fee payable of amount NPR. 18,158,179 to Insurance Board and withholding tax payable
of NPR. 2,894,968 at the Balance Sheet date are being paid on respective due dates.
3. American Life Insurance Company Nepal is a branch of American Life Insurance Company
which is incorporated under the laws of the United State of America. The branch does not have
any share capital.
4. The Company would maintain solvency margin as per requirement of relevant Solvency Margin
Directive upon finalization of actuarial valuation for the year 2070/71 (2013/14). The Company
maintained a solvency margin of 689 % as of 2071 Ashad end (16 July 2014).
5. A. Xcnwg"qh"cuugvu"kpenwfgf"kp"vjg"kpuwtgtÓu"hkpcpekcn"uvcvgogpv"qp"vjg"fcvg"qh"dcncpeg"ujggv"ku"pqv"above the realizable/market value of the assets.
B. Investments are valued as per method given in financial directives of Insurance Board.
6. Company has made all its investment within the provisions of the existing laws.
7. Company has adequate re-insurance arrangement for insurance risks, and other situational risks
are being closely monitored. Required actions are being taken in consultation with RO/HO.
8. American Life Insurance Company, Nepal is an independent branch and it does not have to share
any part of risk arising from the business operated in other territories. ALICO is a subsidiary of
MetLife Inc, HO/RO and offices operated in different countries are as under:
ALICO Î HO China Jordan and PNA Russia
Wilmington, USA Colombia Kuwait Saudi Arabia
Cyprus Korea Serbia
Regional Office Czech Republic Latvia Slovakia
Hong Kong Egypt Lebanon Spain
Other MetLife Operations France Lithuania Turkey
Argentina Greece Mexico Ukraine
Australia Hungary Malaysia United Arab Emirates
Bahrain Hong Kong Oman United Kingdom
Bangladesh Ireland Poland Uruguay
Brazil India Portugal Unites State of America
Bulgaria Italy Qatar Vietnam
Chile Japan Romania
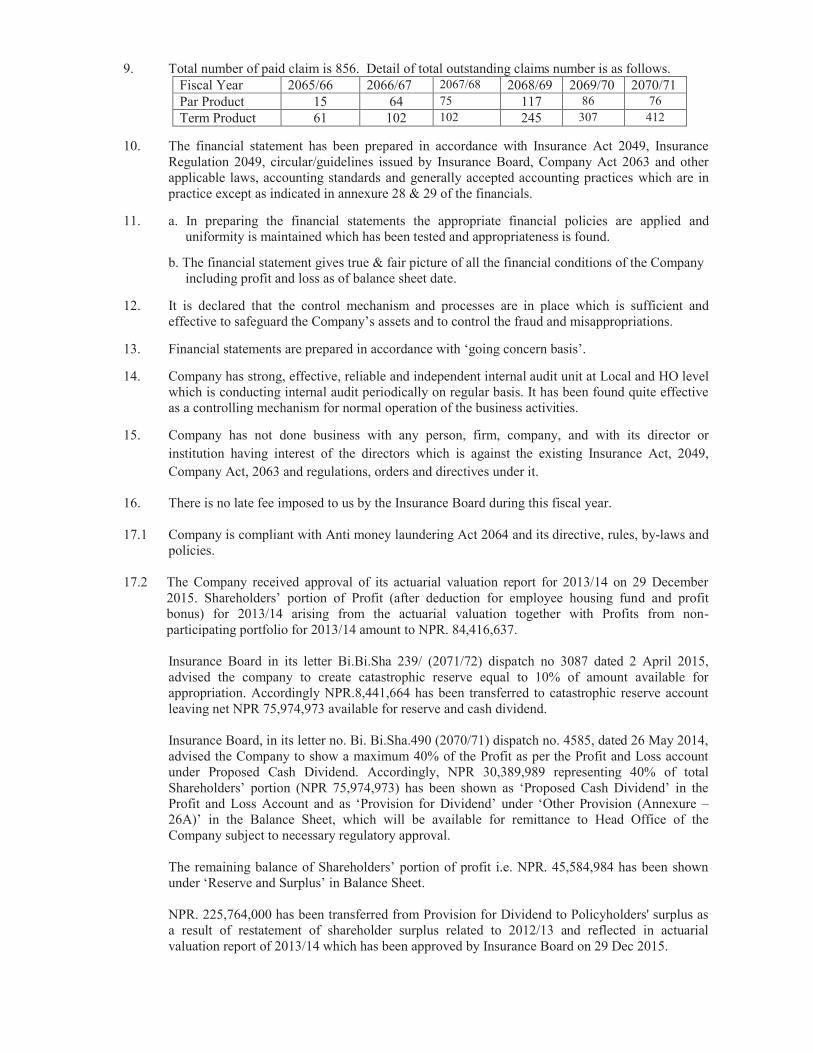
9. Total number of paid claim is 856. Detail of total outstanding claims number is as follows.
Fiscal Year 2065/66 2066/67 2067/68 2068/69 2069/70 2070/71
Par Product 15 64 75 117 86 76
Term Product 61 102 102 245 307 412
10. The financial statement has been prepared in accordance with Insurance Act 2049, Insurance
Regulation 2049, circular/guidelines issued by Insurance Board, Company Act 2063 and other
applicable laws, accounting standards and generally accepted accounting practices which are in
practice except as indicated in annexure 28 & 29 of the financials.
11. a. In preparing the financial statements the appropriate financial policies are applied and
uniformity is maintained which has been tested and appropriateness is found.
b. The financial statement gives true & fair picture of all the financial conditions of the Company
including profit and loss as of balance sheet date.
12. It is declared that the control mechanism and processes are in place which is sufficient and
effective to safeguard vjg"Eqorcp{Óu"cuugvs and to control the fraud and misappropriations.
13. Financial statements are rtgrctgf"kp"ceeqtfcpeg"ykvj"Òiqkpi"eqpegtp"dcukuÓ0"
14. Company has strong, effective, reliable and independent internal audit unit at Local and HO level
which is conducting internal audit periodically on regular basis. It has been found quite effective
as a controlling mechanism for normal operation of the business activities.
15. Company has not done business with any person, firm, company, and with its director or
institution having interest of the directors which is against the existing Insurance Act, 2049,
Company Act, 2063 and regulations, orders and directives under it.
16. There is no late fee imposed to us by the Insurance Board during this fiscal year.
17.1 Company is compliant with Anti money laundering Act 2064 and its directive, rules, by-laws and
policies.
17.2 The Company received approval of its actuarial valuation report for 2013/14 on 29 December
42370" UjctgjqnfgtuÓ" rqtvkqp" qh" Rtqhkv" *chvgt" fgfwevkqp" hqt" gornq{gg" jqwukpi" hwpd and profit
bonus) for 2013/14 arising from the actuarial valuation together with Profits from non-
participating portfolio for 2013/14 amount to NPR. 84,416,637.
Insurance Board in its letter Bi.Bi.Sha 239/ (2071/72) dispatch no 3087 dated 2 April 2015,
advised the company to create catastrophic reserve equal to 10% of amount available for
appropriation. Accordingly NPR.8,441,664 has been transferred to catastrophic reserve account
leaving net NPR 75,974,973 available for reserve and cash dividend.
Insurance Board, in its letter no. Bi. Bi.Sha.490 (2070/71) dispatch no. 4585, dated 26 May 2014,
advised the Company to show a maximum 40% of the Profit as per the Profit and Loss account
under Proposed Cash Dividend. Accordingly, NPR 30,389,989 representing 40% of total
UjctgjqnfgtuÓ" rqtvkqp" *PRT" 97.;96.;95+" jcu" dggp" ujqyp" cu" ÒRtqrqugf" Ecuj"FkxkfgpfÓ" kp" vjg"Rtqhkv" cpf"Nquu"Ceeqwpv" cpf" cu" ÒRtqxkukqp" hqt"FkxkfgpfÓ" wpfgt" ÒQvjgt" Rtqxkukqp" *Cnnexure Î48C+Ó" kp" vjg" Dcncpeg" Ujggv." yjkej" yknn" dg" cxckncdng" hqt" tgokvvcpce to Head Office of the
Company subject to necessary regulatory approval.
Vjg"tgockpkpi"dcncpeg"qh"UjctgjqnfgtuÓ"rqtvkqp"qh"rtqhkv" k0g0"PRT0"67.7:6.;:6"jcu"dggp"ujqyp"wpfgt"ÒTgugtxg"cpf"UwtrnwuÓ"kp"Dcncpeg"Ujggv0
NPR. 225,764,000 has been transferred from Provision for Dividend to Policyholders' surplus as
a result of restatement of shareholder surplus related to 2012/13 and reflected in actuarial
valuation report of 2013/14 which has been approved by Insurance Board on 29 Dec 2015.

Amount in NPR.
SN Particular Anx. This Year Last Year
1 Paid-up Capital 16 - -
2 Reserve and Surplus 17 512,770,096 463,907,824
3 Life Insurance Fund 11 8,763,267,860 7,458,729,732
4 Catastrophe Fund 18 8,441,664 -
5 Long Term Debt and Loan Payable 19 - -
Total Sources 9,284,479,620 7,922,637,556
6 Fixed Assets (Net) 20 13,899,572 6,066,858
7 Long Term Investment 21 2,574,647,036 3,636,847,029
8 Policy Loan 3 624,428,217 555,310,888
9 Other Long Term Loan 23 92,519 166,477
Current Assets Loan and Advance
10 Cash & Bank Balance 22 30,254,022 461,017,179
11 Short Term Investment 21 6,436,462,454 3,738,168,957
12 Other Short Term Loan 23 - -
13 Other Assets 24 294,316,131 261,595,408
Total (A) (10+11+12+13) 6,761,032,607 4,460,781,544
Current Liabilities and Provisions:
14 Current Liabilities 25 172,882,172 168,898,476
15 Provision for Unexpired Risks 26 104,186,000 72,277,374
16 Claims Payable 9 199,934,892 165,802,798
17 Other Provisions 26A 266,837,543 437,831,820
Total (B) (14+15+16+17) 743,840,607 844,810,468
18 Net Current Assets (C)= A-B 6,017,192,000 3,615,971,076
19 Other Exps Balance for Write off/Adjustment 27 54,220,276 108,275,228
20 Loss Transferred from P&L Account
Total Uses (6+7+8+9+18+19+20) 9,284,479,620 7,922,637,556
Contingent liabilities and annexure 3, 9, 11 and 16 to 29 are integral part of this.
Contingent Liabilities
SN This Year Last Year
1
2
3
4
5
- -
As per our report of even date.
ÈÈÈÈÈÈÈÈ ÈÈÈÈÈÈÈÈÈÈ ÈÈÈÈÈÈÈÈÈÈ0Poshak Raj Paudel M. Ala Uddin Ahmad Madan Krishna Sharma
Financial Controller Chief Executive Officer Partner
CSC & Co.
Chartered Accountants
American Life Insurance Company
Balance Sheet as on 16 July, 2014 (2071 Ashad End)
SOURCES
USES
Total
Investment remaining for settlement
Guaranteed issued
Particular
Guarantee issued by insured or on behalf of insured.
Other
Claim other than insurance business not accepted by
the company

Amount in NPR.
SN Particular Anx. This Year Last Year
1 Transferred from Revenue A/c 10 74,037,392 56,039,380
2 Transferred from Life Fund 11 28,502,010 582,029,423
3 Income from Investment, Loan and Others 2 22,327,282 7,241,228
4 Written Back Provision 12 - -
5 Other Income
124,866,684 645,310,031
6 Management Expense 7 27,121,103 13,749,088
7 Written off Expense 13 - -
8 Share Issue Expense 13a
9 Other Expense 14 - -
10 Provision for Loss 15 - -
11 Provision for Housing Fund 26a 4,887,280 31,578,047
12 Provision for Staff Bonus 26a 8,441,664 54,543,900
13 Adjusted Income Tax (A) 8
14 B) Income tax - -
15 C) Deferred Tax Assets / (Liabilities) (2,656,287) (10,908,387)
16 Transfer to Life Fund 11 - -
37,793,760 88,962,648
17 Net Profit / (Loss) (C) = A-B 87,072,924 556,347,383
18 Expenses Related with Last Years - -
19 Profit/(Loss) Transferred from Last Year
87,072,924 556,347,383
A) Deferred Tax Reserve 17 2,656,287 10,908,387
B) Capital Reserve 17 - -
C) Special Reserve 17 - -
D) Other Reserve - Contingency Reserve 17 - -
E) Proposed Dividend
a) Bonus Share 17
b) Cash Dividend 26 A 30,389,989 218,175,598
F) Catastrophe Reserve 18 8,441,664 -
21 Profit/(Loss) Transferred to Balance Sheet 45,584,984 327,263,398
Annexure 2,7,8 & 10 to 15, 17 & 18 are integral part of this.
As per our report of even date.
ÈÈÈÈÈÈÈ00 ÈÈÈÈÈÈÈ0ÈÈ ÈÈÈÈÈ00ÈÈÈÈÈ00Poshak Raj Paudel M. Ala Uddin Ahmad Madan Krishna Sharma
Financial Controller Chief Executive Officer Partner
CSC & Co.
Chartered Accountants
20
Amount for Allocation
American Life Insurance Company
Profit & Loss Account for the Fiscal Year 2013/014 ( 2070/071)
INCOME
Total Income (A)
EXPENSE
Total Expense (B)

Amount in NPR.
SN Particular Anx. This Year Last Year
REVENUE
1Premium (Net)
1 1,793,985,177 1,583,693,410
2Re-insurance Commission Income
10,893,072 7,692,942
3Investment, Loan and Other Income
2 530,134,940 506,211,267
4Income from Policy Loan
3 76,041,443 66,866,453
5Other Direct Income
4,346,285 6,770,061
6Provision for Outstanding Claim at the Beginning of the Fiscal
Year165,802,798 161,363,526
7Provision for Unexpired Risks at the Beginning of the Fiscal
Year72,277,374 43,384,567
Total Revenue (A) 2,653,481,089 2,375,982,226
-
8 Claim Payment (Net) 4 806,990,955 561,260,626
9 Agent Commission 5 127,544,046 110,226,772
10 Medical Examination Fee 1,164,649 1,518,645
11 Re-insurance Commission Expenses - -
12 Service Fee (Net) 6 18,158,179 15,998,476
13 Other Direct Expenses - -
14 Management Expenses 7 129,593,926 101,479,708
15 Income Tax 8 84,594,912 80,865,553
16Provision for Outstanding Claim at the End of the Fiscal Year 9
199,934,892 165,802,798
17 Provision for Unexpired Risks at the End of the Fiscal Year 104,186,000 72,277,374
Total Expenditure( B) 1,472,167,559 1,109,429,952
18 Surplus Transferred to Life Insurance Fund 1,107,276,138 1,210,512,895
19 Surplus (Loss) Transferred to Profit & Loss A/c 74,037,392 56,039,380
Annexure 1-9 are integral part of this.As per our report of even date.
ÈÈÈÈÈÈÈÈÈÈMadan Krishna Sharma
Financial controller Chief Executive Officer Partner
CSC & Co.
Chartered Accountants
American Life Insurance Company
Consolidated Revenue Account for the Fiscal Year 2013/014 (2070/071)
EXPENDITURE
00ÈÈÈÈÈÈ000"""""""""""""""""""""""""""""""""""""""""""""""""""""ÈÈÈÈÈ0ÈÈÈ00Poshak Raj Paudel M. Ala Uddin Ahmad

Amount in NPR.
SN Particular Anx This Year Last Year
REVENUE
1 Premium (Net) 1 727,748,982 707,352,268
2 Re-insurance Commission Income 4,794,291 4,138,359
3 Investment, Loan and Other Income 2 195,406,162 209,703,729
4 Income from Policy Loan 3 48,939,077 39,799,461
5 Other Direct Income 1,503,898 3,819,611
6Provision for Outstanding Claim at the Beginning of the
Fiscal Year
104,087,875 99,391,755
7Provision for Unexpired Risks at the Beginning of the
Fiscal Year
- -
Total Revenue (A) 1,082,480,285 1,064,205,183
EXPENDITURE
8 Claim Payment (Net) 4 684,657,584 408,880,222
9 Agent Commission 5 30,758,411 40,023,368
10 Medical Examination Fee 835,183 1,199,199
11 Re-insurance Commission Expense - -
12 Service Fee (Net) 6 7,341,180 7,117,417
13 Other Direct Expense - -
14 Management Expense 7 53,963,839 45,725,414
15 Income Tax 8 29,872,848 32,729,484
16Provision for Outstanding Claim at the End of the Fiscal
Year
9 131,011,578 104,087,875
17Provision for Unexpired Risks at the End of the Fiscal
Year
- -
Total Expenditure( B) 938,440,623 639,762,979
18 Surplus Transferred to Life Insurance Fund 144,039,662 424,442,204
19 Surplus (Loss) Transferred to Profit & Loss A/c - -
Annexure 1-9 are integral part of this. As per our report of even date.
ÈÈÈÈÈÈÈÈ00ÈÈ00Madan Krishna Sharma
Financial controller Chief Executive Officer Partner
CSC & Co.
Chartered Accountants
American Life Insurance Company
Revenue Account of Three Payment Plan Insurance for the Fiscal Year 2013/014(2070/071)
00ÈÈÈÈÈÈ000""""""""""""""""""""""""""""""""""""""""""ÈÈÈÈÈÈÈÈ00000"""""""""""Poshak Raj Paudel M. Ala Uddin Ahmad

Amount in NPR.
SN Particular Anx This Year Last Year
REVENUE
1 Premium (Net) 1 661,488,769 640,630,602
2 Re-insurance Commission Income 4,357,780 1,997,846
3 Investment, Loan and Other Income 2 302,146,254 280,259,573
4 Income from Policy Loan 3 27,102,366 27,066,992
5 Other Direct Income 2,842,387 2,950,450
6Provision for Outstanding Claim at the Beginning of the
Fiscal Year
41,217,556 41,229,315
7Provision for Unexpired Risks at the Beginning of the Fiscal
Year
- -
Total Revenue (A) 1,039,155,112 994,134,778
EXPENDITURE
8 Claim Payment (Net) 4 86,819,122 120,173,738
9 Agent Commission 5 36,186,168 40,619,142
10 Medical Examination Fee 329,466 319,446
11 Re-insurance Commission Expense
12 Service Fee (Net) 6 6,672,778 6,448,906
13 Other Direct Expense
14 Management Expense 7 48,451,488 41,185,928
15 Income Tax 8 53,580,746 47,718,243
16Provision for Outstanding Claim at the End of the Fiscal
Year
9 41,679,187 41,217,556
17Provision for Unexpired Risks at the End of the Fiscal Year
Total Expenditure( B) 273,718,955 297,682,959
18Surplus Transferred to Life Insurance Fund
765,436,157 696,451,820
19 Surplus (Loss) Transferred to Profit & Loss A/c - -
Annexure 1-9 are integral part of this. As per our report of even date.
ÈÈÈÈÈÈÈÈMadan Krishna Sharma
Financial controller Chief Executive Officer Partner
CSC & Co.
Chartered Accountants
American Life Insurance Company
Revenue Account of Endowment Insurance for the Fiscal Year 2013/014 (2070/071)
00ÈÈÈÈÈÈ000"""""""""""""""""""""""""""""""""""""""""""""ÈÈÈÈÈ0ÈÈ00È00""""""Poshak Raj Paudel M. Ala Uddin Ahmad

Amount in NPR.
SN Particular Anx This Year Last Year
REVENUE
1 Premium (Net) 1 262,513,347 120,969,948
2 Re-insurance Commission Income - -
3 Investment, Loan and Other Income 2 19,308,903 6,211,941
4 Income from Policy Loan 3 - -
5 Other Direct Income - -
6Provision for Outstanding Claim at the Beginning of the
Fiscal Year 360,001 -
7Provision for Unexpired Risks at the Beginning of the Fiscal
Year - -
Total Revenue (A) 282,182,251 127,181,889
EXPENDITURE
8 Claim Payment (Net) 4 9,067,546 5,241,890
9 Agent Commission 5 51,402,613 24,122,613
10 Medical Examination Fee - -
11 Re-insurance Commission Expense - -
12 Service Fee (Net) 6 2,648,108 1,212,820
13 Other Direct Expense - -
14 Management Expense 7 16,392,774 6,625,694
15 Income Tax 8 615,891 -
16Provision for Outstanding Claim at the End of the Fiscal Year 9
4,255,000 360,001
17 Provision for Unexpired Risks at the End of the Fiscal Year - -
Total Expenditure( B) 84,381,932 37,563,018
18 Surplus Transferred to Life Insurance Fund 197,800,319 89,618,871
19 Surplus (Loss) Transferred to Profit & Loss A/c - -
Annexure 1-9 are integral part of this. As per our report of even date.
ÈÈÈÈÈÈÈÈÈ0Madan Krishna Sharma
Financial controller Chief Executive Officer Partner
CSC & Co.
Chartered Accountants
American Life Insurance Company
Revenue Account of DPS Insurance for the Fiscal Year 2013/014 (2070/071)
00ÈÈÈÈÈÈ000""""""""""""""""""""""""""""""""""""""""""""""ÈÈÈÈÈÈÈ000È00Poshak Raj Paudel M. Ala Uddin Ahmad

Amount in NPR.
SN Particular Anx This Year Last Year
REVENUE
1 Premium (Net) 1 142,234,079 114,740,592
2 Re-insurance Commission Income 1,741,001 1,556,737
3 Investment, Loan and Other Income 2 13,273,621 10,036,024
4 Income from Policy Loan 3 - -
5 Other Direct Income - -
6Provision for Outstanding Claim at the Beginning of the
Fiscal Year 20,137,366 20,742,456
7Provision for Unexpired Risks at the Beginning of the Fiscal
Year 72,277,374 43,384,567
Total Revenue (A) 249,663,441 190,460,376
EXPENDITURE
8 Claim Payment (Net) 4 26,446,703 26,964,776
9 Agent Commission 5 9,196,854 5,461,649
10 Medical Examination Fee
11 Re-insurance Commission Expense
12 Service Fee (Net) 6 1,496,113 1,219,333
13 Other Direct Expense
14 Management Expense 7 10,785,825 7,942,672
15 Income Tax 8 525,427 417,826
16Provision for Outstanding Claim at the End of the Fiscal Year 9
22,989,127 20,137,366
17 Provision for Unexpired Risks at the End of the Fiscal Year 104,186,000 72,277,374
Total Expenditure( B) 175,626,049 134,420,996
18 Surplus Transferred to Life Insurance Fund - -
19 Surplus (Loss) Transferred to Profit & Loss A/c 74,037,392 56,039,380
Annexure 1-9 are integral part of this. As per our report of even date.
ÈÈÈÈÈÈÈÈÈ0Madan Krishna Sharma
Financial controller Chief Executive Officer Partner
CSC & Co.
Chartered Accountants
American Life Insurance Company
Revenue Account of Term (Non Par) Insurance for the Fiscal Year 2013/014 (2070/071)
00ÈÈÈÈÈÈ000""""""""""""""""""""""""""""""""""""""""""""""ÈÈÈÈÈÈÈ0ÈÈ00Poshak Raj Paudel M. Ala Uddin Ahmad

Amount in NPR.
SN This Year Last Year
A
1,815,817,857 1,599,847,614
4,346,285 6,770,061
- -
10,893,072 7,692,942
- -
6,783,338 5,197,084
(21,832,680) (16,154,204)
- -
(127,544,046) (110,226,772)
(1,164,649) (1,518,645)
(50,775,774) (45,089,428)
(106,312,914) (14,186,971)
(469,718,422) (317,441,763)
(185,788,277) (188,625,305)
(1,178,906) (1,114,242)
(18,158,179) (15,998,476)
Other Direct Expenses -
(156,715,029) (115,228,796)
Employee Bonus Payment - (2,488,213)
(150,451,298) (79,136,201)
907,662,243 450,916,315
(100,969,861) 124,708,800
1,354,892,760 1,287,923,799
B
(7,832,714) (1,486,075)
- 288,987,249
(2,337,118,497) (1,585,320,218)
- -
- -
- -
- -
(69,117,329) (69,473,966)
73,958 (20,674)
606,352,174 513,452,495
- -
- -
76,041,443 66,866,453
(54,054,952) (74,956,327)
(1,785,655,917) (861,951,063)
- -
- -
-
- -
- -
- -
(430,763,157) 425,972,736
461,017,179 35,044,443
30,254,022 461,017,179
As per our report of even date.
ÈÈÈÈÈÈÈÈ ÈÈÈÈÈÈÈÈÈ00È ÈÈÈÈÈÈÈÈÈÈPoshak Raj Paudel M. Ala Uddin Ahmad Madan Krishna Sharma
Financial controller Chief Executive Officer Partner
CSC & Co.
Chartered Accountants
American Life Insurance Company
Cash Flow Statement for the Period of 17 July, 2013 to 16 July, 2014
Particular
Cash Flow from Operating Activities
Re-insurance Premium Payment
Service Fee Paid
Re-insurance Commission Payments
Premium Income
Late Fee Income
Reinsurance Premium Income
Reinsurance Commission Income
Other Direct Income
Claim Recovered from Re-insurance
Agent Commission Payment
Surrender Claim Paid
Other Claim Paid
Medical Exam Fee Payments
Claim Paid
Maturity Claim paid
Partial Maturity Claim Paid
Closing Cash & Bank Balance
Decrease (Increase) in Equity Share Investment
Decrease (Increase) in Preference Share\debenture
Decrease (Increase) in Other Investment
Decrease (Increase) in Policy Loan
Dividend Received
Rent Income
Decrease (Increase) in Advance & Other Loans
Opening Cash & Bank Balance
Interest paid on Loan
Net Cash Flow from Investment Activities (B)
Net Cash Flow from the All Activities = A+B+C
Interest Received (Loan)
Other Indirect Income/Expenses
Interest Received (Investment)
Decrease/(Increase) in payable of lending
Management Expenses Paid
Income Tax Paid
Current Assets (increase)/ Decrease
Current Liabilities Increase / (Decrease)
Net Cash Flow from Operating Activities (A)
Cash flow from Investment Activities
Decrease (Increase) in FD of Bank & Financial Institutions
Decrease (Increase) in Other Deposit of Bank & Financial institutions
Decrease (Increase) in Fixed Assets
Decrease (Increase) in Government Securities
Net Cash Flow from Financial activities (C)
C Cash Flow from Financial Activities
Amount Received from Share
Dividend Paid
Decrease/(Increase) in Short Term Loan
Amount in NPR.
ParticularShare
Capital
Accumulated
profit/loss
Proposed
Bonus
Share
Capital
Reserve
Fund
Share
Premium
Special Reserve
Fund
Other Reserve &
Fund
Catastrophe
ReserveTotal Amount
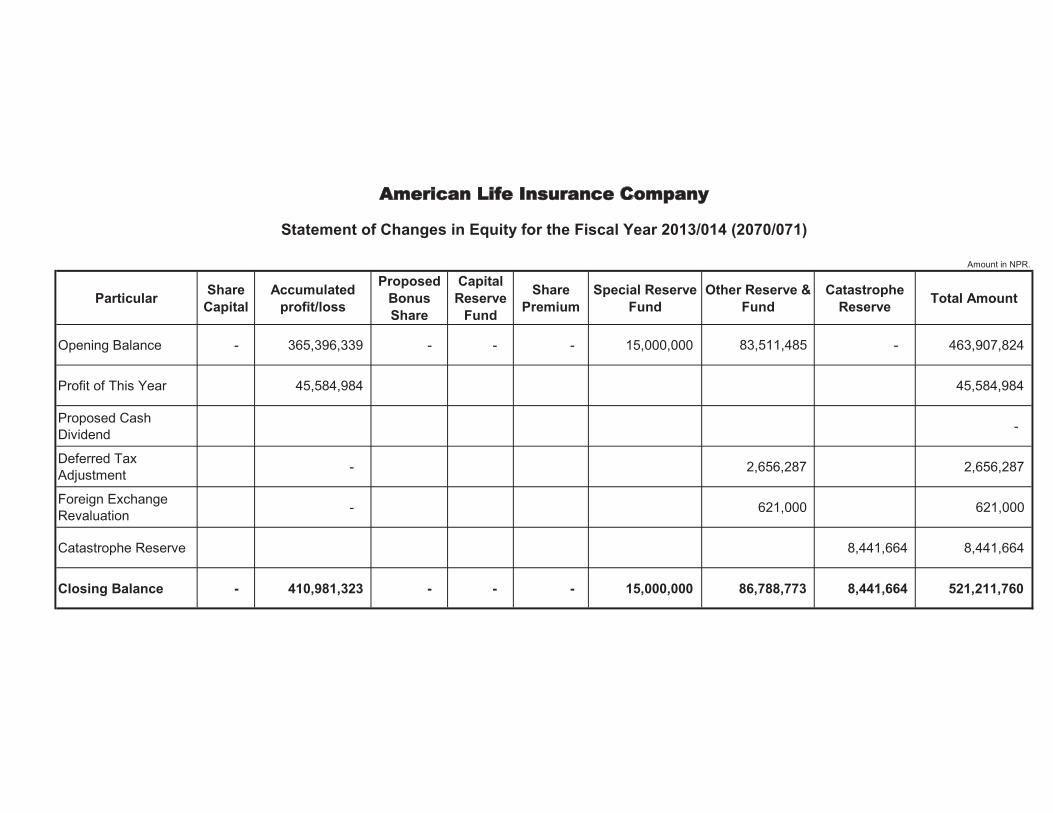
Opening Balance - 365,396,339 - - - 15,000,000 83,511,485 - 463,907,824
Profit of This Year 45,584,984 45,584,984
Proposed Cash
Dividend -
Deferred Tax
Adjustment - 2,656,287 2,656,287
Foreign Exchange
Revaluation - 621,000 621,000
Catastrophe Reserve 8,441,664 8,441,664
Closing Balance - 410,981,323 - - - 15,000,000 86,788,773 8,441,664 521,211,760
American Life Insurance Company
Statement of Changes in Equity for the Fiscal Year 2013/014 (2070/071)

Integral Parts of the Financial Statement are:
A. Insurance Premium (Net) Annexure- 1
Amount in NPR.
This Year Last Year This Year Last Year This Year Last Year
1 734,117,932 711,741,735 6,368,950 4,389,467 727,748,982 707,352,268
2 667,277,838 644,890,555 5,789,069 4,259,953 661,488,769 640,630,602
3 264,810,752 121,282,033 2,297,405 312,085 262,513,347 120,969,948
4 149,611,335 121,933,291 7,377,256 7,192,699 142,234,079 114,740,592
1,815,817,857 1,599,847,614 21,832,680 16,154,204 1,793,985,177 1,583,693,410
B. Gross Insurance Premium
This Year Last Year This Year Last Year This Year Last Year
1 734,117,932 711,741,735
- - 734,117,932 711,741,735
2 667,277,838 644,890,555 667,277,838 644,890,555
3 264,810,752 121,282,033
- 264,810,752 121,282,033
4 149,611,335 121,933,291
- - 149,611,335 121,933,291
1,815,817,857 1,599,847,614 - - 1,815,817,857 1,599,847,614
C. Direct Insurance Premium
This Year Last Year This Year Last Year This Year Last Year This Year Last Year
1Three Payment Plan
14,526,360 13,149,024 719,591,572 698,592,711 - - 734,117,932 711,741,735
2 Endowment 27,455,012 26,860,233 639,822,826 618,030,322 667,277,838 644,890,555
3 Future Care-DPS 165,695,242 109,160,361 99,115,510 12,121,672 - - 264,810,752 121,282,033
4 Term Insurance 36,471,236 29,742,542 25,332,138 20,848,989 87,807,961 71,341,760 149,611,335 121,933,291
244,147,850 178,912,160 1,483,862,046 1,349,593,694 87,807,961 71,341,760 1,815,817,857 1,599,847,614
Single Insurance Premium Total Direct Insurance Premium
Total
Renewal Insurance Premium
SN Type of Insurance
Term Insurance
Total
SN Type of InsuranceFirst Year Insurance Premium
Gross Insurance Premium RI Premium Paid (Ceded) Insurance Premium (net)
Future Care -DPS
Endowment
Future Care -DPS
Term Insurance ( Non-par Insurance)
Total
SN Type of InsuranceDirect Insurance Premium
Received Re-insurance
Premium (Accepted)Gross Insurance Premium
Three Payment Plan
Endowment
Three Payment Plan

Income from Investment, Loan & Other Sources Annexure - 2Amount in NPR.
SN This Year Last Year
1 380,193,530 407,192,146
2 220,270,126 167,112,994
3
4
5
6
7
8
9
10 -
153,189 363,608
15,721 14,445
11
12 5,719,608 3,557,247
13 -
-
14 - -
(54,054,952) (64,980,952)
15 165,000 193,008
- -
16
17 -
18 -
552,462,222 513,452,496
1 22,327,282 7,241,228
2 195,406,162 209,703,729
3 302,146,254 280,259,573
4 19,308,903 6,211,941
5 13,273,621 10,036,024
552,462,222 513,452,495
Policy Loan and Interest Income Annexure - 3
Amount in NPR.
This Year Last Year This Year Last Year
1 Three Payment Plan 401,872,180 328,934,485 48,939,077 39,799,461
2 Endowment 222,556,037 226,376,403 27,102,366 27,066,992
3 Future Care -DPS
4 Term Insurance - - - -
624,428,217 555,310,888 76,041,443 66,866,453
Income from Financial Institutions' Fixed Deposit (FD)
Particular
Income from Government & Secured Government securities
Income from Commercial Bank's Fixed Deposit (FD)
Income from Development Bank's Fixed Deposit (FD)
Income from Citizen Investment Trust Scheme
Dividend from Housing Development Company's Equity Share
Dividend from Other Public Company's Equity Share
Less: Loss on (Purchase) Investment.
b. Policy Charges & Misc.
Income from Loan
Income from Other Deposit (Except FD)
Profit on Sales of Investment
Dividend from Bank & Financial Institution's Preference Share
Income from Bank & Financial Institution's Debenture
Other Income
Less: Loss on Sales of Fixed Assets
SN Type of Insurance Policy Loan Interest Income on Policy Loan
Total
Transfer to DPS Insurance Revenue Account
Appropriation of Income from Investment, Loan & Other Source
a. Foreign Currency Exchange Revaluation Gain/Loss
Account Written Off
Income Related to Last year
Transfer to Term Insurance Revenue Account
Total
Transfer to Three Payment Plan Revenue Account
Profit on Sales of Fixed Assets
Less: Loss on Sale of Investment
Profit on (Purchase) Investment.
Other Income
Total
Transfer to Endowment Revenue Account
Transfer to Profit & Loss Accounts

Annexure - 4
Amount in NPR.
This Year Last Year This Year Last Year This Year Last Year This Year Last Year This Year Last Year This Year Last Year This Year Last Year This Year Last Year
1 9,967,977 11,991,556 106,312,914 14,186,971 469,718,422 298,790,763 104,141,609 84,175,458 - - 690,140,922 409,144,748 5,483,338 264,526 684,657,584 408,880,222
2 9,160,000 1,774,780 - - 18,651,000 77,659,122 99,747,957 - - 86,819,122 120,173,738 - - 86,819,122 120,173,738
3 5,080,000 540,000 3,987,546 4,701,890 9,067,546 5,241,890 9,067,546 5,241,890
4 26,567,797 30,783,092 - - - - 1,178,906 1,114,242 27,746,703 31,897,334 1,300,000 4,932,558 26,446,703 26,964,776
50,775,774 45,089,428 106,312,914 14,186,971 469,718,422 317,441,763 185,788,277 188,625,305 1,178,906 1,114,242 813,774,293 566,457,709 6,783,338 5,197,084 806,990,955 561,260,625
SN Type of Insurance
Death Claim Paid Maturity Claim Paid
Total
RI Portion in Claim Paid
Term Insurance
Claim Paid (net)
Three Payment Plan
Endowment
Surrender Claims Paid Total Claim PaidPartial Maturity Claim Paid Other Claim paid
Future Care DPS product
Claim Paid
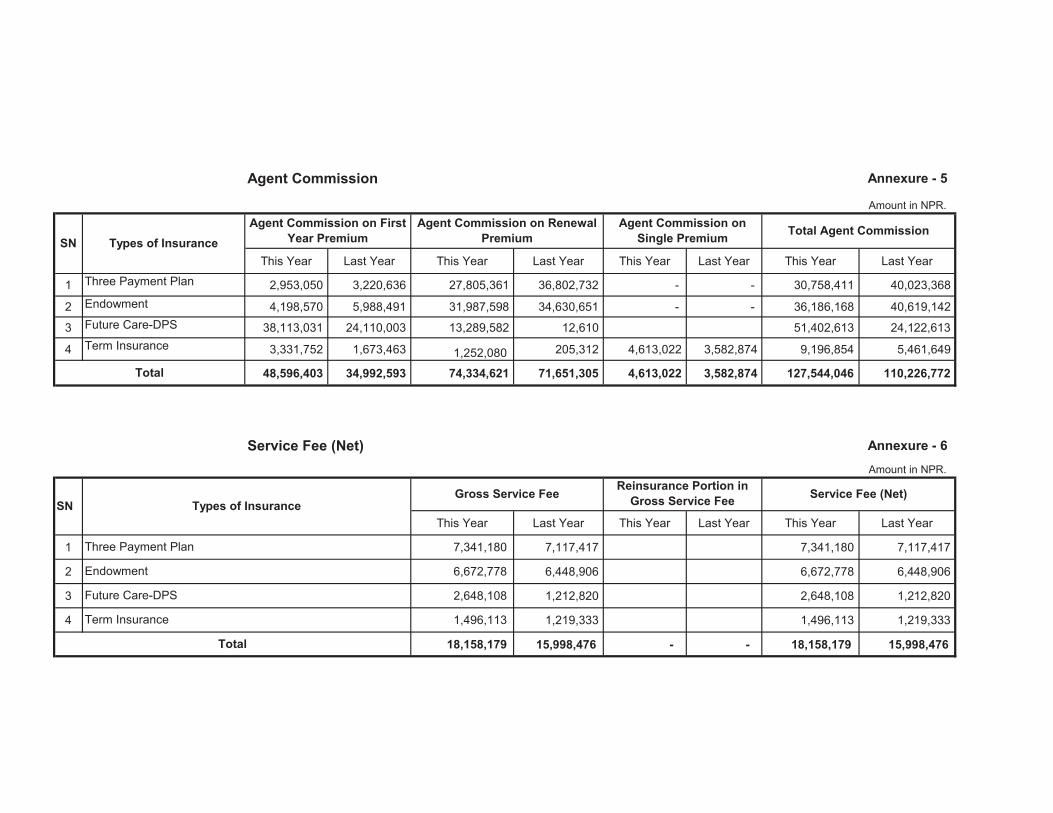
Agent Commission Annexure - 5
Amount in NPR.
This Year Last Year This Year Last Year This Year Last Year This Year Last Year
1 Three Payment Plan 2,953,050 3,220,636 27,805,361 36,802,732 - - 30,758,411 40,023,368
2 Endowment 4,198,570 5,988,491 31,987,598 34,630,651 - - 36,186,168 40,619,142
3 Future Care-DPS 38,113,031 24,110,003 13,289,582 12,610 51,402,613 24,122,613
4 Term Insurance 3,331,752 1,673,463 1,252,080 205,312 4,613,022 3,582,874 9,196,854 5,461,649
48,596,403 34,992,593 74,334,621 71,651,305 4,613,022 3,582,874 127,544,046 110,226,772
Service Fee (Net) Annexure - 6
Amount in NPR.
This Year Last Year This Year Last Year This Year Last Year
1 7,341,180 7,117,417 7,341,180 7,117,417
2 6,672,778 6,448,906 6,672,778 6,448,906
3 2,648,108 1,212,820 2,648,108 1,212,820
4 1,496,113 1,219,333 1,496,113 1,219,333
18,158,179 15,998,476 - - 18,158,179 15,998,476
Service Fee (Net)
SN Types of Insurance
Agent Commission on First
Year Premium
Agent Commission on Renewal
Premium
Agent Commission on
Single Premium
Total
SN Types of InsuranceGross Service Fee
Reinsurance Portion in
Gross Service Fee
Three Payment Plan
Endowment
Term Insurance
Total
Future Care-DPS
Total Agent Commission

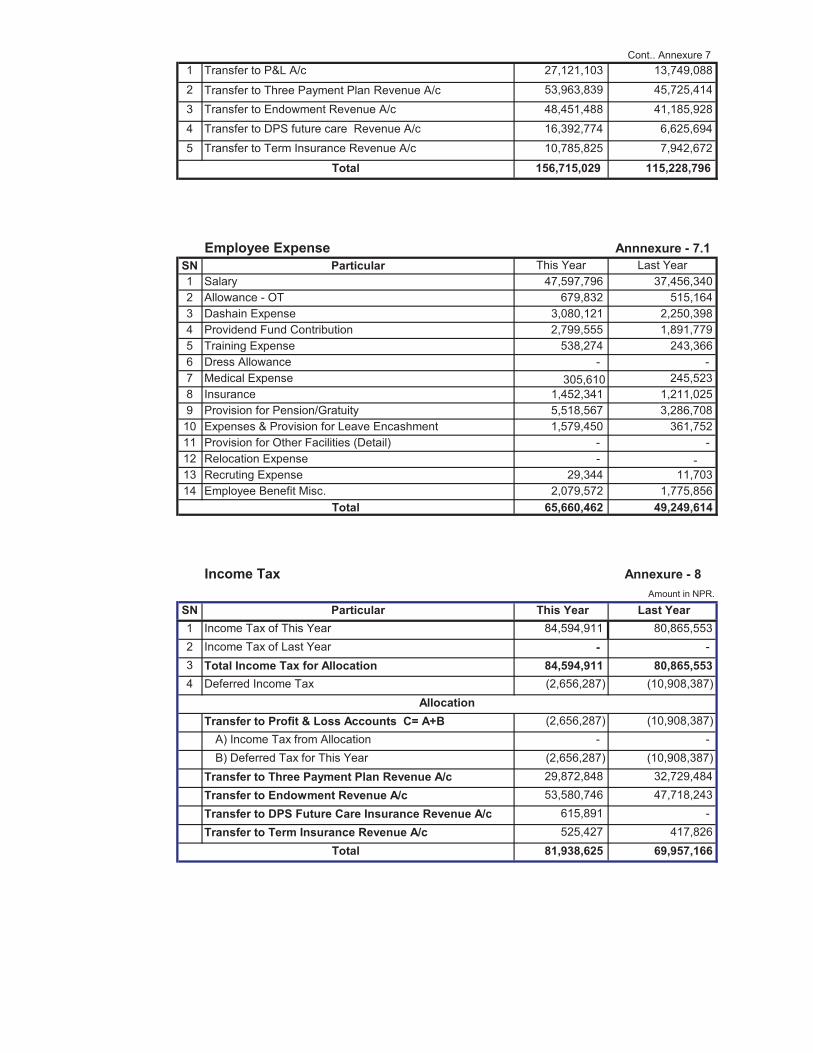
Management Expenses Annexure - 7Amount in NPR.
SN Particular This Year Last Year
1 Employee Expenses (Anx 7.1) 65,660,462 49,249,614
2 Building Rent 16,623,710 14,919,246
3 Water & Electricity 3,573,483 3,249,410
Repair & Maintenance - -
A. Building - -
B. Motor Vehicle - -
C. Office Equipment 1,646,616 1,989,066
D. Others 675,701 278,149
5 Communication 5,055,920 4,561,441
6 Printing & Stationary 5,568,058 3,507,886
7 Office Expenses 293,528 384,503
8 Transportation 3,019,855 2,410,540
Travel Expenses (Including Allowance)
A. Internal 1,303,006 1,218,949
B. International 1,892,946 1,269,669
10 Agents Training 7,797,357 3,933,549
11 Agents Other 22,062,431 12,960,938
12 Insurance Premium 943,091 938,431
13 Security Expenses 13,859,874 9,347,814
14 Legal & Advisory Fees 252,909 231,876
15 Books & Periodicals
16 Advertisement & Promotion
17 Business Promotion
18 Guest Entertainments - -
19 Donation & Awards - 400,000
Board Committee Expenses
A. Meeting Allowance
B. Others
Other Committee/Sub-Committee Expenses
A. Meeting Allowance
B. Others
22 General Meeting Related Expenses
23 A. Actuarial Service Fee
B. Actuarial Expenses
Audit Related Expense
A. Audit Fee 271,250 255,000
B. Tax Audit Fee 48,000 48,000
C. Long Form Audit Report Fee 22,000 22,000
D. Other Fee
E. Internal Audit Fee 794,940 -
F. Other Expense
25 Interest
26 Bank Charge 1,279,668 1,063,928
27 Fee & Charges 55,000 55,000
28 Depreciation 3,360,384 2,689,713
29 Postal Stamps 260,000 230,000
30 Integration and Separation - -
31 Other 394,840 14,074
156,715,029 115,228,796
4
9
20
21
24
Total for Appropriation
Cont.. Annexure 7
1 Transfer to P&L A/c 27,121,103 13,749,088
2 Transfer to Three Payment Plan Revenue A/c 53,963,839 45,725,414
3 Transfer to Endowment Revenue A/c 48,451,488 41,185,928
4 Transfer to DPS future care Revenue A/c 16,392,774 6,625,694
5 Transfer to Term Insurance Revenue A/c 10,785,825 7,942,672
156,715,029 115,228,796
Employee Expense Annnexure - 7.1
SN Particular This Year Last Year
1 Salary 47,597,796 37,456,340
2 Allowance - OT 679,832 515,164
3 Dashain Expense 3,080,121 2,250,398
4 Providend Fund Contribution 2,799,555 1,891,779
5 Training Expense 538,274 243,366
6 Dress Allowance - -
7 Medical Expense 305,610 245,523
8 Insurance 1,452,341 1,211,025
9 Provision for Pension/Gratuity 5,518,567 3,286,708
10 Expenses & Provision for Leave Encashment 1,579,450 361,752
11 Provision for Other Facilities (Detail) - -
12 Relocation Expense - -
13 Recruting Expense 29,344 11,703
14 Employee Benefit Misc. 2,079,572 1,775,856
65,660,462 49,249,614
Income Tax Annexure - 8
Amount in NPR.
SN Particular This Year Last Year
1 Income Tax of This Year 84,594,911 80,865,553
2 Income Tax of Last Year - -
3 Total Income Tax for Allocation 84,594,911 80,865,553
4 Deferred Income Tax (2,656,287) (10,908,387)
Transfer to Profit & Loss Accounts C= A+B (2,656,287) (10,908,387)
A) Income Tax from Allocation - -
B) Deferred Tax for This Year (2,656,287) (10,908,387)
Transfer to Three Payment Plan Revenue A/c 29,872,848 32,729,484
Transfer to Endowment Revenue A/c 53,580,746 47,718,243
Transfer to DPS Future Care Insurance Revenue A/c 615,891 -
Transfer to Term Insurance Revenue A/c 525,427 417,826
81,938,625 69,957,166
Allocation
Total
Total
Total
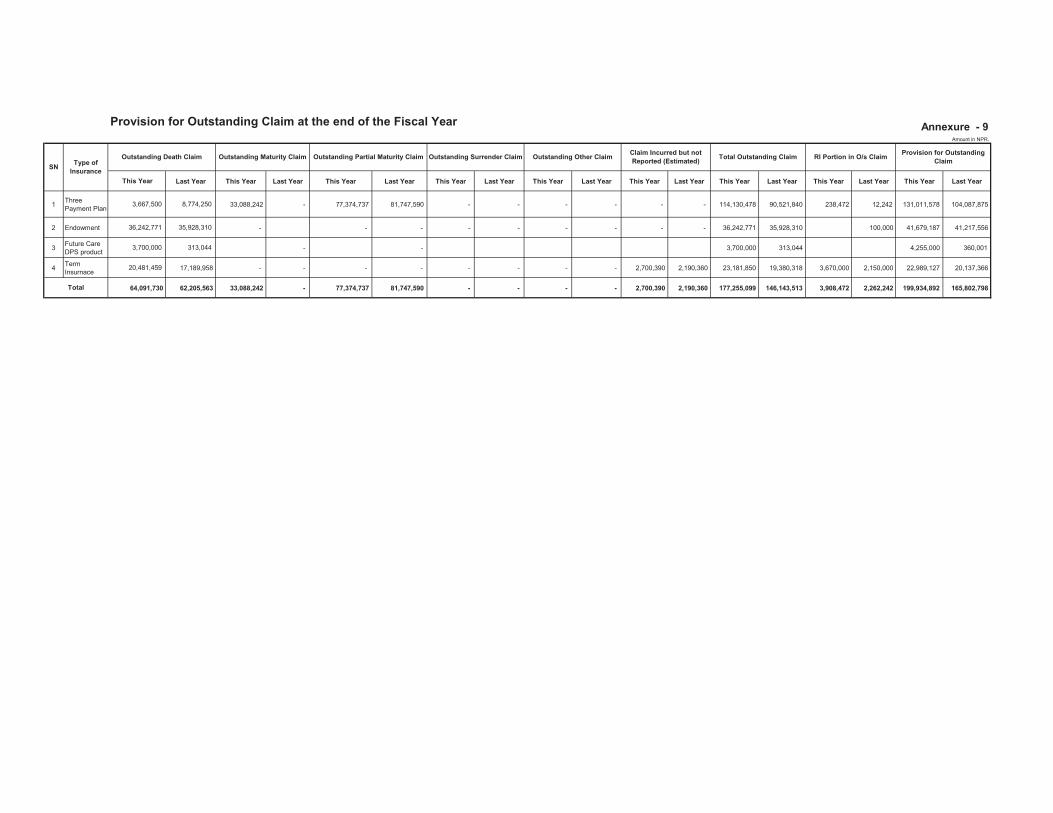
Provision for Outstanding Claim at the end of the Fiscal Year
This Year Last Year This Year Last Year This Year Last Year This Year Last Year This Year Last Year This Year Last Year This Year Last Year This Year Last Year This Year Last Year
1Three
Payment Plan3,667,500 8,774,250 33,088,242 - 77,374,737 81,747,590 - - - - - - 114,130,478 90,521,840 238,472 12,242 131,011,578 104,087,875
2 Endowment 36,242,771 35,928,310 - - - - - - - - - 36,242,771 35,928,310 100,000 41,679,187 41,217,556
3Future Care
DPS product3,700,000 313,044 - - 3,700,000 313,044 4,255,000 360,001
4Term
Insurnace20,481,459 17,189,958 - - - - - - - - 2,700,390 2,190,360 23,181,850 19,380,318 3,670,000 2,150,000 22,989,127 20,137,366
64,091,730 62,205,563 33,088,242 - 77,374,737 81,747,590 - - - - 2,700,390 2,190,360 177,255,099 146,143,513 3,908,472 2,262,242 199,934,892 165,802,798
Annexure - 9Amount in NPR.
SNType of
Insurance
Outstanding Death Claim Outstanding Maturity Claim Outstanding Partial Maturity Claim
Total
Outstanding Surrender Claim Outstanding Other ClaimClaim Incurred but not
Reported (Estimated)Total Outstanding Claim RI Portion in O/s Claim
Provision for Outstanding
Claim

Amount Transferred from Revenue Accounts to P&L Account Annexure - 10Amount in NPR.
SN This Year Last Year
1 - -
2 - -
3 - -
4 74,037,392 56,039,380
74,037,392 56,039,380
Annexure -11
Life Insurance Fund Amount in NPR.
This Year Last Year This Year Last Year This Year Last Year This Year Last Year This Year Last Year This Year Last Year
1 3,187,817,276 3,020,787,009 144,039,662 424,442,204 - 314,287,233 3,646,144,171 3,445,229,213
2 4,181,293,585 3,809,459,251 765,436,157 696,451,820 - (314,287,233) 4,632,442,509 4,505,911,071
3 89,618,871 - 197,800,319 89,618,871 - - - 287,419,190 89,618,871
4 - - - - - - - - -
7,458,729,732 6,830,246,260 1,107,276,138 1,210,512,895 - - - - - - 8,566,005,870 8,040,759,155
Adjustment in Life Insurance Fund Amount in NPR.
This Year Last Year This Year Last Year This Year Last Year This Year Last Year This Year Last Year This Year Last Year This Year Last Year
1 Three Payment
Plan 3,646,144,171 3,445,229,213 13,288,600 257,411,937 105,258,806 3,738,114,377 3,187,817,276
2 Endowment 4,632,442,509 4,505,911,071 15,213,410 324,617,486 120,505,194 4,737,734,293 4,181,293,585
3 Future Care
DPS Insurance 287,419,190 89,618,871 - - - - 287,419,190 89,618,871
4 Term Insurance - - - -
8,566,005,870 8,040,759,155 28,502,010 582,029,423 - - - - - - 225,764,000 - 8,763,267,860 7,458,729,732 Total
Types of
Insurance
Life insurance Fund before
Adjustment (End of the Year)SN
Provision for BonusProvision for
Solvency Margin
Life Insurance Fund at the End of
YearTransfer to P&L Account Liabilities for Policies
Unallocated Amount
(Transfer from SH divided to
PH surplus)
Life Insurance Fund before
Adjustment (End of the Year)
Transferred from
Reserve A/cSN Types of Insurance
Life Insurance Fund before
Adjustment (Beginning of the
Year)
Life fund Adjustment to allign
with latest Policy Liability
Balance
Transferred from P&L
A/c
Transferred from Revenue
Accounts
Particular
Total
Transferred from Three Payment Plan Revenue Account
Transferred from Endowment Revenue Account
Transferred from Term Insurance Revenue Account Account
Transferred from Future Care DPS Insurance Revenue Account Account
Term Insurance
Three Payment Plan
Total
Endowment
Future Care DPS Insurance

Reversal of Provision Annexure - 12Amount in NPR.
SN This Year Last Year
1 - -
2
3
4
- -
Expense Written Off Annexure - 13Amount in NPR.
SN This Year Last Year
1 - -
2 - -
3 - -
4 - -
5 - -
6 - -
7 - -
- -
Share Expense Annexure- 13AAmount in NPR.
SN This Year Last Year
1 - -
2 - -
3 - -
4 - -
5 - -
- -
Others Expense Annexure - 14Amount in NPR.
SN This Year Last Year
1 - -
2 -
3 - -
- -
Provision for Loss Annexure - 15Amount in NPR.
SN This Year Last Year
1 - -
2 - -
3
4 - -
- - Total
Provision for Doubtful Debt
Provision for Loss on Investment
Particular
Reversal of Provision for Loss on Investment
Reversal of Loan loss Provision
Reversal of Provision for Doubtful Debt
Reversal Other Provision
Total
Investment Written off
Loan Written off
Dividend Distribution Expense
Debtors Written off
Particular
Preliminary Expense
Other Written off
Total
Pre-operating Expense
Deferred Expenditure
Others
Total
Other Provision
Share Publication Expense
Particular
Share Issue Expense
Share Registration Expense
Loan Loss Provision
Other Expense
Total
Particular
Particular
Fine and Penalty
Late Fee and Fine

A. Share Capital Annexure - 16
Amount in NPR.
SN This Year Last Year
- -
B. Ownership Structure of Share
No. of Equity
ShareOwnership %
No. of Equity
ShareOwnership %
Nepali Organizations
Nepali Citizens
Foreign
Details of one or more Percentage of Share Owner
Ownership % Amount Ownership % Amount
Particular
1 Authorized Capital
C0"ÈÈÈ000Gswkv{"Ujctgu"Yqtvj"Tu"ÈÈ"Gcej
D0"ÈÈÈÈPqp"Tgfggocdng"Rtghgttgf"Yqtvj"Tu"ÈÈ"Gcej
E0"ÈÈÈÈTgfggocdng"Rtghgttgf"Yqtvj"Tu"ÈÈ"Gcej
2 Issued Capital
C0"ÈÈÈ000Gswkv{"Ujctgu"Yqtvj"Tu"ÈÈ"Gcej
Shareholders
This Year
D0"ÈÈÈÈPqp"Tgfggocdng"Rtghgttgf"Yqtvj"Tu"ÈÈ"Gcej
E0"ÈÈÈÈTgfggocdng"Ttghgttgf"Yqtvj"Tu"ÈÈ"Gcej
Last Year
3 Paid-up Capital
C0"ÈÈÈ000Gswkv{"Ujctgu"Yqtvj"Tu"ÈÈ"Gcej
Nguu<"Tgegkxcdng"Rckf"wr"ÈÈ00"Ujctgu"yqtvj"ÈÈ0"
D0"ÈÈÈÈPqp"Tgfggocdng"Rtghgttgf"Yqtvj"Tu"ÈÈ"Gcej
E0"ÈÈÈÈTgfggocdng"Ttghgttgf"Yqtvj"Tu"ÈÈ"Gcej
Total
Pro
mo
ters
This Year Last Year
Total
Public
Other (Details)
Total
SN Particular

Reserve & Surplus Annexure - 17Amount in NPR.
SN This Year Last Year
1 20,617,773 17,961,485
2
3
4
66,171,000 65,550,000
15,000,000 15,000,000
365,396,339 38,132,941
5
6
7
8 45,584,984 327,263,398
512,770,096 463,907,824
Catastrophe Reserve Annexure - 18Amount in NPR.
Last Year This Year Last Year This Year Last Year
- 8,441,664 8,441,664 -
- -
- -
- -
8,441,664.00 -
Long Term Loan Payable Annexure - 19
Amount in NPR.
SN This Year Last Year
1 -
2 - -
3 - -
4
- - Total
Total
Particular
Debenture / Bond
Bank
Financial Institutions
Others
Catastrophe Reserve at the end of
the Year
This Year
-
Proposed Bonus Share
Remaining Bonus Share for Capitalization
Profit Transferred from P&L A/c
Total
Catastrophe Reserve at the
Beginning of the YearTransferred from P&L A/c
Special Reserve
Other Reserve
HO Fund
Contingency Reserve
Shareholder share of profit
Share Premium
Particular
Reserve for Deferred Tax
Capital Reserve

Annexure -20
Amount in NPR.
Opening
Balance
This Year
Addition
This Year
Less Total
Up to Last
Year This Year Sales /Adj. Total
Up to This
Year
Up to Last
Year
Land - - - - - - - - - -
Building - - - - - - - - - -
Furniture & Fixture 15,890,712 1,289,500 17,180,212 15,056,539 293,494 15,350,033 1,830,178 834,173
Office Equipments 4,809,596 817,800 5,627,395 3,918,576 390,330 (177,339) 4,131,567 1,495,829 891,020
Computer and EDP 36,986,394 436,299 37,422,693 36,010,410 531,000 36,541,410 881,283 975,984
Intangible Assets 1,085,347 1,085,347 1,085,347 1,085,347 - -
Auto Mobiles 14,602,315 8,649,500 528,898 22,722,917 11,413,972 1,087,764 528,898 13,030,635 9,692,282 3,188,343
Lease Hold Assets 3,021,860 - 3,021,860 3,021,860 - - 3,021,860 - -
Others 335,405 - 335,405 158,066 177,339 335,405 - 177,339
Total 76,731,629 11,193,098 528,898 87,395,830 70,664,771 2,302,588 528,898 73,496,257 13,899,572 6,066,858
Capital Expenditure -WIP - - - - - - - - - -
Grand Total 76,731,629 11,193,098 528,898 87,395,830 70,664,771 2,302,588 528,898 73,496,257 13,899,572 6,066,858
Last Year 76,299,837 1,203,792 (772,000) 76,731,629 68,746,905 2,689,866 (772,000) 70,664,771 6,083,208 7,552,933
Particular
Cost Depreciation Deduction
Fixed Assets
Net Price

Investment Annexure -21Amount in NPR.
SN This Year Last Year
a.
1 2,574,647,036 3,636,847,029
2
3 - -
4 - -
5 - -
6 - -
7 - -
8 - -
9 - -
2,574,647,036 3,636,847,029
b.
1 1,351,875,000 990,700,000
2 5,084,587,454 2,747,468,957
3
4 - -
5 - -
6 - -
7 - -
8 - -
9 - -
10 - -
6,436,462,454 3,738,168,957
9,011,109,490 7,375,015,986
Share Investment Annexure - 21.1
SN CompanyNet
Value
Par
ValueCost Price Market Value
1 È000"Eqorcpkgu"00È"pq"qh"Ujctg"B0000 -
-
- - - -
Cash & Bank Balance Annexure - 22Amount in NPR.
SN This Year Last Year
54,000 55,500
54,000 55,500
30,200,022 460,961,679
- -
- -
- -
30,200,022 460,961,679
30,254,022 461,017,179
Total
Interest Earning other Deposit with Development Bank
Interest Earning other Deposit with Financial Institute
Fixed deposit with Financial Institution
Equity Share of Housing Company
Particular
Long Term Investment :
Government Securities
Fixed Deposit with Commercial Bank
Fixed Deposit with Development Bank
Citizen Investment Plan
Other Interest Earning Investments
Total
G. Total
Equity Share of other Company
Debenture & Preference Share of Bank and Financial Institution
Citizen Investment Plan
Fixed deposit with Financial Institute
Other
Total
Short Term Investment
Government Security
Debenture/Pref. Share of Banks & Financial Institute
Interest Earning other Deposit with Commercial Bank
Fixed Deposit with Commercial Bank
Fixed Deposit with Development Bank
1
2 Bank Balance
Total
G. Total
Commercial Banks Balance
Development Banks Balance
Particular
Cash Balance
Cash
Total
Finance Companies Balance
Other

Other Loan Annexure -23Amount in NPR.
SN This Year Last Year
A.
1 92,519 166,477
2 -
3
92,519 166,477
B.
1 -
2 -
3 -
- -
Other Assets Annexure - 24Amount in NPR.
SN Particular This Year Last Year
1 Receivable income from Investment 63,393,872 65,656,350
2 Receivable Interest from Policy Loan 27,709,321 24,713,377
3 - -
4 Receivable from other Insurer
5 Receivable from Re-insurer 1,071,052 2,356,052
6 Sundry Debtors 970,120 -
7 Pre-payments 1,575,705 1,454,660
8 Staff Advance 8,060,635 5,977,421
9 Other Advance
10 Deposit - -
Receivable Insurance Premium - -
- -
12 Other - a. Gratuity Deposit at CIT office 20,466,356 15,013,789
b. Advance Tax Deposited 150,451,298 128,462,273
C. Deferred Tax 20,617,773 17,961,485
294,316,131 261,595,408
Current Liabilities Annexure - 25Amount in NPR.
SN Particular This Year Last Year
1 Payable to Agents 19,702,434 12,862,067
2 Payable to other Insurer
3 Payable to Re-insurer 4,056,076 3,896,277
4 Short Term Lending
5 Premium Deposit 723,222 848,332
6 Premium Deposit without Full Details4,234,288 3,403,589
7 Sundry Creditors 2,481,306 285,100
8 Payable to Holding/Subsidiary Companies - -
9 Payable Withholding Tax 2,894,968 1,047,840
10 Payable VAT
11 Payable Service Fee 18,158,179 15,998,476
12 Payable to Staff 3,476,865 2,822,926
13 Payable to Management
14 Dividend Payable
15 Other
a. Outstanding Cheques 117,154,834 127,733,869
172,882,172 168,898,476
Total
Total
Receivable Interest from other Loan (except Policy Loan)
11
Less: Suspense Receivable Insurance Premium
Total
Total
Short Term Loan
Agent Loan
Employee Loan
Other
Particular
Long Term Loan
Agent Loan
Employee Loan
Other

Provision for Unexpired Risk Annexure - 26Amount in NPR.
SN Particular This Year Last Year
1 - -
2 - -
3Unexpired Risk Reserve for Future Care-DPS
Insurance -
4 104,186,000 72,277,374
104,186,000 72,277,374 Total
Unexpired Risk Reserve for Three Payment Plan Insurance
Unexpired Risk Reserve for Endowment Insurance
Unexpired Risk Reserve for Term Insurance

Annexure - 26 AAmount in NPR.
Particular
This Year Last Year This Year Last Year This Year Last Year This Year Last Year This Year Last Year
1 Provision for Dividend 243,597,559 - 30,389,989 218,175,598 - - (225,764,000) 25,421,961 48,223,548 243,597,559
2 Provision for Income Tax 80,865,553 94,447,722 84,594,911 80,865,553 80,865,553 94,447,722 - 84,594,911 80,865,553
3 Provision for Loss on Investment - - - - - -
4 Provision for Loss on Debt - - - -
5 Provision for Doubtful Debtor - - - -
6 Provision for Other Loss - - - -
7 Provision for Staffs - - - -
Provision for Gratuity 14,367,274 12,377,101 5,937,580 3,286,708 419,013 1,296,535 - 19,885,841 14,367,274
Provision for Leave Encashment 2,276,017 2,052,622 2,026,260 361,752 223,395 138,357 4,078,882 2,276,017
Provision for Housing fund 42,181,517 10,603,470 4,887,280 31,578,047 - - 47,068,797 42,181,517
Provision for Staff Bonus 54,543,900 2,488,213 8,441,664 54,543,900 2,488,213 62,985,564 54,543,900
Others - - - -
8 Other Provision - - - -
437,831,820 121,969,128 136,277,684 388,811,558 81,507,961 98,370,827 (225,764,000) 25,421,961 266,837,543 437,831,820
Other Provision
Total
Adjustment of Provision
during the Fiscal Year
Provision at the End of This
YearS.N.Opening Provision
Additional Provision during
the Fiscal Year
Written Off / Payment during
the Fiscal Year

Other Expenses Balance for Written off / Adjustment Annxure- 27
Amount in NPR.
SN Particular This Year Last Year
1
2
3 54,220,276 108,275,228
4
5
54,220,276 108,275,228
Others
Total
Balance Preliminary Expenses for Written off
Balance Pre-operating Expenses for Written off
Balance Investment Premium for Written off
Balance Deferred Expenses for Written off

Annexure Î 28
Significant Accounting Policies on Financial statements
American Life Insurance Company is incorporated under the laws of the United States of America.
The company commenced life insurance business as a branch in Nepal from the year 2002 AD under
the license granted by the Insurance Board. The Nepal branch was registered as a branch of foreign
company in 2006 AD under the Company Ordinance, 2006 AD.
1. Basis of financial statements presentation
Basis of Preparation
The financial statements are prepared in accordance with generally accepted accounting practices in
Nepal, the Insurance Act, 2049 BS, the Insurance Regulations 2049 BS and guidelines issued by the
Insurance Board and unless otherwise stated, is based on historical cost convention and accrual basis
of accounting. The financial statements present transactions of Nepal branch only.
Use of Estimates
The preparation of the financial statements in conformity with Nepal accounting standard requires the
management to make estimates and assumptions that affect the reported amounts of assets and
liabilities at the date of balance sheet. Actual amount could differ from those estimates. Any
differences from those estimates are recorded in the period in which they are identified.
Comparative Information
The accounting policies have been consistently applied by the company and are consistent with those
used in the previous year, except otherwise stated. Previous year figures in some headings have been
regrouped or rearranged wherever necessary to facilitate comparison only.
2. Fixed Assets
Fixed assets are stated on historical cost less accumulated depreciation. Original cost includes all
expenses incurred up to commissioning/putting the assets in use.
3. Depreciation
Fixed assets are depreciated using straight line method at the rates prescribed by schedule 2 of
Income Tax Act, 2058.
4. Non Capitalized Items
Non consumable items normally having life less than one year and/or costing less than NPR. 5,000 is
expensed off during the year of purchase.

5. Provision for Income tax & its appropriation
a. Current Tax
Provisions for taxes have been made in accordance with Income Tax Act 2058 and amendments
thereto. Provisions for taxes have been apportioned to revenue accounts in accordance with the
directive of Insurance Board.
b. Deferred Tax
Deferred tax assets and liabilities are recognized for the future tax consequences attributable to
differences between the financial statement carrying amounts of existing assets and liabilities, and
their respective tax bases using the asset and liability method. Deferred tax has been calculated as per
the method prescribed by Nepal Accounting Standards Î 9
Deferred tax assets and liabilities are measured using enacted tax rates expected to apply to taxable
income in the years in which those temporary differences are expected to be recovered or settled. The
effect of changes in tax rates on deferred tax assets and liabilities is recognized as income in the
period that covers the enactment date.
Deferred tax assets arising from the temporary differences and unused tax losses are recognized to
the extent there is virtual certainty that sufficient future taxable income will be available against
which such deferred tax assets can be realized.
Deferred tax related to temporary differences in opening balances is adjusted directly with Life
Insurance Fund and subsequent year differences are recognized in the Profit & Loss Account and
Revenue Accounts the basis of weightage as prescribed by the Insurance Board.
6. Accounting of Investment
All investments are made within guidelines of investment directive and valued as per financial
directive issued by Insurance Board as follows:
Investment made in government securities, development bonds and debentures secured by Nepal
governments are valued for accounting based on cost or face value whichever is lower. The premium
(i.e. excess amount over face value) paid on government securities are amortized cu" ÐDeferred
GzrgpfkvwtgÑ"over the period of their maturity on pro-rata basis. When the government securities are
purchased in discount, difference amount on face value of securities are coqtvk¦gf" cu" ÐKpeqog"qp"kpxguvogpvÑ" qxgt" vjg" rgtkqf" qh" vjgkt"ocvwtkv{" qp" rtq-rata basis. Investments in fixed deposit with
banks are valued at cost.
7. Accounting of foreign exchange transactions
Assets and liabilities in foreign currency at the end of fiscal year are converted using selling rate into
Nepalese Rupees. Transactions in foreign currency are accounted for at the exchange rates prevailing
on the date of the transactions. Receivable or payable in foreign current at the end of fiscal year is
computed using the rate prevailing on the year end date and foreign exchange revaluation difference
is shown in profit and loss accounts.

8. Accounting of premium income
a. Gross premium income is recognized on cash basis in accordance with the Insurance Regulations &
financial directives that is not consistent with Nepal Accounting Standard which requires revenue to
be recognized on an accrual basis. Cash received in advance is recognized as premium income during
the period to which they relate.
b. Entire single premium income is recognized on cash basis and unexpired risk reserve is booked as per
financial directive issued by the Insurance Board.
9. Re-insurance commission
Re-insurance commission income is recognized on accrual basis in accordance with the re-insurance
agreements.
10. Accounting & allocation of other revenue
All other revenues except late fees on overdue premium are recognized on accrual basis as per Nepal
Accounting Standard and allocated as per financial directive issued by the Insurance Board.
11. Accounting of Policy Loan
Policy loans are valued at cost plus capitalized interest at the time of anniversary of the policy.
12. Management expenses
Management expenses are allocated as per financial directive issued by Insurance Board. 10% of the
management expenses are directly charged to Profit & Loss account and balance expenses is
appropriated in to the respective revenue accounts as per the directives.
13. Accounting policy for the payment of insurance Claim expenses
Claim expenses are accounted for the amount payable to the policy holder in accordance with the
terms of the insurance policy along with the expenses directly attributable thereon for claim
settlement. However, claim expenses related to vjg"eqorcp{Ós representative or staffs is not included.
14. Provision for outstanding insurance claim
As per Insurance Act 2049 section 15 (d), provision for outstanding claim is made at 115% of the
total outstanding claim. Incurred But Not Reported (IBNR) claims have been booked on actual basis
of claim intimated till balance sheet date in accordance with the directive of Insurance Board, Nepal
Ceeqwpvkpi"Uvcpfctfu"27"qp"ÐGxgpvu"chvgt"vjg"Dcncpeg"Ujggv"FcvgÑ"and as per company practice.
15. Allocation of surplus on insurance business
Surplus arising from insurance businesses is allocated as follows in accordance with the directives of
the Insurance Board:
a. All the surpluses arising from participating insurance business revenue accounts (including a
non-par products future care ÎDPS) are transferred to Life Insurance Fund for actuarial valuation.
Accumulated life fund are re-allocated on the basis of mathematical reserve, other
reserve/provisions and cost of bonus ratio of last submitted valuation report to align with latest
policy liabilities balance.

b. All the surplus arising from non-participating insurance business revenue account is transferred
to Profit & Loss Account.
c. The Company received approval of its actuarial valuation report for 2013/14 on 29 December
42370" UjctgjqnfgtuÓ" rqtvkqp" qh" Rtqhkv" *chvgt" fgfwevkqp" hqt" gornq{gg" jqwukpi" hwpf" cpf" rtqhkv"bonus) for 2013/14 arising from the actuarial valuation together with Profits from non-
participating portfolio for 2013/14 amount to NPR. 84,416,637.
Insurance Board in its letter Bi.Bi.Sha 239/ (2071/72) dispatch no 3087 dated 2 April 2015,
advised the company to create catastrophic reserve equal to 10% of amount available for
appropriation. Accordingly NPR.8,441,664 has been transferred to catastrophic reserve account
leaving net NPR 75,974,973 available for reserve and cash dividend.
Insurance Board, in its letter no. Bi. Bi.Sha.490 (2070/71) dispatch no. 4585, dated 26 May 2014,
advised the Company to show a maximum 40% of the Profit as per the Profit and Loss account
under Proposed Cash Dividend. Accordingly, NPR 30,389,989 representing 40% of total
UjctgjqnfgtuÓ" rqtvkqp" *PRT" 97.;96.;95+" jcu" dggp" ujqyp" cu" ÒRtqrqugf"Ecuj"FkxkfgpfÓ" kp" vjg"Rtqhkv" cpf"Nquu"Ceeqwpv" cpf" cu" ÒRtqxkukqp" hqt"FkxkfgpfÓ" wpfgt" ÒQvjgt"Rtqxkukqp" *Cppgzwtg" Î48C+Ó" kp" vjg" Dcncpeg" Ujggv." yjkej" yknn" dg" cxckncdng" hqt" tgokvvcpeg" vq" Jgcf" Qhhkeg" qh" vjg"Company subject to necessary regulatory approval.
The remainipi"dcncpeg"qh"UjctgjqnfgtuÓ"rqtvkqp"qh"rtqhkv" k0g0"PRT0"67.7:6.;:6"jcu"dggp"ujqyp"wpfgt"ÒTgugtxg"cpf"UwtrnwuÓ"kp"Dcncpeg"Ujggv0
NPR. 225,764,000 has been transferred from Provision for Dividend to Policyholders' surplus as
a result of restatement of shareholder surplus related to 2012/13 and reflected in actuarial
valuation report of 2013/14 which has been approved by Insurance Board on 29 Dec 2015.
16. Provision for employee gratuity, leave and other facility accounting policy
Provision for gratuity, leave encashment and other benefits payable to employees as per the employee
service rule of the Company is accounted for on accrual basis in accordance with the Nepal
Accounting Standards. Contributions to approved retirement fund are made on a regular basis as per
the Retirement Fund rules and regulations.
17. Doubtful debt provision:
CompanyÓu"ocpcigogpv is applying appropriate policy for doubtful debt provision.
18. Amortization of Expenses
Expenses incurred on improvement of leasehold property are amortized over the life of the lease or
within 5 years of improvement whichever is shorter on straight line basis. Investment purchased in
premium amount is amortized as per Insurance Board financial directive over the period of
investment.
19. Provision of Housing Fund and Staff Bonus
Company has created provision for housing fund and staff bonus as per the provisions of Labour Act,
2048 and the Bonus Act 2030 respectively. Accumulated balance of housing fund stood at NPR.
47,068,797 as of 16 July 2014.

Annexure Î 29
Notes to Accounts on financial statements
1. Contingent Liabilities
a. Outstanding for settlement of investment : None
b. Underwriting Commitments: None
c. Not accepted/denied non insurance litigation/claim to the company: None
d. Guarantees issued by insurer or on behalf of insurer: None
e. Other Liabilities (Give details):None
2. Dcuku"vcmgp"d{"cevwct{"hqt"kpuwtgtÓu"nkcdknkvkgu"xcnwcvkqp.
The recent most actuarial valuation of Par Life Fund was carried out for 2013/014 following on Gross
Premium Method which was based on Nepali mortality table published by Insurance Board (unless
otherwise mentioned) at 5.75 % level discount rate. For non-par fund, reserve is based on unearned
premium Reserve. Reserve is kept for Incurred But Not Reported (IBNR) claims as well.
3. The Company does not have any limitation and disputes on its assets.
4. The Company does not have any commitments on Loan, Investment and Fixed Assets.
5. Value of investment pursuant to sales / purchase agreements:
a. Ownership not obtained for purchased Assets: None
b. Payment not received for sale of assets: None

6. Details of investment, sales/refund received of investment during the year with name of
organization, date, quantity and amount:
S.N Name Qty Face Value S.N Name Qty Face Value
1 Nabil Bank Ltd. Fixed Deposit 1-Aug-13 1 97,000,000 1 Nabil Bank Ltd. Fixed Deposit 1-Aug-13 1 97,000,000
2 Nabil Bank Ltd. Fixed Deposit 2-May-14 1 100,000,000 2 Nabil Bank Ltd. Fixed Deposit 22-Aug-13 1 27,000,000
3 Nabil Bank Ltd. Fixed Deposit 12-Jul-14 1 142,400,000 3 Nabil Bank Ltd. Fixed Deposit 27-Mar-14 1 136,700,000
4 Nabil Bank Ltd. Fixed Deposit 14-Jul-14 1 25,000,000 4 Nabil Bank Ltd. Fixed Deposit 7-Jul-14 1 92,000,000
5 Nepal Investment Bank Fixed Deposit 28-Jul-13 1 12,000,000 5 Nabil Bank Ltd. Fixed Deposit 12-Jul-14 1 142,400,000
6 Nepal Investment Bank Fixed Deposit 19-Jan-14 1 250,000,000 6 Nabil Bank Ltd. Fixed Deposit 14-Jul-14 1 25,000,000
7 Nepal Investment Bank Fixed Deposit 9-Feb-14 1 150,000,000 7 Nepal Investment Bank Fixed Deposit 27-Jul-13 1 12,000,000
8 Nepal Investment Bank Fixed Deposit 30-Apr-14 1 200,000,000 8 Nepal Investment Bank Fixed Deposit 8-Feb-14 1 150,000,000
9 Nepal Investment Bank Fixed Deposit 2-May-14 1 10,000,000 9 Nepal Investment Bank Fixed Deposit 30-Apr-14 1 200,000,000
10 Nepal Investment Bank Fixed Deposit 28-May-14 1 60,000,000 10 Nepal Investment Bank Fixed Deposit 2-May-14 1 10,000,000
11 Nepal Investment Bank Fixed Deposit 2-Jun-14 1 50,000,000 11 Nepal Investment Bank Fixed Deposit 6-Jun-14 1 77,000,000
12 Nepal Investment Bank Fixed Deposit 6-Jun-14 1 77,000,000 12 Nepal Investment Bank Fixed Deposit 15-Jul-14 1 10,000,000
13 Nepal Investment Bank Fixed Deposit 9-Jun-14 1 150,000,000 13 NIC ASIA Bank Fixed Deposit 20-Jul-13 1 10,000,000
14 Nepal Investment Bank Fixed Deposit 15-Jul-14 1 10,000,000 14 NIC ASIA Bank Fixed Deposit 25-Jul-13 1 5,000,000
15 NIC ASIA Bank Fixed Deposit 8-Oct-13 1 120,000,000 15 NIC ASIA Bank Fixed Deposit 8-Oct-13 1 120,000,000
16 NIC ASIA Bank Fixed Deposit 8-Feb-13 1 70,000,000 16 NIC ASIA Bank Fixed Deposit 8-Jan-14 1 120,000,000
17 NIC ASIA Bank Fixed Deposit 8-Jan-14 1 120,000,000 17 NIC ASIA Bank Fixed Deposit 8-Feb-14 1 70,000,000
18 NIC ASIA Bank Fixed Deposit 12-Jul-13 1 15,000,000 18 NIC ASIA Bank Fixed Deposit 8-Jul-14 1 120,000,000
19 NIC ASIA Bank Fixed Deposit 20-Jul-13 1 10,000,000 19 NIC ASIA Bank Fixed Deposit 12-Jul-14 1 15,000,000
20 NIC ASIA Bank Fixed Deposit 25-Jul-13 1 5,000,000 20 Everest Bank Ltd. Fixed Deposit 19-Jul-13 1 10,000,000
21 NIC ASIA Bank Fixed Deposit 14-Jan-14 1 260,000,000 21 Everest Bank Ltd. Fixed Deposit 27-Jul-13 1 11,000,000
22 NIC ASIA Bank Fixed Deposit 8-Feb-14 1 70,000,000 22 Everest Bank Ltd. Fixed Deposit 8-Feb-14 1 99,000,000
23 NIC ASIA Bank Fixed Deposit 8-Jul-14 1 120,000,000 23 Everest Bank Ltd. Fixed Deposit 6-Jun-14 1 24,400,000
24 NIC ASIA Bank Fixed Deposit 13-Jul-14 1 15,000,000 24 Everest Bank Ltd. Fixed Deposit 8-Jun-14 1 91,000,000
25 NIC ASIA Bank Fixed Deposit 7-Jul-14 1 92,000,000 25 Everest Bank Ltd. Fixed Deposit 12-Jul-14 1 163,000,000
26 NIC ASIA Bank Fixed Deposit 16-Jul-14 1 70,000,000 26 Himalayan Bank Fixed Deposit 27-Dec-13 1 120,000,000
27 Everest Bank Ltd. Fixed Deposit 19-Jul-13 1 10,000,000 27 Himalayan Bank Fixed Deposit 27-Mar-14 1 120,000,000
28 Everest Bank Ltd. Fixed Deposit 27-Jul-13 1 11,000,000 28 Himalayan Bank Fixed Deposit 30-Apr-14 1 90,000,000
29 Everest Bank Ltd. Fixed Deposit 19-Jan-14 1 250,000,000 29 Himalayan Bank Fixed Deposit 6-Jun-14 1 157,000,000
30 Everest Bank Ltd. Fixed Deposit 8-Feb-14 1 99,000,000 30 Himalayan Bank Fixed Deposit 16-Jul-14 1 150,000,000
31 Everest Bank Ltd. Fixed Deposit 6-Jun-14 1 24,400,000 31 Laxmi Bank Ltd Fixed Deposit 23-Jan-14 1 39,000,000
32 Everest Bank Ltd. Fixed Deposit 8-Jun-14 1 91,000,000 32 Laxmi Bank Ltd Fixed Deposit 12-Jul-14 1 12,000,000
33 Everest Bank Ltd. Fixed Deposit 12-Jul-14 1 163,000,000 33 Laxmi Bank Ltd Fixed Deposit 16-Jul-14 1 4,200,000
34 Himalayan Bank Fixed Deposit 16-Jan-14 150,000,000 34 Siddthartha Bank. Fixed Deposit 8-Feb-14 1 54,000,000
35 Himalayan Bank Fixed Deposit 20-Jan-14 1 100,000,000 35 Siddthartha Bank. Fixed Deposit 12-Jul-14 1 31,000,000
36 Himalayan Bank Fixed Deposit 30-Apr-14 1 90,000,000 36 Siddthartha Bank. Fixed Deposit 14-Jul-14 1 2,500,000
37 Himalayan Bank Fixed Deposit 4-May-14 1 120,000,000 37 Nepal SBI Bank Fixed Deposit 1-Oct-13 1 100,000,000
38 Himalayan Bank Fixed Deposit 6-Jun-14 1 157,000,000 38 Nepal SBI Bank Fixed Deposit 8-Nov-13 1 90,000,000
39 Himalayan Bank Fixed Deposit 16-Jul-14 1 150,000,000 39 Nepal SBI Bank Fixed Deposit 29-Nov-13 1 43,500,000
40 Laxmi Bank Ltd Fixed Deposit 16-Jul-13 4,200,000 40 Nepal SBI Bank Fixed Deposit 8-Feb-14 1 16,000,000
41 Laxmi Bank Ltd Fixed Deposit 7-Nov-13 1 15,000,000 41 Nepal SBI Bank Fixed Deposit 2-Jun-14 1 91,000,000
42 Laxmi Bank Ltd Fixed Deposit 23-Jan-14 1 39,000,000 42 Bank of Kathmandu Fixed Deposit 7-Aug-13 1 19,000,000
43 Laxmi Bank Ltd Fixed Deposit 12-Jul-14 1 12,000,000 43 Bank of Kathmandu Fixed Deposit 31-Aug-13 1 50,000,000
44 Laxmi Bank Ltd Fixed Deposit 16-Jul-14 1 4,200,000 44 Bank of Kathmandu Fixed Deposit 8-Feb-14 1 38,500,000
45 Siddthartha Bank. Fixed Deposit 19-Jan-14 1 10,000,000 45 Global IME Bank Ltd. Fixed Deposit 27-Sep-13 1 44,600,000
46 Siddthartha Bank. Fixed Deposit 8-Feb-14 1 54,000,000 46 Global IME Bank Ltd. Fixed Deposit 27-Dec-13 1 44,600,000
47 Siddthartha Bank. Fixed Deposit 3-Jul-14 1 70,000,000 47 Global IME Bank Ltd. Fixed Deposit 27-Mar-14 1 44,600,000
48 Siddthartha Bank. Fixed Deposit 12-Jul-14 1 31,000,000 48 Global IME Bank Ltd. Fixed Deposit 27-Jun-14 1 44,600,000
49 Siddthartha Bank. Fixed Deposit 14-Jul-14 1 2,500,000 49 Sanima Bank Limited Fixed Deposit 18-Jul-13 1 30,000,000
50 Standard Chartrered BanFixed Deposit 31-Mar-14 1 300,000,000 50 Sanima Bank Limited Fixed Deposit 18-Oct-13 1 44,895,000
51 Nepal SBI Bank Fixed Deposit 8-Feb-13 1 16,000,000 51 Sanima Bank Limited Fixed Deposit 18-Jan-14 1 44,895,000
52 Nepal SBI Bank Fixed Deposit 2-Jun-13 1 91,000,000 52 Sanima Bank Limited Fixed Deposit 19-Apr-14 1 44,895,000
53 Nepal SBI Bank Fixed Deposit 31-Oct-13 1 250,000,000 53 Standard Chartrered BanUSD FDR 25-Apr-14 1 756,515
54 Nepal SBI Bank Fixed Deposit 8-Nov-13 1 90,000,000 54 Nepal Rastra Bank G Boand 10-Feb-13 1 140,000,000
55 Nepal SBI Bank Fixed Deposit 29-Nov-13 1 43,500,000 55 Nepal Rastra Bank G Boand 4-Jul-13 1 9,050,000
56 Nepal SBI Bank Fixed Deposit 14-Jan-14 1 100,000,000
57 Nepal SBI Bank Fixed Deposit 8-Feb-14 1 16,000,000
58 Nepal SBI Bank Fixed Deposit 2-Jun-14 1 91,000,000
59 Nepal SBI Bank Fixed Deposit 1-Jun-14 1 60,000,000
60 Nepal SBI Bank Fixed Deposit 12-Jun-14 1 150,000,000
61 Bank of Kathmandu Fixed Deposit 7-Jul-13 1 19,000,000
62 Bank of Kathmandu Fixed Deposit 3-Sep-13 1 68,500,000
63 Bank of Kathmandu Fixed Deposit 8-Feb-14 1 38,500,000
64 Bank of Kathmandu Fixed Deposit 12-Jun-14 1 50,000,000
65 Global IME Bank Ltd. Fixed Deposit 27-Jun-13 1 44,600,000
66 Global IME Bank Ltd. Fixed Deposit 27-Sep-13 1 44,600,000
67 Global IME Bank Ltd. Fixed Deposit 27-Sep-13 1 44,600,000
68 Global IME Bank Ltd. Fixed Deposit 27-Jun-14 1 44,600,000
69 Global IME Bank Ltd. Fixed Deposit 3-Jul-14 1 70,000,000
70 Global IME Bank Ltd. Fixed Deposit 16-Jul-14 1 60,000,000
71 Sanima Bank Limited Fixed Deposit 18-Apr-13 1 30,000,000
72 Sanima Bank Limited Fixed Deposit 18-Jul-13 1 44,895,000
73 Sanima Bank Limited Fixed Deposit 18-Oct-13 1 44,895,000
74 Sanima Bank Limited Fixed Deposit 19-Jan-14 1 44,895,000
75 Sanima Bank Limited Fixed Deposit 19-Apr-14 1 44,895,000
76 Prime com Bank Ltd Fixed Deposit 4-May-14 1 26,000,000
77 Prime com Bank Ltd Fixed Deposit 12-Jun-14 1 30,000,000
78 Standard Chartrered BanUSD FDR 25-Apr-14 1 761,325
79 Nepal Rastra Bank G Boand 21-Nov-13 1 241,750,000
Investment Maturities
Purchase Date Maturity Date

7. All the bank balances have been reconciled with the balance confirmation certificates obtained from
them.
8. All the re-insurer balances have been reconciled with the balance confirmation certificates obtained
from them.
9. All the investments made by the insurer are in line with Insurance Act, Rules and Regulation as
specified by the Insurance board.
10. The Company does not have any transactions with the Board of Directors or their related person or
organization of the Board of Directors or their related person.
.
11. The Company has not obtained loan against the mortgage of its property.
12. Vjg"Eqorcp{" hkngf" ugnh" vcz" cuuguuogpv" tgvwtp" vq" vjg" Nctig" Vcz" Rc{gtÓu"Qhhkeg" *NVPO) since the
fiscal year 2058/59 to fiscal year 2069/070. Appeal to the Revenue Tribunal Office against the final
tax assessment made by LTPO and Department of Tax for FY 2061/062 & 2062/063 for disallowing
the management expenses NPR.25,852,799 & NPR.27,958,933 respectively has been lost and the
dues are settled. Appeal against disallowed management expenses of NPR.5,156,976 for the FY
2064/065 is pending decision at Revenue Tribunal. Vjg"eqorcp{Óu"hkpcn"vcz"cuuguuogpv"from LTPO
for fiscal years 2067/068 to fiscal year 2069/070 is pending as of the Balance Sheet date. The
company has received the tax clearance certificate for Fiscal year 2069-70 from Inland Revenue
Department.
13. Premiums refunded
During the year, the company refunded NPR. 361,829 due to invalid Agent license, age of proposed
insured beyond acceptable range, non-submission of requirements/medical reports etc.
14. Declared and interim bonus rate
The Company has declared bonus at the rate of 35 per thousand for policies with term 10-15 years,
45 per thousand for policies with term 16-20 years, 55 per thousand for policies with terms 21 years
and above for Fiscal Year 2013-14.
15. The company has adopted the Standard rate of 12% for fees and interest on late payment of insurance
premium and policy loan which is subject to change during the reinstatement campaign.
16. The Company has accumulated deferred investment expenditure for NPR. 54,220,276 representing
premium paid at the time purchase of investments which is being written off over the term of
respective investments during this year.
17. Details of paid in advance in share capital, Call in arrears and ceased but not re-issued shares-None.
18. Leasehold Assets Î None.
19. Total transaction of off-balance sheet items in a year. - None.
20. There are no prior period expenses or incomes accounted in this fiscal year.
21.1 Solvency margin of company stood at 689 % as of 16 July 2014.

21.2 Related Parties Transactions
There is no related party transaction during the year.
21.3 Deferred Taxes
Deferred tax is calculated on temporary differences using effective tax rate of 25% (previous year:
25%) which is separately disclosed in annexure 17.
The items attributable to deferred tax assets and liabilities and their movement are as follows:
Particular Balance of 16
July 2013
Movement Balance of 16
July 2014
Deferred Tax Assets
Accumulated depreciation in Financial Statements 3,255,283 (395,891) 2,859,393
Provision for gratuity 3,591,819 1,379,642 4,971,460
Provision for Employee Housing 10,545,379 1,221,820 11,767,199
Provision for Leave Encashment 569,004 450,716 1,019,721
Net Deferred Tax assets 17,961,485 2,656,288 20,617,773
21.4 Fund received from HO as working capital is shown under the Other Reserve. In addition, company
maintained accumulated contingency reserve of NPR.15,000,000.
21.5 For single premium (micro insurance) business, full commission expenses have been charged in the
non-participating revenue account on cash basis.

Major Indicators Anx -30
2013/14 2012/13 2011/12 2010/11 2009/10
2070/071 2069/070 2068/069 2067/068 2066/067
1 Net Worth NPR. 521,211,760 463,907,824 147,155,958 75,715,708 73,500,425
2 Number of Share Count - - - - -
3 Book Value Per Share NPR. - - - - -
4 Net Profit NPR. 87,072,924 556,347,383 25,942,849 37,528,284 5,274,877
5 Earning Per Share (EPS) NPR. - - - - -
6 Dividend Per Share (DPS) NPR. - - - - -
7 Market Price Per Share (MPPS) NPR. - - - - -
8 Price Earning Ration (PE Ratio) Ratio - - - - -
9 First Year Premium NPR. 331,955,811 250,253,920 136,460,837 152,231,767 151,040,171
10 Gross Premium NPR. 1,815,817,857 1,599,847,614 1,485,536,888 1,433,454,398 1,465,458,330
11 Net premium/Gross Premium % 98.8% 99.0% 99.1% 98.5% 98.2%
12 Net profit/Gross Premium % 4.8% 34.8% 1.7% 2.6% 0.4%
13 Gross Premium/Total Assets % 18% 18% 20% 23% 28%
14 Income from Investment & Loan/ Total Investment & Loan % 6.5% 7.3% 7.1% 8.0% 6.1%
15 Total Investment & Loan/Life Fund % 110% 106% 105% 103% 104%
16 RI Commission Income/Total RI Premium % 49.9% 47.6% 45.2% 31.0% 24.7%
17 Management Expenses/Gross Premium % 8.6% 7.2% 7.3% 7.3% 6.6%
18 Agent Expenses/Gross Premium % 7.0% 6.9% 6.5% 6.9% 7.0%
19 Total Number of Agents count 2,260 1,842 2,500 2,331 2,149
20 Number of Employee count 97 89 90 90 84
21 Number of Offices count 19 15 15 14 13
22 Employee Expenses/Management Expenses % 41.9% 42.7% 38.9% 39.9% 38.1%
23 Employee Expenses/Number of Employee NPR. 676,912 553,366 471,380 447,066 438,401
24 Payable Claim/Paid Claim % 25% 30% 29% 30% 27%
25 Total Number of Inforce Policy Count 347,937 300,245 264,893 255,552 176,004
26 This Year Renewed Policy/ Inforce Policy up to Last Year % 86.7% 86.7% 86.7% 86.7% 83.3%
27 Number of Claim/ Total Inforce Policy % 0.06% 0.07% 0.08% 0.08% 0.12%
28 Solvency Margin % 468% 468% Na Na Na
29 Declared Bonus Rate NPR./1000 35/45/55 35/45/55 35 30 30
30 Interim Bonus Rate NPR./1000 35/45/55
SN. Particular Indicator
Fiscal Year

Statement of Sum Assured Annexure - 31
Amount in NPR.
This Year Last Year This Year Last Year This Year Last Year This Year Last Year This Year Last Year
1Three Payment
Plan58,902 60,088 8,833,734,238 8,795,983,331 6,918,596,392 7,277,077,475 576,028,400 686,178,485 6,342,567,992 6,590,898,990
2 Endowment 62,077 62,116 8,625,754,752 8,377,152,193 6,134,360,089 6,221,847,862 409,114,392 473,901,334 5,725,245,697 5,747,946,528
3 Future Care-DPS 29,665 7,487 5,390,782,143 2,455,469,084 5,155,848,297 2,382,998,493 1,678,293,682 772,093,622 3,477,554,615 1,610,904,871
4 Term Insurance 197,293 170,554 24,397,870,789 13,294,268,789 24,305,578,059 13,220,353,549 4,642,408,517 2,832,864,787 19,663,169,542 10,387,488,762
347,937 300,245 47,248,141,921 32,922,873,397 42,514,382,837 29,102,277,379 7,305,844,992 4,765,038,228 35,208,537,846 24,337,239,151Total
S.NType of
Insurance
Inforce Policy Count Sum Assured of Inforce Policies Sum at Risk Sum at Risk Transferred to Re-insurer Sum at risk retained by insurer

a
iqrfiEn +qr F<qq-{6'R1 R-filqInnrr.nce Retulatory Authorlty of epal
h.tq.qr.lqor?orgi',glt -c.a. L2--. 2
4r tu Er€F (Alrco),getr+, qr,raq{ r
Hi io\ei lo le
{q qfCt{cr,rR T6ffi m ?os?./oa,,,?i <riir+l qa {rqP.tqr Afu+8t I
ffi ffiq F{filr qf{En sfrr{rifd ffroqr {A-qir e"jt4t{i d r qiqfa.iiHa :o,el 9i jq, (fu.fu.!n.ii<, io\el s? | q I ioca +r ffisTa {c}fmc qffiid1Ig 3faTfqd q+qra {fu dqi di.{frTr iqr c\qi d6r*f {r.q ioeo,/sl EicFqrfuia ffirq id-{vr naprrr cr.irn qf6d d-.qtd r@r qaRr hoiqr+qR 3rnrr++rqi{ r+iu rrfuB r
9) {tcfirfir fuln lorgoroxri? df FTtlFdr sia -f,.{ Ei Tft 4r@ ffqr ll<t +6ra{+*r]lqq q=i fi-{n n$ ff{€ {-+d {6-{{-{ r
1 Trl '-4ru {€q6- qrtrrcr4 qi-4?ur rli 6<rtfi qT.r q-4 rFrd;I I
il ffit ir'rs{EitF dqr Er4I Tsrfi qqqr grrrfltf q{rc;T q{ |yr fi-{f,.i xrt{i *-€ {atr{ aqn qrft qq ar+ +1'dt urirur q{dl wItT drqr ffi
Tdq EqEl d{ |t ' .fqT t|fie.GFq ?rT-<{frig+r .FrFqirf€
TiT?;l r.t I
f4qq 3Tr.E.?o\eolt4 d ffifq tq-{<ur q-srd ffi eli r
q'dR rrtr 3n<fu+ ifiqur gffi Tt{rdsrtr
fuf, kqnq-m
fr.s.;i.: i4st, Ecsdq-lo, qft'ns{, iqR, s}i: ol-tt{osj, {{tqsyt, q(.Rir o1-t{1o11r,, zt{ h ;i.: tqqo-o1-{rrsq1P.O. Box No. : 2172, Kupandole-10, Lal i tpur Nepal , Phone: O1-5521079, 5538743, Fax: 01-5520119, Tol l Free No. : 1660-01-56789
URL: wwwbsib.orS.np, E-,$ail: infoobsib.orB.np, [email protected]
lL.tt:\