PDAC Media Conference - Slides
13
PDAC 2020 Stephen McIntosh – Group Executive Growth & Innovation 2 March 2020
Transcript of PDAC Media Conference - Slides
PDAC 2020Stephen McIntosh – Group Executive Growth & Innovation2 March 2020

©2020, Rio Tinto, All Rights Reserved
Cautionary statements
2
This presentation has been prepared by Rio Tinto plc and Rio Tinto Limited (“Rio Tinto”). By accessing/attending this presentation you acknowledge that you have read and understood the following statement.
Forward-looking statementsThis document, including but not limited to all forward looking figures, contains certain forward-looking statements with respect to the financial condition, results of operations and business of the Rio Tinto Group.These statements are forward-looking statements within the meaning of Section 27A of the US Securities Act of 1933, and Section 21E of the US Securities Exchange Act of 1934. The words “intend”, “aim”,“project”, “anticipate”, “estimate”, “plan”, “believes”, “expects”, “may”, “should”, “will”, “target”, “set to” or similar expressions, commonly identify such forward-looking statements.
Examples of forward-looking statements include those regarding estimated ore reserves, anticipated production or construction dates, costs, outputs and productive lives of assets or similar factors. Forward-lookingstatements involve known and unknown risks, uncertainties, assumptions and other factors set forth in this presentation.
For example, future ore reserves will be based in part on market prices that may vary significantly from current levels. These may materially affect the timing and feasibility of particular developments. Other factorsinclude the ability to produce and transport products profitably, demand for our products, changes to the assumptions regarding the recoverable value of our tangible and intangible assets, the effect of foreigncurrency exchange rates on market prices and operating costs, and activities by governmental authorities, such as changes in taxation or regulation, and political uncertainty.
In light of these risks, uncertainties and assumptions, actual results could be materially different from projected future results expressed or implied by these forward-looking statements which speak only as to thedate of this presentation. Except as required by applicable regulations or by law, the Rio Tinto Group does not undertake any obligation to publicly update or revise any forward-looking statements, whether as aresult of new information or future events. The Group cannot guarantee that its forward-looking statements will not differ materially from actual results. In this presentation all figures are US dollars unless statedotherwise.
DisclaimerNeither this presentation, nor the question and answer session, nor any part thereof, may be recorded, transcribed, distributed, published or reproduced in any form, except as permitted by Rio Tinto. By accessing/attending this presentation, you agree with the foregoing and, upon request, you will promptly return any records or transcripts at the presentation without retaining any copies.
This presentation contains a number of non-IFRS financial measures. Rio Tinto management considers these to be key financial performance indicators of the business and they are defined and/or reconciled in RioTinto’s annual results press release and/or Annual report.
Reference to consensus figures are not based on Rio Tinto’s own opinions, estimates or forecasts and are compiled and published without comment from, or endorsement or verification by, Rio Tinto. Theconsensus figures do not necessarily reflect guidance provided from time to time by Rio Tinto where given in relation to equivalent metrics, which to the extent available can be found on the Rio Tinto website.
By referencing consensus figures, Rio Tinto does not imply that it endorses, confirms or expresses a view on the consensus figures. The consensus figures are provided for informational purposes only and are notintended to, nor do they, constitute investment advice or any solicitation to buy, hold or sell securities or other financial instruments. No warranty or representation, either express or implied, is made by Rio Tinto orits affiliates, or their respective directors, officers and employees, in relation to the accuracy, completeness or achievability of the consensus figures and, to the fullest extent permitted by law, no responsibility orliability is accepted by any of those persons in respect of those matters. Rio Tinto assumes no obligation to update, revise or supplement the consensus figures to reflect circumstances existing after the date hereof.
©2020, Rio Tinto, All Rights Reserved3
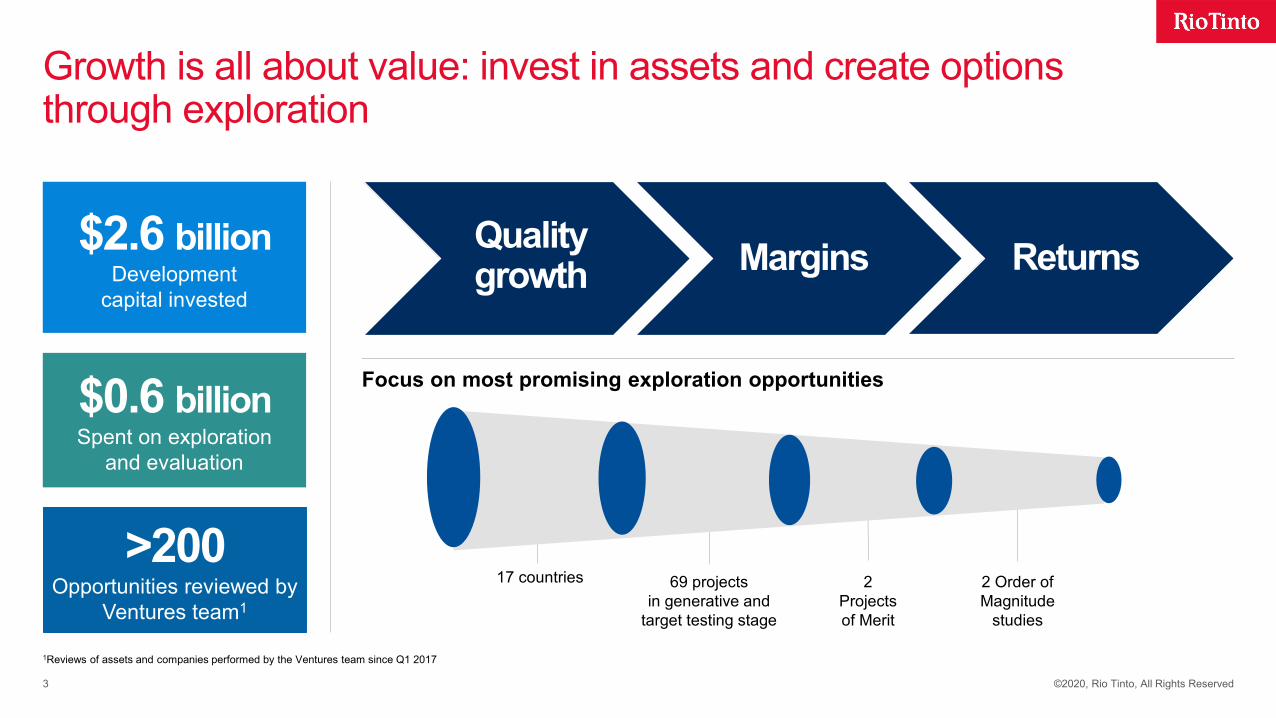
Growth is all about value: invest in assets and create options through exploration
17 countries 69 projectsin generative and
target testing stage
2 Projects of Merit
2 Order of Magnitude
studies
Focus on most promising exploration opportunities
$2.6 billionDevelopment
capital invested
$0.6 billionSpent on exploration
and evaluation
Quality growth Margins Returns
>200Opportunities reviewed by
Ventures team1
1Reviews of assets and companies performed by the Ventures team since Q1 2017

4
A truly global footprint – well funded and very active
©2020, Rio Tinto, All Rights Reserved
A truly global footprint – well funded and very active
* Active countries as at February 2020
Exploring for 7 different commodities across 17 countries* Targets tested Metres drilled (km)
Tenements / agreements
Active hectares (millions)
Copper
Bauxite
Minerals
Iron Ore
Greenfield
Brownfield
Uranium
Diamonds
Ni/PGE
54 6787
2017 2018 2019
89 97
230
2017 2018 2019
174261
157
2017 2018 2019
7.3 8.2 9.8
2017 2018 2019

5
7 decades of industry leading discovery performance
©2020, Rio Tinto, All Rights Reserved
1947
1950
1955
1956
1960
1962
1964
1968
1970
1975
1977
1980
1983
1990
1994
1999
2002
2004
2007
2008
2009
2011
2014
2015
2019
1986
1996
2006
2018
1947CanadaLac AllardIlmeniteKennecott
1955Australia
WeipaBauxite
1962AustraliaTom PriceIron OreCZP
1979AustraliaArgyleDiamondsCRAE
2002USA
ResolutionCopper
RTX
2004GuineaSimandou Iron OreRTX
2005Peru
La Granja Copper
RTX
2005Australia
CaliwinginaIron Ore
RTX
1968NamibiaRössing UraniumRTZ
1970Australia
Tarong (QLD) Coal
CRAE
1964PNG
PangunaCopperCRAE
1968PNGOK TediCopperKennecott
1960USA
SierritaCopper
Kennecott
2000Argen.PRCPotashRTX
Under Cover or +100m depth of mineralization
Rio Tinto current or formerly owned / operated or significant business potential
Divested
2012CanadaSaskatchewanPotashRTX
2008USA
TamarackNickel
RTX
2009SerbiaJadarLithiumRTX
2014AustraliaYandi Braid Iron OreRTX
2015AustraliaMTW / HV*CoalRTX
2008IndiaBunderDiamondsRTX
2018Australia
WinuCopper
RTX
1991Brazil
CorumbaIron ore
RTZ
1991PNGWafiGoldRTZ
1994Brazil
FortalezaNickel
RTZ
1994Aus.Hm. WellNickelCRAE
1956South AfricaPalaboraCopperRTZ
1972BrazilParagominasBauxiteRTZ
1983PNGLihirGoldKennecott
1986Australia
KintyreUranium
CRAE
1977Indonesia
KelianGold
CRAE
1996SpainL. CrucesCopperRTX
2007South AfricaChapudiCoalRTX
1996Lao PDR
SeponCopperCRAE
2004USAEagle Nickel
2004PeruConstanciaCopperRTX
1999Zimbabwe
MurowaDiamonds
RTX
1984Indonesia
Kaltim PrimaCoal
CRAE
2005TurkeyCopper
GoldRTX
2003Iran
S. GunayGoldRTX
2007TurkeyKazanTronaRTX
2008IndonesiaSulawesiNickelRTX
1953Canada
Elliot LakeUranium
RTZ
1982Brazil
Moro de OuroGoldRTZ
1996Canada
Diavik Diamonds
KEX
2008MozambiqueMutambaIlmeniteRTX
1955Australia
Mary KathleenUranium
RTMA
1956GuineaSangarediBauxiteAlcan
2011Brazil
AmargosaBauxite
RTX
1975Australia
Koodaideri BeddedIron Ore
CRAE
2006AustraliaTexas EastIron OreRTX
1972South AfricaRichards Bay IlmeniteRTZ
2009ChileEscondida EsteCopperRTX
2007ChilePampa Es.CopperRTX
2007Australia
CaliwinginaNth.
Iron OreRTX
2007Peru
MiradorCopper
RTX
1999PeruTia MariaCopperRTX
2006Peru
CoraniSilverRTX
1995PeruP.D.
PongoFe
1975USAFlambeauCopperKennecott
1990MadagascarQMMInd. MineralsRTZ
1993Australia
CenturyZinc
CRAE
1998Mexico
PenasquitoSilverRTX
2000PeruMina JustaCopperRTX
6
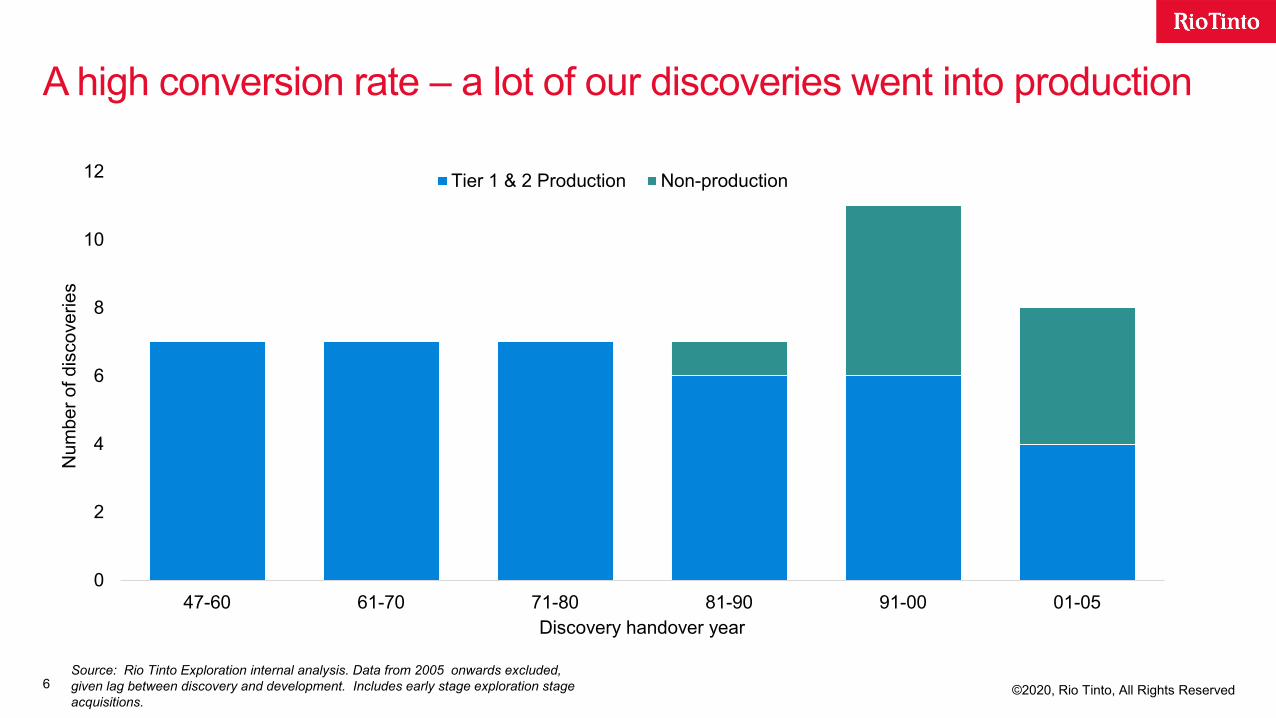
A high conversion rate – a lot of our discoveries went into production
©2020, Rio Tinto, All Rights ReservedSource: Rio Tinto Exploration internal analysis. Data from 2005 onwards excluded, given lag between discovery and development. Includes early stage exploration stage acquisitions.
0
2
4
6
8
10
12
47-60 61-70 71-80 81-90 91-00 01-05
Num
ber o
f dis
cove
ries
Discovery handover year
Tier 1 & 2 Production Non-production

7
The lost decade – the industry got busy being busy, but found less
©2020, Rio Tinto, All Rights Reserved
Industry success historically tied to spend
From ’94-’08 there was a fairly uniform trend for spend and discovery success
But then the industry got busy being busy – spending big and finding less
Note: Excludes bulk minerals (coal, iron ore, bauxite, phosphate and potash). Sources: MinEx Consulting July 2019 (discovery data) and SNL Dec 2018 (expenditure data)
0
5
10
15
20
25
30
0
10
20
30
40
50
60
70
80
'90 '92 '94 '96 '98 '00 '02 '04 '06 '08 '10 '12 '14 '16 '18Ex
plor
atio
n bu
dget
(201
8 U
S$b
real
)
Num
ber o
f dis
cove
ries
Tier 3 Tier 2 Tier 1 Exploration Spend
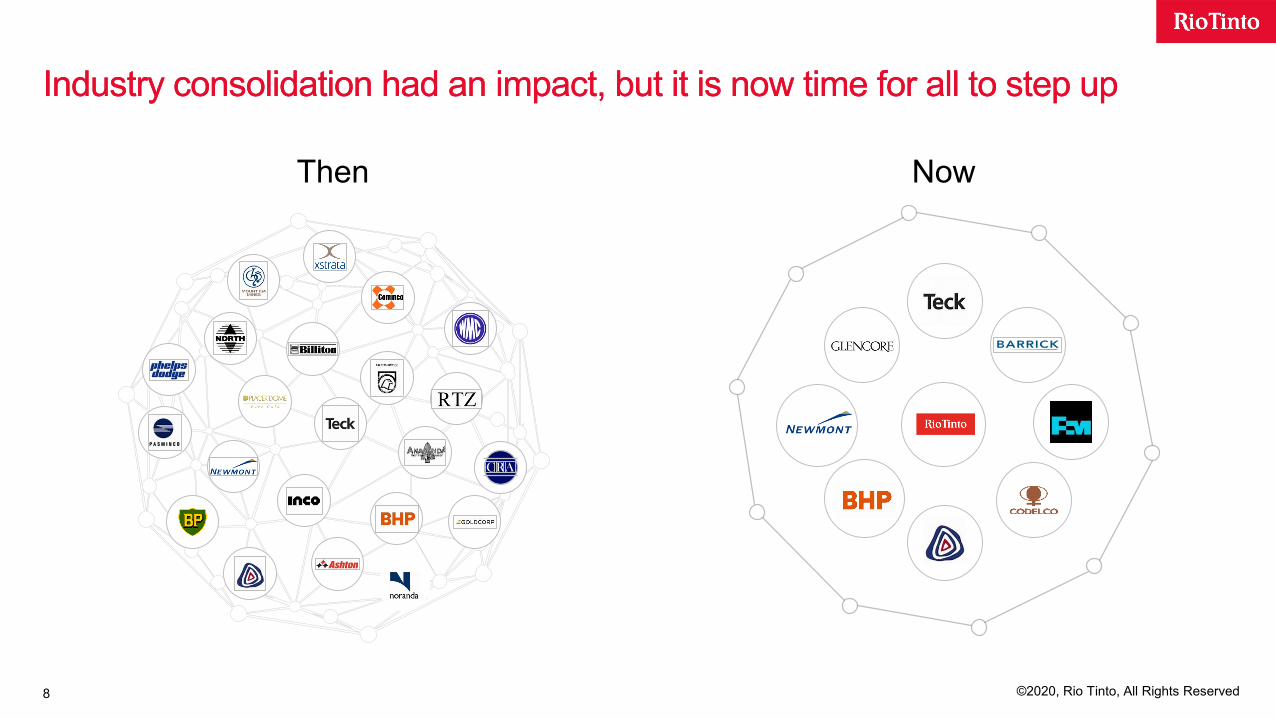
Industry consolidation had an impact, but it is now time for all to step up
CRA
©2020, Rio Tinto, All Rights Reserved8
Industry consolidation had an impact, but it is now time for all to step up
Then Now

9
Analytics and technology enabled exploration strategy
©2020, Rio Tinto, All Rights Reserved
+
Rapid application of new technologies
SearchAnalytics
ResearchPartnership
Drones Data in the fieldHyperspectral Imaging
Sophisticated proprietary tools & techniques
“Greenrocks” Geochronology& Fertility
Automated Mineralogy
New modelsPredictive Analytics

10
Rio Tinto has an excellent track record of effectively exploring beneath cover
©2020, Rio Tinto, All Rights Reserved
Industry discoveries are increasingly at depth – typically greater capital at risk for investment
Rio Tinto has an excellent track record of effectively exploring beneath cover
Source: MinEx Consulting March 2017
0
500
1,000
1,500
2,000
2,500
3,000
3,500
19201900 19601940 1980 2000 2020
Base Metals
GoldGold - South Africa
Copper
• Escondida Este
• Las Cruces• Mirador• Resolution
Iron ore
• Calawingina• Calawingina Nth• Yandi Braid
Other
• Jadar (Lithium)
• Kazan (Trona)• PRC (Potash)• Tamarack
(Nickel)
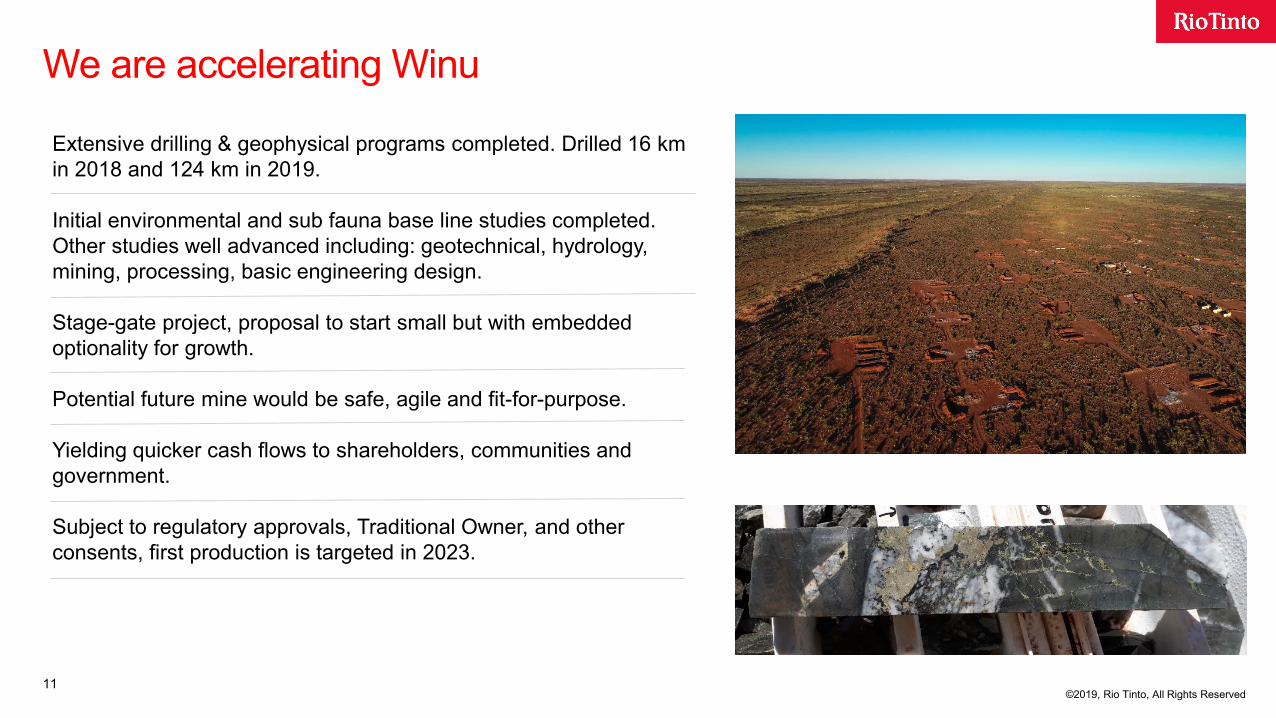
We are accelerating Winu
©2019, Rio Tinto, All Rights Reserved©2019, Rio Tinto, All Rights Reserved
Extensive drilling & geophysical programs completed. Drilled 16 km in 2018 and 124 km in 2019.
Initial environmental and sub fauna base line studies completed. Other studies well advanced including: geotechnical, hydrology, mining, processing, basic engineering design.
Stage-gate project, proposal to start small but with embedded optionality for growth.
Potential future mine would be safe, agile and fit-for-purpose.
Yielding quicker cash flows to shareholders, communities and government.
Subject to regulatory approvals, Traditional Owner, and other consents, first production is targeted in 2023.
11

©2020, Rio Tinto, All Rights Reserved12
Technology on show at FalCon
Not a typical site
Novel application of existing non-mining technology
Working with our partner to quickly identify the potential
FalCon diamond project - cutter crew changeover after reaching 228.4 metres depth

©2020, Rio Tinto, All Rights Reserved13
Best in class analytics & technology
Industry needs to crack the code on cover – Rio Tinto will play it’s part
Ready to partner globally