newmont mining PDAC
29
Slide 1 Providing an Alternative Providing an Alternative Strategic Capital Source Strategic Capital Source for Juniors for Juniors Paul Brink Director Newmont Capital PDAC, March 7, 2007 PDAC, March 7, 2007
-
Upload
finance37 -
Category
Economy & Finance
-
view
157 -
download
3
Transcript of newmont mining PDAC
Slide 1
Providing an Alternative Providing an Alternative Strategic Capital Source Strategic Capital Source
for Juniorsfor JuniorsPaul BrinkDirector
Newmont Capital
PDAC, March 7, 2007PDAC, March 7, 2007
Slide 2
Cautionary Statement
Cautionary Statement This presentation contains “forward-looking statements” within the meaning of Section 27A of the Securities Act of 1933, as amended, and Section 21E of the Securities Exchange Act of 1934, as amended, that are intended to be covered by the safe harbor created by such sections. Such forward-looking statements include, without limitation, (i) statements regarding value or future distributions of investments, (ii) estimates regarding timing of future development, construction and production activities; (iii) statements regarding future exploration results; and (iv) estimates of reserves and statements regarding replacement of reserves. Where the Company expresses or implies an expectation or belief as to future events or results, such expectation or belief is expressed in good faith and believed to have a reasonable basis. However, forward-looking statements are subject to risks, uncertainties and other factors, which could cause actual results to differ materially from future results expressed, projected or implied by such forward-looking statements. For a discussion of risks and other factors, see the Company’s 2006 Annual Report on Form 10-K, which is on file with the Securities and Exchange Commission, as well as the Company’s other SEC filings. The Company does not undertake any obligation to release publicly revisions to any “forward-looking statement,” to reflect events or circumstances after the date of this news release, or to reflect the occurrence of unanticipated events, except as may be required under applicable securities laws.
Slide 3
Agenda
Newmont CapitalNewmont Capital
Investment RationaleInvestment Rationale
Technical SupportTechnical Support
Select TransactionsSelect Transactions
Transaction DriversTransaction Drivers
Slide 4
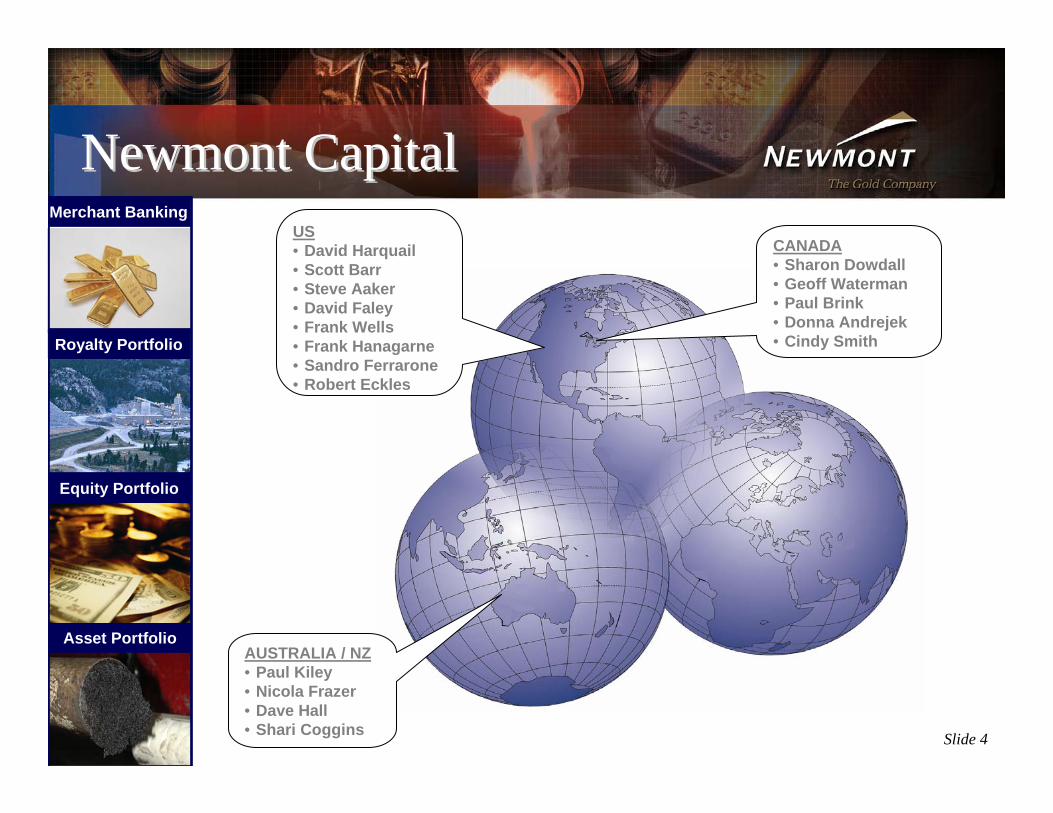
Newmont CapitalNewmont CapitalUS• David Harquail• Scott Barr• Steve Aaker• David Faley• Frank Wells• Frank Hanagarne• Sandro Ferrarone• Robert Eckles
CANADA• Sharon Dowdall• Geoff Waterman• Paul Brink• Donna Andrejek• Cindy Smith
AUSTRALIA / NZ• Paul Kiley• Nicola Frazer• Dave Hall• Shari Coggins
Merchant Banking
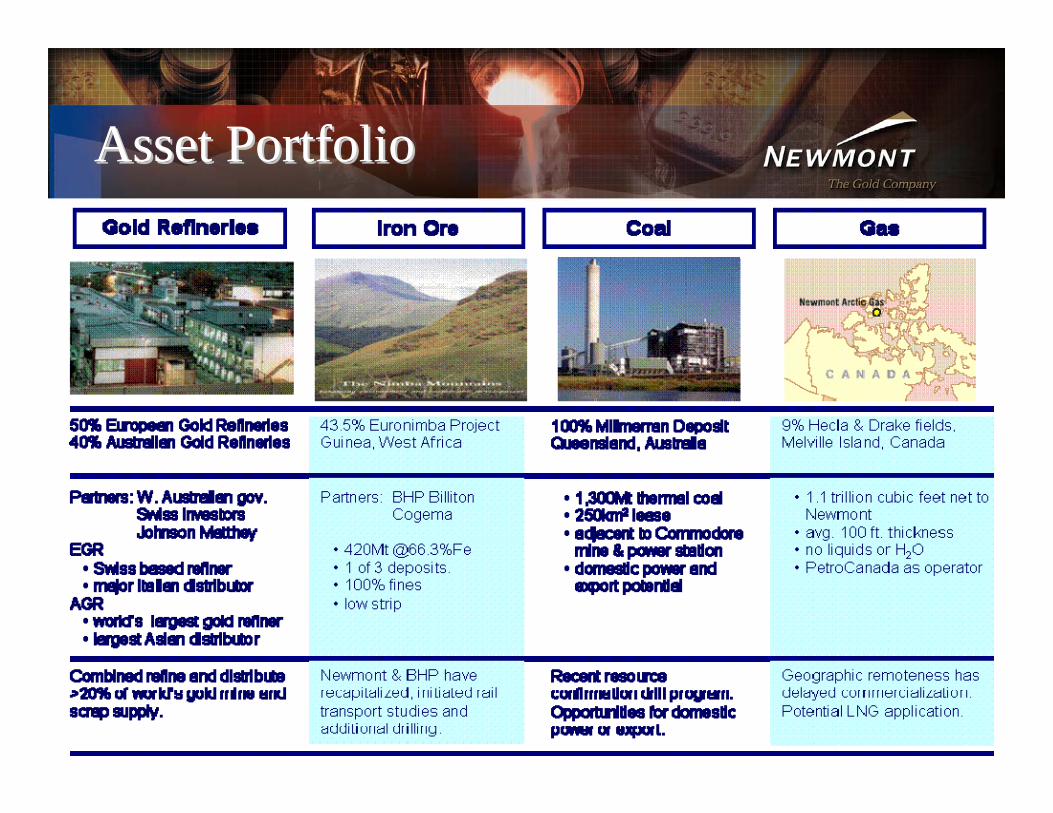
Asset Portfolio
Royalty Portfolio
Equity Portfolio
Slide 5
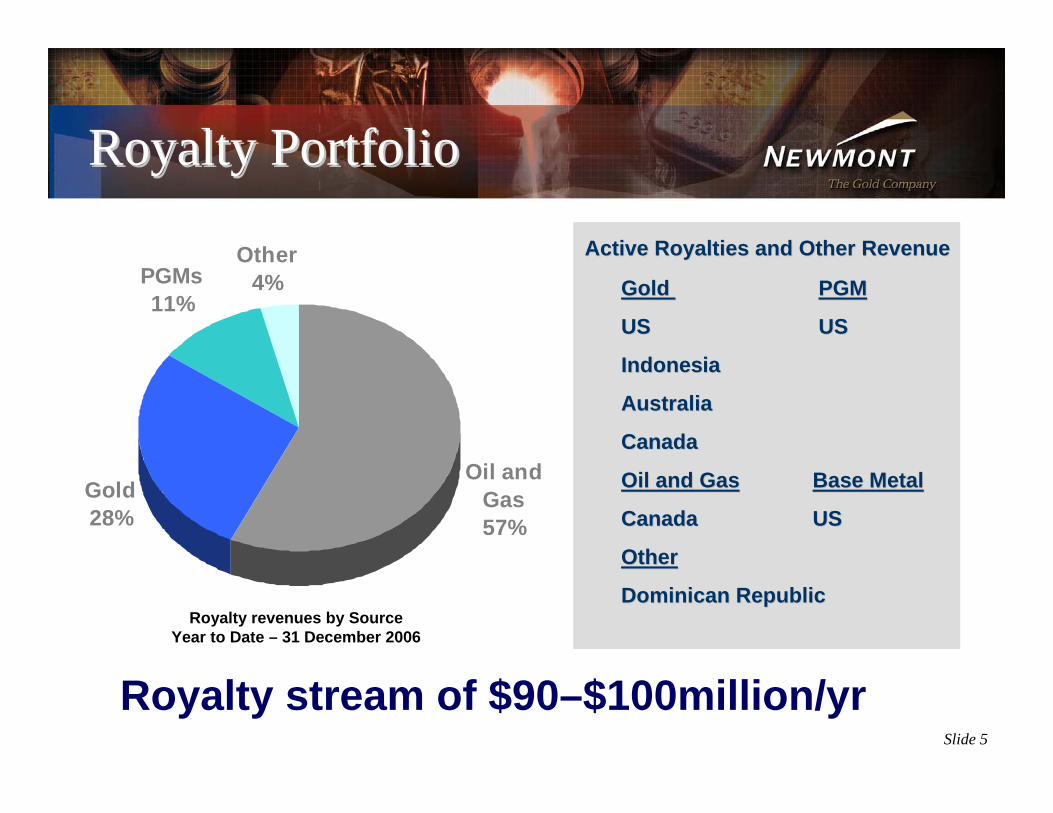
Oil and Gas57%
Gold28%
PGMs11%
Other4%
Royalty PortfolioRoyalty Portfolio
Royalty revenues by SourceYear to Date – 31 December 2006
Royalty stream of $90–$100million/yr
GoldGold PGMPGM
US US USUS
IndonesiaIndonesia
AustraliaAustralia
Canada Canada
Oil and GasOil and Gas Base MetalBase Metal
CanadaCanada USUS
OtherOther
Dominican RepublicDominican Republic
Active Royalties and Other RevenueActive Royalties and Other Revenue
Slide 6
Asset PortfolioAsset Portfolio
Slide 7
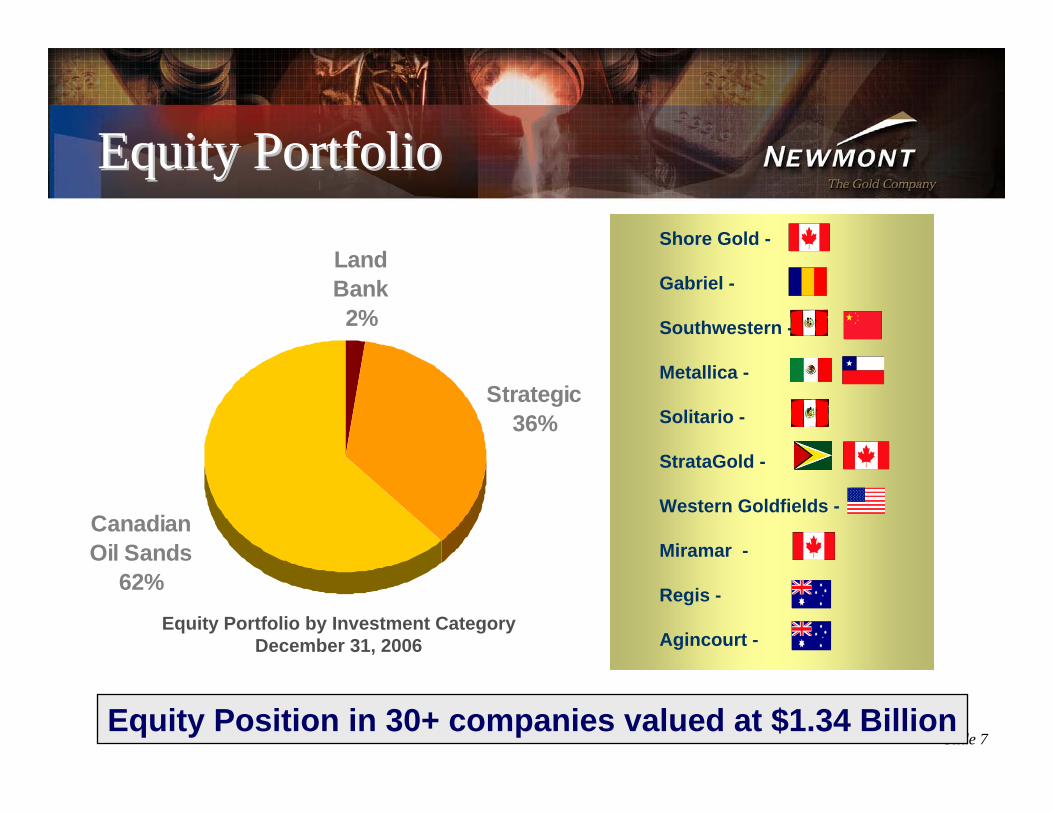
Land Bank2%
Strategic36%
Canadian Oil Sands
62%
Equity PortfolioEquity Portfolio
Equity Portfolio by Investment CategoryDecember 31, 2006
Shore Gold -
Gabriel -
Southwestern -
Metallica -
Solitario -
StrataGold -
Western Goldfields -
Miramar -
Regis -
Agincourt -
Equity Position in 30+ companies valued at $1.34 Billion
Slide 8
Agenda
Newmont CapitalNewmont Capital
Investment RationaleInvestment Rationale
Technical SupportTechnical Support
Select TransactionsSelect Transactions
Transaction DriversTransaction Drivers
Slide 9
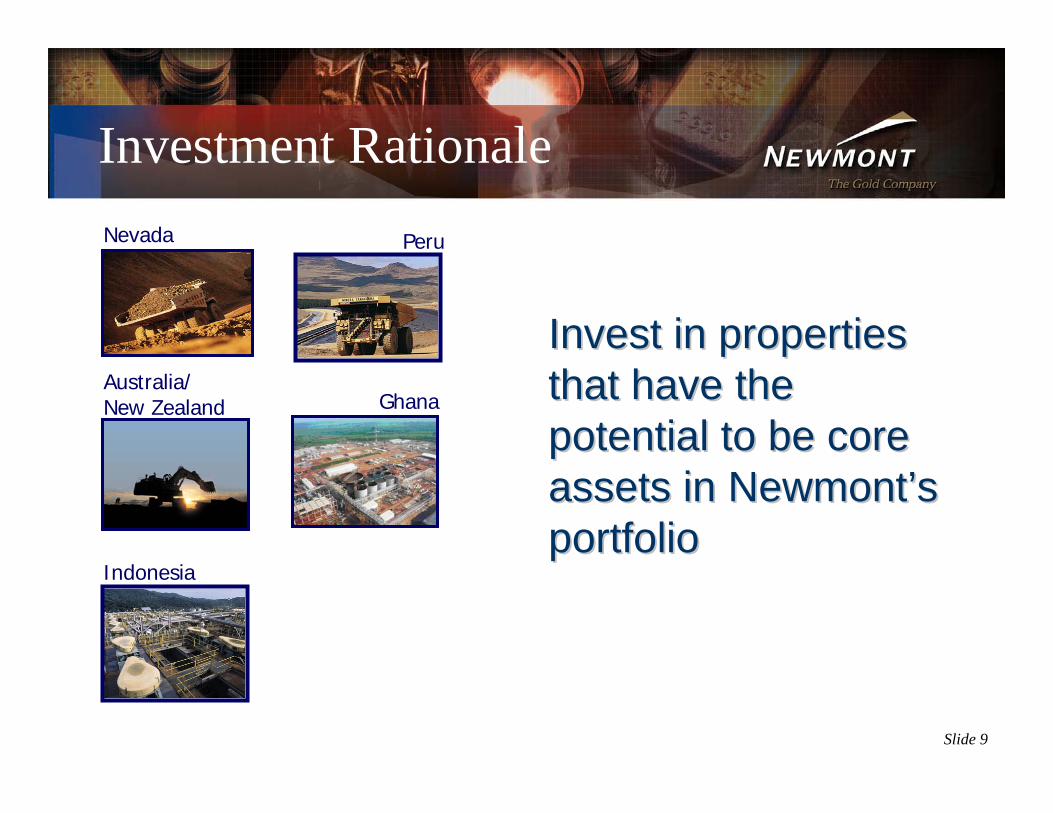
Investment Rationale
Invest in properties Invest in properties that have the that have the potential to be core potential to be core assets in Newmontassets in Newmont’’s s portfolioportfolio
Nevada Peru
Indonesia
GhanaAustralia/ New Zealand
Slide 10
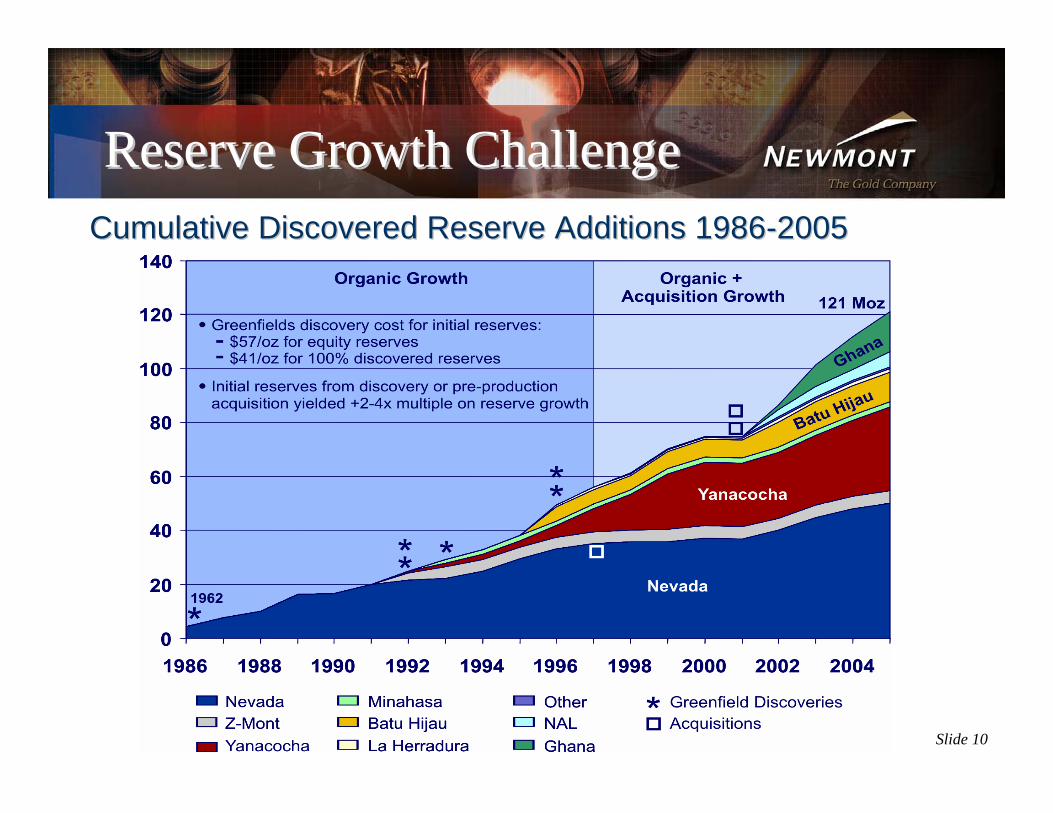
Cumulative Discovered Reserve Additions 1986Cumulative Discovered Reserve Additions 1986--20052005
Reserve Growth ChallengeReserve Growth Challenge

Slide 11
Exploration RegionsExploration Regions
Slide 12
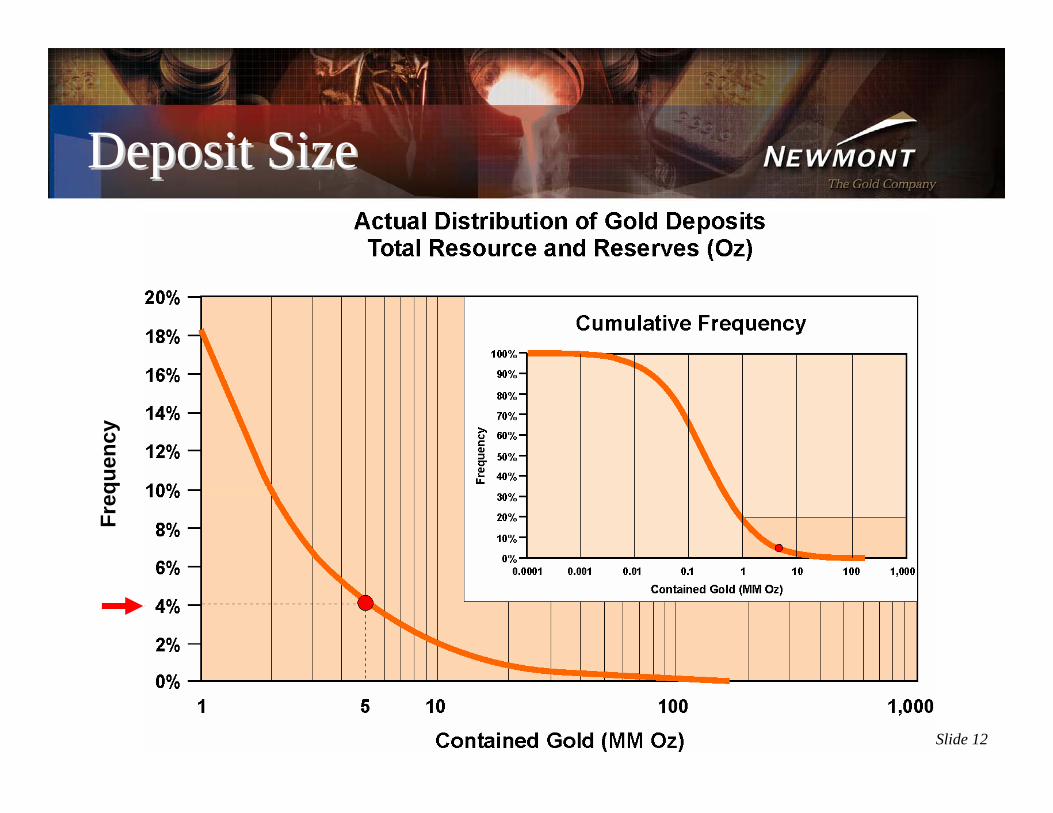
Freq
uenc
y
Deposit SizeDeposit Size
Slide 13
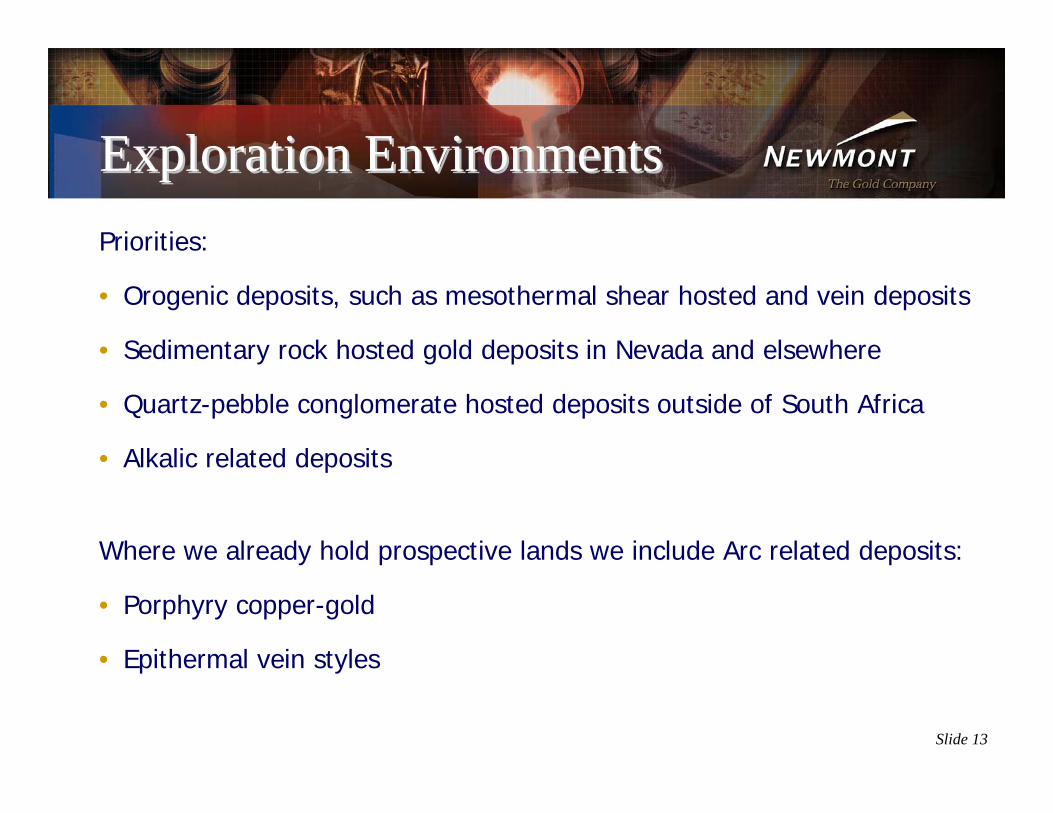
Priorities:
• Orogenic deposits, such as mesothermal shear hosted and vein deposits
• Sedimentary rock hosted gold deposits in Nevada and elsewhere
• Quartz-pebble conglomerate hosted deposits outside of South Africa
• Alkalic related deposits
Where we already hold prospective lands we include Arc related deposits:
• Porphyry copper-gold
• Epithermal vein styles
Exploration EnvironmentsExploration Environments
Slide 14
Agenda
Newmont CapitalNewmont Capital
Investment RationaleInvestment Rationale
Technical SupportTechnical Support
Select TransactionsSelect Transactions
Transaction DriversTransaction Drivers
Slide 15
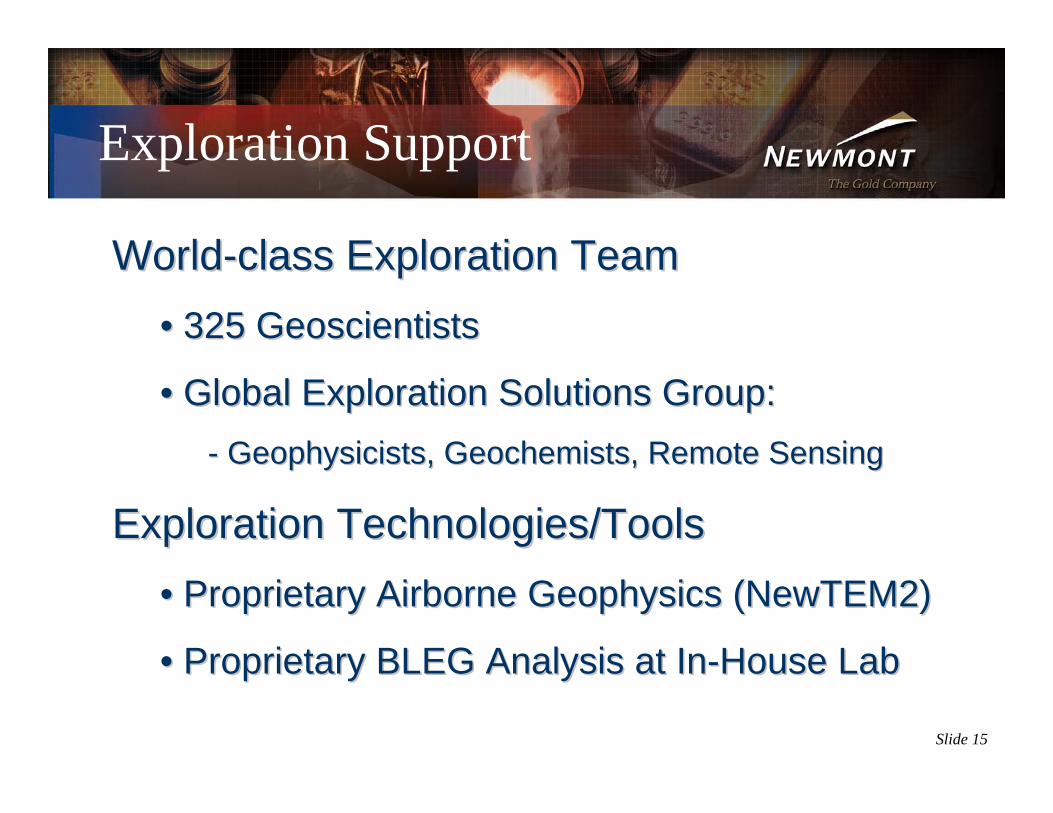
Exploration Support
WorldWorld--class Exploration Teamclass Exploration Team•• 325 Geoscientists325 Geoscientists
•• Global Exploration Solutions Group:Global Exploration Solutions Group:-- Geophysicists, Geochemists, Remote SensingGeophysicists, Geochemists, Remote Sensing
Exploration Technologies/ToolsExploration Technologies/Tools•• Proprietary Airborne Geophysics (NewTEM2)Proprietary Airborne Geophysics (NewTEM2)
•• Proprietary BLEG Analysis at InProprietary BLEG Analysis at In--House LabHouse Lab
Slide 16
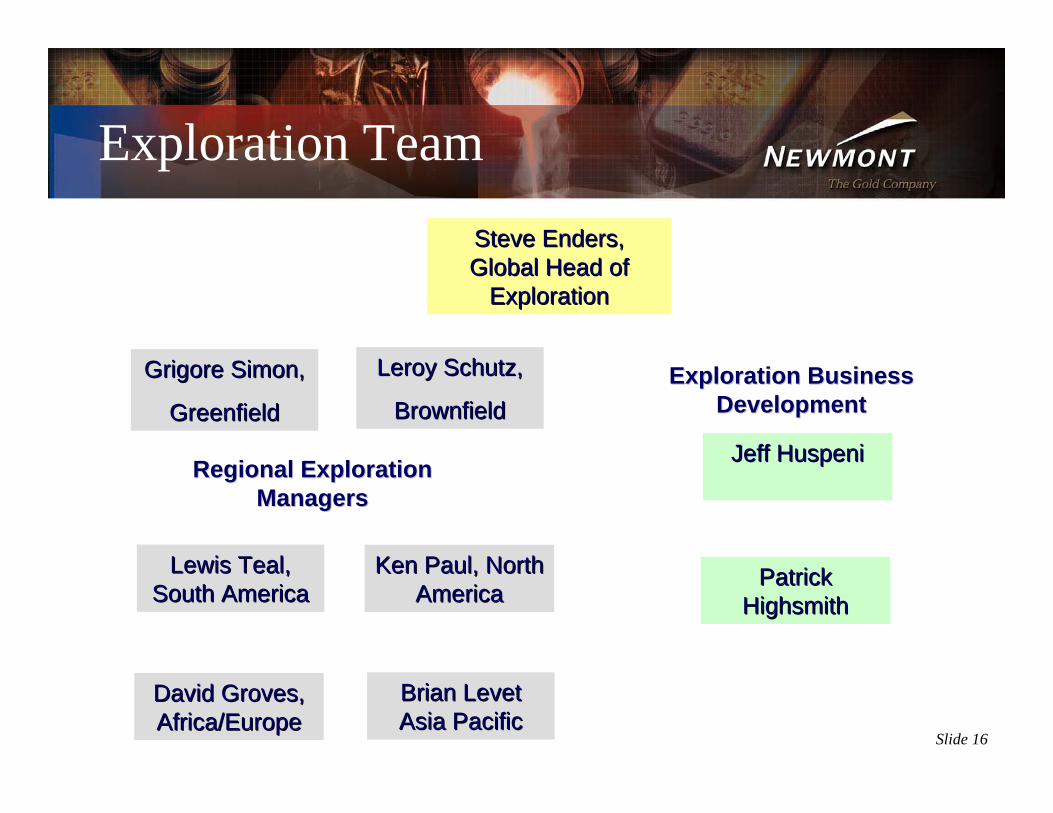
Exploration TeamSteve Enders, Steve Enders, Global Head of Global Head of
ExplorationExploration
David Groves, David Groves, Africa/EuropeAfrica/Europe
Lewis Teal, Lewis Teal, South AmericaSouth America
Ken Paul, North Ken Paul, North AmericaAmerica
Brian Levet Brian Levet Asia PacificAsia Pacific
Regional Exploration Regional Exploration ManagersManagers
Exploration Business Exploration Business DevelopmentDevelopment
Jeff HuspeniJeff Huspeni
Patrick Patrick HighsmithHighsmith
Grigore Simon,Grigore Simon,
GreenfieldGreenfield
Leroy Schutz,Leroy Schutz,
BrownfieldBrownfield
Slide 17
Technologies
Innovative Process TechnologiesInnovative Process Technologies
•• BIOPROBIOPRO®® –– BiooxidationBiooxidation
•• NN22TECTEC®® –– FlotationFlotation
•• Pressure OxidationPressure Oxidation
•• ATS ATS –– Ammonium Ammonium ThiosulphateThiosulphate
Slide 18
Technical Services
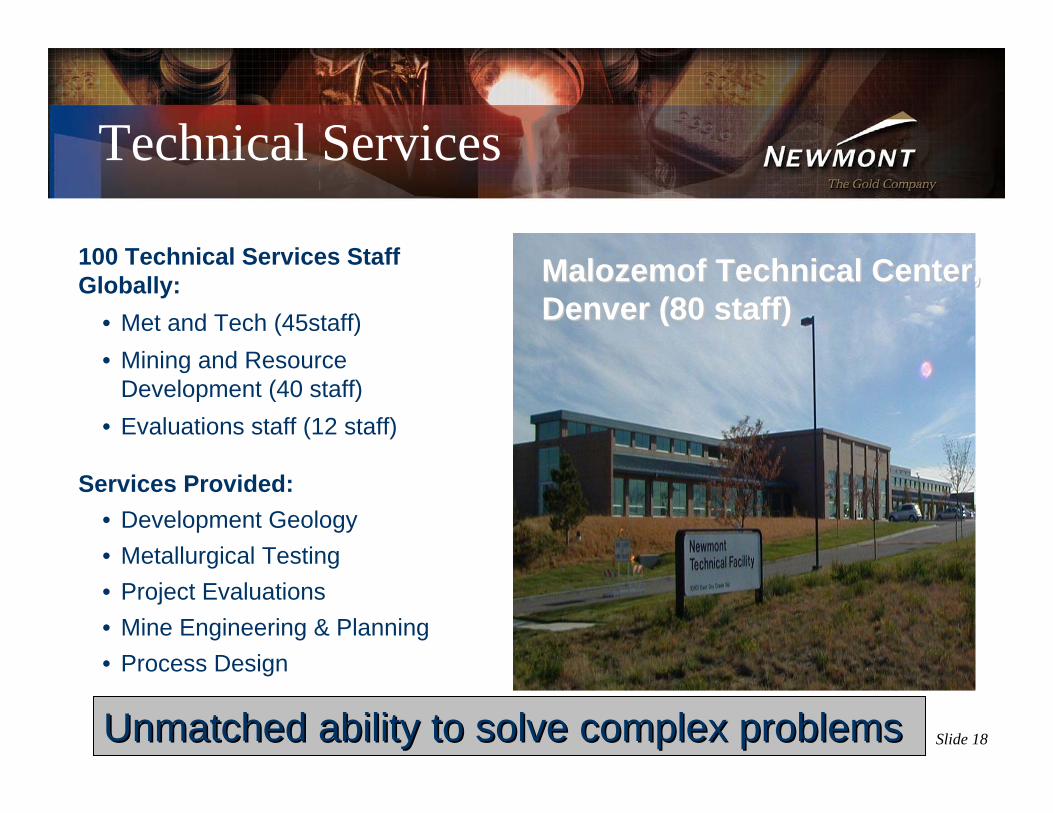
100 Technical Services Staff Globally:
• Met and Tech (45staff) • Mining and Resource
Development (40 staff)• Evaluations staff (12 staff)
Services Provided:• Development Geology• Metallurgical Testing• Project Evaluations• Mine Engineering & Planning• Process Design
MalozemofMalozemof Technical Center, Technical Center, Denver (80 staff)Denver (80 staff)
Unmatched ability to solve complex problemsUnmatched ability to solve complex problems
Slide 19
Agenda
Newmont CapitalNewmont Capital
Investment RationaleInvestment Rationale
Technical SupportTechnical Support
Select TransactionsSelect Transactions
Transaction DriversTransaction Drivers
Slide 20
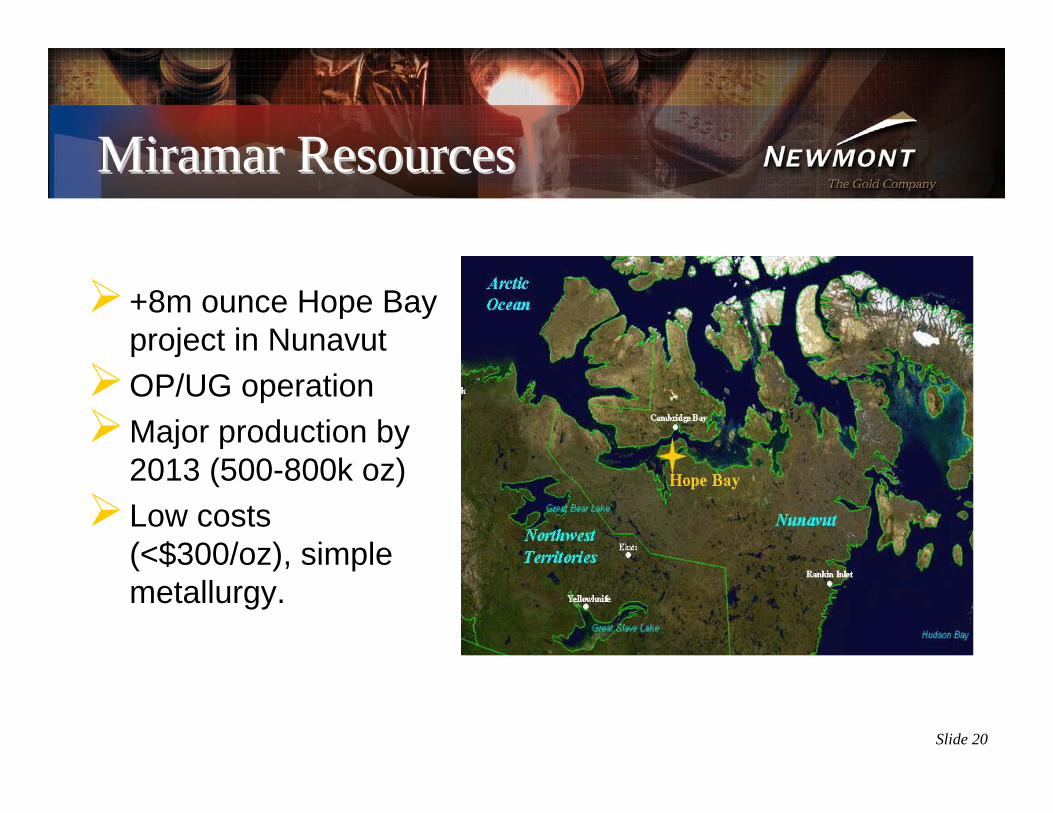
+8m ounce Hope Bay project in NunavutOP/UG operationMajor production by 2013 (500-800k oz) Low costs (<$300/oz), simple metallurgy.
Miramar ResourcesMiramar Resources
Slide 21
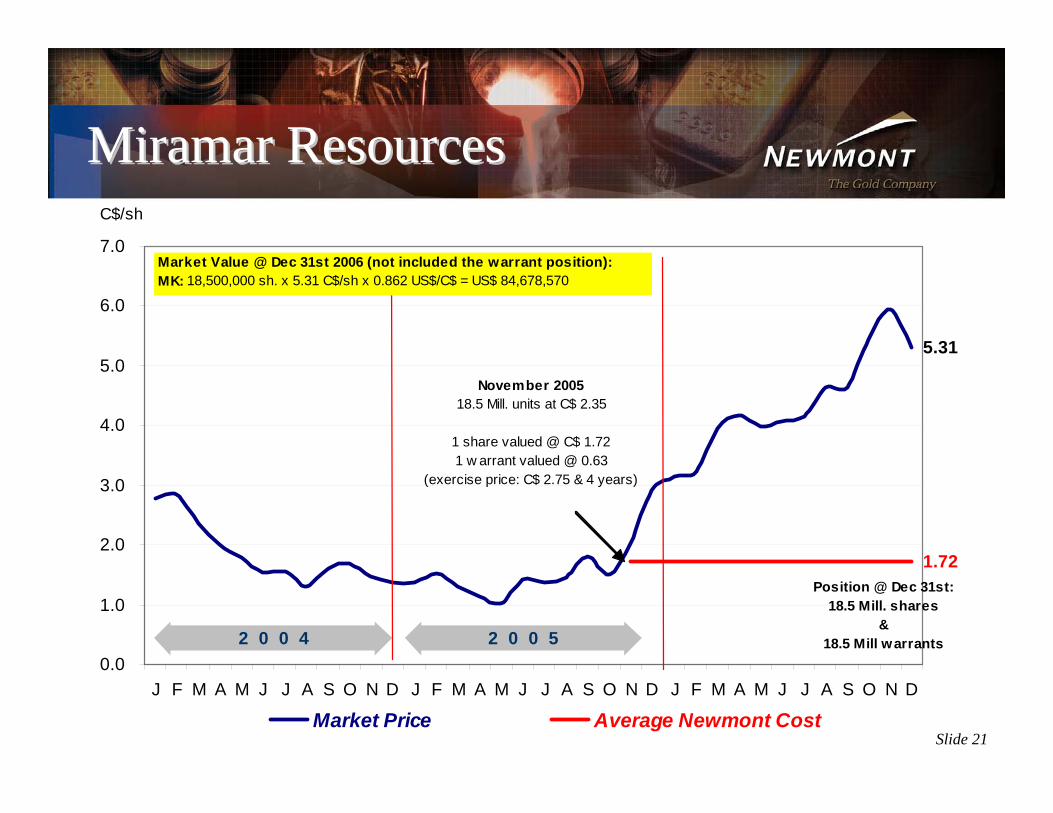
Miramar ResourcesMiramar Resources
5.31
1.72
0.0
1.0
2.0
3.0
4.0
5.0
6.0
7.0
J F M A M J J A S O N D J F M A M J J A S O N D J F M A M J J A S O N D
C$/sh
Market Price Average Newmont Cost
2 0 0 4 2 0 0 5
November 200518.5 Mill. units at C$ 2.35
1 share valued @ C$ 1.721 w arrant valued @ 0.63
(exercise price: C$ 2.75 & 4 years)
Position @ Dec 31st:18.5 Mill. shares
&18.5 Mill warrants
Market Value @ Dec 31st 2006 (not included the warrant position):MK: 18,500,000 sh. x 5.31 C$/sh x 0.862 US$/C$ = US$ 84,678,570
Slide 22
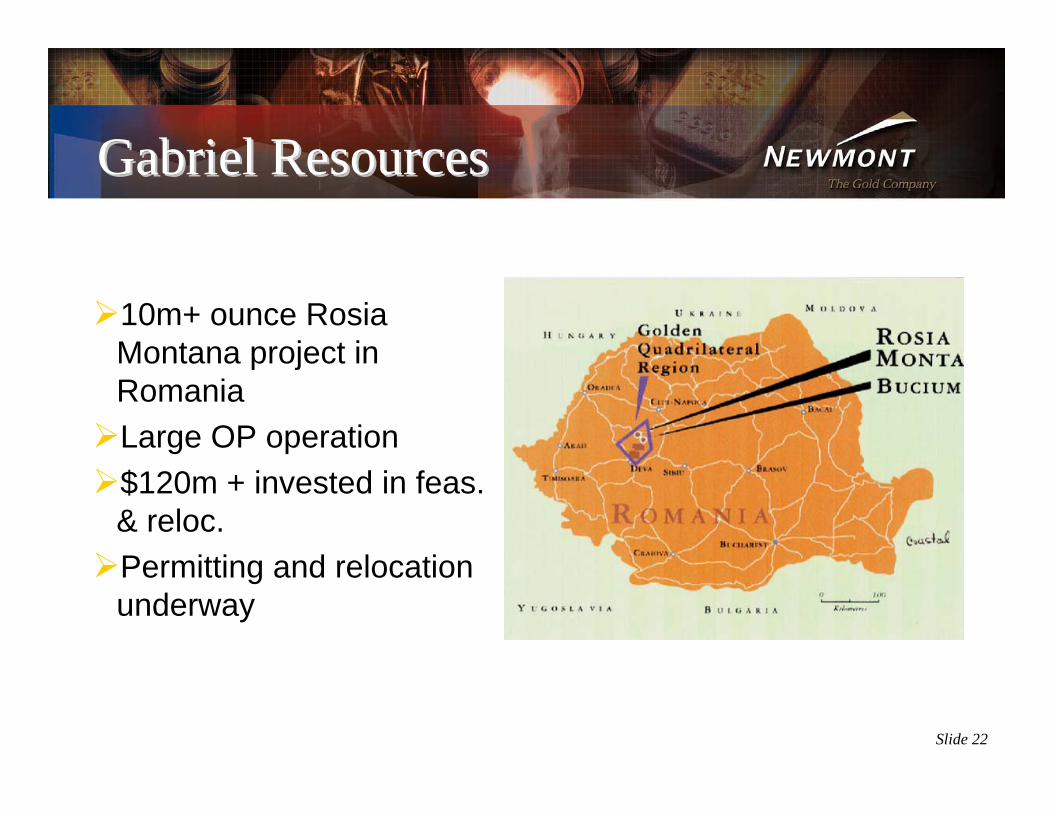
10m+ ounce RosiaMontana project in RomaniaLarge OP operation$120m + invested in feas. & reloc.Permitting and relocation underway
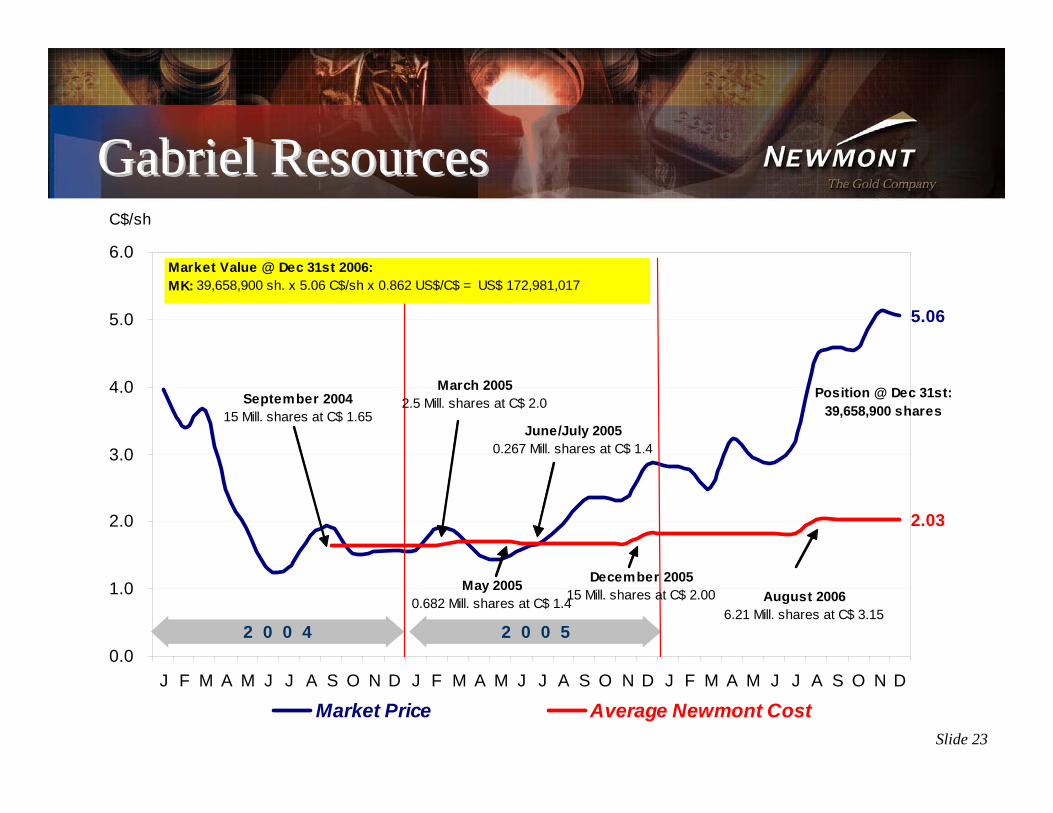
Gabriel ResourcesGabriel Resources
Slide 23
Gabriel ResourcesGabriel Resources
5.06
2.03
0.0
1.0
2.0
3.0
4.0
5.0
6.0
J F M A M J J A S O N D J F M A M J J A S O N D J F M A M J J A S O N D
C$/sh
Market Price Average Newmont Cost
2 0 0 4 2 0 0 5
September 200415 Mill. shares at C$ 1.65
March 20052.5 Mill. shares at C$ 2.0
May 20050.682 Mill. shares at C$ 1.4
December 200515 Mill. shares at C$ 2.00
June/July 20050.267 Mill. shares at C$ 1.4
Position @ Dec 31st:39,658,900 shares
August 20066.21 Mill. shares at C$ 3.15
Market Value @ Dec 31st 2006:MK: 39,658,900 sh. x 5.06 C$/sh x 0.862 US$/C$ = US$ 172,981,017
Slide 24
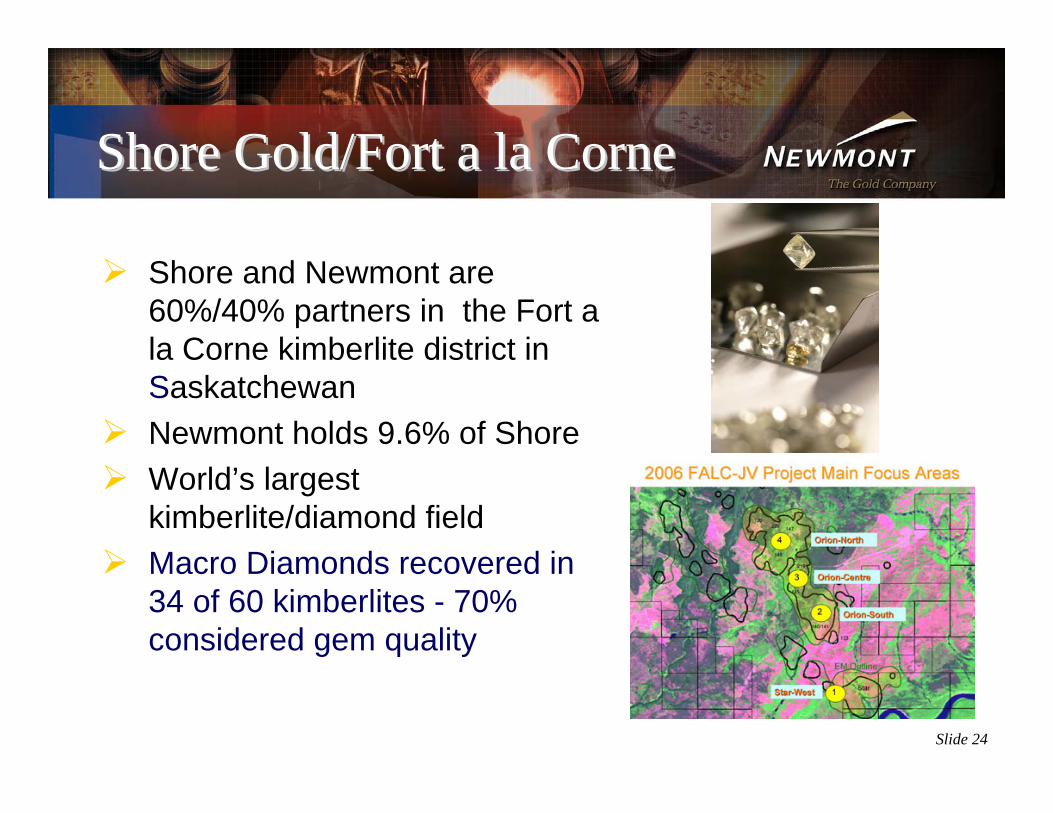
Shore Gold/Fort a la CorneShore Gold/Fort a la Corne
Shore and Newmont are 60%/40% partners in the Fort a la Corne kimberlite district in Saskatchewan Newmont holds 9.6% of ShoreWorld’s largest kimberlite/diamond fieldMacro Diamonds recovered in 34 of 60 kimberlites - 70% considered gem quality
Slide 25
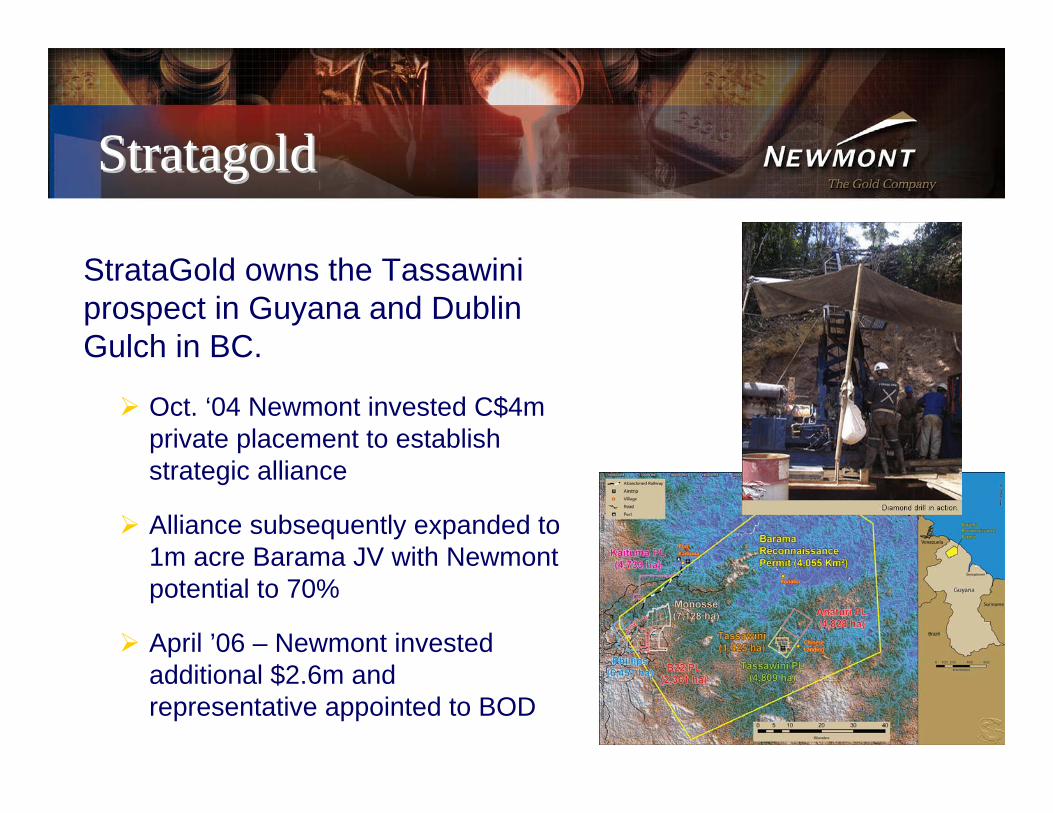
StratagoldStratagold
StrataGold owns the Tassawiniprospect in Guyana and Dublin Gulch in BC.
Oct. ‘04 Newmont invested C$4m private placement to establish strategic alliance
Alliance subsequently expanded to 1m acre Barama JV with Newmont potential to 70%
April ’06 – Newmont invested additional $2.6m and representative appointed to BOD
Slide 26
Agenda
Newmont CapitalNewmont Capital
Investment RationaleInvestment Rationale
Technical Support Technical Support
Select TransactionsSelect Transactions
Transaction DriversTransaction Drivers
Slide 27
Property positions/equity investments
Private placements/public offerings
Not limited to at market deals
Due diligence
Public and private company transactions
TSX/ASX/AIM/AMEX
Creative Merchant BankingCreative Merchant Banking
Slide 28
Endorsement of a strategic investor
Technical support of the industry leading exploration/mining and metallurgical team
Potentially avoid brokerage fees
Flexible transaction structures with creative merchant bankers
Benefit of the experience of a senior operating partner
Partner of ChoicePartner of Choice
Slide 29
Thank YouThank You
Paul BrinkDirector
Newmont Capital(416) 480 6495