Pdac final-low-res
25
THE GRADE MAKING Metro Toronto Convention Centre March 6 – March 9, 2016 Toronto, Canada Booth 2724
-
Upload
semafocorporate -
Category
Investor Relations
-
view
256 -
download
0
Transcript of Pdac final-low-res
THE GRADEMAKING
Metro Toronto Convention Centre
March 6 – March 9, 2016
Toronto, Canada
Booth 2724
2
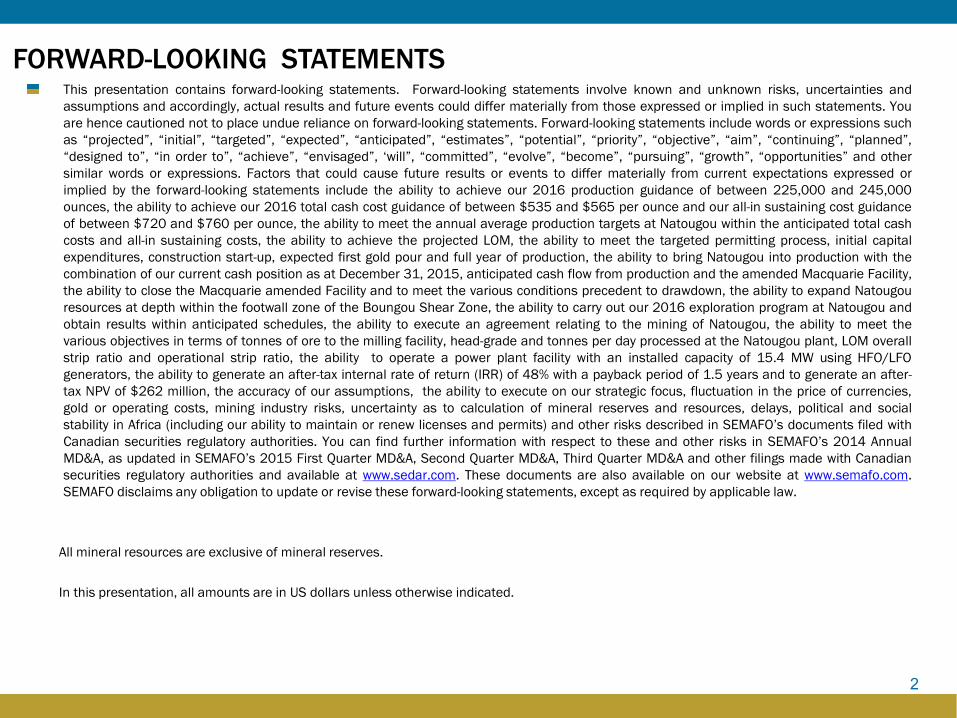
FORWARD-LOOKING STATEMENTSThis presentation contains forward-looking statements. Forward-looking statements involve known and unknown risks, uncertainties and
assumptions and accordingly, actual results and future events could differ materially from those expressed or implied in such statements. You
are hence cautioned not to place undue reliance on forward-looking statements. Forward-looking statements include words or expressions such
as “projected”, “initial”, “targeted”, “expected”, “anticipated”, “estimates”, “potential”, “priority”, “objective”, “aim”, “continuing”, “planned”,
“designed to”, “in order to”, “achieve”, “envisaged”, ‘will”, “committed”, “evolve”, “become”, “pursuing”, “growth”, “opportunities” and other
similar words or expressions. Factors that could cause future results or events to differ materially from current expectations expressed or
implied by the forward-looking statements include the ability to achieve our 2016 production guidance of between 225,000 and 245,000
ounces, the ability to achieve our 2016 total cash cost guidance of between $535 and $565 per ounce and our all-in sustaining cost guidance
of between $720 and $760 per ounce, the ability to meet the annual average production targets at Natougou within the anticipated total cash
costs and all-in sustaining costs, the ability to achieve the projected LOM, the ability to meet the targeted permitting process, initial capital
expenditures, construction start-up, expected first gold pour and full year of production, the ability to bring Natougou into production with the
combination of our current cash position as at December 31, 2015, anticipated cash flow from production and the amended Macquarie Facility,
the ability to close the Macquarie amended Facility and to meet the various conditions precedent to drawdown, the ability to expand Natougou
resources at depth within the footwall zone of the Boungou Shear Zone, the ability to carry out our 2016 exploration program at Natougou and
obtain results within anticipated schedules, the ability to execute an agreement relating to the mining of Natougou, the ability to meet the
various objectives in terms of tonnes of ore to the milling facility, head-grade and tonnes per day processed at the Natougou plant, LOM overall
strip ratio and operational strip ratio, the ability to operate a power plant facility with an installed capacity of 15.4 MW using HFO/LFO
generators, the ability to generate an after-tax internal rate of return (IRR) of 48% with a payback period of 1.5 years and to generate an after-
tax NPV of $262 million, the accuracy of our assumptions, the ability to execute on our strategic focus, fluctuation in the price of currencies,
gold or operating costs, mining industry risks, uncertainty as to calculation of mineral reserves and resources, delays, political and social
stability in Africa (including our ability to maintain or renew licenses and permits) and other risks described in SEMAFO’s documents filed with
Canadian securities regulatory authorities. You can find further information with respect to these and other risks in SEMAFO’s 2014 Annual
MD&A, as updated in SEMAFO’s 2015 First Quarter MD&A, Second Quarter MD&A, Third Quarter MD&A and other filings made with Canadian
securities regulatory authorities and available at www.sedar.com. These documents are also available on our website at www.semafo.com.
SEMAFO disclaims any obligation to update or revise these forward-looking statements, except as required by applicable law.
All mineral resources are exclusive of mineral reserves.
In this presentation, all amounts are in US dollars unless otherwise indicated.
3
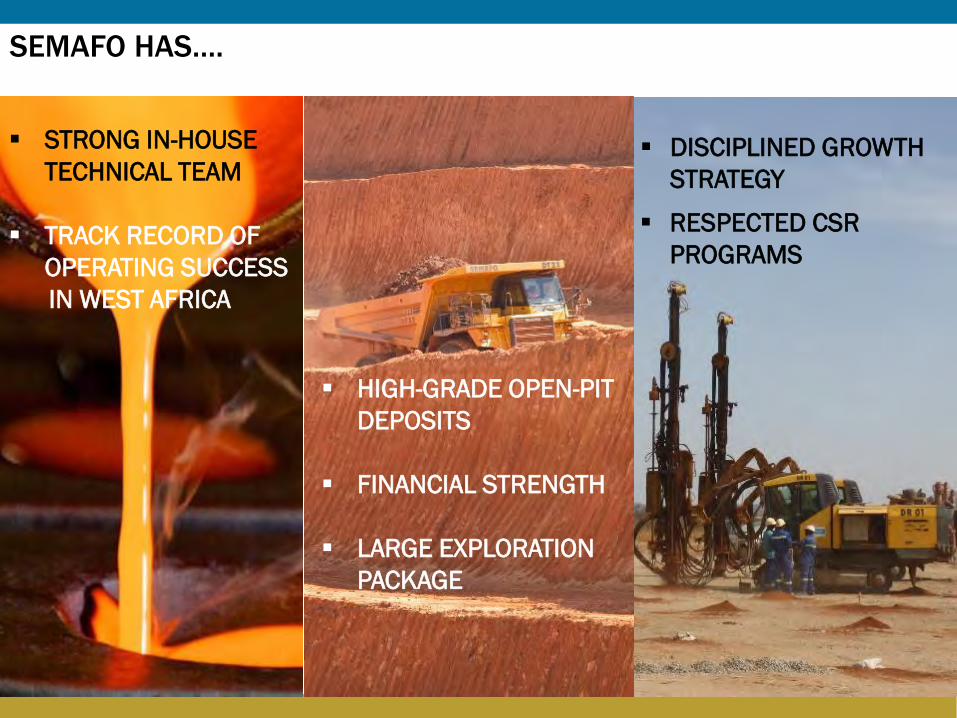
SEMAFO HAS….
STRONG IN-HOUSE
TECHNICAL TEAM
TRACK RECORD OF
OPERATING SUCCESS
IN WEST AFRICA
HIGH-GRADE OPEN-PIT
DEPOSITS
FINANCIAL STRENGTH
LARGE EXPLORATION
PACKAGE
RESPECTED CSR
PROGRAMS
DISCIPLINED GROWTH
STRATEGY

4
6,605km2
in Burkina Faso
over three prospective belts
MANAMinein Burkina Faso
20years
Commissioned
3 mines in West Africaover
LONG STANDING PRESENCE IN WEST AFRICA
NATOUGOUFeasibility Study Completed
Targeted Production H2 2018
Burkina Faso
Mana
BANFORA GOLD BELT
PERMITS
Ouagadougou(Capital)
Inata
Essakane
Bissa
Taparko
Youga
SEMAFO propertyOther minesElectric line
Korhogo
Natougou
Nabanga
Bantou
55
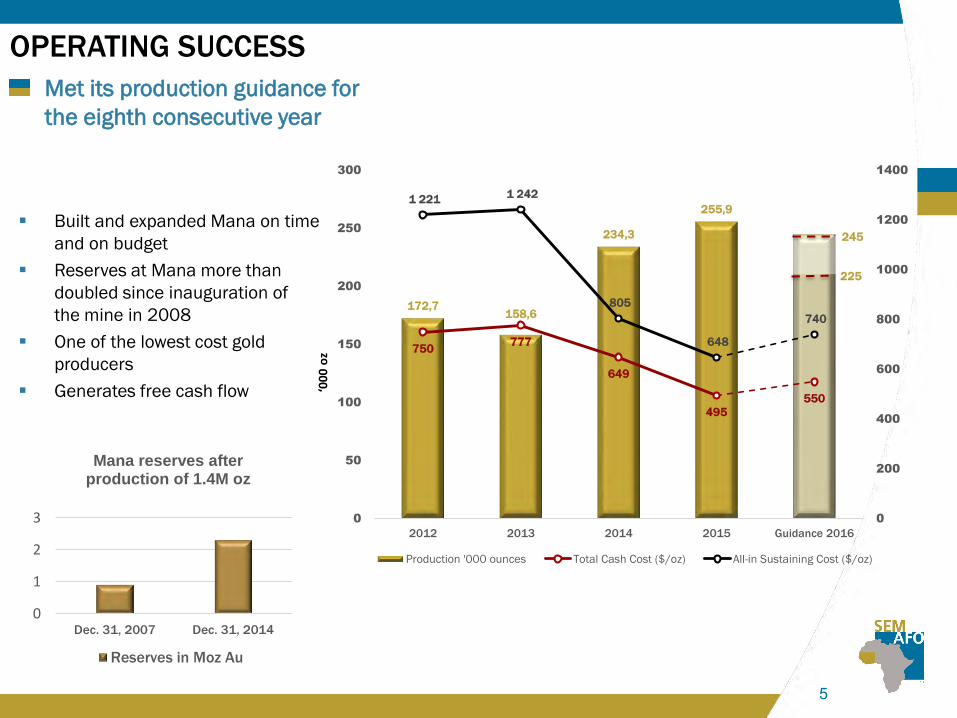
172,7158,6
234,3
255,9
750777
649
495
550
1 221 1 242
805
648
740
0
200
400
600
800
1000
1200
1400
0
50
100
150
200
250
300
2012 2013 2014 2015 Guidance 2016
Production '000 ounces Total Cash Cost ($/oz) All-in Sustaining Cost ($/oz)
OPERATING SUCCESS
Met its production guidance for
the eighth consecutive year
0
1
2
3
Dec. 31, 2007 Dec. 31, 2014
Mana reserves after production of 1.4M oz
Reserves in Moz Au
245
225
‘00
0 o
z
Built and expanded Mana on time
and on budget
Reserves at Mana more than
doubled since inauguration of
the mine in 2008
One of the lowest cost gold
producers
Generates free cash flow
66
$0
$200
$400
$600
$800
$1 000
$1 200
$1 400
PRU GSC TMM TGZ ASR AR HL MND AUY ACA AGI NEM SSRI KGC OGC CG ELD ABX EDV CDE BTO DGC P AEM GG SMF
AISC TCC
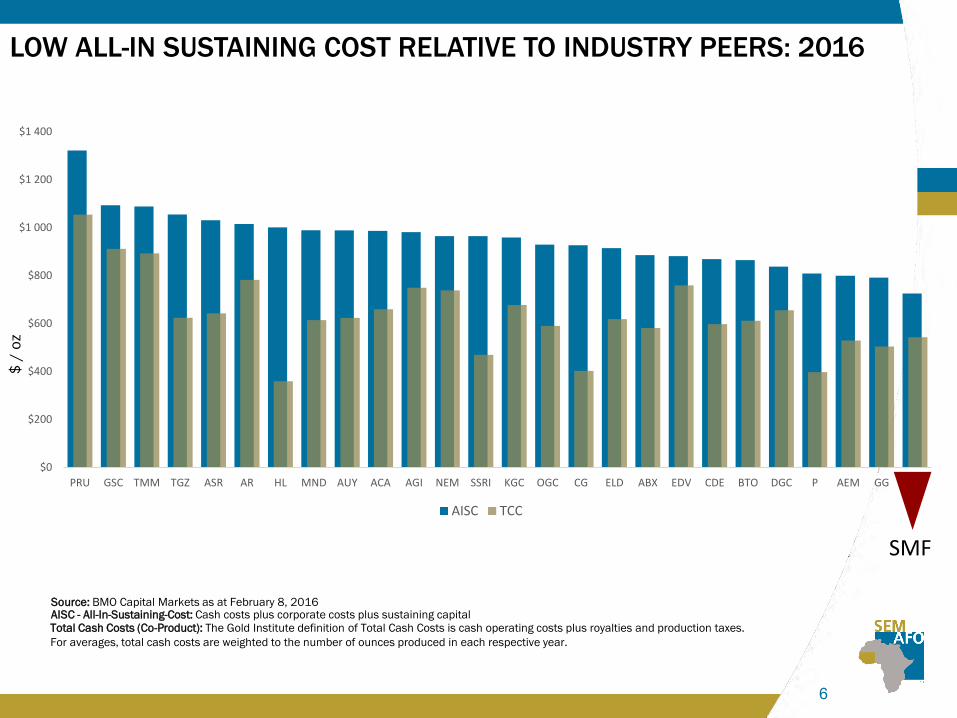
LOW ALL-IN SUSTAINING COST RELATIVE TO INDUSTRY PEERS: 2016
Source: BMO Capital Markets as at February 8, 2016
$ /
oz
AISC - All-In-Sustaining-Cost: Cash costs plus corporate costs plus sustaining capitalTotal Cash Costs (Co-Product): The Gold Institute definition of Total Cash Costs is cash operating costs plus royalties and production taxes.
For averages, total cash costs are weighted to the number of ounces produced in each respective year.
SMF
7
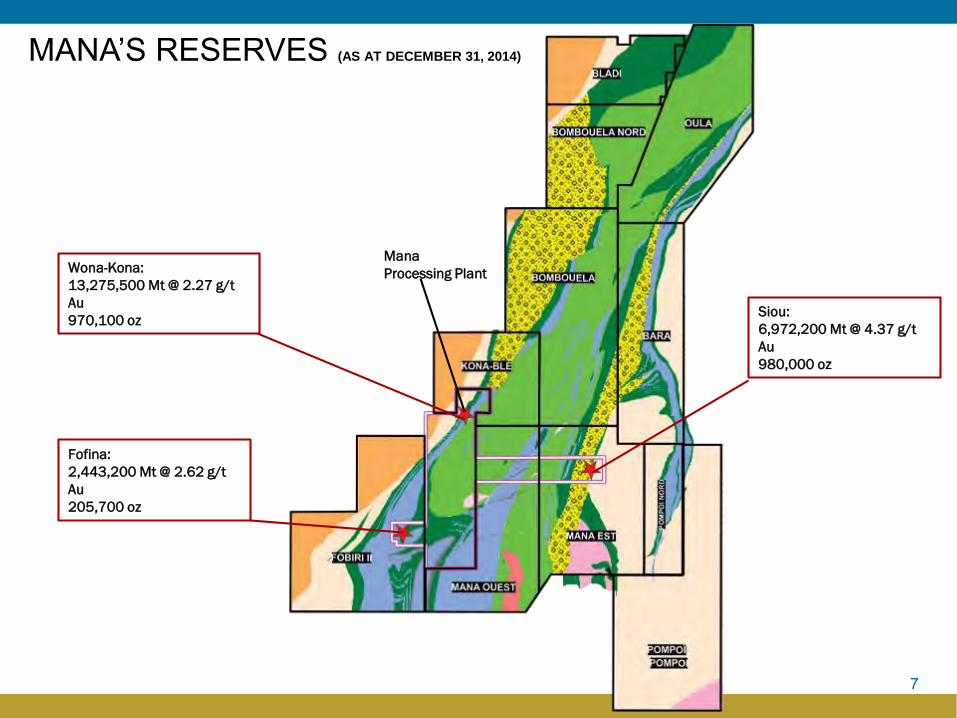
MANA’S RESERVES (AS AT DECEMBER 31, 2014)
Wona-Kona:
13,275,500 Mt @ 2.27 g/t
Au
970,100 oz
Fofina:
2,443,200 Mt @ 2.62 g/t
Au
205,700 oz
Siou:
6,972,200 Mt @ 4.37 g/t
Au
980,000 oz
Mana
Processing Plant
8
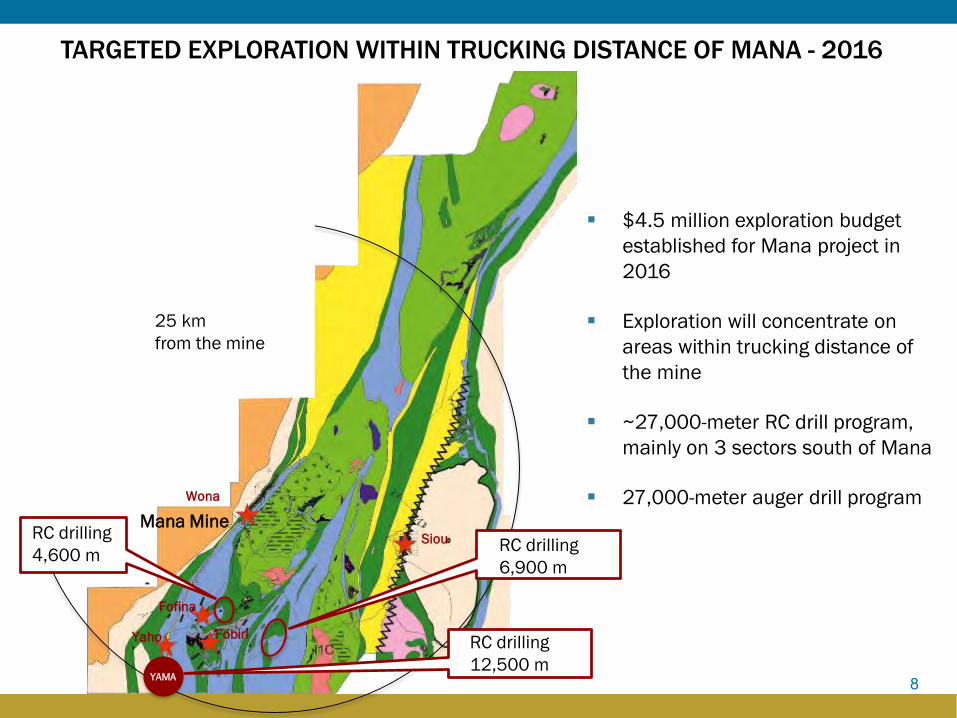
TARGETED EXPLORATION WITHIN TRUCKING DISTANCE OF MANA - 2016
25 km
from the mine
$4.5 million exploration budget
established for Mana project in
2016
Exploration will concentrate on
areas within trucking distance of
the mine
~27,000-meter RC drill program,
mainly on 3 sectors south of Mana
27,000-meter auger drill programMana Mine
Wona
Siou
Fofina
FobiriYaho
YAMA
RC drilling
4,600 mRC drilling
6,900 m
RC drilling
12,500 m
9
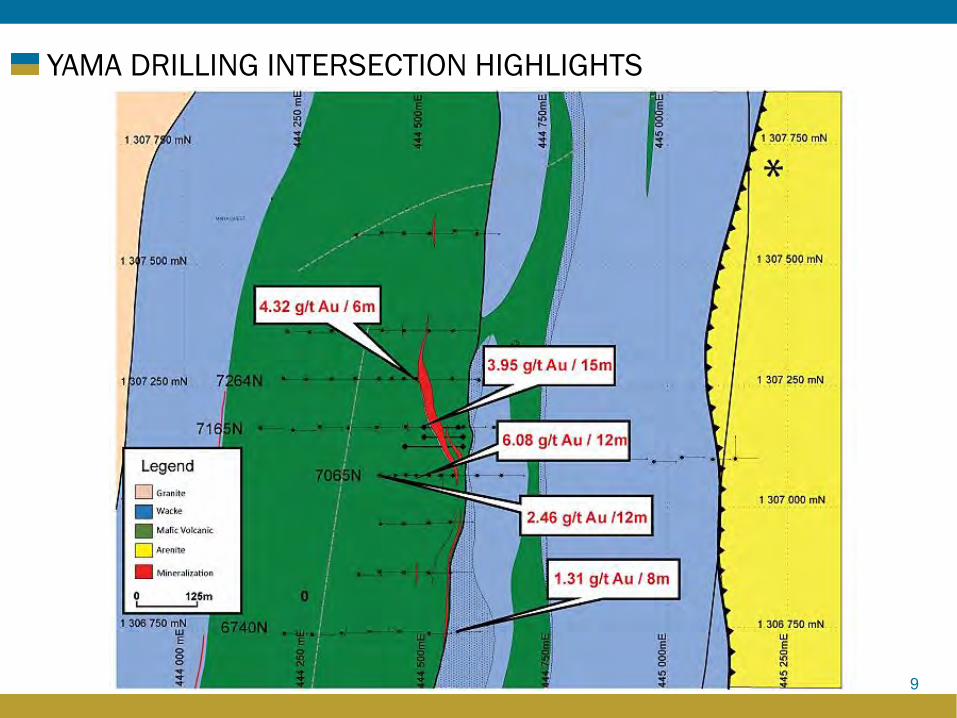
YAMA DRILLING INTERSECTION HIGHLIGHTS
NATOUGOU: OUR NEW QUALITY ASSET

11
POSITIVE FEASIBILITY STUDY HIGHLIGHTS
During the first three years,
• Average annual production of more than 226,000 ounces
• Average total cash cost of $283/oz and AISC of $374/oz
• Average head grade 5.72 g/t at a gold recovery rate of 93.8%
Projected LOM total cash cost of $408/oz and all-in sustaining
cost of $518/oz
Maiden open pit mineral reserves of 9.6 million tonnes at a
grade of 4.15 g/t Au for 1,276,000 ounces of gold
Initial CAPEX: $219 million
First gold pour
H2 2018
Project economics at $1,100/oz:
• After-tax NPV 5%: $262 million
• After-tax IRR: 48%
• Payback period: 1.5 years
Production of some 1.2 million ounces over a
projected LOM in excess of 7 years
1212
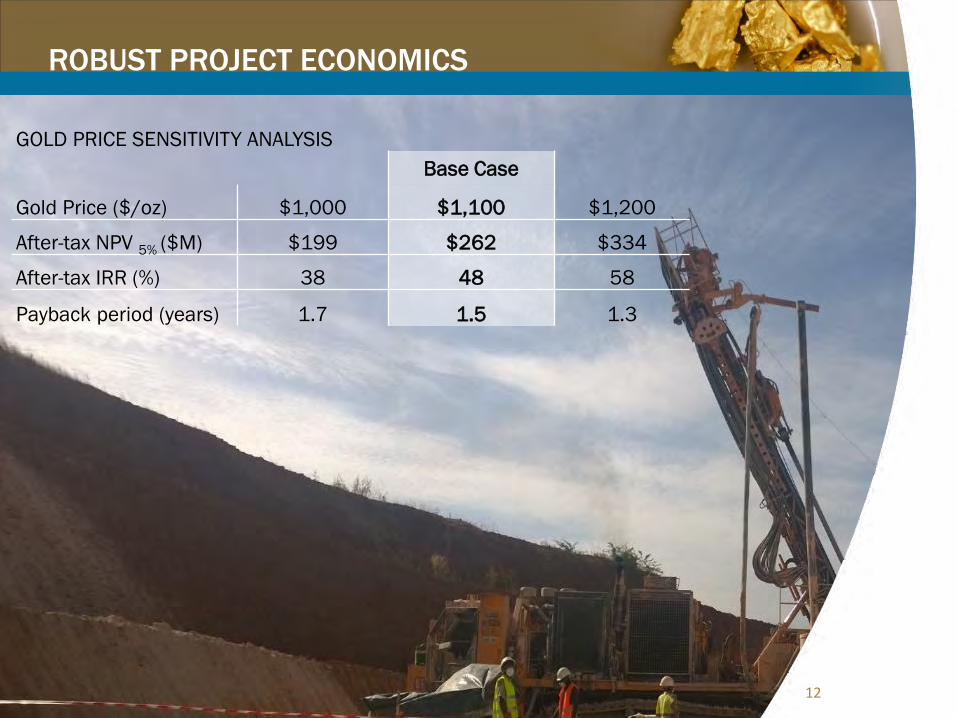
ROBUST PROJECT ECONOMICS
GOLD PRICE SENSITIVITY ANALYSIS
Base Case
Gold Price ($/oz) $1,000 $1,100 $1,200
After-tax NPV 5% ($M) $199 $262 $334
After-tax IRR (%) 38 48 58
Payback period (years) 1.7 1.5 1.3
13
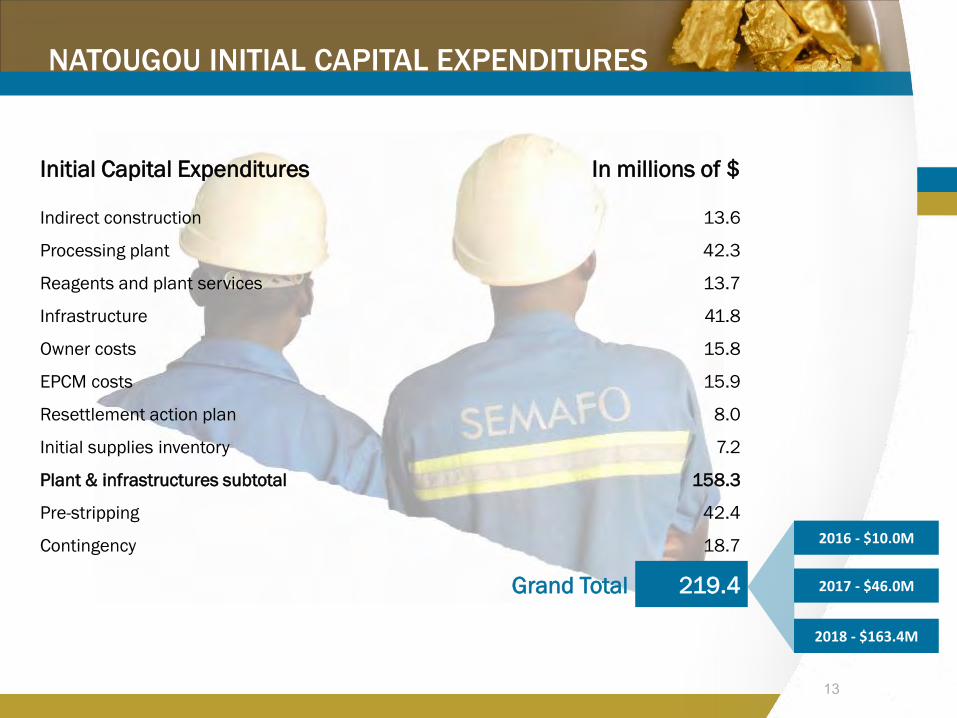
NATOUGOU INITIAL CAPITAL EXPENDITURES
Initial Capital Expenditures In millions of $
Indirect construction 13.6
Processing plant 42.3
Reagents and plant services 13.7
Infrastructure 41.8
Owner costs 15.8
EPCM costs 15.9
Resettlement action plan 8.0
Initial supplies inventory 7.2
Plant & infrastructures subtotal 158.3
Pre-stripping 42.4
Contingency 18.7
Grand Total 219.4
2016 - $10.0M
2017 - $46.0M
2018 - $163.4M
14
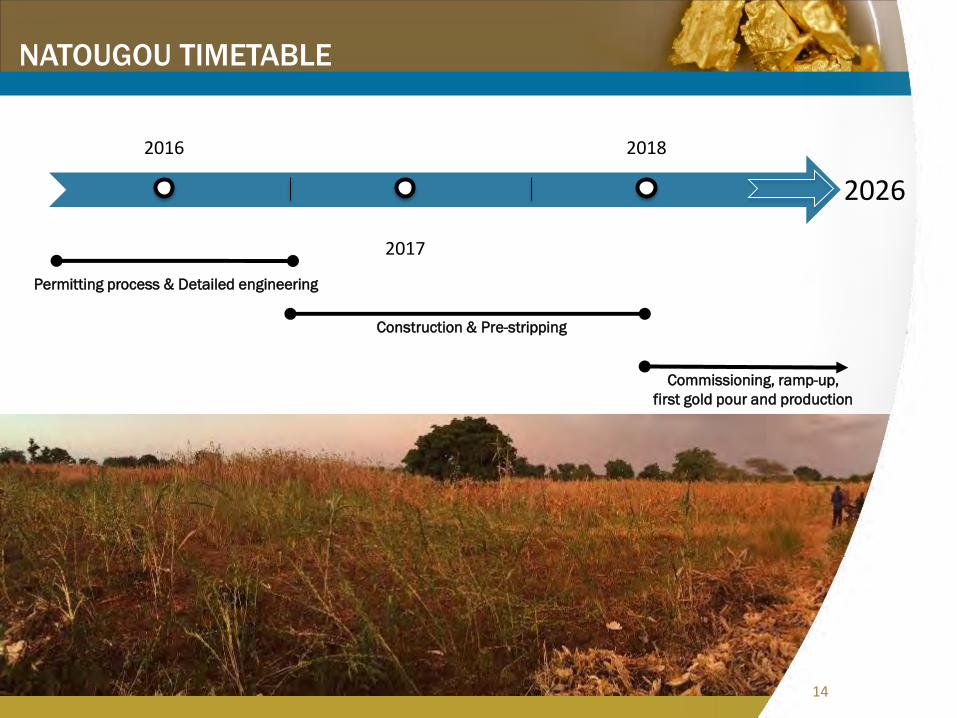
2016
2017
2018
NATOUGOU TIMETABLE
Permitting process & Detailed engineering
2026
Construction & Pre-stripping
17
Commissioning, ramp-up,
first gold pour and production
14
15
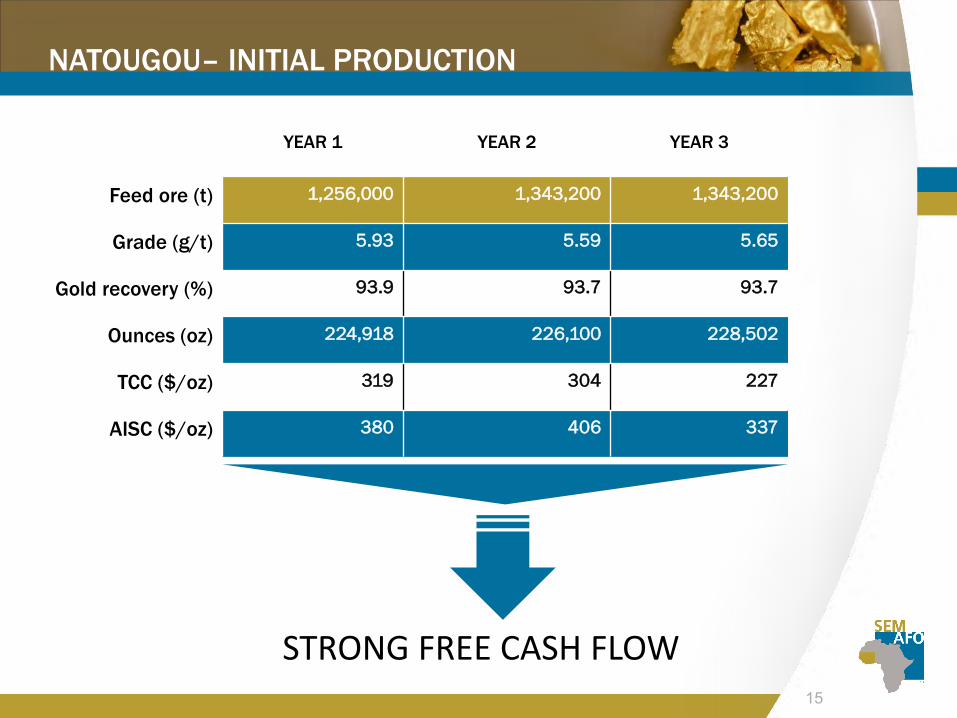
NATOUGOU– INITIAL PRODUCTION
YEAR 1 YEAR 2 YEAR 3
Feed ore (t) 1,256,000 1,343,200 1,343,200
Grade (g/t) 5.93 5.59 5.65
Gold recovery (%) 93.9 93.7 93.7
Ounces (oz) 224,918 226,100 228,502
TCC ($/oz) 319 304 227
AISC ($/oz) 380 406 337
STRONG FREE CASH FLOW
16
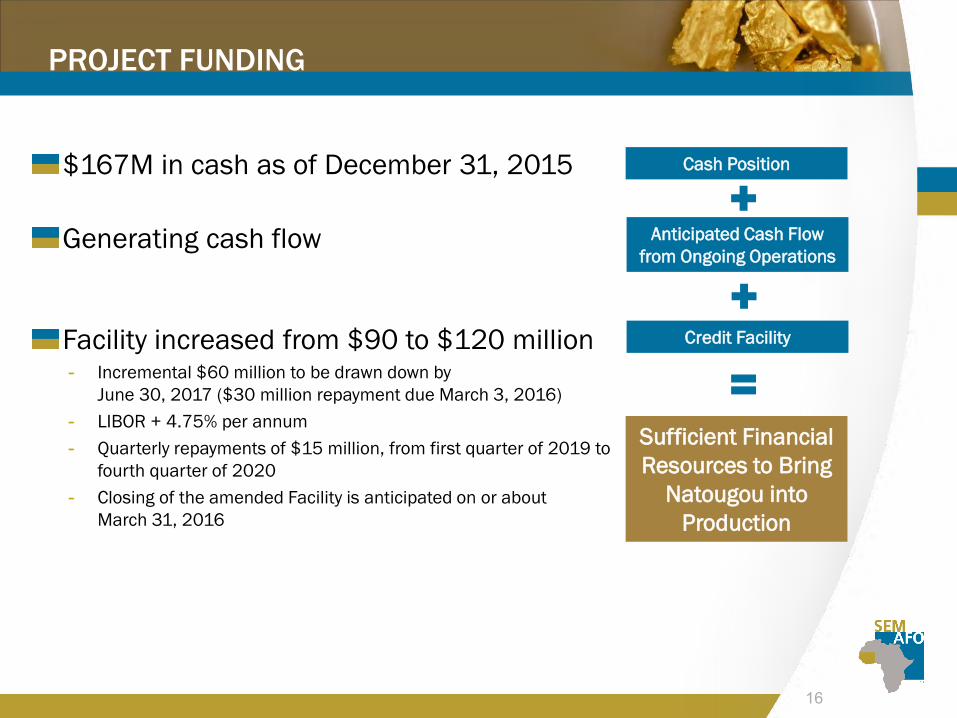
PROJECT FUNDING
Facility increased from $90 to $120 million- Incremental $60 million to be drawn down by
June 30, 2017 ($30 million repayment due March 3, 2016)
- LIBOR + 4.75% per annum
- Quarterly repayments of $15 million, from first quarter of 2019 to
fourth quarter of 2020
- Closing of the amended Facility is anticipated on or about
March 31, 2016
Anticipated Cash Flow
from Ongoing Operations
Credit Facility
Cash Position
Sufficient Financial
Resources to Bring
Natougou into
Production
Generating cash flow
$167M in cash as of December 31, 2015
17
NATOUGOU: AN UNDEREXPLORED PROPERTY
Prior to the acquisition, Natougou had seen little near-pit or
regional exploration
Focus on in-fill drilling for the feasibility study in 2015
Regional and proximal exploration only commenced a few
months ago
773 km2 of exploration ground
Objective is to expand
reserves and resources
to further improve economics
18
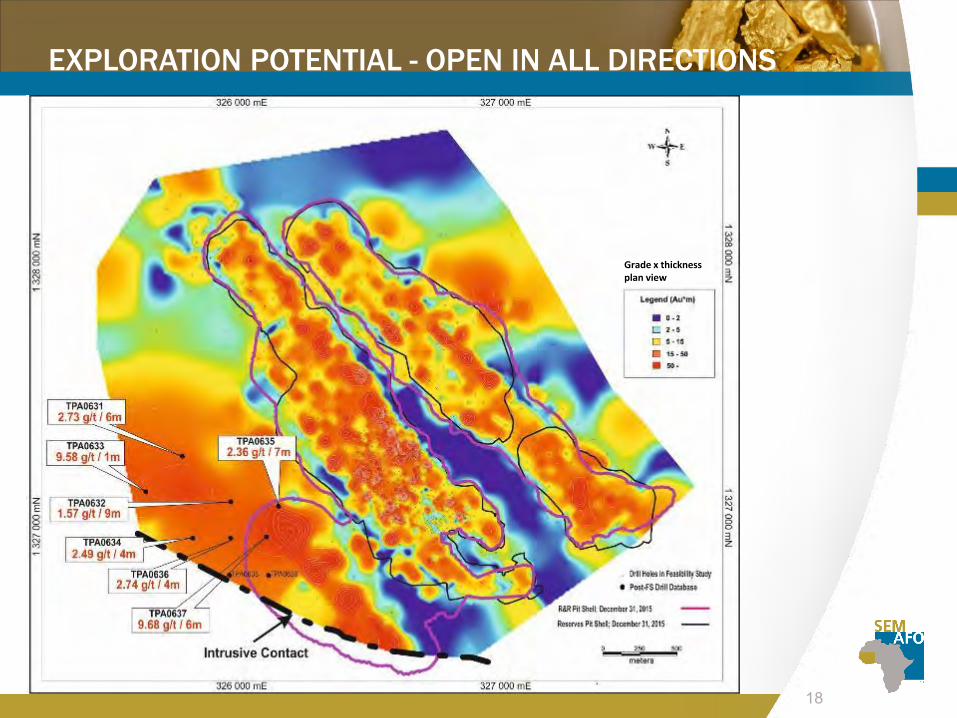
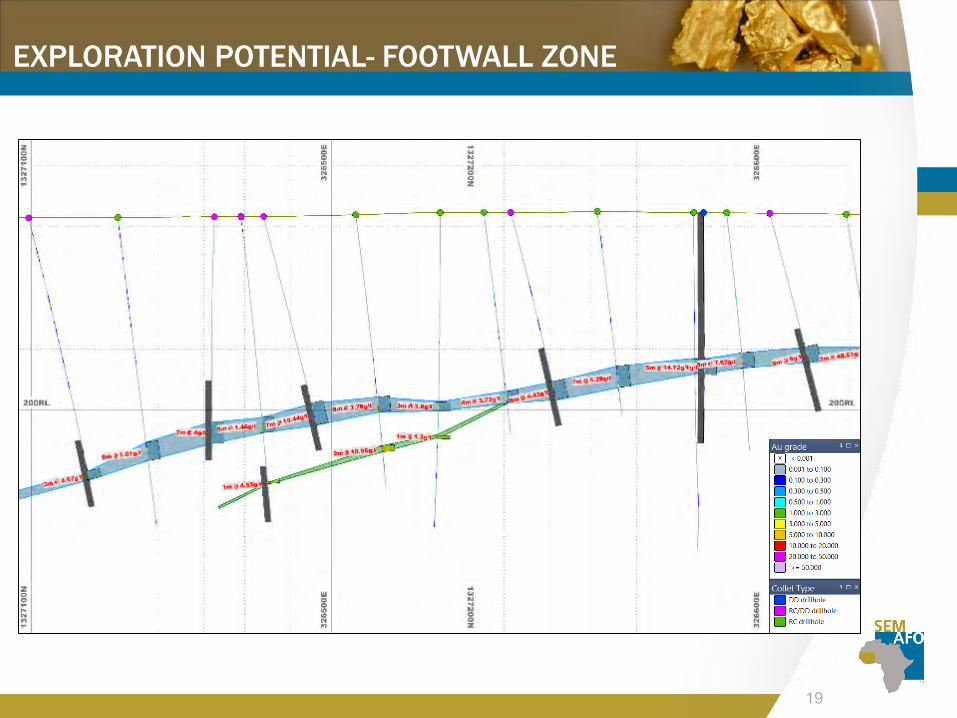
EXPLORATION POTENTIAL - OPEN IN ALL DIRECTIONS
Grade x thicknessplan view
19
EXPLORATION POTENTIAL- FOOTWALL ZONE
20
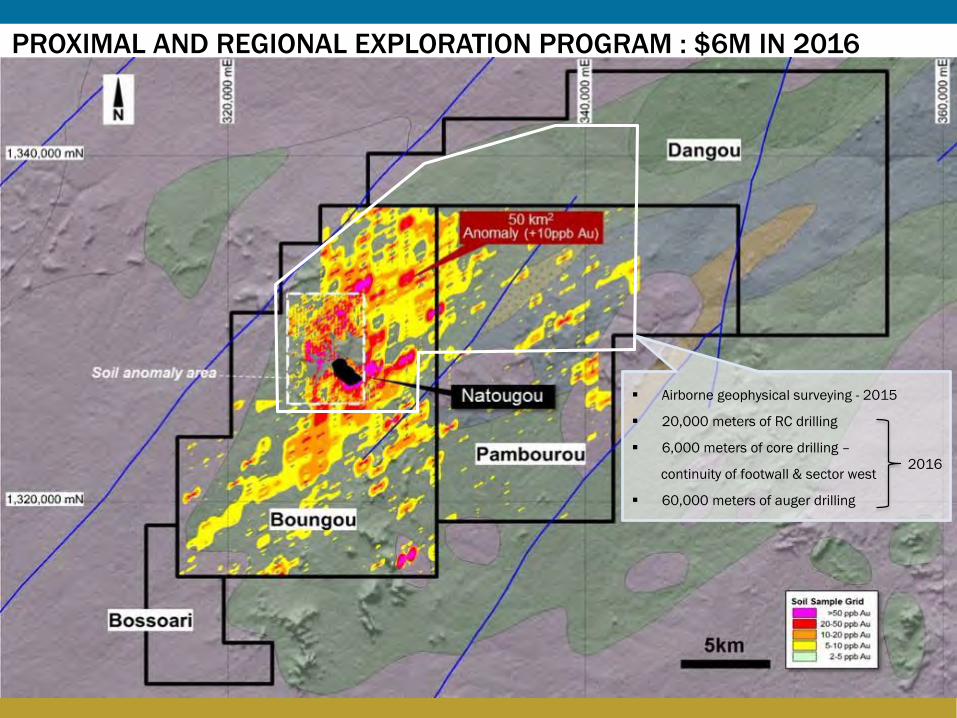
PROXIMAL AND REGIONAL EXPLORATION PROGRAM : $6M IN 2016
Airborne geophysical surveying - 2015
20,000 meters of RC drilling
6,000 meters of core drilling –
continuity of footwall & sector west
60,000 meters of auger drilling
2016
2121
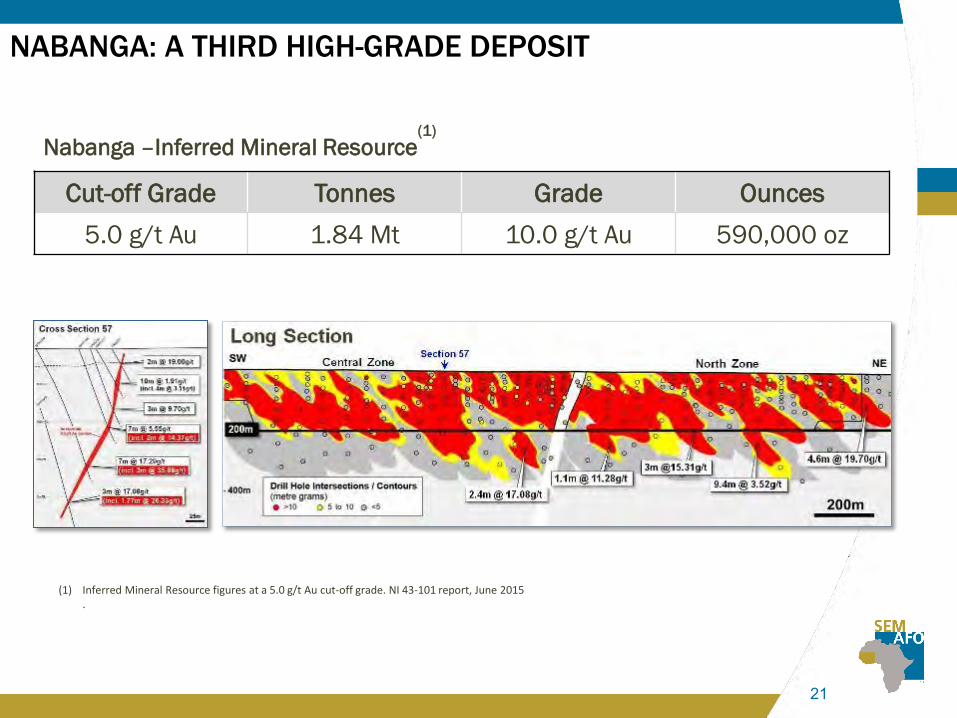
NABANGA: A THIRD HIGH-GRADE DEPOSIT
Nabanga –Inferred Mineral Resource(1)
Cut-off Grade Tonnes Grade Ounces
5.0 g/t Au 1.84 Mt 10.0 g/t Au 590,000 oz
(1) Inferred Mineral Resource figures at a 5.0 g/t Au cut-off grade. NI 43-101 report, June 2015.
22
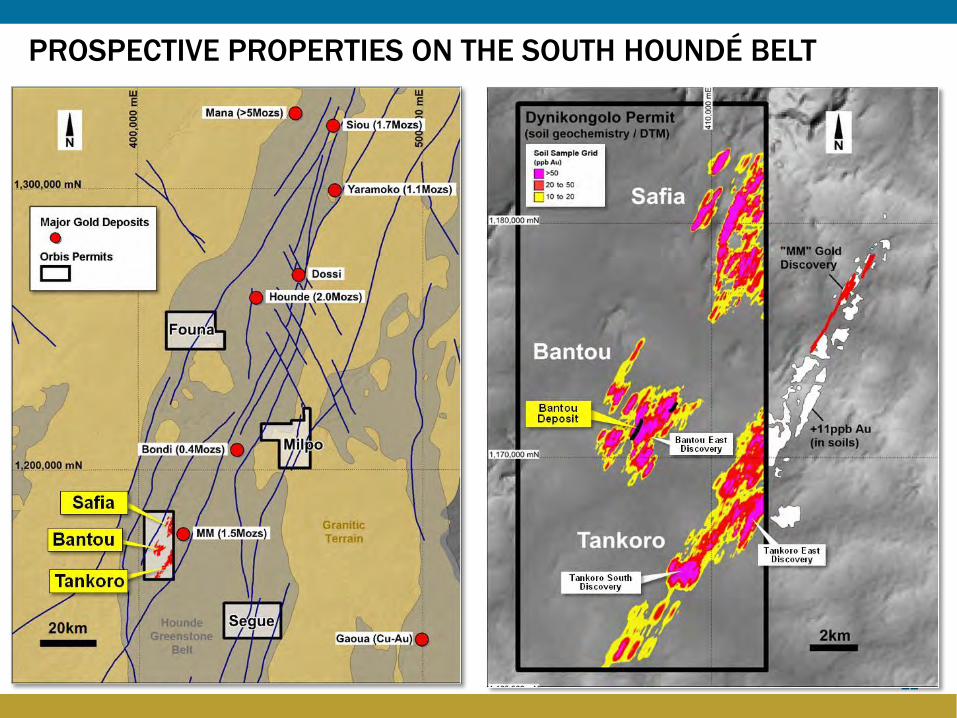
PROSPECTIVE PROPERTIES ON THE SOUTH HOUNDÉ BELT

23
Côte d’IvoireHighly mineralised greenstone belts
Korhogo ProjectAlong strike from Tongon Mine - priority targets
EXPLORATION UPSIDE: ACQUIRED PERMITS IN CÔTE D’IVOIRE
Korhogo Permit /Application
Korhogo East Application
Korhogo West Permit
Target Corridor
Fapoha South (Randgold)
Fapoha North (Randgold)
Gold Mine
Gold Deposits
Target Corridor
THE GRADEMAKING
24
2016 PRIORITIES
NATOUGOU
Completing detailed engineering in Q4
Completing the permitting process and
starting construction by year-end
Exploration with the aim of increasing
reserves and resources to further
improve economics
MANA
Delivering our production and cost
guidance for a ninth consecutive year
Exploration within trucking distance of
the Mine

25
National Workforce Development Program -
Training of promising national employees for
management or trainer posts
SEMAFO Foundation -
Six years of activities bolster our ability to
establish strong relations with communitiesTraining – 10,000 hours of training
were dispensed in 2014, of which 75%
benefited our Burkinabe employees
Strong Safety Record -
Accident frequency rate of 1.88 per 200,000
hours worked as of December 31, 2015