Pareto TGS Final 09 01 2009 · Pareto Oil & Offshore Conference Oslo Norway- September 2-3, 2009...
46
1 TGS-NOPEC Geophysical Company Pareto Oil & Offshore Conference Oslo Norway- September 2-3, 2009 Robert Hobbs – Chief Executive Officer TGS-NOPEC Geophysical
Transcript of Pareto TGS Final 09 01 2009 · Pareto Oil & Offshore Conference Oslo Norway- September 2-3, 2009...

1
TGS-NOPEC Geophysical Company
Pareto Oil & Offshore ConferenceOslo Norway- September 2-3, 2009
Robert Hobbs – Chief Executive Officer
TGS-NOPEC Geophysical

2
Forward-Looking Statements
All statements is this presentation other than statements of historical fact, are forward-looking statements, which are
subject to a number of risks, uncertainties, and assumptions that are difficult to predict and are based upon assumptions
as to future events that may not prove accurate. These factors include TGS’ reliance on a cyclical industry and principle customers, TGS’ ability to continue to expand
markets for licensing of data, and TGS’ ability to acquire and process data products at costs commensurate with
profitability. Actual results may differ materially from those expected or projected in the forward-looking statements.
TGS undertakes no responsibility or obligation to update or alter forward-looking statements for any reason.

3
TGS Profile
Leading provider of multi-client seismic data and related geoscientific products to the oil & gas industry.
Main offices: Houston and Asker, Norway Regional offices: London, Stavanger, Perth, Moscow
Fundamental values: Quality, Service, Growth
Approximately 625 employees
Traded on Oslo Stock Exchange, Mkt Cap: ~$1.3 billion

4
TGS Business ModelMulti-Client Business Model
Data sold as a Product – not a ServiceClients (Oil companies) license the data at a fraction of the cost vs. owning the data themselvesTGS Develops, Manages, Owns and Controls the data
Allows for TGS to add value and re-license the data to clients
TGS financial risk mitigated by obtaining pre-funding commitments prior to commencement of a projectAllows volume pricing – much higher longer-term earnings potential than contract seismic model
Approximately 90 - 95% of TGS Business Is Multi-client

5
TGS Philosophy
Differentiation and Value are created by controlling uniquehigh-quality data in the right place at the right time

6
TGS Core Businesses
Geophysical Geological Imaging Services
2D Seismic3D Seismic Wide Azimuth SeismicAeromagneticsGravityElectromag (CSEM)Multi-beam
Seismic processingHigh end depth imaging Proprietary technology Ongoing R&D investmentContract business model
Digital well dataProduction dataCore dataRegional geologic interpretationsFacies Map Browser
Interpretive contract services

7
6M 2009 vs. 6M 2008 Net Revenue Breakdown6M 20086M 2009

8
3-year Geographical Net Revenue Breakdown

9
Q2 2009 Financial Highlights
Gross Sales volume up 4% compared to Q2 2008
Net Late Sales 84.5 MUSD, up 6% from Q2 2008
Net prefunding covered 43% of operational Investments
Proprietary Revenues down 55%, in line with normal business model
Net Revenues 124.1 MUSD, 7% below Q2 2008
Cash flow from operations before investments USD 44.5 millonvs USD 27.7 million in Q2 2008

10
6M 2009 Financial Highlights
Net Revenues 194.9 MUSD, down 19% from 6M 2008
48% Prefunding
MC Amortization rate 43%
EBIT Margin 38% of Net Revenues
All interest-bearing debt repaid in full on May 5th
Equity is 74% of total assets

11
Balance Sheet – Key Figures
AssetsCashInvestments Available for SaleOther Current AssetsTotal Current AssetsIntangible Assets & LT ReceivablesMC LibraryFixed AssetsTotal Assets
LiabilitiesShort-term debtCurrent LiabilitiesLong-term loansDeferred Tax LiabilityEquity
6/30/2009 % 3/31/2009 % 12/31/2008 %
184.7 19%
466.7 48%241.2 25%
90.9 9%
972.8 100%18.0 2%
397.2 41%
199.6 21%- 0%
54.1 6%0.0 0%
719.1 74%
0.0
228.6 25%
163.7 18%438.9 48%95.1 10%
19.7 2%366.0 40%
919.6 100%
44.9 5%143.1 16%
0%56.1 6%
675.5 73%
148.3 16%
298.1 31%497.5 52%99.1 10%
22.7 2%335.0 35%
954.3 100%
42.9 4%194.7 20%
661.1 69%
0.0 0%55.7 6%
51.1 5%40.7 4% 46.5 5%

12
TGS-NOPEC Geophysical Company
Multi-Client Library

13
MCS Accounting – Matching PrincipleAccounting Standards recommend to match Revenues and Costs in time
TGS capitalizes the direct costs of surveys as investments in the Balance Sheet and amortizes them over 5 years (including the first year – WIP) as a function of expected ratio Sales/Investment
If sales are lower than expectations, a minimum amortization kicks in:
Maximum NBV one year after completion is 60%, then 40%, then 20%, then zeroAt the end of the fourth year after survey completion, each survey is fully amortized

14
Multi-Client Library NBV in % of InvestmentSeismic Surveys as of June 30th 2009
Net Book Value per Vintage vs. allowed NBV at end of 2009
Allowed: 0%
Allowed: 100%
Allowed: 20%
Allowed: 40%
Allowed: 60%
1%18%
33%
43%
63%

15
Q2 2009 Multi-Client Net Revenues & Ending NBVSeismic Surveys
16%
0% 0%4%
6%
10%
4% 5%
14%
30%
57%55%

16
TGS-NOPEC Geophysical Company
New Activities
Geological Products
Geophysical Products
Imaging Services

17
H1 2009 Activity
Office LocationAeromagnetic/gravity
2D Project3D Project

18
New Activity- Gulf of Mexico

19
Central Gulf of Mexico Lease Sale
Total Bidders Compared to Acres Offered
40
50
60
70
80
90
100
2000
2001
2002
2003
2004
2005
2006
2007
2008
2009
2010
est.
# bi
dder
s
10
15
20
25
30
35
40
Mill
ions
acre
s's
offe
red
# of bidders Acre's offered

20
New Activity - GOM WAZ Programs
Freedom16000 km2

21
Freedom16000 km2
Freedom Extension700 km2
New Activity - GOM WAZ Programs

22
New Activity - GOM WAZ Programs
Freedom16000 km2
Liberty3000 km2
Freedom Extension700 km2

23
New Activity - GOM 3D Programs
Hernando 3DPhase 1
Expanded original 300 block survey to 365 OCS blocks (8500 km2)
In cooperation with PGS -costs and revenue on late sales split between parties based on proportional investment
Phase 2 Additional expansion in progress
24
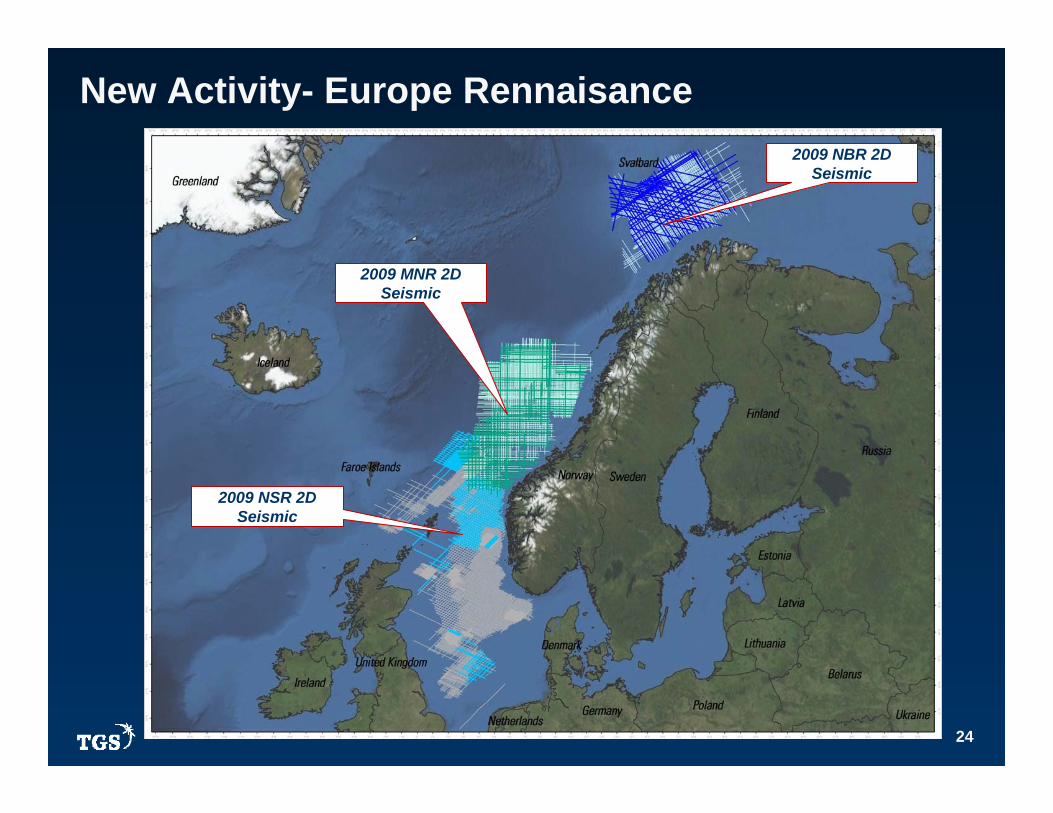
New Activity- Europe Rennaisance2009 NBR 2D
Seismic
2009 MNR 2D Seismic
2009 NSR 2D Seismic

25
New Activity - Barents SeaHoop 3D
4300 km2 over the Hoop Fault Complex in the Barents Sea
Survey plan guided by 2D coverage and CSEM tests
Coverage over open acreage and 20th Round award blocks
80% of acquisition to be completed by Q4

26
New Activity – North Sea
ESB09 3D
2,400 km2 over a highly productive Quad 211 in the East Shetland Basin
High Density 3D
In cooperation with PGS

27
New Activity - Europe 3D Program
NVG09 3D
650 km2 over the North Viking Graben
Survey in cooperationwith PGS
Utilizing GeostreamerTechnology
Project completion Q1 2010

28
New Activity - Greenland
Greenland 2D Seismic
Total 2D coverage -56,885 kms
9,600 kms of 2D
10 years of consistent investment
2009 West Greenland 2D
seismic
2009 East Greenland 2D
seismic

29
New Activity - Greenland
2009 West Greenland Aeromag
Greenland Aeromagnetics
Total Aeromag coverage –248,315 kms
2009 program -41,000 kms
Geological Atlas

30
New Activity – West Africa 2D
West Africa Regional2D Survey
Well-tie to significant recent discoveries in western Ghana
9,930 km completed in Ghana
3,500 km deepwater Benin project completed
Both programs image open blocks with significant exploration potential
Deepwater Benin program
Jubilee Field

31
New Activity - Liberia 3D
Liberia 3D Phase 1 3D
complete Q4 20083000 km2
Phase 2 3D acquisition complete May 4, 20096000 km2
Geological SettingImages extension of Cretaceous Play Phase 1 2008
Phase 2 2009

32
New Activity - SumatraNorthwest Sumatra2D Seismic Program
5,600 km of MC 2D
Extended 1,800 km of regional coverage into S. Java
Part of the 40,000 kmsof the IndoDeep project
Acquisition complete early Q3
33
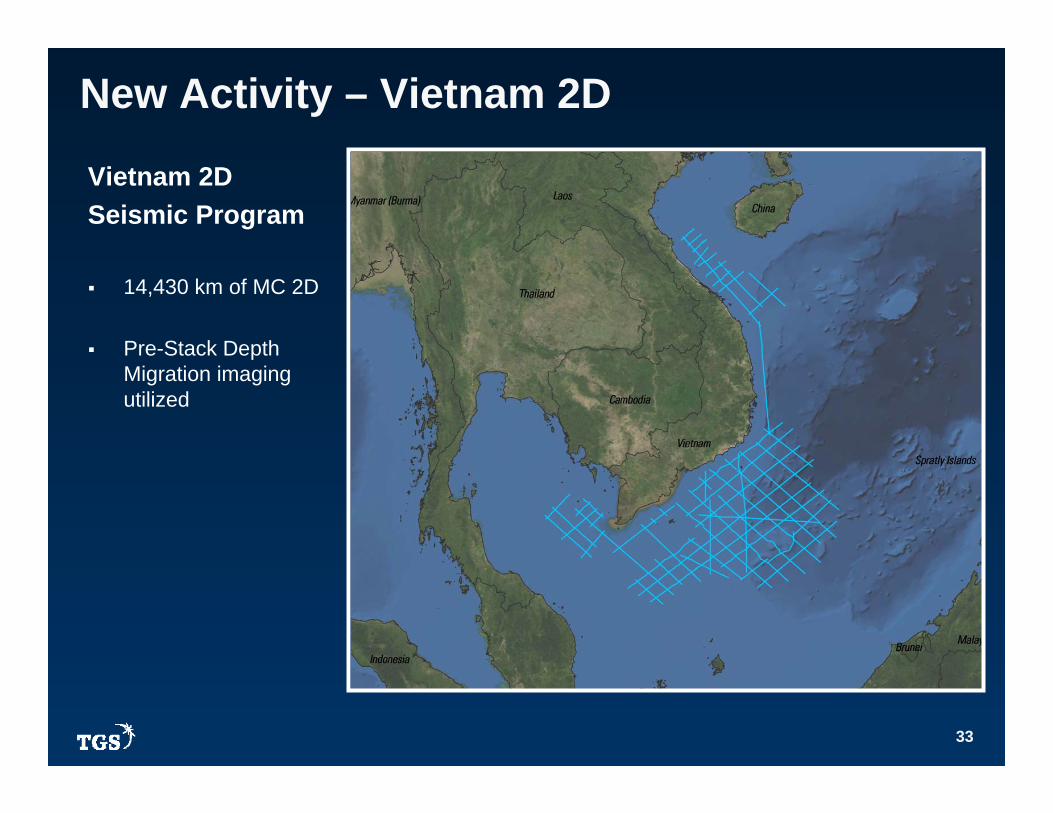
New Activity – Vietnam 2D
Vietnam 2D Seismic Program
14,430 km of MC 2D
Pre-Stack Depth Migration imaging utilized

34
Digital Well Log LibraryGrowth in wells inventory through agreements with individual states and customers
5.6M wells available for immediate download through LogLine Plus!
Increased demand for fully digital LAS format
137% growth in creation of new LAS inventory in 2008
Launch of Production Data offering
Globalization of business model

35
Well Data coverage
Geologic Products - Well Log Globalization Effort

36
TGS Complex Imaging
Time
WAZ
TAMETM
PoSDM
PreSDM
Kirchhoff
WEM
BEAM
RTM

37
New Imaging Technology
True Azimuth Multiple Elimination (TAMETM)
RTM of sail line without TAMETM RTM of sail line with TAMETM

38
New Activity – Brasil PSDM
2009 Brasil PSDM Expansion~25,000 kms
127,000 total Kms in Depth 2009 Brasil PSDM

39
TGS-NOPEC Geophysical Company
Outlook

40
Investments in Multi-Client Library

41
Market Conditions Improved market for MC data from Q1 2009
Customer spending patterns remain difficult to predict
Cautious market environment prevails
Flexible business model and strong balance sheet position us well
Availability of vessels at favorable rates is growing
Still view long term fundamentals with optimism
Will maintain a cautious but opportunistic approach to new investment
42
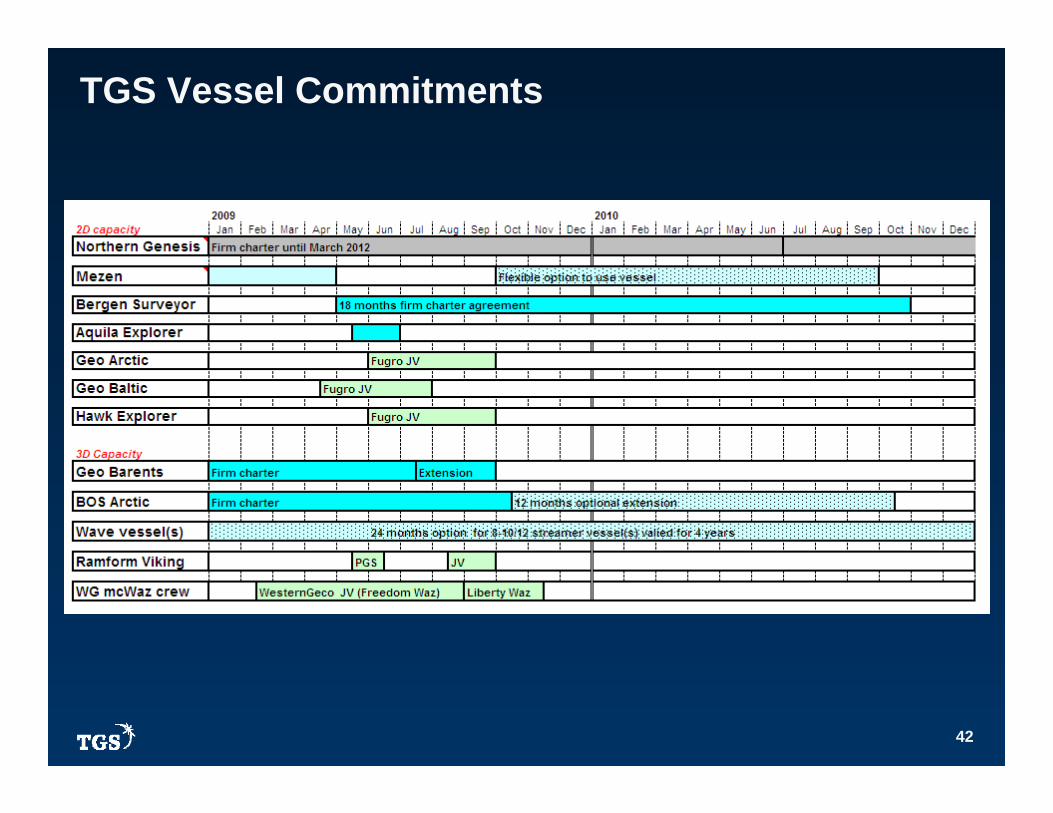
TGS Vessel Commitments

43
LOI with Polarcus
Announced September 2
Charter of first released vessel MV Nadia (12 streamer)
Initial survey to commence in December 2009 for approximately 3 months
Options for two 6-month extensions at fixed commercial rates
Conditional upon sufficient prefunding from clients
Win-Win for both companies
44
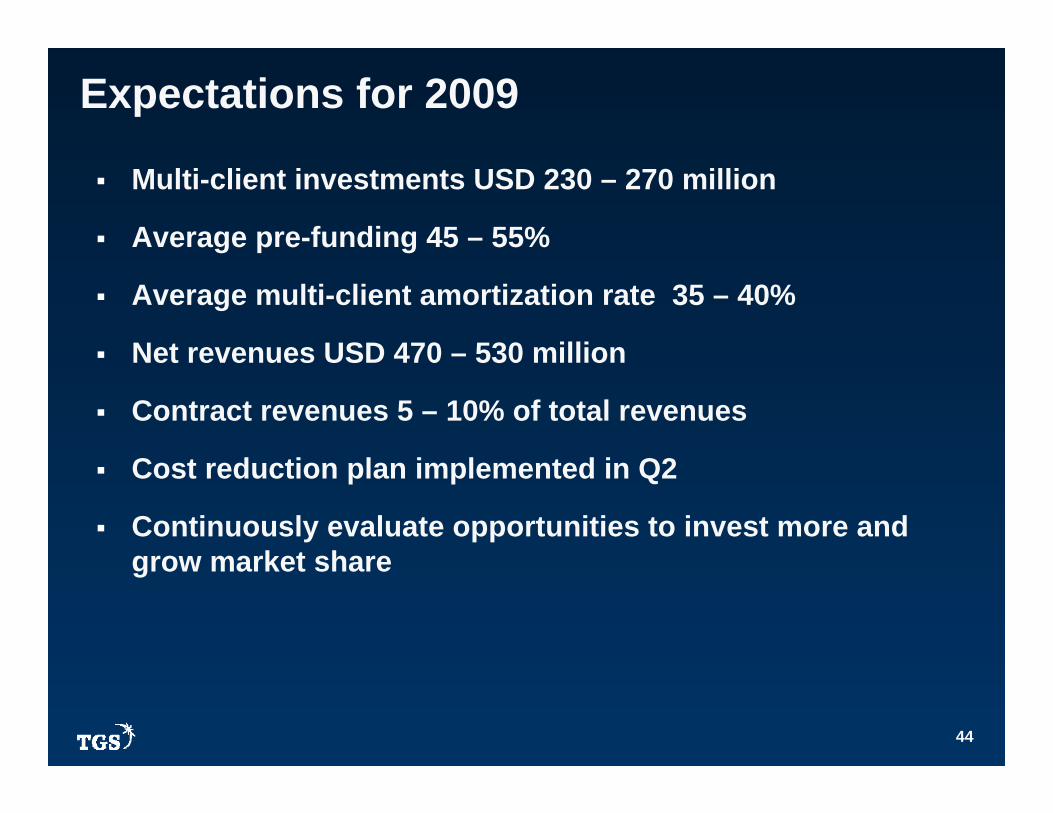
Expectations for 2009
Multi-client investments USD 230 – 270 million
Average pre-funding 45 – 55%
Average multi-client amortization rate 35 – 40%
Net revenues USD 470 – 530 million
Contract revenues 5 – 10% of total revenues
Cost reduction plan implemented in Q2
Continuously evaluate opportunities to invest more and grow market share

45
TGS Performs in all Cycles!
-100
-80
-60
-40
-20
0
20
40
60
80
1998 1999 2000 2001 2002 2003 2004 2005 2006 2007 2008
TGS Comp A Comp B Comp C
TGS
Profit Margin (EBIT) vs. Peer Group

46