Pain as the fifth vital sign in Galicia: overcome challenge Mª Dolores Martín Rodríguez Quality...
17
Pain as the fifth vital sign in Galicia: overcome challenge Mª Dolores Martín Rodríguez Quality Programs Manager Galician Health Service. Spain [email protected] Copenhagen, 30 May 2012 WS 3: Improving pain management: Delivering results in best practice cooperation models
-
Upload
ethel-casey -
Category
Documents
-
view
217 -
download
0
Transcript of Pain as the fifth vital sign in Galicia: overcome challenge Mª Dolores Martín Rodríguez Quality...

Pain as the fifth vital sign in Galicia: overcome challenge
Mª Dolores Martín RodríguezQuality Programs Manager
Galician Health Service. [email protected]
Copenhagen, 30 May 2012
WS 3: Improving pain management: Delivering results in best practice cooperation models

Stra
tegi
c co
res
Professionals: our greatest asset
Quality and Patient Safety
Health and demands of citizens
Rigorous and efficient management
Modernization of infrastructure
Technology and information
Health sector as a creator of value
Integral Pain Care Strategy
Integral care procedures
Quality and Patient Safety Policies
Best practices in drug prescription and dispensation
Guarantee of care in time and form according to defined
pathologies
Paliative Care
STRATEGY SERGAS 2014 PUBLIC HEALTH CARE at the PATIENT’S SERVICE

Galicia: Pain Care Situation 2010Institutional Declaration
Galician Health Ministry

Implementation of the acute pain evaluation procedure in our hospitals: December 2011
Vital signs graphPain 5th Vital Sign

GALICIAN COMMISSION ON THE STRATEGY AGAINST PAIN
Decree 60/2012
• Director of Health CarePresident
• Autonomous Region of GaliciaScope
• To improve integral care policies on pain in the Galician Health Service
Goal

PresidentDirector of Health Care
Member1 person attached to
the department responsible for
Health Care
Member1 person attached to
the department responsible for Patient
Safety
Members4 Physicians
Member1 Pharmacist
Members4 nurses
Member1 psychologist
Members
2 persons belonging to the Patient
Advisory Council
Secretary
Person attached to the department responsible for Patient Safety
Vice-president
General Subdirector responsible for Patient Safety
Structure
14 members

REGISTER 1st Quarter 2nd Quarter 3rd Quarter 4th Quarter Average 2011
Inhospital Patients 61 553 61 173 54 921 59 184 220 727
Patients with pain record on vital signs chart
11 319 (18.4%)
16 397 (26.8%)
16 589(30.2%)
26 576(44.9%)
71 235 (32.3%)
Vital signs chart VAS record > 0 3 905 5 034 4 827 7 608 21 477
Qualitative record VAS> 0 3 901 5 409 5 545 7 223 22 075
Patients with pain record on vital signs chart VAS > 0 and Qualitative pain record
** 2 511 2 487 4 031 11 335
** 1st quarter data not available
GACELA (2011)
Integral Pain CareResults
DATA SOURCE: GACELA. Vital signs chart record 2011

Integral Pain Care
DATA SOURCE: GACELA. Vital signs chart record 2011
H1 H2 H3 H4 H5 H6 H7 H8 H9 H10 H11 H12 H13 H14 AVERAGE SERGAS
0
10
20
30
40
50
60
70
80
29.332.1
12.6
6.8 6.8
24.7
32.9
42.4
69.2
43.2
72.2
38.635.4
7.2
32.3
% Patients with Pain Evaluation Record on vital signs Chart 2011Patients VAS >0 (N= 71 235)
STANDARD ≥50%
Average Galicia 2011 = 32.3
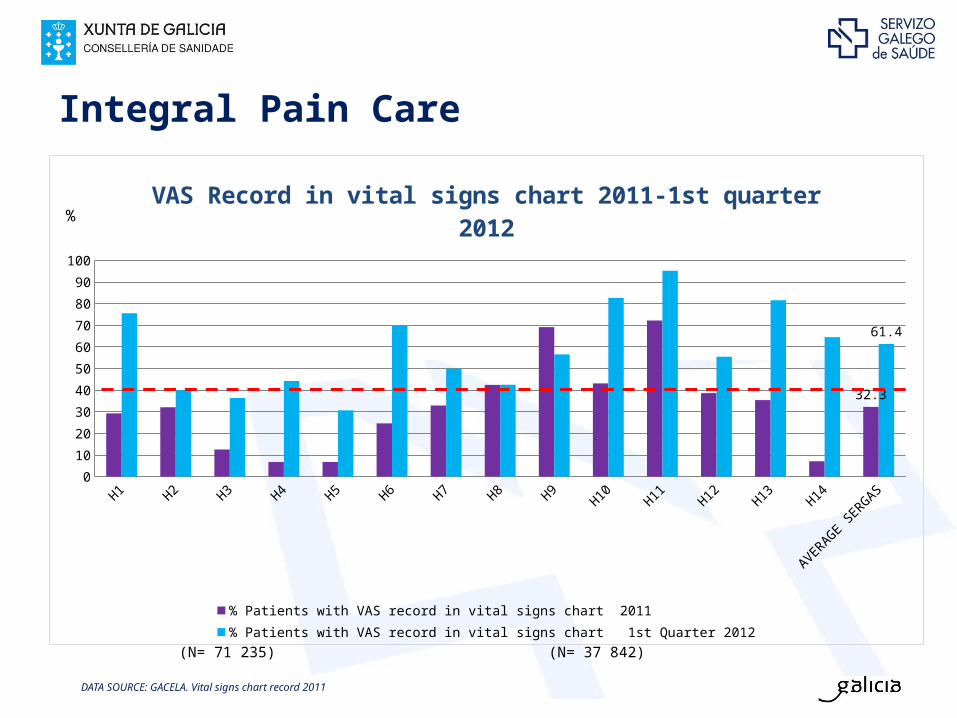
H1 H2 H3 H4 H5 H6 H7 H8 H9 H10 H11 H12 H13 H14 AVERAGE SERGAS
0
10
20
30
40
50
60
70
80
90
100
32.3
61.4
VAS Record in vital signs chart 2011-1st quarter 2012
% Patients with VAS record in vital signs chart 2011 % Patients with VAS record in vital signs chart 1st Quarter 2012
Integral Pain Care
DATA SOURCE: GACELA. Vital signs chart record 2011
(N= 37 842)(N= 71 235)
%

Integral Pain Care
H1 H2 H3 H4 H5 H6 H7 H8 H9 H10 H11 H12 H13 H14 AVERAGE SERGAS
0
10
20
30
40
50
60
70
36.1 34.4
27.9
59.5
48.7
33.5
48.3
56.7
15.3
21.0 21.5
29.1
21.5
52.5
30.1
% Patient refered Pain (VAS > 0)(N: 21 477)
DATA SOURCE: GACELA. Vital signs chart record 2011

Mild Pain Moderate Pain Severe Pain0
1000
2000
3000
4000
5000
6000
7000
8000 7 205
4 507
746
5 185
3 173
661
Female Male
Female Male
Age 0 - 17 18 - 39 40 - 59 ≥60 TOTAL 0 - 17 18 -39 40 - 59 ≥60 TOTAL
Patients VAS > 0 419 3.4% 4362 35.0% 2276 18.3% 5401 43.4% 12458 58.0% 564 6.3% 1129 12.5% 2161 24.0% 5165 57.3% 9019 42.0%
Mild Pain 239 3.3% 2618 36.3% 1254 17.4% 3094 42.9% 7 205 58.2% 342 6.6% 603 11.6% 1201 23.2% 3039 58.6% 5185 41.8%
Moderate Pain 163 3.6% 1534 34.0% 844 18.7% 1966 43.6% 4507 58.7% 196 6.2% 443 14.0% 788 24.8% 1746 55.0% 3173 41.3%
Severe Pain 17 2.3% 210 28.2% 178 23.9% 341 45.7% 746 53.0% 26 3.9% 83 12.6% 172 26.0% 380 57.5% 661 47.0%
Integral Pain CarePain Intensity
DATA SOURCE: GACELA. Vital Signs Chart Record 2011
0%
10%
20%
30%
40%
50%
60%
70%
80%
90%
100%
57.7
35.8
6.6
% Mild pain 2011 % Moderate pain 2011 % Severe Pain 2011
Hospitals
Patie
nts
Patie
nts
Pain Intensity
N= 21 477

Integral Pain Care
No pain
Chest
left upper limb
Abdomen
right leg
0% 5% 10% 15% 20% 25% 30% 35% 40%
2.6%
12.0%
7.2%
8.0%
3.6%
4.0%
36.1%
9.7%
9.4%
7.4%
Pain Location (N= 22 112)
Not applicable
Diagnostic Procedure
Therapeutic Procedure
Immediately after surgery
Surgery
Medical condition
Trauma
Other
0% 5% 10% 15% 20% 25% 30% 35% 40%
8.9%
1.0%
3.8%
8.7%
15.3%
34.4%
14.4%
13.4%
Pain Origin (N= 22 112)
No
Diarrhea
Nausea /vomiting
Diarrhea/Nausea/Vomiting
Sweating
Fever/Sweating
hematoma / hemorrhage
Infection signs
weakness / paresthesias
0% 10% 20% 30% 40% 50% 60% 70% 80% 90%
78.6%
1.0%
5.7%
0.8%
2.9%
2.5%
1.7%
3.0%
3.5%
Associated Symptoms (N= 22 037)
DATA SOURCE: GACELA. Vital signs chart record 2011

No need
No scheduled analgesia
Oral analgesia
subcutaneous analgesia
Intermittent iv /4-6-8h
Continuous iv (infusion pump)
Iv. PCA
Epidural/spinal PCA
Transdermal patches
0% 10% 20% 30% 40% 50% 60%
6.4%
9.9%
23.8%
1.1%
52.7%
1.8%
1.0%
1.1%
2.2%
Analgesia (N= 22 112)
Not applicable
Disappears with analgesia
Decreases with analgesia
It does not decrease with analgesia
Required dose of rescue
0% 5% 10% 15% 20% 25% 30% 35% 40% 45% 50%
16.9%
45.6%
32.2%
2.2%
3.0%
Analgesia Results (N= 22 112)
Integral Pain Care
DATA SOURCE: GACELA. Vital signs chart record 2011

Lines for Action 2012Child Pain Survey
Piloting indicators of chronic cancer pain
Systematization of chronic non cancer pain care procedures
Analysis of the current status of Pain Care Units in the Community
Chronic Pain Online course for healthcare professionals
Designing Education and Training Programs for patients

The implantation of the Integral Pain Care Strategy has allowed us to become aware of the real situation and thus put forth actions in order to improve health care procedures.
The creation of the Galician Commission on the Strategy Against Pain was greatly appreciated staff wise, specially by health professionals who work in Pain Units and primary care, as well as Scientific Societies and Patient Associations.
The collaborative work of members of the Commission results in numerous lines of work and contributions to improving patient care in pain.
Conclusions

THANK YOU FOR YOUR ATTENTION
Disclosure Statement of Financial Interest
I, Mª Dolores Martín Rodríguez, DO NOT have a financial interest/arrangement or affiliation with one
or more organizations that could be perceived as a real or apparent conflict of interest in the context of
the subject of this presentation.