Page 1 Serious Injury Overview June 2011 Data Source: ODW and BIA Datamart May 2011.
16
Page 1 Serious Injury Overview Serious Injury Overview June 2011 Data Source: ODW and BIA Datamart May 2011
-
Upload
mervin-horton -
Category
Documents
-
view
216 -
download
2
Transcript of Page 1 Serious Injury Overview June 2011 Data Source: ODW and BIA Datamart May 2011.

Page 1
Serious Injury OverviewSerious Injury Overview
June 2011
Data Source: ODW and BIA Datamart May 2011

Page 2
Overview
The purpose of this presentation is to provide a high level overview of Serious Injuries in BC, including:
Rationale for Serious Injury Measure
Serious Injury Definition
Costs and Days Lost from Serious Injuries
Serious Injury Rate
Serious Injury Volumes and Percent Contribution to All Claims
Claim Characteristics for Serious Injuries
Sector Overview of Serious Injuries

Page 3
Rationale for the Serious Injury Measure
Why a Serious Injury Measure?
• The overall injury rate treats all time loss claims the same.
• It is important that we reduce injuries most responsible human suffering and WorkSafeBC’s financial costs.
• To do this, we need a measure to target and monitor.
The goal was for the Serious Injury measure to be timely, relevant, and inclusive yet focused.
• Rationale • Definition• Cost of Serious Injuries• Serious Injury Rate• Volumes • Claim Characteristics• Sectors

Page 4
Serious Injury Definition
A claim is considered a Serious Injury claim if at least one of the following is met:
• Long Duration (wage loss of 28 or more days)
• High Health Care Costs
• Fatality
• Serious Medical Diagnosis
Note also that Serious Injury claims must receive a first-payment in the month of injury or the three months following.
• Rationale • Definition• Cost of Serious Injuries• Serious Injury Rate• Volumes• Claim Characteristics • Sectors

Page 5
Cost and Days Lost from Serious Injuries (2006-2010 – All BC)
• Rationale • Definition• Cost of Serious Injuries• Serious Injury Rate• Volumes• Claim Characteristics • Sectors
Serious Injury claims incurred between 2006 and 2010 represented 34% of claims, but 91% claim costs and 86% of the days lost.
Notes: •Claim Costs are based on Fully Reserved Claim Costs(“FRCC”). FRCC costs include early estimates of the 2010 FRCC.
FRCC (fully reserved claim costs): reflects the total raw past payments and the estimated future liabilities (average actuarial abstract) for the identified claims.•Claim Counts, Total Days Paid to date, and Average FRCC are rounded to the near thousand; total FRCC is rounded to the nearest million.•‘Days lost’ refers to STD Days Paid to Date: The number of short term disability days that have occurred to date on claims incurred in the five year period. This amount will potentially increase over time.
# of Claims
% of Claims Days
% of Days
Average Days Total
% of Costs
Average Cost
Serious Injury Claims 90,000 34% 9,673,000 86% 107 $3,347,000,000 91% $37,000Non Serious Injury Claims 176,000 66% 1,564,000 14% 9 $340,000,000 9% $2,000All Claims 266,000 100% 11,237,000 100% 42 $3,687,000,000 100% $14,000
Days Lost To Date CostsN

Page 6
Serious Injury Rate – All BC
• Rationale • Definition• Cost of Serious Injuries• Serious Injury Rate• Volumes• Claim Characteristics • Sectors
The Serious Injury Rate is estimated to be 0.82 in 2010.• Overall, the Serious Injury Rate decreased 27% in the last 10 years, but increased by around 4% in
2010.• The 12 month rolling Serious Injury Rate figures have been slowly increasing since February 2010
after a drop in 2009.
0
1
2
3
4
5
2001 2002 2003 2004 2005 2006 2007 2008 2009 2010*
Injury Rate and Serious Injury Rate, 2001-2010
Injury Rate Serious Injury Rate
* The 2010 injury rates are preliminary.
0.82
2.27
All BC: Rateable SectorsSerious Injury Rate reflects the number of Serious Injury Claims in a given year divided by the number of Person Years in a given year, multiplied by 100.

Page 7
Serious Injury Volumes and Contribution to Claims (2006-2010 – All BC)
• After a 16% decrease in 2009, the number of Serious Injuries increased by 4% in 2010.
• The percentage contribution of Serious Injuries to all time loss claims has increased from 32% in 2007 to 38% in 2010.
• Rationale • Definition• Cost of Serious Injuries• Serious Injury Rate• Volumes• Claim Characteristics • Sectors
32% 32%34%
36%38%
0%
5%
10%
15%
20%
25%
30%
35%
40%
0
5,000
10,000
15,000
20,000
25,000
2006 2007 2008 2009 2010
% S
erio
us
Inju
ries
# S
eriu
os
Inju
ry C
laim
s
Serious Injury Claims %SI
% Serious Injury: Number of Serious Injury Claims divided by the number of Non-Health Care Only claims first paid in the month of injury or in the following three months
Total: 90,318

Page 8
Claim Characteristics: Serious Injuries by Accident Type (2006-2010 – All BC)
Volume and % Contribution to Serious Injuries
MSIs (ergonomic incidents) contribute most to the Serious Injury volume.
• Rationale • Definition• Cost of Serious Injuries• Serious Injury Rate• Volumes• Claim Characteristics • Sectors
Total: 90,318
MSI31,21735%
Fall23,95626%
Struck By11,72613%
Other Bodily Motion8,1299%
Other15,29017%

Page 9
Claim Characteristics: Serious Injuries by Accident Type (2006-2010 – All BC)
Percentage of Claims that are Serious Injuries for the Most Frequent Accident Types
46% of Claims due to a Fall from an Elevation are Serious Injury Claims.
• Rationale • Definition• Cost of Serious Injuries• Serious Injury Rate• Volumes• Claim Characteristics • Sectors
0%
5%
10%
15%
20%
25%
30%
35%
40%
45%
Falls MSI Other Bodily Motion
Struck By
% S
erio
us
Inju
ry

Page 10
Claim Characteristics: Serious Injuries by Injury Type (2006-2010 – All BC)
• Rationale • Definition• Cost of Serious Injuries• Serious Injury Rate• Volumes• Claim Characteristics • Sectors
58% of Serious Injuries are back strains or other strains.
Other Strains, 31,156, 35%
Back Strain, 20,527, 23%
Fractures, 17,124, 19%
Cut, 4,859, 5%
Contusion, 4,846, 5%
Other, 11,806,
13%
Total: 90,318
Volume and % Contribution to Serious Injuries

Page 11
Claim Characteristics: Serious Injuries by Injury Type (2006-2010 – All BC)
• Rationale • Definition• Cost of Serious Injuries• Serious Injury Rate• Volumes• Claim Characteristics • Sectors
0%
10%
20%
30%
40%
50%
60%
70%
80%
90%
100%
Fractures Other Strains
Back Strain Contusion Cut
% S
erio
us
In
jury
Over 90% of fractures result in Serious Injuries, whereas 16% of cuts result in Serious Injuries.
Percentage of Claims that are Serious Injuries for the Most Frequent Injury Types

Page 12
Claim Characteristics: Serious Injuries by Occupation Type (2006-2010 – All BC)
• Rationale • Definition• Cost of Serious Injuries• Serious Injury Rate• Volumes• Claim Characteristics • Sectors
0.00%
1.00%
2.00%
3.00%
4.00%
5.00%
6.00%
7.00%
8.00%
9.00%
% o
f S
erio
us
Inju
ries
20 Occupations with the Most Serious Injuries
Motor Vehicle drivers, trades helpers and support occupations in health services have the most Serious Injuries.
Percentage Contribution to Serious Injuries by the Top Occupations

Page 13
Claim Characteristics: Serious Injuries by Age (2006-2010 – All BC)
Percentage of Claims that are Serious Injuries
Serious Injuries comprise a greater percentage of claims with increases in age.
0%
5%
10%
15%
20%
25%
30%
35%
40%
45%
Children (0-14)
Young Workers (15-24)
Workers (25-54)
Mature Workers (55+)
% S
erio
us
Inju
ries
• Rationale • Definition• Cost of Serious Injuries• Serious Injury Rate• Volumes• Claim Characteristics • Sectors
Page 14
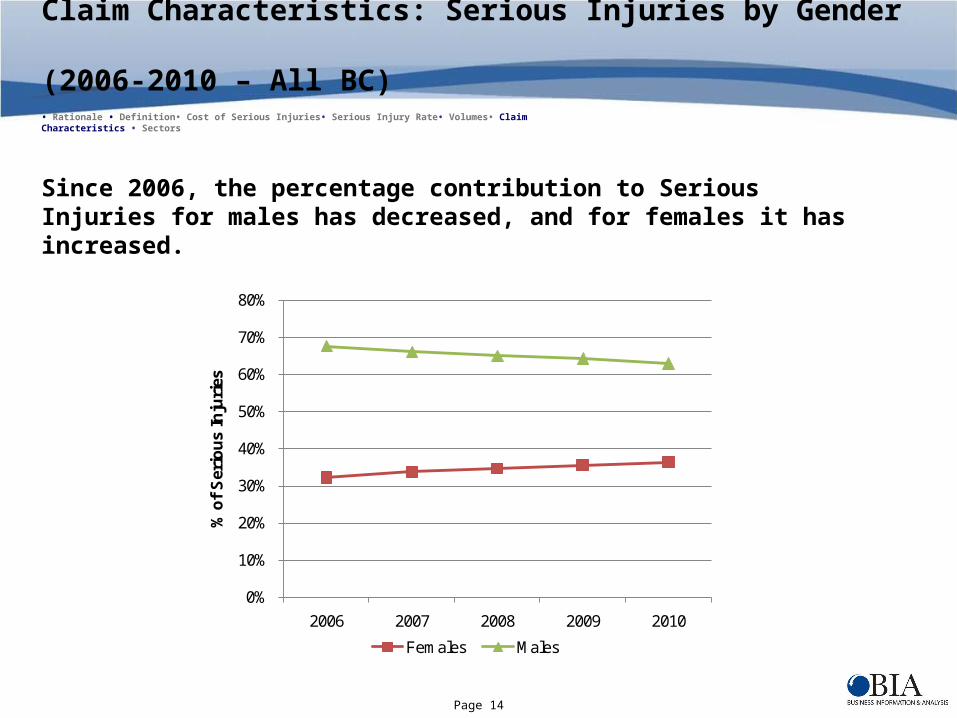
Claim Characteristics: Serious Injuries by Gender (2006-2010 – All BC)
0%
10%
20%
30%
40%
50%
60%
70%
80%
2006 2007 2008 2009 2010
% o
f S
erio
us
Inju
ries
Females Males
Since 2006, the percentage contribution to Serious Injuries for males has decreased, and for females it has increased.
• Rationale • Definition• Cost of Serious Injuries• Serious Injury Rate• Volumes• Claim Characteristics • Sectors

Page 15
Serious Injuries by Sectors (2006-2010)
• Rationale • Definition• Cost of Serious Injuries• Serious Injury Rate• Volumes• Claim Characteristics • Sectors
0%
10%
20%
30%
40%
50%
60%
0
5,000
10,000
15,000
20,000
25,000
30,000
35,000
Primary Resources (Sector 70)
Manufacturing (Sector 71)
Construction (Sector 72)
Transportation & Warehousing
(Sector 73)
Trade (Sector 74)
Public Sector (Sector 75)
Service Sector (Sector 76)
% S
I
# S
erio
us
Inju
ries
# Serious Injuries % SI
The Service Sector has the greatest volume of Serious Injuries, while time loss claims in the Primary Resources sector have greatest propensity to be a Serious Injury.
All BC • # Serious Injuries - 90,318•% Serious Injury - 34%

Page 16
Appendix A: Frequency of the Serious Injuries Across Components in the Definition (2006-2010 – All BC)
• Rationale • Definition• Cost of Serious Injuries• Serious Injury Rate• Volumes• Claim Characteristics • Sectors
5.8%
Component 1: Long Duration (28 days or more)
Component 2: High Health Care Costs 14% (12,900) of the Serious Injury claims meet this criterion. If the Serious Injury Definition did not have the High Health Care Cost component, it would capture 99% of the claims under the current definition.
Component 4: Serious Medical Diagnosis – select ICD9 Codes
68.5%
11.0%
6.0%
0.9%
0.6%
6.9%
The Long Duration component has the greatest impact on the Serious Injury volume.
92% (83,500) of Serious Injury claims meet this criterion. If the Serious Injury Definition did not have a Long Duration Component, it would capture 31% of the Serious Injuries under the current definition.
25% (22,200) of Serious Injury claims meet this criterion. If the Serious Injury Definition did not have the High Health Care Cost component, it would capture 94% of the claims under the current definition.
Notes: •Some of the areas may not be in exact proportion to the percentage figures•Numbers are rounded to the nearest hundred


![Odw Heavy Oils Slides[1]](https://static.fdocuments.in/doc/165x107/577cbfe01a28aba7118e5629/odw-heavy-oils-slides1.jpg)