
Oxygen evolution reaction dynamics monitored by an...
7
ARTICLE Oxygen evolution reaction dynamics monitored by an individual nanosheet-based electronic circuit Peiyao Wang 1,2 , Mengyu Yan 1,3 , Jiashen Meng 1 , Gengping Jiang 2,4 , Longbing Qu 2 , Xuelei Pan 1 , Jefferson Zhe Liu 2 & Liqiang Mai 1 The oxygen evolution reaction involves complex interplay among electrolyte, solid catalyst, and gas-phase and liquid-phase reactants and products. Monitoring catalysis interfaces between catalyst and electrolyte can provide valuable insights into catalytic ability. But it is a challenging task due to the additive solid supports in traditional measurement. Here we design a nanodevice platform and combine on-chip electrochemical impedance spectroscopy measurement, temporary I-V measurement of an individual nanosheet, and molecular dynamic calculations to provide a direct way for nanoscale catalytic diagnosis. By removing O 2 in electrolyte, a dramatic decrease in Tafel slope of over 20% and early onset potential of 1.344 V vs. reversible hydrogen electrode are achieved. Our studies reveal that O 2 reduces hydroxyl ion density at catalyst interface, resulting in poor kinetics and negative catalytic performance. The obtained in-depth understanding could provide valuable clues for catalysis system design. Our method could also be useful to analyze other catalytic processes. DOI: 10.1038/s41467-017-00778-z OPEN 1 State Key Laboratory of Advanced Technology for Materials Synthesis and Processing, Wuhan University of Technology, Wuhan 430070, China. 2 Department of Mechanical and Aerospace Engineering, Monash University, Clayton, Victoria 3800, Australia. 3 Department of Material Science and Engineering, University of Washington, Seattle, Washington 98195-2120, USA. 4 College of Science, Wuhan University of Science and Technology, Wuhan 430081, China. Correspondence and requests for materials should be addressed to M.Y. (email: [email protected]) or to J.Z.L. (email: [email protected]) or to L.M. (email: [email protected]) NATURE COMMUNICATIONS | 8: 64 | DOI: 10.1038/s41467-017-00778-z | www.nature.com/naturecommunications 1
Transcript of Oxygen evolution reaction dynamics monitored by an...

ARTICLE
Oxygen evolution reaction dynamics monitored byan individual nanosheet-based electronic circuitPeiyao Wang1,2, Mengyu Yan1,3, Jiashen Meng1, Gengping Jiang2,4, Longbing Qu2,
Xuelei Pan1, Jefferson Zhe Liu 2 & Liqiang Mai 1
The oxygen evolution reaction involves complex interplay among electrolyte, solid catalyst,
and gas-phase and liquid-phase reactants and products. Monitoring catalysis interfaces
between catalyst and electrolyte can provide valuable insights into catalytic ability. But it is a
challenging task due to the additive solid supports in traditional measurement. Here we
design a nanodevice platform and combine on-chip electrochemical impedance spectroscopy
measurement, temporary I-V measurement of an individual nanosheet, and molecular
dynamic calculations to provide a direct way for nanoscale catalytic diagnosis. By removing
O2 in electrolyte, a dramatic decrease in Tafel slope of over 20% and early onset potential of
1.344 V vs. reversible hydrogen electrode are achieved. Our studies reveal that O2 reduces
hydroxyl ion density at catalyst interface, resulting in poor kinetics and negative catalytic
performance. The obtained in-depth understanding could provide valuable clues for catalysis
system design. Our method could also be useful to analyze other catalytic processes.
DOI: 10.1038/s41467-017-00778-z OPEN
1 State Key Laboratory of Advanced Technology for Materials Synthesis and Processing, Wuhan University of Technology, Wuhan 430070, China.2 Department of Mechanical and Aerospace Engineering, Monash University, Clayton, Victoria 3800, Australia. 3 Department of Material Science andEngineering, University of Washington, Seattle, Washington 98195-2120, USA. 4 College of Science, Wuhan University of Science and Technology, Wuhan430081, China. Correspondence and requests for materials should be addressed to M.Y. (email: [email protected]) or toJ.Z.L. (email: [email protected]) or to L.M. (email: [email protected])
NATURE COMMUNICATIONS |8: 645 |DOI: 10.1038/s41467-017-00778-z |www.nature.com/naturecommunications 1

Water electrolysis has been regarded as an environmen-tally friendly route to hydrogen gas production1–3.However, efficiency of water catalysis is severely limited
by poor kinetics of the oxygen oxidation reaction, namely oxygenevolution reaction (OER)3, 4. OER is a complex process thatinvolves the interplay among solid catalysts, electrolyte, gas-phaseand liquid-phase reactants, and products5, 6. During an OER pro-cess, chemical reactions mainly take place at catalysts/electrolyteinterface. Unfortunately, there are insufficient in-depth under-standing of the reaction interfaces7. The difficulty mainly arisesfrom two experimental limitations: first, the interfaces for catalyticreaction are generally buried between solid and liquid phases, whichare very difficult to access and detect by conventional spectroscopictechniques;8 second, active species are mixed with binders andconductive carbon additives, which hinder an accurate investigationof the electrochemical interfaces in traditional measurements8, 9.
Previously, most of fundamental studies focused on rate-determining steps and identification of catalytic activity descriptorfor the OER from thermodynamic aspect10–12. There have beensignificant advances on relationships between material’s catalyticactivities and its electronic structure, aided by a wealth of spec-troscopic techniques and first-principles computations13, 14.However, there are much fewer studies on OER kinetic process,particularly those processes taking place in an electrode/electrolyteinterface region. The distribution of ions and water at the interfacedetermine the kinetics of mass and electron transfer process. Ourunderstanding is still quite limited. Oxygen is a product of OER.In terms of reaction equilibrium (i.e., Le Chatelier’s principle), it isknown that O2 concentration increase in electrolyte (with theongoing of OER) hinders the catalytic reaction. But there is noclear answer whether oxygen molecules would affect OER kinetics.The initial OER catalytic steps involve hydroxide formationat active surface sites through the discharge of a hydroxide ion(* + OH−→ *OH+ e−) in alkaline solution7. It is reasonable toexpect that oxygen molecules could adsorb at the reaction inter-faces, hindering the formation of hydroxide and hence the
catalytic kinetic performance. It is fundamentally important toinvestigate this hypothesis and gain in-depth understanding.
Currently, a single nanostructure electrochemical device has beenexploited as a powerful tool to investigate intrinsic electrochemicalprocesses and properties at nanoscale15–20. Several unique advan-tages enable such a nanodevice to be a great platform to directlyprobe the OER processes for reliable information. First, a singlenanowire/nanosheet can be used as the working electrode, avoidinginfluences of the binders and conductive carbon additives20–22.Second, structure and composition of the nanodevice can beprecisely designed and controlled, which is essential to eliminateexperimental uncertainties and allows quantitatively or semi-quantitatively fundamental studies19. Third, it is much easier tomonitor the change of physical properties of individual nanowireand nanosheet (such as conductivity) in a nanodevice. Thisadvantage is largely unexplored up to date. It could allow us toprobe interface properties during the OER process directly.
In this work, we design a single electrochemical nanodeviceconsisting of nickel nanoparticle catalysts anchored on agraphene nanosheet electrode. We propose and use concurrentmeasurement of electrical conductivity of the electrode materials toprobe the effects of O2 at the reaction interface during the OER. Theon-chip electrochemical impedance spectroscopy (EIS) measure-ment and molecular dynamics (MD) simulations are also carriedout. Our results show that oxygen in electrolyte has an inhibitioneffect on OER performance. A significant decrease in Tafel slopeover 20% and an early onset potential of 1.344 V (with reference toRHE) are observed by removing O2 in electrolyte. Our study revealsthat oxygen adsorption at catalytic interface would reduce OH− ionconcentration in the double layer (DL) and thus result in a poorkinetics and negative catalytic performance.
ResultsDevice fabrication. Figure 1c depicts the Ni-graphene-basedelectrochemical device. The fabrication procedure is schematically
c
WE3WE2
WE1
ReferenceelectrodeCounter
electrode
Temperature: 298 Kd
Probe station
ba
Electrochemical workstation
Electrical characteration
Fig. 1 Working principle of temporal electrical transport measurement. a TEM image of as-prepared Ni-graphene nanosheets with a scale bar at 200 nm.b Optical microscope image of nanosheets contacted with three metallic electrodes with a scale bar at 10 μm. c Schematic illustration of the Ni-graphenenanosheet-based device with a microscopic electrochemical cell on it. d Illustration of the device (inset) and corresponding measurement equipment layoutwith the three-dimensional view
ARTICLE NATURE COMMUNICATIONS | DOI: 10.1038/s41467-017-00778-z
2 NATURE COMMUNICATIONS |8: 645 |DOI: 10.1038/s41467-017-00778-z |www.nature.com/naturecommunications

illustrated in Supplementary Figs. 1 and 2 and SupplementaryNote 1. The Ni-Graphene nanosheets were prepared through ahydrothermal method and subsequent heat treatment (Supple-mentary Note 2). Then, the Ni-graphene nanosheets were selec-tively deposited onto Si/SiO2 wafer. Three metallic electrodes(WE1, WE2, and WE3) were deposited on the device usingelectron beam lithography followed by Au/Cr (150 nm/5 nm)evaporation and a lift-off process (Fig. 1b). An insulatingphotoresist (SU8-2002) layer was used to cover the metallicelectrodes to prevent leakage current to the aqueous electrolyte.The insulating property of the photoresist and SiO2 was verifiedthrough electrical resistance measurement. We found that theresistance of photoresist layer as well as the SiO2 (SupplementaryFig. 3) was around four orders of magnitudes larger than that ofNi-graphene nanosheet, indicating that leakage currents passingthrough SiO2 and photoresist should be negligible and would notinterfere the electric and electrochemical signals during laterelectrochemical measurements. In addition, to check whetherthere was parasitic reaction in our nanodevice, a comparabledevice in which there were no active catalysts while other partswere kept the same as the original one was fabricated and tested(Supplementary Fig. 4). No reaction peaks were observed.
Electrochemical performance. A number of Ni particleswith diameter around 22.6 nm (Supplementary Note 3 andSupplementary Fig. 5) were anchored on graphene surface(Fig. 1a and Supplementary Fig. 6). Figure 1d shows the experi-mental setup. Figure 2a shows that the onset potential is 1.380 Vvs. RHE in electrolyte with saturated O2. By removing oxygen inelectrolyte (see Methods section), the onset potential is reduced to1.344 V vs. RHE and a high current density of 10 mA cm−2 wasmeasured at a low potential of 1.438 V vs. RHE. To check whetherthe results obtained from this nanodevice is consistent withconventional powder sample performance, SupplementaryFig. 7a–c compare OER performance of Ni catalysts that wereprepared in conventional ways. There were clear performance
gaps between oxygen-absence and oxygen-presence conditions.They qualitatively agree with the results from our nanodevice. Wealso found that the nanosheet had a higher current density thanthat of traditional powder samples at a given potential. This couldbe attributed to a large effective surface area and enhancedelectron transport (shorter distance between active sites andmetallic electrodes)9, 23–26. For the non-iR-corrected Tafel plotsof the polarization curves (Fig. 2b), the Ni-graphene nanosheetunder oxygen-absence condition shows a smaller Tafel slope(147.8 mV/decade) than that under oxygen-presence condition(187.5 mV/decade), showing a faster kinetic process. It indicatesthe critical effect of O2 on the reaction kinetics.
To gain more understanding, on-chip EIS measurement wascarried out. Figure 2c shows the results at an electrochemicalpotential of 1.2 V vs. RHE. A two constant parallel model27 wasadopted to analyze the EIS data (Supplementary Figs. 8–10). Atlow frequency, the time constants (τ) were almost the same underboth conditions. However, two orders of magnitude decrease of τat high frequency is observed for the oxygen-absence case(Fig. 2d, Supplementary Note 4). This should be contributed tothe reduced charge transfer resistance at interface27–30. But EISdata could not provide insights to understand such a reduction.
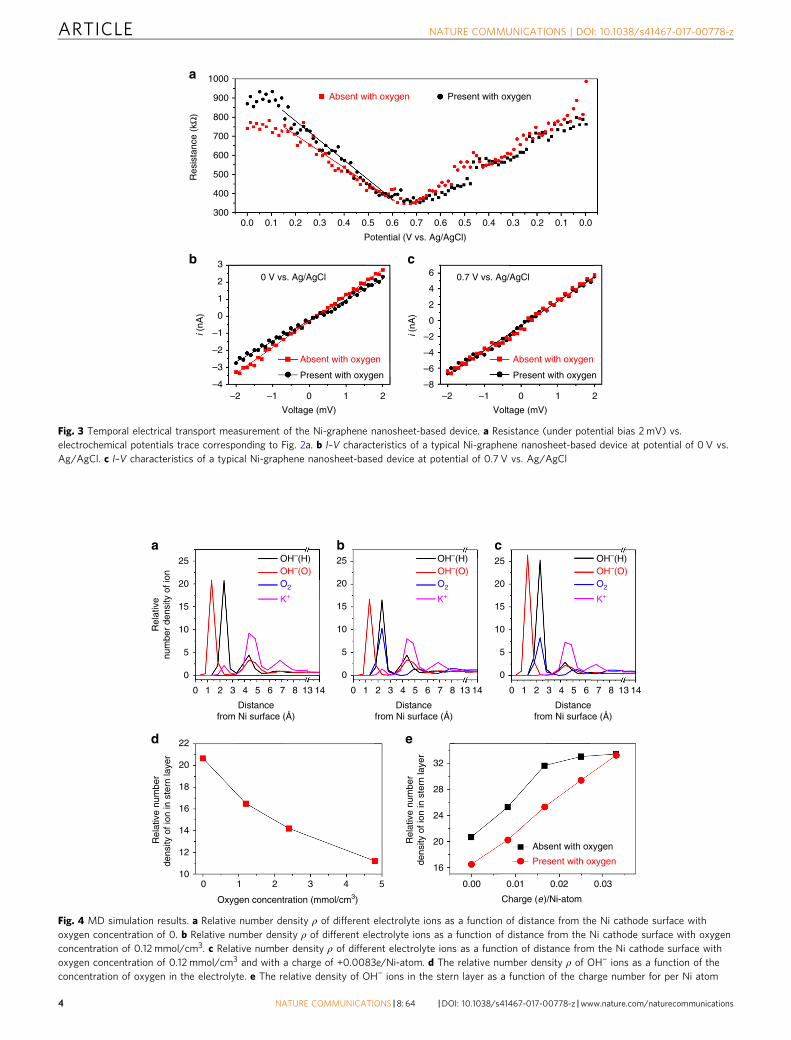
Resistance testing and analysis. We designed and performedon-chip concurrent I–V measurement of the Ni-grapheneelectrode to directly probe the interface property. A seriesof temporal I–V measurements were carried out during bothoxidation (from 0 to 0.7 V vs. Ag/AgCl) and subsequent reduc-tion (from 0.7 to 0 V vs. Ag/AgCl) process31. The evolution of theconductivity (Fig. 3a) and electrode structure (SupplementaryFig. 11) is reversible, indicating a reliably repeatable performanceof this nanodevice. Figure 3b, c and Supplementary Fig. 12show that the resistance from I–V results is significantly differentunder oxygen-absence and oxygen-presence conditions, whichcorrelates with the OER performance gaps (Fig. 2). With the
100 150 200 2500
50
100
150
–Z‘‘
(kΩ
)
1.2 1.3 1.4 1.5 1.6–7
–6
–5
Tim
e co
nsta
nt. (
lg(F
⋅Ω))
–4
–3
–2
1.0 1.2 1.4 1.6
500
400
300
Cur
rent
den
sity
(m
A/c
m2 )
Pot
entia
l (V
vs.
RH
E)
200
100
0
0.0 0.2
Present with oxygen
Absent with oxygen
Present with oxygen
Absent with oxygen
0.4 0.6 0.8
100
1.50
1.45
1.55
1.60
1.65
1.70
0.1 M KOHroom temp.
1.8
Potential (V vs. RHE) Current density (mA/cm2)
Potential (V vs. Ag/AgCl)
147.8 mV/decade187.5 mV/decade
10
50
Z ‘ (kΩ) Potential (V vs. RHE)
200
Present with oxygenAbsent with oxygen
Low frequency present with oxygen
High frequency present with oxygen
High frequency absent with oxygen
Low frequency absent with oxygen
1.2 V vs. RHE
a b
c d
Fig. 2 OER activity of Ni-graphene nanosheet-based device. a Oxygen evolution currents of Ni-graphene nanosheet measured in 0.1 M KOH. b Tafel plotsof OER currents in a. c The Nyquist plots in the potential at 1.2 V vs. RHE together with the responding fitted curve based on the equivalent circuit model.d Plot of the high- and low-frequency time constants
NATURE COMMUNICATIONS | DOI: 10.1038/s41467-017-00778-z ARTICLE
NATURE COMMUNICATIONS |8: 645 |DOI: 10.1038/s41467-017-00778-z |www.nature.com/naturecommunications 3
0.1 0.10.2 0.20.3 0.30.4 0.40.5 0.50.6 0.60.7300
400
500
600
700
800
1000
900
–4–2 –1 0 1 2 –2 –1 0 1 2
–3Absent with oxygen
Present with oxygen
Absent with oxygen
Present with oxygen
–2–2
0
2
4
6
–4
–6
–8
–1
0
i (nA
)
i (nA
)
a
b c
1
2
30.7 V vs. Ag/AgCl0 V vs. Ag/AgCl
Voltage (mV) Voltage (mV)
Res
ista
nce
(kΩ
)
0.0 0.0
Potential (V vs. Ag/AgCl)
Present with oxygenAbsent with oxygen
Fig. 3 Temporal electrical transport measurement of the Ni-graphene nanosheet-based device. a Resistance (under potential bias 2 mV) vs.electrochemical potentials trace corresponding to Fig. 2a. b I–V characteristics of a typical Ni-graphene nanosheet-based device at potential of 0 V vs.Ag/AgCl. c I–V characteristics of a typical Ni-graphene nanosheet-based device at potential of 0.7 V vs. Ag/AgCl
OH–(H) OH–(H) OH–(H)OH–(O) OH–(O) OH–(O)O2 O2 O2
K+ K+ K+
ed
Charge (e)/Ni-atomOxygen concentration (mmol/cm3)
Rel
ativ
e nu
mbe
rde
nsity
of i
on in
ste
rn la
yer
Rel
ativ
e nu
mbe
rde
nsity
of i
on in
ste
rn la
yer
Distancefrom Ni surface (Å)
Distancefrom Ni surface (Å)
Distancefrom Ni surface (Å)
a b c
0 0 01 1 12 2 23 3 34 4 45 5 56 6 67 7 78 8 813 13 1314 14 14
0 1 2 3 4 510
12
14
16
18
20
22
0.00 0.01 0.02
Absent with oxygen
Present with oxygen
0.03
16
20
24
28
32
25 25 25
20 20 20
15 15 15
10Rel
ativ
enu
mbe
r de
nsity
of i
on
10 10
5 5 5
0 0 0
Fig. 4 MD simulation results. a Relative number density ρ of different electrolyte ions as a function of distance from the Ni cathode surface withoxygen concentration of 0. b Relative number density ρ of different electrolyte ions as a function of distance from the Ni cathode surface with oxygenconcentration of 0.12 mmol/cm3. c Relative number density ρ of different electrolyte ions as a function of distance from the Ni cathode surface withoxygen concentration of 0.12 mmol/cm3 and with a charge of +0.0083e/Ni-atom. d The relative number density ρ of OH− ions as a function of theconcentration of oxygen in the electrolyte. e The relative density of OH− ions in the stern layer as a function of the charge number for per Ni atom
ARTICLE NATURE COMMUNICATIONS | DOI: 10.1038/s41467-017-00778-z
4 NATURE COMMUNICATIONS |8: 645 |DOI: 10.1038/s41467-017-00778-z |www.nature.com/naturecommunications

presence of oxygen in electrolyte, the initial resistance is 17%higher than that in the electrolyte without O2.
Our I–V measurement approach has several advantagesover EIS. First, our EIS data show nearly no differences at thehighest frequency under oxygen-presence and oxygen-absenceconditions. It could not provide sufficient resolution to make acomparison of the electrode resistance under these two condi-tions. Second, EIS measurement is time-consuming, which is notfeasible for in situ measurement. Third, a relative complicatedequivalent circuit model is required to interpret EIS results.
The working principle behind our I–V measurement is thegating effect of graphene. The electrochemical potential appliedon our device can be decomposed into two parts (SupplementaryFig. 13). One is applied on the electric double layer (EDL) at theelectrode–electrolyte interface. The second one is the voltageapplied on graphene. According to the electrochemical-gatingmodel31, 32, we have.
VG ¼ h � vF �ffiffiffiffiffiffi
πnp
eþ neCdl
ð1Þ
where VG is the electrochemical gate voltage vs. reference, h is thereduced Plank’s constant, vF is the Fermi velocity of the Diracelectron in nanosheets, e is the electron charge, n is the carrierdensity, and Cdl is the double layer capacitance. The first term onthe right of Eq. (1) describes the voltage applied on graphene andits relationship to carrier density n. The second term describes therelationship between EDL voltage and EDL capacitance32.
We hypothesize that oxygen would lead to a reduced doublelayer capacitance (Cdl). As a result, the EDL voltage (second termin Eq. (1)) will increase. Provided a constant value of VG in ourexperiments, the carrier density n in the electrode would drop(first term in Eq. (1)) and the electrode resistance increases. Thiscould explain the observed electrode resistance differencesbetween oxygen-presence and oxygen-absence conditions in ourI–V experiments.
MD simulation. In order to understand how O2 could influenceCdl, MD simulations were employed (Supplementary Note 5,Supplementary Fig. 14, Supplementary Tables 1 and 2). In oursimulations, the electrolyte was 1M KOH with or without oxygenmolecules. The catalyst surface was Ni(111) plane. The electrolytewas maintained at 298 K using the Berendsen thermostat.MD simulation was run for 1.5 ns to ensure thermo-equilibriumof the system. The results generated during the last 1 ns were usedto analyze the EDL structure near the Ni surface. Here, we splitthe electrolyte region into a set of bins (of 0.5 Å in width) alongthe direction (x) perpendicular to the Ni surface. The relativenumber densities ρ(x) of OH−, K+, and O2 were calculated as theratio of volumetric number density in each bin over that inelectrolyte bulk33.
Figure 4a and b show the results on neutral Ni surface at anoxygen concentration of 0.0 and 1.2 mmol/cm3, respectively. Thesharp peaks represent accumulation of the electrolyte ions andoxygen molecules next to the electrode surfaces. Compared withFig. 4a, Fig. 4b clearly demonstrates that O2 is adsorbed atinterface, where the position is similar to the position of adsorbedOH−, and significantly hindered accumulation of OH− in EDL.The increase of O2 concentration leads to a monotonic decreaseof OH− density at the reaction interface (Fig. 4d, SupplementaryFig. 15), leading to the decrease of Cdl.
Considering Ni surface would be oxidized during the OERprocess, other MD simulations were performed to examinewhether the surface oxidation would affect our observations basedon the above pure Ni theoretical model. As it is difficult todetermine oxidation degree at the Ni surface, we choose the fully
oxidized case (NiO-Ni). The MD model and the unit cellstructure of NiO-Ni are presented in Supplementary Fig. 16.The ions distribution next to the NiO-Ni surface under oxygen-presence condition is presented in Supplementary Fig. 17. Again,the oxygen molecules exhibit a strong adsorption near the surface,leading to a reduction of OH− density (Supplementary Fig. 18).The detrimental effect of oxygen should stem from the strong vander Waals (vdW) force between O(O2) and Ni/NiO, which isnearly the same to the interaction between O(OH−) and Ni/NiO(Supplementary Table 3). The similar interaction force drives theO2 and OH− occupy similar positions next to the Ni/NiO surface.This reduces the amount of OH− in the EDL.
During the OER process, the Ni surface should have positivecharges. The Coulomb force could drive OH− closer to Ni surface,eliminating the detrimental role of O2. To examine this effect, aset of surface charges was induced in the system (SupplementaryFig. 19). Figure 4c shows the results of a charged Ni surface with+0.0083e/Ni-atom and oxygen concentration of 1.2 mmol/cm3.The Coulomb interaction clearly leads to an enhanced relativedensity of OH− (Fig. 4c) in comparison with that in Fig. 4a.But the hindrance effect of oxygen still exists (Fig. 4e). In Fig. 4e,we summarize the OH− relative density in the stern layer asa function of surface charge at oxygen concentration of 0 or1.2 mmol/cm3. The difference is narrowing under a higher surfacecharge. This trend is consistent with the narrowing conductivitygap in the temporal I–V experimental results (Fig. 3c).
DiscussionThe previous studies conclude that the reaction steps in alkalineelectrolyte for the OER process are as follows (the * representsactive site on the metal surface)34:
4OH� $ OH� þ 3OH� þ e� ð2Þ
$ O� þH2Oþ 2OH� þ 2e� ð3Þ
$ HOO� þH2OþOH� þ 3e� ð4Þ
! O2 þ 2H2Oþ 4e� ð5Þwhere Ni is not able to immediately oxidize water. Ni trans-
forms into a highly reactive species in the alkaline solution andthen generates O2. From thermodynamic aspect, the increasedO2 concentration in reaction system leads to a higher Gibbsfree energy, thereby increasing the onset potential under oxygen-presence condition. It could also be understood in terms of LeChatelier’s principle. However, the reaction kinetic processes arenot considered in above two thermodynamic aspects. The kineticprocess includes the transport of the reactants to an active site,the adsorption of the reactions to the active site, and the reactionof reactants to form an adsorbed product. Using EIS, temporalI–V measurement results, and MD simulation, we can concludethat O2 can adsorb near the surface of catalyst driven by thestrong vdW interaction. Their position overlaps with that ofadsorbed OH− ions, reducing the concentration of OH− in EDL,thus slowing down the charge transfer process and OER reactionkinetics. Different from the Le Chatelier’s principle, whichprovides a clue to understand reaction direction from thermo-dynamic perspective, our new understanding offers insights onhow surface adsorbed O2 could influence the reaction kinetics. Itshould be noted that our conclusion is similar to that in catalyticN2O gas decomposition, in which reaction rate could beimproved for around three times by using an oxygen-selectivemembrane35.
NATURE COMMUNICATIONS | DOI: 10.1038/s41467-017-00778-z ARTICLE
NATURE COMMUNICATIONS |8: 645 |DOI: 10.1038/s41467-017-00778-z |www.nature.com/naturecommunications 5

In conclusion, we developed a nano-electrochemicalNi-graphene device to investigate the effects of oxygen in theelectrolyte on OER kinetics at catalyst interfaces. By removing O2
in electrolyte, we observed a significant decrease in Tafel slope ofover 20% and an early onset potential of 1.344 V vs. RHE. Atemporal in-device electronic characteristic measurement wasemployed together with an on-chip EIS measurement andMD simulations. We conclude that the oxygen acts as a barrierto significantly reduce the concentration of OH− ions atcatalyst surface, slowing down the charge transfer processand OER kinetics. This new insight could provide valuableclues to design high-performance catalyst systems. This workalso presents a powerful nano-electrochemical device platformand a temporal I–V measurement method to investigate theOER kinetic interface properties.
MethodsOER activity characterization and in-device EIS measurement. The devicewas loaded on a probe station (Lake shore, PPTX). The OER activitieswere characterized with a three-electrode electrochemical system using anelectrochemical workstation (Autolab PGSTAT 302N). The WE1, platinum (Pt),and Ag/AgCl/saturated KCl were used as the working, counter, and referenceelectrodes, respectively (Supplementary Note 6). Two different electrolyteswere adopted with different contents of O2, namely 0.1 M KOH under presencewith O2 or absence with O2. Specifically, the electrolyte absent with O2 wasprepared using degassing method where N2 was inserted into the 5 mL 0.1 MKOH electrolyte for 1 h to expel the O2. This device was maintained at 298 K byusing a model 336 cryogenic temperature controller. The cyclic voltammetry (CV)experiments at different scan rates (5–30 mV/s) and linear-sweep voltammograms(LSV) at a scan rate of 5 mV/s were performed. The catalyst was cycled untilstable CV curves were obtained. After that the catalyst performance was measuredin LSV testing36. The in-device EIS was controlled at different electrochemicalworking potentials and to characterize the effects of the oxygen on the catalyticinterface. To ensure a complete characterization, the EIS measurements wererecorded over four frequency decades, from 10 KHz to 1 Hz, with potentialamplitude of 10 mV.
Temporal I–V measurement. As outlined in Fig. 1d, a semiconductor parameteranalyzer (Agilent, B1500A) was connected to the WE2 and WE3 electrode.The temporal I–V measurement detected the electrical transport properties ofNi-graphene nanosheet during the electrolysis process under a tiny bias voltage(up to 2 mV). Supplementary Fig. 20 shows the schematic illustration of theconcurrent measurement of this work, and the equivalent circuit model of theelectrical transport spectroscopy (gate) measurement37. Note that all the sampleswere measured at an excitation current <20 nA and thus any heating effects shouldbe negligible.
Data availability. The data that support the finding of this study are available fromthe corresponding authors on reasonable request.
Received: 12 January 2017 Accepted: 27 July 2017
References1. Barnett, S. M., Goldberg, K. I. & Mayer, J. M. A soluble copper–bipyridine
water-oxidation electrocatalyst. Nat. Chem. 4, 498–502 (2012).2. Dionigi, F. & Strasser, P. NiFe-based (Oxy) hydroxide catalysts for
oxygen evolution reaction in non-acidic electrolytes. Adv. Energy Mater 6, 1614(2016).
3. Subbaraman, R. et al. Trends in activity for the water electrolyser reactions on3d M (Ni, Co, Fe, Mn) hydr (oxy) oxide catalysts. Nat. Mater 11, 550–557(2012).
4. Ng, J. W. D. et al. Gold-supported cerium-doped NiOx catalysts for wateroxidation. Nat. Energy 1, 16053 (2016).
5. Ding, M. et al. An on-chip electrical transport spectroscopy approach for in situmonitoring electrochemical interfaces. Nat. Commun. 6, 7867 (2015).
6. Holze, R. Surface and Interface Analysis: An Electrochemists Toolbox Vol. 74(Springer Science & Business Media, 2008).
7. Doyle, R. L. & Lyons, M. E. An electrochemical impedance study of the oxygenevolution reaction at hydrous iron oxide in base. Phys. Chem. Chem. Phys. 15,5224–5237 (2013).
8. Gong, M. et al. An advanced Ni–Fe layered double hydroxide electrocatalyst forwater oxidation. J. Am. Chem. Soc. 135, 8452–8455 (2013).
9. Mistry, H., Varela, A. S., Kühl, S., Strasser, P. & Cuenya, B. R. Nanostructuredelectrocatalysts with tunable activity and selectivity. Nat. Rev. Mater. 1, 16009(2016).
10. Okamura, M. et al. A pentanuclear iron catalyst designed for water oxidation.Nature 530, 465–468 (2016).
11. Dau, H. et al. The mechanism of water oxidation: from electrolysisvia homogeneous to biological catalysis. ChemCatChem. 2, 724–761 (2010).
12. Marini, S. et al. Advanced alkaline water electrolysis. Electrochim. Acta 82,384–391 (2012).
13. Rossmeisl, J., Qu, Z.-W., Zhu, H., Kroes, G.-J. & Nørskov, J. K. Electrolysis ofwater on oxide surfaces. J. Electroanal. Chem. 607, 83–89 (2007).
14. Grimaud, A., Hong, W., Shao-Horn, Y. & Tarascon, J.-M. Anionicredox processes for electrochemical devices. Nat. Mater. 15, 121–126(2016).
15. Liu, Z. et al. Anomalous high capacitance in a coaxial single nanowire capacitor.Nat. Commun. 3, 879 (2012).
16. Boles, S. T., Sedlmayr, A., Kraft, O. & Mönig, R. In situ cycling and mechanicaltesting of silicon nanowire anodes for lithium-ion battery applications.Appl. Phys. Lett. 100, 243901 (2012).
17. Huang, J. Y. et al. In situ observation of the electrochemical lithiation of a singleSnO2 nanowire electrode. Science 330, 1515–1520 (2010).
18. Mai, L., Tian, X., Xu, X., Chang, L. & Xu, L. Nanowire electrodes forelectrochemical energy storage devices. Chem. Rev. 114, 11828–11862(2014).
19. Lieber, C. M. Semiconductor nanowires: a platform for nanoscience andnanotechnology. MRS Bull. 36, 1052–1063 (2011).
20. Tian, B. et al. Coaxial silicon nanowires as solar cells and nanoelectronic powersources. Nature 449, 885–889 (2007).
21. Xu, X. et al. In situ investigation of Li and Na ion transport with singlenanowire electrochemical devices. Nano. Lett. 15, 3879–3884 (2015).
22. Xiong, F. et al. Li intercalation in MoS2: In situ observation of its dynamicsand tuning optical and electrical properties. Nano. Lett. 15, 6777–6784(2015).
23. Welch, C. M. & Compton, R. G. The use of nanoparticles in electroanalysis: areview. Anal. Bioanal. Chem. 384, 601–619 (2006).
24. Katz, E., Willner, I. & Wang, J. Electroanalytical and bioelectroanalyticalsystems based on metal and semiconductor nanoparticles. Electroanalysis 16,19–44 (2004).
25. Gowda, S. R., Leela Mohana Reddy, A., Zhan, X. & Ajayan, P. M. Buildingenergy storage device on a single nanowire. Nano. Lett. 11, 3329–3333(2011).
26. Voiry, D. et al. The role of electronic coupling between substrate and 2D MoS2nanosheets in electrocatalytic production of hydrogen. Nat. Mater. 15, 1003(2016).
27. Armstrong, R. & Henderson, M. Impedance plane display of a reaction with anadsorbed intermediate. J. Electroanal. Chem. Interfacial Electrochem. 39, 81–90(1972).
28. Lyons, M. E. & Brandon, M. P. The significance of electrochemicalimpedance spectra recorded during active oxygen evolution for oxide coveredNi, Co and Fe electrodes in alkaline solution. J. Electroanal. Chem. 631, 62–70(2009).
29. Harrington, D. & Conway, B. a. c. Impedance of Faradaic reactions involvingelectrosorbed intermediates—I. Kinetic theory. Electrochim. Acta 32,1703–1712 (1987).
30. Strmcnik, D. et al. Improving the hydrogen oxidation reaction rate bypromotion of hydroxyl adsorption. Nat. Chem. 5, 300–306 (2013).
31. Chen, F., Qing, Q., Xia, J., Li, J. & Tao, N. Electrochemical gate-controlledcharge transport in graphene in ionic liquid and aqueous solution. J. Am. Chem.Soc. 131, 9908–9909 (2009).
32. Das, A. et al. Monitoring dopants by Raman scattering in anelectrochemically top-gated graphene transistor. Nat. Nanotechnol. 3, 210–215(2008).
33. Jiang, G., Cheng, C., Li, D. & Liu, J. Z. Molecular dynamics simulations of theelectric double layer capacitance of graphene electrodes in mono-valentaqueous electrolytes. Nano Res. 9, 174–186 (2016).
34. Rossmeisl, J., Logadottir, A. & Nørskov, J. K. Electrolysis of water on (oxidized)metal surfaces. Chem. Phys. 319, 178–184 (2005).
35. Jiang, H. et al. Direct decomposition of nitrous oxide to nitrogen by in situoxygen removal with a perovskite membrane. Angew. Chem. Int. Ed. 48,2983–2986 (2009).
36. Wang, J. et al. Synergistic effect between metal–nitrogen–carbon sheets andNiO nanoparticles for enhanced electrochemical water‐oxidation performance.Angew. Chem. Int. Ed. 54, 10530–10534 (2015).
37. Ding, M. et al. Nanoelectronic investigation reveals the electrochemical basis ofelectrical conductivity in shewanella and geobacter. ACS Nano. 10, 9919–9926(2016).
ARTICLE NATURE COMMUNICATIONS | DOI: 10.1038/s41467-017-00778-z
6 NATURE COMMUNICATIONS |8: 645 |DOI: 10.1038/s41467-017-00778-z |www.nature.com/naturecommunications

AcknowledgementsThis work was supported by the National Basic Research Program of China(2013CB934103, 2012CB933003), the National Natural Science Foundation of China(51302203, 11525211, 51272197, 51502227), the International Science & TechnologyCooperation Program of China (2013DFA50840), the Hubei Science Fund forDistinguished Young Scholars (2014CFA035), the National Science Fund forDistinguished Young Scholars and the Fundamental Research Funds for the CentralUniversities (2013-ZD-7, 2014-YB-02). This research/project was undertaken with theassistance of resources and services from the National Computational Infrastructure(NCI), which is supported by the Australian Government.
Author contributionsL.M., M.Y. and P.W. designed the experiments. M.Y., P.W., J.M. and X.P. performedthe experiments. J.Z.L., G.J. and P.W. performed the MD simulations. M.Y., P.W., J.Z.L.,G.J. and L.Q. discussed the interpretation of results and co-wrote the paper. All authorsdiscussed the results and commented on the manuscript.
Additional informationSupplementary Information accompanies this paper at doi:10.1038/s41467-017-00778-z.
Competing interests: The authors declare no competing financial interests.
Reprints and permission information is available online at http://npg.nature.com/reprintsandpermissions/
Publisher's note: Springer Nature remains neutral with regard to jurisdictional claims inpublished maps and institutional affiliations.
Open Access This article is licensed under a Creative CommonsAttribution 4.0 International License, which permits use, sharing,
adaptation, distribution and reproduction in any medium or format, as long as you giveappropriate credit to the original author(s) and the source, provide a link to the CreativeCommons license, and indicate if changes were made. The images or other third partymaterial in this article are included in the article’s Creative Commons license, unlessindicated otherwise in a credit line to the material. If material is not included in thearticle’s Creative Commons license and your intended use is not permitted by statutoryregulation or exceeds the permitted use, you will need to obtain permission directly fromthe copyright holder. To view a copy of this license, visit http://creativecommons.org/licenses/by/4.0/.
© The Author(s) 2017
NATURE COMMUNICATIONS | DOI: 10.1038/s41467-017-00778-z ARTICLE
NATURE COMMUNICATIONS |8: 645 |DOI: 10.1038/s41467-017-00778-z |www.nature.com/naturecommunications 7