Ownership concentration and firm performance: Evidence ... · Ownership concentration and firm...
23
METU Studies in Development, 30 (December), 2003, 181-203 Ownership concentration and firm performance: Evidence from Turkish firms Zeynep Önder Bilkent University, Faculty of Business Administration, Ankara 06533 Turkey Abstract This paper examines the determinants of ownership concentration and the relationship between ownership structure and firm performance in Turkish firms. The empirical results show that ownership concentration increases with firm size, controlling for total risk and the industry of the firm. The results also suggest that the measure of firm performance is important in analyzing the relationship between firm performance and its ownership structure. A quadratic relationship between the largest shareholder’s concentration and Tobin’s Q is observed in Turkish firms. Furthermore, the findings indicate that the relationships obtained for developed markets cannot be generalized to emerging markets. 1. Introduction The relationship between ownership structure and firm performance has been of interest to researchers given the corporate governance issues arising from the separation of ownership by minority shareholders and control by managers. For example, Demsetz and Lehn (1985), Holderness and Sheehan (1988), Morck, Shleifer and Vishny (1988), McConnell and Servaes (1990), Fürst, and Kang (1998), and Cho (1998) examine this relationship in the U.S. companies; Bergström and Rydqvist (1990) analyze Swedish firms; Leech and Leahy (1991) investigate British firms; Lichtenberg and Pushner (1994) explore the association between ownership structure and firm performance in Japanese firms; Craswell, Taylor and Saywell (1997) analyze this relationship in Australian firms. Hence, most of the evidence is obtained from the U.S. companies or the companies operating in the developed markets.
-
Upload
nguyenkiet -
Category
Documents
-
view
223 -
download
1
Transcript of Ownership concentration and firm performance: Evidence ... · Ownership concentration and firm...

METU Studies in Development, 30 (December), 2003, 181-203
Ownership concentration and firm performance: Evidence from
Turkish firms
Zeynep Önder Bilkent University, Faculty of Business Administration, Ankara 06533 Turkey
Abstract This paper examines the determinants of ownership concentration and the
relationship between ownership structure and firm performance in Turkish firms. The empirical results show that ownership concentration increases with firm size, controlling for total risk and the industry of the firm. The results also suggest that the measure of firm performance is important in analyzing the relationship between firm performance and its ownership structure. A quadratic relationship between the largest shareholder’s concentration and Tobin’s Q is observed in Turkish firms. Furthermore, the findings indicate that the relationships obtained for developed markets cannot be generalized to emerging markets.
1. Introduction
The relationship between ownership structure and firm performance has been of interest to researchers given the corporate governance issues arising from the separation of ownership by minority shareholders and control by managers. For example, Demsetz and Lehn (1985), Holderness and Sheehan (1988), Morck, Shleifer and Vishny (1988), McConnell and Servaes (1990), Fürst, and Kang (1998), and Cho (1998) examine this relationship in the U.S. companies; Bergström and Rydqvist (1990) analyze Swedish firms; Leech and Leahy (1991) investigate British firms; Lichtenberg and Pushner (1994) explore the association between ownership structure and firm performance in Japanese firms; Craswell, Taylor and Saywell (1997) analyze this relationship in Australian firms. Hence, most of the evidence is obtained from the U.S. companies or the companies operating in the developed markets.
182 Zeynep ÖNDER
The differences in legal structure, corporate culture and ownership structure might result in a different relationship between ownership concentration and firm performance in developing economies. The evidence from these studies is very limited and generally examines the companies in transition economies1. This paper attempts to fill that gap and provide some evidence on the relationship between ownership concentration and firm performance in one of the emerging markets, Turkey.
La Porta et al. (1998) show that the concentration of ownership of shares in the largest public corporations is negatively related to investor protection. Turkish commercial laws originate from French civil tradition, which gives the weakest protection to shareholders and creditors, and the lowest law enforcement quality2. Therefore, it is debatable whether managers of companies located in the countries with poor investor protection act to maximize shareholders’ wealth. It can be argued that the managers of Turkish firms will not feel any obligation to act on shareholders’ behalf, since Turkish laws are poor in terms of shareholder protection and enforcement of laws. Hence, the findings on the relationship between ownership structure and firm performance in the developed economies cannot be generalized to the emerging economies, such as Turkey. Turkish companies, like those in the other emerging markets3, might have a different relationship between performance and ownership structure than U.S. and British companies where commercial laws provide the highest protection to investors.
In addition to the differences in legal structures, La Porta, Lopez-de-Silanes and Shleifer (1999) indicate that the corporate governance structure in developing economies is different. They observe that there is a higher concentration of ownership in these countries than in the developed economies. A more concentrated ownership structure might 1 There are few studies that examine how firm performance changes depending on the type of
ownership in China. For example, Zheng, Liu and Bigsten (1998) examine the differences in the technical efficiency of Chinese state, collective and township-village enterprises. Similarly, Chow and Fung (1998) compare cash flow variables of state-owned and private Chinese companies. Claessens and Djankov (1999) examine the relationship between ownership concentration and corporate performance in the Czech Republic.
2 La Porta et al. (1998) examine the legal structure in 33 countries in terms of investor protection and quality of law enforcement. They group the countries into four major categories in terms of their legal origin: English, French, German and Scandinavian. They find that English common law countries give both shareholders and creditors the strongest protection, and French civil law countries give the weakest protection, independent of the level of per capita income in the country. German civil law and Scandinavian countries generally fall in between. Moreover, the quality of law enforcement is highest in both Scandinavian and German civil law countries, followed by the English common law countries. It is lowest in French civil law countries.
3 According to La Porta et al. (1998), French origin countries are Argentina, Belgium, Brazil, Chile, Colombia, Ecuador, Egypt, France, Greece, Indonesia, Italy, Jordan, Mexico, The Netherlands, Peru, Philippines, Portugal, Spain, Turkey, Uruguay and Venezuela. Most of the French origin countries are developing countries, except Belgium, France, Italy, The Netherlands and Spain.

METU STUDIES IN DEVELOPMENT 183
reduce the probability of takeovers and, hence, result in a different relationship between concentration and performance. According to La Porta, Lopez-de-Silanes and Shleifer (1999), there is relatively little evidence on the ownership patterns of large publicly traded companies in different countries. The differences in the concentration of Turkish companies provide us an opportunity to study the impact of ownership concentration on shareholders’ wealth and firm performance for the large public companies operating in a developing economy with weak investor protection.
This paper extends the current research on the relationship between ownership concentration and firm performance in a number of important ways. First, the relationship between ownership structure and firm performance is analyzed for the Turkish firms. Turkish firms are mainly family-owned or state-owned and more concentrated than the firms analyzed currently in the literature. Second, the analysis is conducted with different measures of firm performance. Tobin’s Q and ‘return on assets’ are used as measures of firm performance.
Turkish companies, whose stocks are traded in the Istanbul Stock Exchange (ISE), are used in the analysis. The time period covers the six years between 1992 and 1997. The results suggest that the findings for developed economies cannot be generalized to the emerging markets. It is found that ownership concentration increases as size increases unlike the findings for developed economies. Although a quadratic relationship between Tobin’s Q and the largest shareholder’s concentration is found, no relationship is observed with respect to return on assets. The results for the manager-owner suggest that the agency problem is not observed in the Turkish firms even though it has poor investor protection.
This paper is organized as follows. Section 2 provides a brief review of the current evidence on the relationship between ownership structure and firm performance in several countries. Section 3 summarizes the institutional characteristics of Turkish firms. Section 4 presents the empirical model and hypotheses. The data and the sample used in the analysis are presented in Section 5, while empirical findings are reported in Section 6. Section 7 presents conclusions and the summary of findings.
2. Background on ownership structure and firm performance
Berle and Means’ (1932) seminal book “The Modern Corporation and Private Property” has stimulated enormous research on the corporate governance structure of widely held corporations in the United States. These corporations experience a dispersion of capital among small

184 Zeynep ÖNDER
shareholders but a concentration of control by managers. Hence, shareholders lose the control of the widely held companies to managers who are then able to purse their own interests rather than the shareholders’ interest, thus creating an agency problem. The potential sources of conflict between owners and managers arise from the fact that shareholders are unable to observe actual managerial effort and cannot evaluate managerial performance (Jensen and Meckling, 1976; and Ross, 1977). If the agency problem is not solved by the market for corporate control, there may be a need for shareholder monitoring. The large shareholders then have an incentive to monitor management and small shareholders act as free riders on others’ monitoring activities (Shleifer and Vishny, 1986).
If the manager is one of the large shareholders, Jensen and Meckling (1976) show that an agency problem can be observed in this situation as well because managers can make decisions that are favourable to them but which lower the market value of the firm. Another agency problem is examined by Jensen (1986). In his model, managers have the incentive to increase the size of the firm beyond the value maximizing level since managers have control of all free cash flows in the firm.
The obvious solution to these agency problems is to concentrate share holdings, i.e., several investors might have a substantial share of ownership in the firm. Hence, they can monitor management. In addition, if the manager is also one of the major shareholders, then the minority problem might disappear. Although majority ownership is not common in the U.S. or British companies, the ownership is more concentrated in the firms operating in developing economies. For example, the average holding by the three largest shareholders is more than 40 percent in the Turkish firms whose stocks are trading in the ISE. In the more concentrated companies, managers are more likely to be the owners of the company. Hence, in these companies, it is more likely to observe the combination of ownership and management and owner-managers are more likely to act to increase profitability of the firm. However, they may not be professional managers.
On the other hand, if the ownership structure is less concentrated, there is more separation of ownership from management. Although the conflict of interest between managers and owners is observed in these firms, it is more likely that these firms will be operated by professional managers. Therefore, they might have high growth rates in sales and assets as well as better management of company's resources. Moreover, the greater the size of the firm, the more costly it is to get a small fraction of the shares of the firm. Therefore, large firms are expected to be managed by the professional managers and to have less concentrated ownership structure.

METU STUDIES IN DEVELOPMENT 185
The results of the empirical studies examining the relationship between ownership structure and firm performance are mixed. For example, although Demsetz (1983) and Demsetz and Lehn (1985) find no significant relationship between ownership concentration and firm performance, measured by return on equity in the U.S. firms, Morck, Shleifer and Vishny (1988) present a quadratic relationship between ownership share of the largest shareholder and the performance of the firm, measured by Tobin’s Q. They find that performance increases when ownership is between 0 and 5 percent but it declines when ownership increases above 5 percent. However, the firms in other countries have different corporate ownership structure than the U.S. firms, and the relationship between the performance of firms and their ownership structure is found to be slightly different form that in the U.S. companies. For example, the composition and the concentration of equity ownership appear to affect corporate performance in the British and Japanese firms. Leech and Leahy (1991) find that owner-controlled British firms are associated with a higher valuation ratio, higher profitability, higher return on shareholder capital, higher return on sales and higher return on assets than manager-controlled firms. In addition, Lichtenberg and Pushner (1994) find that both composition and concentration of ownership affect corporate performance in Japan; ownership composition by financial institutions has a positive effect on the performance of Japanese firms. A curvilinear relationship between insider ownership and corporate performance is weakly supported for the Australian firms (Craswell, Taylor and Saywell, 1997) when they measure firm performance with the ratio of market value of equity to the book value of total assets. Examining Swedish listed companies, Bergström and Rydqvist (1990) observe that ownership concentration declines with the market value of equity but increases with firm specific risk.
These results suggest that the characteristics of firms located in different countries are important in analyzing the relationship between firm performance and ownership concentration. As Shleifer and Vishny (1997) point out corporate governance varies around the world. Hence, the relationship between ownership structure and the performance of firms might differ as well. The corporate governance mechanism in Turkey is also different from those analyzed in the literature. The next section explains some characteristics of Turkish firms.
3. Institutional Characteristics of Turkish Firms
3.1 General Characteristics
The state played a very significant role in the development of firms in Turkey. It was the founder and the manager of several business
186 Zeynep ÖNDER
enterprises. The expansion of private firms was facilitated with the privatization of state-owned enterprises and the joint ventures of private firms with public enterprises. The growth of private companies has taken place with the development of the highly structured form of the Turkish holding companies. Hence, private enterprises have been organized in the structure of large multi-activity firms (Buğra, 1994).
Families control the most important groups of Turkish companies, mainly holding companies. These holding companies control major part of the business enterprises in Turkey. For example, the affiliates of eight holding companies constitute 103 of the largest 500 establishments in Turkey. Among the largest 500 companies in the 1970s, 95 of them were public firms, nine belonged to the cooperatives and more than 150 of the 395 largest public enterprises were affiliates of the 30 holding companies (Buğra, 1994).
Reducing the involvement of government, the privatization programs have tried to increase efficiency and growth in the economy and to accelerate the development of the capital market in Turkey. Both state economic enterprises and companies with state participation have been under the privatization process since 1986 (Karataş, 1995). The shares of most of these companies are listed and traded on the ISE. Hence, the state economic enterprises, most of which are the biggest companies traded in the ISE, have become publicly owned.
The Turkish companies have highly concentrated and centralized ownership structures. Yurtoğlu (2000) analyzes the organization structure of 274 Turkish firms that are listed in the ISE. He finds that the majority of Turkish firms are owned and controlled by families that are associated with a large number of companies under a pyramidal ownership structure or under a complicated web of inter-corporate equity linkages. In addition, the board of directors is found to be controlled by families as well.
3.2. Listing and Disclosure Requirements
There are two ownership requirements in order to be listed in the ISE. First, corporations should have at least 250 shareholders. Second, there is a minimum public float requirement depending on total equity of the firm. In 1996, if the total equity of the firm is less than 250 billion TL, then the public stake should be at least 15% of total equity. The public stake requirement declines with total equity. If the total equity is between 250 billion TL and 500 billion TL, then the minimum requirement is 10%. It reduces to 5%, if total equity is more than 500 billion TL. However, if the public stake is less than 15% of the total equity of the firm at the time of the initial public offering, then the firm needs to increase this public stake to 15% within three years immediately

METU STUDIES IN DEVELOPMENT 187
following the initial public offering4. Relative to the other exchanges, the requirements in the ISE are much looser, resulting in a less dispersion of ownership among small investors. For example, in 1997, the public stake of the corporations whose stocks traded on the ISE varied between 1 and 98%.
There are several disclosure requirements for owners and managers of the companies listed in the ISE. Individuals or legal entities that hold more than 10% of the voting rights or 10% of the equity, have to inform the ISE about the changes in their holdings. Similarly, when these large shareholders reduce their holding below 10% level, they have to disclose this information to the ISE. In addition, the members of the board of directors, managers and owners that have 10% of the equity of the company have to report any change in their holdings if this change corresponds to at least one percent of the total equity of the firm. Moreover, the investors holding the shares of the company that do not freely float on the exchange are required to notify the Capital Market Board of Turkey and the ISE when there is a change in their holdings.
3.3. Shareholders’ Rights
Turkish laws provide weak protection to small shareholders according to La Porta et al. (1998). They measure shareholders’ protection in several countries using five aspects related to shareholders’ rights. First, if dividend rights are linked to voting rights, i.e., one-vote-one-share rule is valid, investors are better protected. In Turkey, this rule does not hold. There exist multiple voting and no-voting shares. Additionally, the firm can set the maximum number of votes per shareholder regardless of the number of shares owned. Hence, insiders can get substantial control of the company without holding substantial ownership. Second, if shareholders are allowed to mail their proxy votes directly to the company, their voice can be heard easily in the voting process. Mailing proxy vote is not allowed in Turkey. Hence, this application will reduce the voting power of the small shareholders. Third, if cumulative votes for directors or proportional representations on the board are allowed, small shareholders can have the power to put their representatives on the board of directors. However, Turkish laws do not allow for cumulative voting and proportional representation. Fourth, if shareholders have legal mechanism against perceived opposition by directors, they can go to court to challenge the decisions of managers or they can force the company to purchase their shares if these shareholders are against the management’s decisions. Turkish commercial laws do not
4 Other stock exchanges have similar requirements. For example, in order to be listed in the Seoul
Stock Exchange, companies should offer at least 40% of the capital to the public and the shares should be held by more than 300 investors (De Caries, 1988).
188 Zeynep ÖNDER
give minority shareholders any judicial avenue to challenge manager’s decisions. In addition, minority shareholders cannot force the company to buy their shares if the company makes any decision that is opposed by these shareholders. Lastly, if shareholders deposit their shares to the company or financial intermediaries before and after the shareholders’ meeting, they are prevented from selling their shares. The shares do not need to be blocked before the meeting in Turkey. Therefore, the voting shareholders do not bother to get the shares of minority shareholders5. Although the last condition will benefit to the small shareholders, the other four conditions suggest that minority shareholders in Turkish firms do not have power to make major shareholders or managers to act on their behalf.
4. Empirical Model
Studies that examine ownership concentration can be grouped into two in terms of their treatment to ownership concentration as an exogeneous or an endogeneous variable. The former group assumes that ownership concentration is an exogeneous variable that determines firm value and its performance. It is based on the argument by Jensen and Meckling (1976) and Stulz (1988) that ownership structure affects firm value6 (for example, Morck, Shleifer and Vishny, 1988; McConnell and Servaes, 1990; Leech and Leahy, 1991; Lichtenberg and Pushner, 1994; and Craswell, Taylor and Saywell, 1997). The latter group argues that ownership concentration is endogeneously determined and corporate value is taken as a determinant of ownership structure since the higher is the firm value, ceteris paribus, the higher is the price of a given fraction of the firm, resulting in less ownership concentration (for example, Demsetz and Lehn, 1985; Bergström and Rydqvist, 1990; Leech and Leahy, 1991; and Cho, 1998). In this study, both approaches are taken into consideration.
First, ownership concentration is assumed to be an endogeneous variable that is determined by the size, risk, and industry of the firm. The following major model is used in the estimations:
5 In order to have an extraordinary shareholders' meeting, at least 10% of the ownership of share
capital is needed. This percentage is close to the average for the countries analyzed, which is 11% (La Porta et al. 1998).
6 Jensen and Meckling (1976) argue that there are two types of shareholders: insiders and outsiders. Although both classes of shareholders are entitled to receive the same dividend per share, insider shareholders are able to augment the stream of cash flows by consuming additional non-marketable perks. In this model, managers have an incentive to adopt investment and financing that benefit to insider shareholders but reduce the payoffs to outside shareholders. Therefore, the value of the firm depends on the fraction of shares held by insider shareholders. The higher is the concentration by insiders, the higher is the value of the firm.
METU STUDIES IN DEVELOPMENT 189
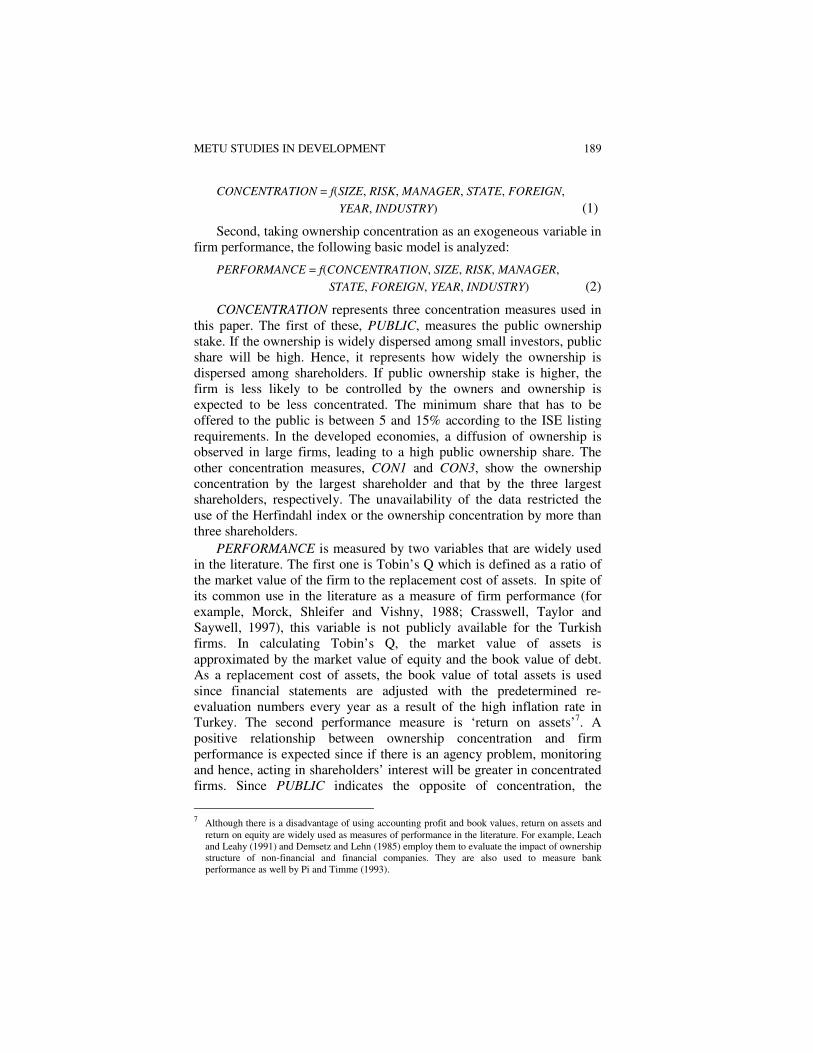
CONCENTRATION = f(SIZE, RISK, MANAGER, STATE, FOREIGN,
YEAR, INDUSTRY) (1)
Second, taking ownership concentration as an exogeneous variable in firm performance, the following basic model is analyzed:
PERFORMANCE = f(CONCENTRATION, SIZE, RISK, MANAGER,
STATE, FOREIGN, YEAR, INDUSTRY) (2)
CONCENTRATION represents three concentration measures used in this paper. The first of these, PUBLIC, measures the public ownership stake. If the ownership is widely dispersed among small investors, public share will be high. Hence, it represents how widely the ownership is dispersed among shareholders. If public ownership stake is higher, the firm is less likely to be controlled by the owners and ownership is expected to be less concentrated. The minimum share that has to be offered to the public is between 5 and 15% according to the ISE listing requirements. In the developed economies, a diffusion of ownership is observed in large firms, leading to a high public ownership share. The other concentration measures, CON1 and CON3, show the ownership concentration by the largest shareholder and that by the three largest shareholders, respectively. The unavailability of the data restricted the use of the Herfindahl index or the ownership concentration by more than three shareholders.
PERFORMANCE is measured by two variables that are widely used in the literature. The first one is Tobin’s Q which is defined as a ratio of the market value of the firm to the replacement cost of assets. In spite of its common use in the literature as a measure of firm performance (for example, Morck, Shleifer and Vishny, 1988; Crasswell, Taylor and Saywell, 1997), this variable is not publicly available for the Turkish firms. In calculating Tobin’s Q, the market value of assets is approximated by the market value of equity and the book value of debt. As a replacement cost of assets, the book value of total assets is used since financial statements are adjusted with the predetermined re-evaluation numbers every year as a result of the high inflation rate in Turkey. The second performance measure is ‘return on assets’7. A positive relationship between ownership concentration and firm performance is expected since if there is an agency problem, monitoring and hence, acting in shareholders’ interest will be greater in concentrated firms. Since PUBLIC indicates the opposite of concentration, the
7 Although there is a disadvantage of using accounting profit and book values, return on assets and
return on equity are widely used as measures of performance in the literature. For example, Leach and Leahy (1991) and Demsetz and Lehn (1985) employ them to evaluate the impact of ownership structure of non-financial and financial companies. They are also used to measure bank performance as well by Pi and Timme (1993).

190 Zeynep ÖNDER
relationship is expected to be negative when this variable is used in the estimations.
In addition to the basic model specified in equation (2), a quadratic relationship between concentration and performance is tested. Several studies have shown that the relationship between performance and concentration is curvilinear (McConnell and Servaes, 1990; Craswell, Taylor and Saywell, 1997)8. Therefore, the square of the concentration measure is added into the basic model. Previous studies have found that at low levels of ownership, a positive relationship is observed between concentration and performance but it is found to be negative at the higher levels of concentration.
SIZE is the natural logarithm of the market value of equity9. Since the inflation rate is very high in Turkey, market value is deflated with the Wholesale Price Index (WPI) and all size figures are presented in terms of the 1997 prices. The expected relationship between size and firm performance is positive. Hence, as the firm gets bigger, its performance is expected to be better. This is observed in almost all of the countries analyzed.
Similarly, the size of the firm can be considered to be one of the factors affecting ownership concentration, because the greater the size of the firm is the higher is the probability that it is open to the public and that it has less concentrated ownership structure. However, it can be also argued that since most of the Turkish firms are family owned and they become publicly owned gradually after the formation of the ISE, it will take a long time for a big firm to become publicly owned fully. Hence, a positive relationship between size and concentration is expected unlike the results of the previous studies examining the firms in developed markets.
RISK represents the debt ratio of the company. It is used to measure the riskiness of the company. In the concentrated firms, the major shareholders will hold undiversified portfolio, hence, the appropriate risk measure will be total risk of the company. Since the total risk of the
8 Morck, Sheleifer and Vishny (1988) suggest that there are two opposing factors that determine the
relationship between ownership and the value of the firm. The nature of the relationship depends on which factor dominates at a certain level of ownership concentration. They argue that at low levels of insider ownership concentration, managers might have a tendency to allocate the firm’s resources for their own interest, which may conflict with the interests of shareholders. However, as insider ownership concentration increases, manager’s interest might coincide with that of shareholders. However, in this study, the concentration of major shareholders is examined. Hence, at low levels of concentration, we might observe a separation of ownership and management. As concentration increases, the major shareholder might monitor management more to act for the interest of shareholders. However, at high levels of concentration, the major shareholders might use company’s resources for their own benefits resulting in decline in firm’s value.
9 In addition to the market value of equity, the natural logarithm of total assets is used as a measure of size of the firm. The results are similar to those obtained with market value.
METU STUDIES IN DEVELOPMENT 191
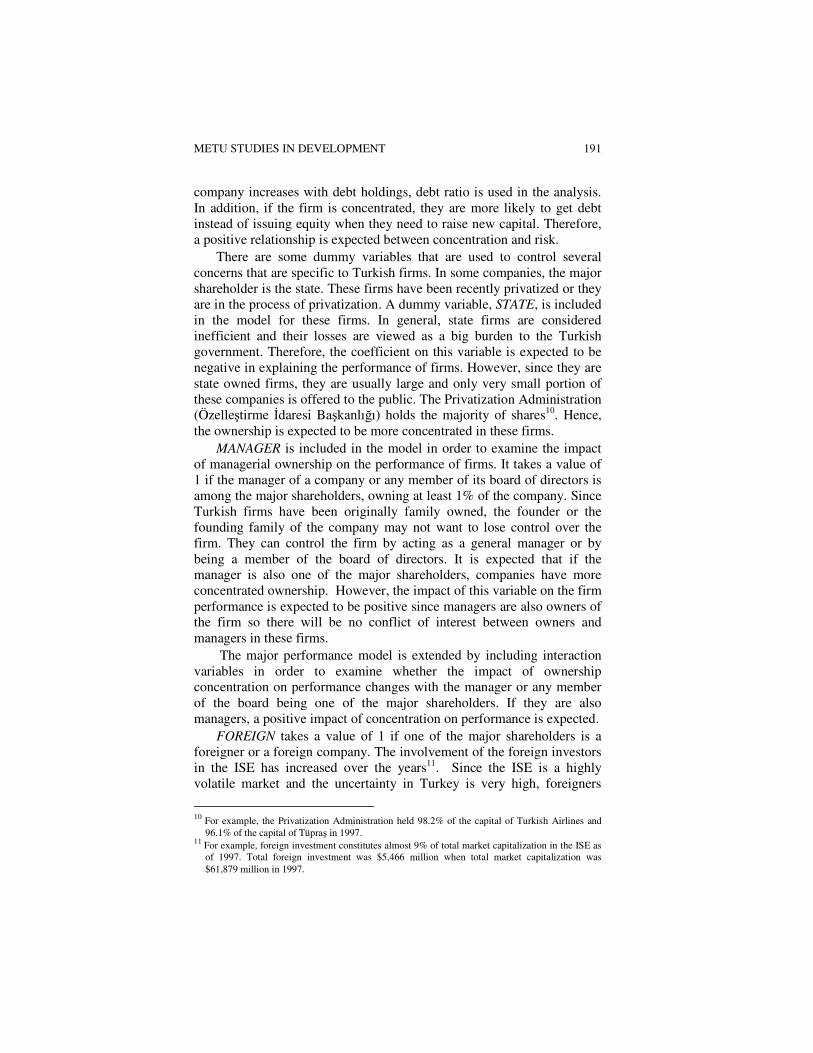
company increases with debt holdings, debt ratio is used in the analysis. In addition, if the firm is concentrated, they are more likely to get debt instead of issuing equity when they need to raise new capital. Therefore, a positive relationship is expected between concentration and risk.
There are some dummy variables that are used to control several concerns that are specific to Turkish firms. In some companies, the major shareholder is the state. These firms have been recently privatized or they are in the process of privatization. A dummy variable, STATE, is included in the model for these firms. In general, state firms are considered inefficient and their losses are viewed as a big burden to the Turkish government. Therefore, the coefficient on this variable is expected to be negative in explaining the performance of firms. However, since they are state owned firms, they are usually large and only very small portion of these companies is offered to the public. The Privatization Administration (Özelleştirme İdaresi Başkanlığı) holds the majority of shares10. Hence, the ownership is expected to be more concentrated in these firms.
MANAGER is included in the model in order to examine the impact of managerial ownership on the performance of firms. It takes a value of 1 if the manager of a company or any member of its board of directors is among the major shareholders, owning at least 1% of the company. Since Turkish firms have been originally family owned, the founder or the founding family of the company may not want to lose control over the firm. They can control the firm by acting as a general manager or by being a member of the board of directors. It is expected that if the manager is also one of the major shareholders, companies have more concentrated ownership. However, the impact of this variable on the firm performance is expected to be positive since managers are also owners of the firm so there will be no conflict of interest between owners and managers in these firms.
The major performance model is extended by including interaction variables in order to examine whether the impact of ownership concentration on performance changes with the manager or any member of the board being one of the major shareholders. If they are also managers, a positive impact of concentration on performance is expected.
FOREIGN takes a value of 1 if one of the major shareholders is a foreigner or a foreign company. The involvement of the foreign investors in the ISE has increased over the years11. Since the ISE is a highly volatile market and the uncertainty in Turkey is very high, foreigners
10 For example, the Privatization Administration held 98.2% of the capital of Turkish Airlines and
96.1% of the capital of Tüpraş in 1997. 11 For example, foreign investment constitutes almost 9% of total market capitalization in the ISE as
of 1997. Total foreign investment was $5,466 million when total market capitalization was $61,879 million in 1997.

192 Zeynep ÖNDER
might invest in the stocks of companies with better than average expected performance. Hence, if foreigners are owners, these companies are expected to perform better.
The variable, YEAR, represents a vector of five dummy variables for the years between 1993 and 1997. In order to control for any economic or regulatory changes during the sample period, year dummy variables are included in the model. All of the monetary figures are expressed in terms of 1997 prices.
The last variable, INDUSTRY, represents dummy variables for eleven industry groups. They are included in order to control for industry effects. The industry classification made by the ISE is taken as a base in identifying industries that a firm operates. It is known that some industries are more regulated than others. In addition, several studies have shown that there is a difference in performance and concentration in different industries. In addition, market value-to-book value ratio and return on assets might differ across industries and they tend to be higher in industries with a high proportion of intangible assets.
5. Sample and Data
5.1 The Sample
This study examines the determinants of ownership concentration and the relationship between ownership structure and firm performance for the companies listed in the ISE. Although the ISE started its operations in 1986, it began publishing a yearbook of companies on a regular basis in 1992. In the early years of the Exchange, the yearbooks do not have detailed information about the ownership structure of companies. Due to data constraints, the sample period starts in 1992 and ends in 1997. All the firms listed in the ISE with available ownership data are included in the sample. In order to eliminate any survivalship bias, the firms that were delisted during the sample period are also included in the sample. Because of new listings and delistings, the number of firms in the sample changes every year and it increases over the sample period because of new listings. The sample has 116 firms in 1992. The number of firms in the sample increases to 257 in 1997. The whole sample includes 1071 observations over six years.
5.2 The Data
The data on ownership structure is obtained from several issues of the Yearbook of Companies published by the ISE. This book provides information about the names of the general manager and members of the board of directors, the ownership stakes of the major shareholders, the public ownership stake and the financial statements of the companies. The financial data are obtained from the web pages of the ISE. In
METU STUDIES IN DEVELOPMENT 193
calculating the market value of the firms, the price and the number of shares outstanding are taken from the Monthly Bulletins of the ISE.
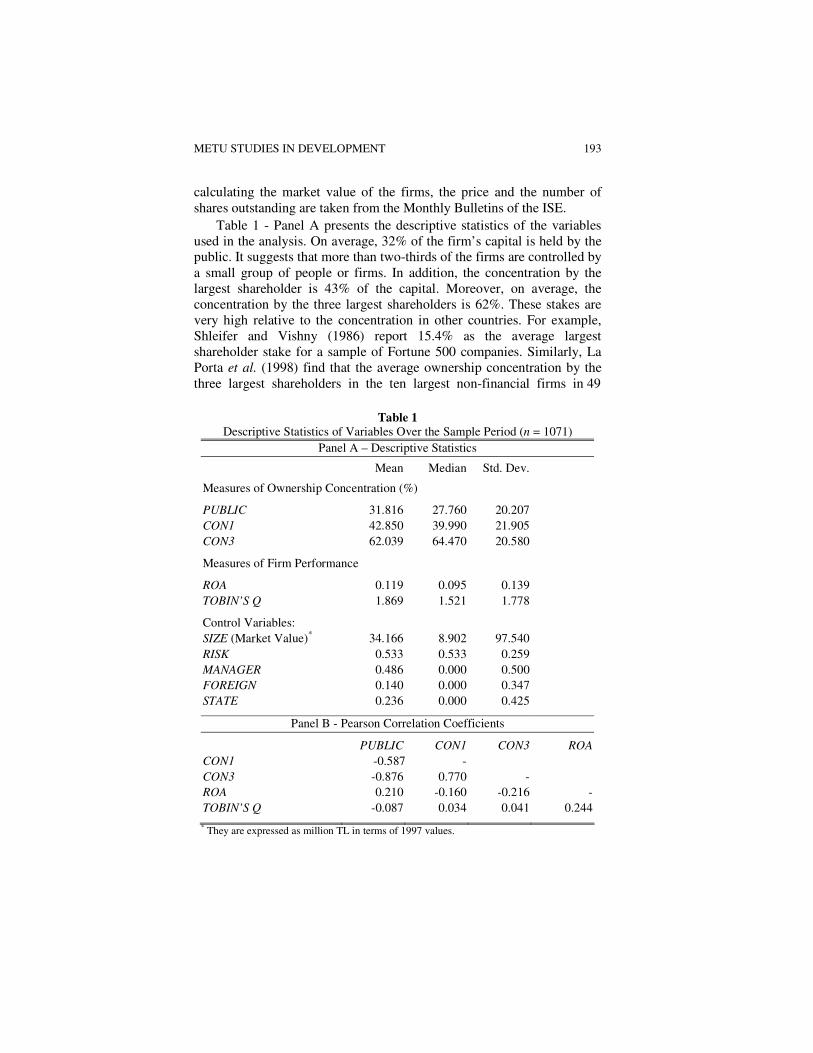
Table 1 - Panel A presents the descriptive statistics of the variables used in the analysis. On average, 32% of the firm’s capital is held by the public. It suggests that more than two-thirds of the firms are controlled by a small group of people or firms. In addition, the concentration by the largest shareholder is 43% of the capital. Moreover, on average, the concentration by the three largest shareholders is 62%. These stakes are very high relative to the concentration in other countries. For example, Shleifer and Vishny (1986) report 15.4% as the average largest shareholder stake for a sample of Fortune 500 companies. Similarly, La Porta et al. (1998) find that the average ownership concentration by the three largest shareholders in the ten largest non-financial firms in 49
Table 1
Descriptive Statistics of Variables Over the Sample Period (n = 1071) Panel A – Descriptive Statistics
Mean Median Std. Dev. Measures of Ownership Concentration (%) PUBLIC 31.816 27.760 20.207 CON1 42.850 39.990 21.905 CON3 62.039 64.470 20.580 Measures of Firm Performance ROA 0.119 0.095 0.139 TOBIN’S Q 1.869 1.521 1.778 Control Variables: SIZE (Market Value)* 34.166 8.902 97.540 RISK 0.533 0.533 0.259 MANAGER 0.486 0.000 0.500 FOREIGN 0.140 0.000 0.347 STATE 0.236 0.000 0.425
Panel B - Pearson Correlation Coefficients PUBLIC CON1 CON3 ROA
CON1 -0.587 - CON3 -0.876 0.770 - ROA 0.210 -0.160 -0.216 - TOBIN’S Q -0.087 0.034 0.041 0.244 * They are expressed as million TL in terms of 1997 values.
194 Zeynep ÖNDER
countries is 46%. In almost half of the observations, the manager or the member of the board of directors is one of the major stockholders of the firm. In addition, the state is one of the major shareholders in one-fourth of the firms. The foreign ownership is low. Foreign companies are one of the major shareholders in 14% of the sample. More than half of the assets in the firm are financed by debt.
Table 1 - Panel B presents the Pearson correlation coefficients between concentration and performance measures. The negative and significant correlation between PUBLIC and other concentration measures is found as expected. The two ownership concentration measures, CON1 and CON3, are highly correlated. The correlation between performance and concentration measures is relatively low. Public ownership stake is positively correlated with profitability measure, return on assets; but it is negatively related with market value measure, Tobin’s Q. The correlations are just the opposite when ownership concentration is measured with CON1 and CON3.
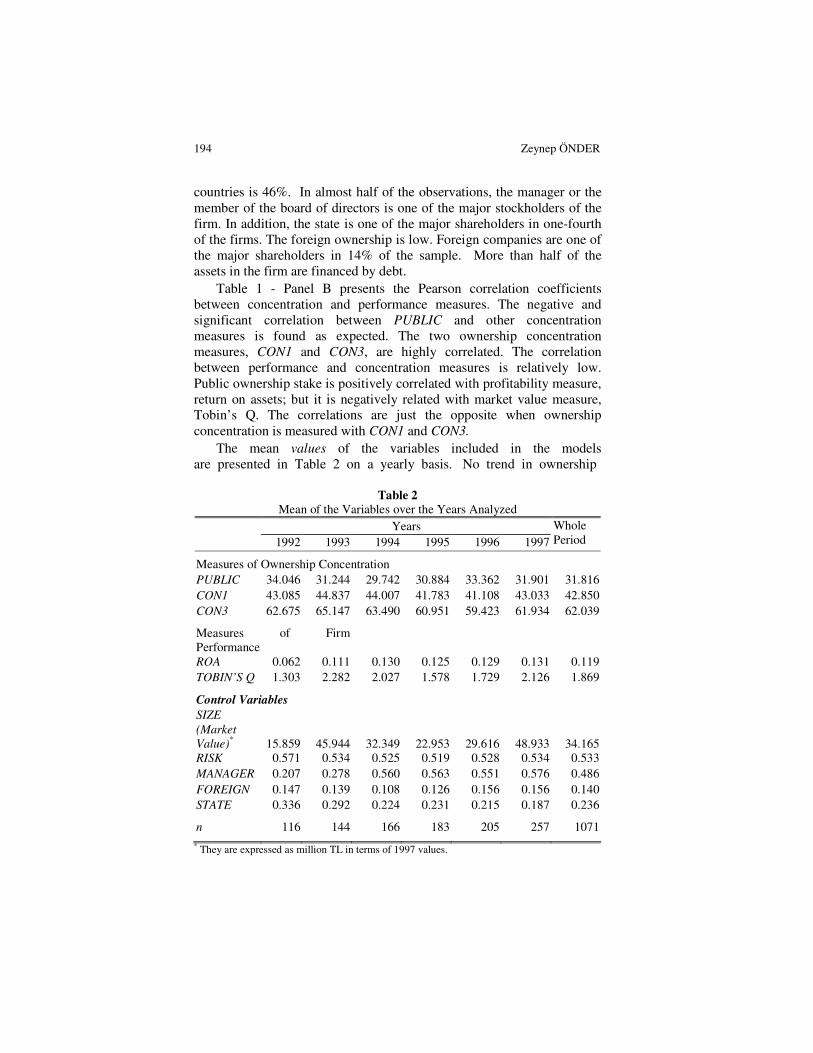
The mean values of the variables included in the models are presented in Table 2 on a yearly basis. No trend in ownership
Table 2
Mean of the Variables over the Years Analyzed Years 1992 1993 1994 1995 1996 1997
Whole Period
Measures of Ownership Concentration PUBLIC 34.046 31.244 29.742 30.884 33.362 31.901 31.816 CON1 43.085 44.837 44.007 41.783 41.108 43.033 42.850 CON3 62.675 65.147 63.490 60.951 59.423 61.934 62.039 Measures of Firm Performance
ROA 0.062 0.111 0.130 0.125 0.129 0.131 0.119 TOBIN’S Q 1.303 2.282 2.027 1.578 1.729 2.126 1.869 Control Variables SIZE
(Market
Value)* 15.859 45.944 32.349 22.953 29.616 48.933 34.165
RISK 0.571 0.534 0.525 0.519 0.528 0.534 0.533 MANAGER 0.207 0.278 0.560 0.563 0.551 0.576 0.486 FOREIGN 0.147 0.139 0.108 0.126 0.156 0.156 0.140 STATE 0.336 0.292 0.224 0.231 0.215 0.187 0.236 n 116 144 166 183 205 257 1071 * They are expressed as million TL in terms of 1997 values.

METU STUDIES IN DEVELOPMENT 195
concentration seems to be observed over the years analyzed12. Both measures of firm performance are lowest in 1992. The increase in the performance measures in last years suggests an improvement in the firm performance in recent years. The state involvement in firms seems to be declining. The managers and the board of directors are more likely to become one of the major shareholders in the later periods. Foreign involvement is higher in the latter years than the early periods of the analysis.
6. Empirical Results
In this section, first, the determinants of ownership concentration are explored by taking ownership structure as an endogeneous variable. Then, how the ownership concentration affects the firm performance is investigated by taking ownership structure as an exogeneous variable. All models are estimated using ordinary least squares (OLS) with and without industry dummy variables.
6.1 Determinants of Ownership Concentration
Table 3 reports empirical evidence for the determinants of the ownership concentration in Turkish firms. Although previous studies find that ownership concentration decreases with size (for example, Demsetz and Lehn, 1985; and Bergström and Rydqvist, 1990), the relationship is found to be reverse in Turkish firms. The results indicate that ownership concentration by the largest shareholder, CON1, and ownership concentration by the three largest shareholders, CON3, increase significantly with SIZE, measured with the market value of the equity. The relationship between PUBLIC and SIZE is found to be negative and significant13. However, the significance of the coefficient on SIZE in CON1 model disappears when industry dummy variables are included in the model. So, within the same industry, size does not significantly affect the concentration by the largest shareholder.
The positive relationship between size and ownership concentration is against the expectations because Demsetz and Lehn (1985) explain that the market value of the firm is high and therefore, the value of getting a small fraction of ownership will be high in large firms. Hence, a greater diffusion of ownership is expected in large firms. However, this explanation cannot be applied for the Turkish firms because Turkish
12 The ISE is a newly established stock market. The initial listing requirements have been changing
over time. For example, there was no regulation about public float rate until 1995. However, since 1996, the minimum public float rate depending on the firm’s total capital has been required for the listing in the ISE.
13 The models are also estimated with performance measures as well. The coefficients on size and risk and other variables do not change when performance measures are included in the model.

196 Zeynep ÖNDER
Table 3
Regression Analysis of Ownership Concentration for Turkish Firms Listed in the ISE, 1992-1997a
PUBLIC PUBLIC CON1 CON1 CON3
CON3
Intercept 1.0240*** (10.14)
0.9842*** (9.52)
0.0481 (0.39)
0.1975 (1.73)
0.1028 (1.00)
0.1904 (1.89)
SIZE -0.0342***
(-5.58) -0.0344***
(-5.97) 0.0183**
(2.27) 0.0141 (1.93)
0.0243*** (3.74)
0.0223***
(3.71) RISK -0.2525***
(-7.53) -0.2815***
(-7.80) 0.1693***
(4.03) 0.2231***
(5.69) 0.2386***
(6.76) 0.2785***
(7.99) MANAGER 0.0174
(0.99) 0.0168 (0.99)
-0.0607*** (-2.86)
-0.0537** (-2.73)
-0.0518*** (-2.84)
-0.0472** (-2.76)
STATE -0.0167 (-0.87)
-0.0347 (-1.67)
0.0511 (1.84)
0.0780*** (2.90)
0.0224 (1.08)
0.0473* (2.22)
FOREIGN -0.0620*** (-3.41)
-0.0493** (-2.41)
0.0014 (0.05)
-0.0152 (-0.53)
0.0746*** (3.78)
0.0592** (2.71)
INDUSTRY No Yes No Yes No Yes
R2 0.2287
0.2720
0.1163
0.2040
0.2071
0.2691 Adj. R2 0.2212
0.2570
0.1077
0.1876
0.1994
0.2540
F-statistic 30.50
18.11
13.54
12.42
26.87
17.85 a t-statistics are shown in parentheses. Year dummy variables are included in all of the models.
They are not reported in the table. They are available from the author upon request. *, **, *** show significance at 10, 5 and 1% levels respectively.
firms have not been publicly owned for a long period of time. The ISE is a newly established market. It started to operate in 1986. Most of the Turkish firms are family-owned or state-owned. Hence, they have kept their control power in the firm and they have listed their companies in the ISE in order to raise new capital by issuing equity. It might take longer time to become widely owned with diffused ownership structure especially for the big firms.
Consistent with the results of previous studies, the ownership concentration increases as RISK, measured by debt ratio, increases. If most of the assets are financed by debt, the concentration by the largest and the three largest shareholders is higher. The relationship between PUBLIC and RISK also supports this observation. As debt ratio increases, the ownership share freely floating in the market declines. The firms that can finance their assets by issuing debt may not need to sell their shares to the public in order to get funds needed for investment or other operating activities of the firm.
It is found that the ownership concentration is higher in the state-controlled firms. Since most of the state-owned firms are in the process of privatization and they are big, only small share of the capital is offered to the public. Hence, in state-owned firms, the concentration is found to be
METU STUDIES IN DEVELOPMENT 197
higher than the other firms14. The coefficient is found to be significant only when industry dummy variables are included in the model. In addition, the three largest shareholders concentration is higher in the firms where one of the major shareholders is a foreign firm or a foreign individual. Similarly, the freely floating shares are lower in foreign-owned firms.
The concentration of ownership is found to be lower in firms where one of the major shareholders is a manager or a member of board of directors. It suggests that if the major shareholder is in the management, ownership needs not to be concentrated since they can control the firm without holding a large share of the capital. Moreover, since investor protection is weak in Turkey, the owner managers may not get any opposition from small investors. Therefore, they do not need to hold a larger share of the company.
Previous studies have found differences in ownership structure of financial firms, regulated industries and utilities (for example, see Demsetz and Lehn, 1985). The inclusion of the industry dummy variables has improved the explanatory power of the model. When industries are controlled, the significant relationship between the largest shareholder’s ownership concentration and the firm size disappears. However, within the same industry, as size increases, the ownership concentration by the largest three shareholders increases. Similarly, within the same industry, as size increases, the public ownership stake declines significantly.
6.2 Impact of Ownership Concentration on Firm Performance
The results obtained from ordinary least squares estimation assuming ownership concentration as an exogeneous variable are presented in Tables 4 and 5. Two different models are estimated for each performance measure. The first model (Model I) is the simplest model as specified in equation (2). Model II takes into account the quadratic relationship between ownership structure and performance measures and the interaction between ownership concentration and manager being one of the major shareholders. Each model is also estimated by using three different measures of ownership concentration: public ownership stake (PUBLIC), ownership concentration by the largest shareholder (CON1), and ownership concentration by the three largest shareholders, (CON3). The models are moderate in terms of explaining the variation in performance measures.
14 For example, one of the state-owned firms, Turkish Airlines, is in the process of privatization; only
1.83 percent of its capital is freely floating in the market; it is one of the big firms traded in the market, its market value was $ 2,348 million in 1997.
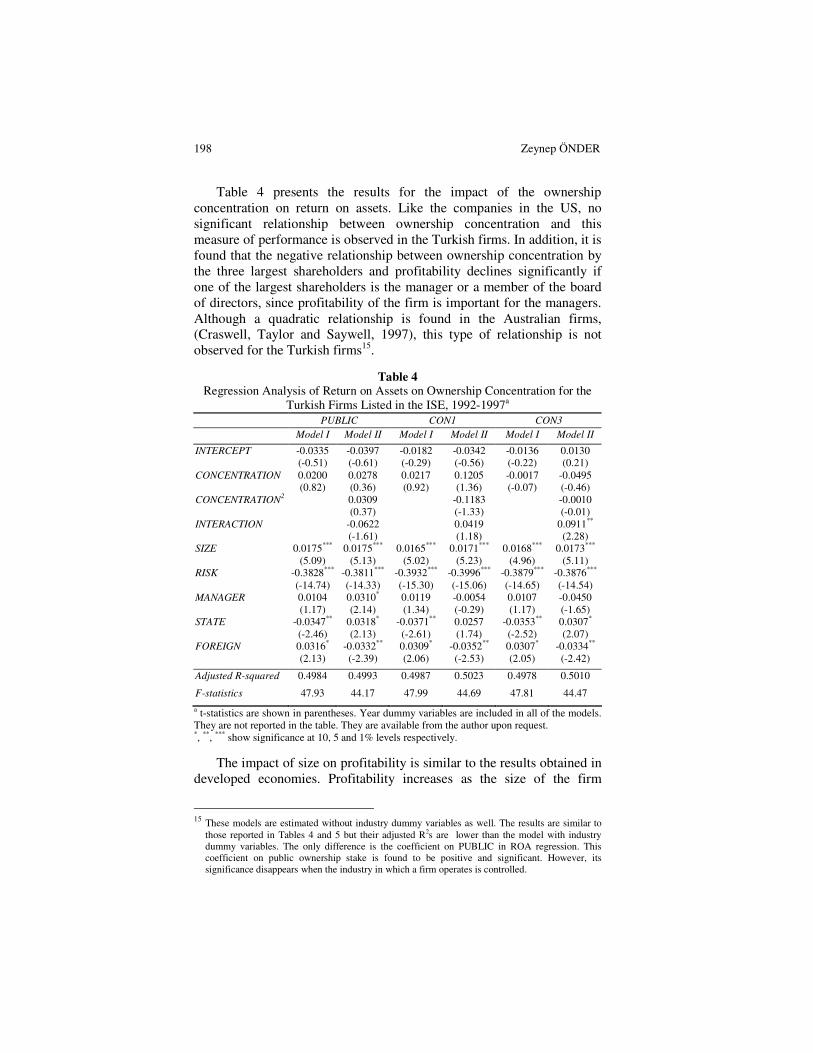
198 Zeynep ÖNDER
Table 4 presents the results for the impact of the ownership concentration on return on assets. Like the companies in the US, no significant relationship between ownership concentration and this measure of performance is observed in the Turkish firms. In addition, it is found that the negative relationship between ownership concentration by the three largest shareholders and profitability declines significantly if one of the largest shareholders is the manager or a member of the board of directors, since profitability of the firm is important for the managers. Although a quadratic relationship is found in the Australian firms, (Craswell, Taylor and Saywell, 1997), this type of relationship is not observed for the Turkish firms15.
Table 4 Regression Analysis of Return on Assets on Ownership Concentration for the
Turkish Firms Listed in the ISE, 1992-1997a PUBLIC
CON1 CON3
Model I Model II Model I Model II Model I Model II
INTERCEPT -0.0335 (-0.51)
-0.0397 (-0.61)
-0.0182 (-0.29)
-0.0342 (-0.56)
-0.0136 (-0.22)
0.0130 (0.21)
CONCENTRATION 0.0200 (0.82)
0.0278 (0.36)
0.0217 (0.92)
0.1205 (1.36)
-0.0017 (-0.07)
-0.0495 (-0.46)
CONCENTRATION2 0.0309
(0.37) -0.1183
(-1.33) -0.0010
(-0.01) INTERACTION -0.0622
(-1.61) 0.0419
(1.18) 0.0911**
(2.28) SIZE 0.0175***
(5.09) 0.0175***
(5.13) 0.0165***
(5.02) 0.0171***
(5.23) 0.0168***
(4.96) 0.0173***
(5.11) RISK -0.3828***
(-14.74) -0.3811***
(-14.33) -0.3932*** (-15.30)
-0.3996*** (-15.06)
-0.3879***
(-14.65) -0.3876***
(-14.54) MANAGER 0.0104
(1.17) 0.0310*
(2.14) 0.0119 (1.34)
-0.0054 (-0.29)
0.0107 (1.17)
-0.0450 (-1.65)
STATE -0.0347** (-2.46)
0.0318*
(2.13) -0.0371**
(-2.61) 0.0257 (1.74)
-0.0353** (-2.52)
0.0307*
(2.07) FOREIGN 0.0316*
(2.13) -0.0332**
(-2.39) 0.0309*
(2.06) -0.0352**
(-2.53) 0.0307*
(2.05) -0.0334**
(-2.42) Adjusted R-squared 0.4984
0.4993
0.4987
0.5023
0.4978
0.5010
F-statistics 47.93
44.17
47.99
44.69
47.81
44.47
a t-statistics are shown in parentheses. Year dummy variables are included in all of the models. They are not reported in the table. They are available from the author upon request. *, **, *** show significance at 10, 5 and 1% levels respectively.
The impact of size on profitability is similar to the results obtained in developed economies. Profitability increases as the size of the firm
15 These models are estimated without industry dummy variables as well. The results are similar to
those reported in Tables 4 and 5 but their adjusted R2s are lower than the model with industry dummy variables. The only difference is the coefficient on PUBLIC in ROA regression. This coefficient on public ownership stake is found to be positive and significant. However, its significance disappears when the industry in which a firm operates is controlled.

METU STUDIES IN DEVELOPMENT 199
increases. However, if the percentage of assets financed with debt increases, the profitability of the firm declines. One explanation is that since interest rates are very high in Turkey, the cost of getting debt will be high. Hence, as the debt ratio increases, the interest expenses will be higher leading to lower profitability. As expected, state-owned firms have lower return on assets. In addition, although the firms with foreign investors have higher profitability, this relationship is found to be reversed when the quadratic model is employed. Controlling for the public ownership stake, it is found that if the manager or the member of the board of directors is one of the major stockholders, the profitability is higher than the profitability of firms where managers are not major stockholders.
Table 5 presents the results for Tobin’s Q. No significant relationship between public ownership stake (PUBLIC) and Tobin’s Q is found controlling for the size and risk of the firm. Although no significant impact of ownership concentration on performance is observed in the simple model, a significant quadratic relationship is found between the concentration by the largest shareholder and firm performance, similar to
Table 5 Regression Analysis of Tobin’s Q on Ownership Concentration for the Turkish
Firms Listed in the ISE, 1992-1997a
a t-statistics are shown in parentheses. Year dummy variables are included in all of the models. They are not reported in the table. They are available from the author upon request. *, **, *** show significance at 10, 5 and 1% levels respectively.
PUBLIC CON1 CON3
Model I Model II Model I Model II Model I Model II
INTERCEPT -2.4952*** (-4.21)
-2.6475*** (-4.34)
-3.0938***
(-4.41) -3.5778***
(-4.46) -3.1017***
(-4.43) -3.4330***
(-4.39) CONCENTRATION -0.5693
(-1.49) 0.0245 (0.03)
0.1941 (0.80)
2.8017** (2.63)
0.2430 (0.93)
2.0040 (1.75)
CONCENTRATION2 -0.1597 (-0.19)
-2.5109** (-2.47)
-1.6668 (-1.78)
INTERACTION -0.8283 (-1.34)
-0.2778 (-0.68)
0.1252 (0.30)
SIZE 0.3080*** (6.81)
0.3087*** (6.80)
0.3248***
(6.53) 0.3279***
(6.27) 0.3222***
(6.53) 0.3228***
(6.40) RISK -0.8725***
(-2.88) -0.8715***
(-2.91) -0.7556** (-2.77)
-0.8734*** (-3.01)
-0.7799** (-2.76)
-0.8405*** (-2.87)
MANAGER 0.1389 (1.16)
0.4154 (1.52)
0.1397 (1.19)
0.2529 (1.41)
0.1408 (1.19)
0.0648 (0.24)
STATE -0.1337 (-1.03)
-0.0228 (-0.17)
-0.1291 (-0.99)
-0.0673 (-0.46)
-0.1254 (-0.97)
-0.0112 (-0.09)
FOREIGN -0.0269 (-0.20)
-0.1075 (-0.85)
0.0041 (0.03)
-0.1197 (-0.93)
-0.0133 (-0.10)
-0.0992 (-0.79)
Adj. R2 0.2167
0.2174
0.2141
0.2186
0.2142
0.2157 F-statistic 14.07
13.03
13.86
13.11
13.87
12.91
200 Zeynep ÖNDER
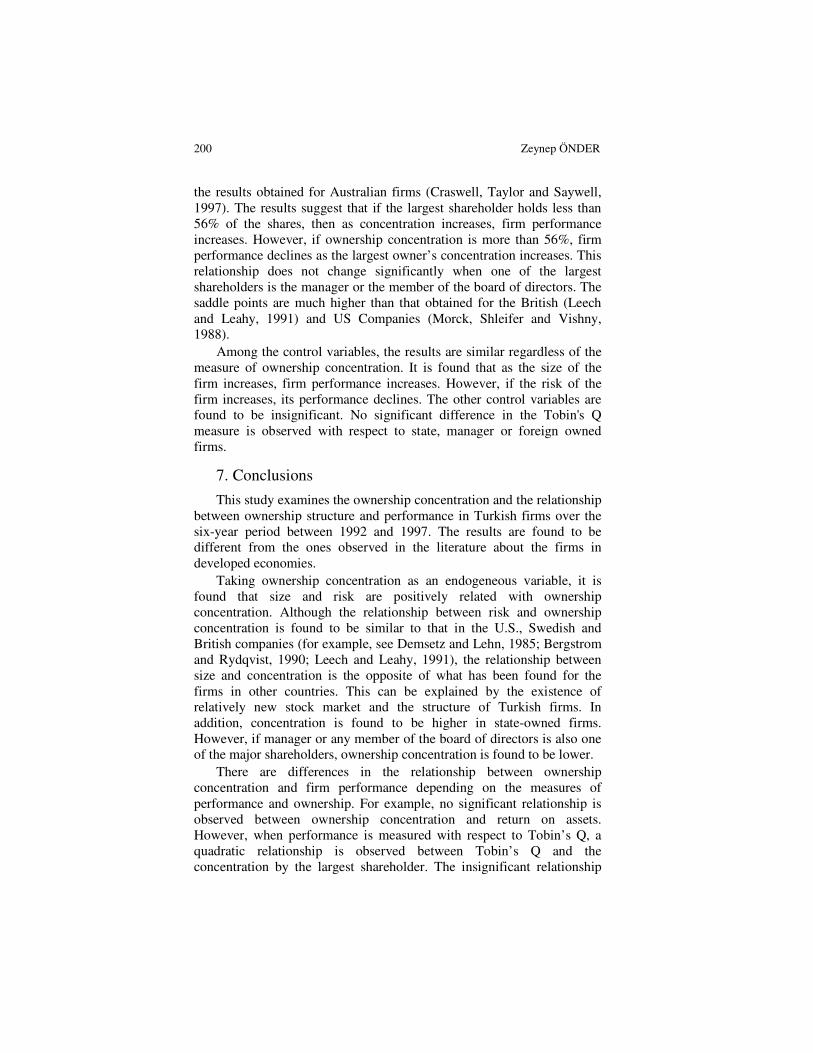
the results obtained for Australian firms (Craswell, Taylor and Saywell, 1997). The results suggest that if the largest shareholder holds less than 56% of the shares, then as concentration increases, firm performance increases. However, if ownership concentration is more than 56%, firm performance declines as the largest owner’s concentration increases. This relationship does not change significantly when one of the largest shareholders is the manager or the member of the board of directors. The saddle points are much higher than that obtained for the British (Leech and Leahy, 1991) and US Companies (Morck, Shleifer and Vishny, 1988).
Among the control variables, the results are similar regardless of the measure of ownership concentration. It is found that as the size of the firm increases, firm performance increases. However, if the risk of the firm increases, its performance declines. The other control variables are found to be insignificant. No significant difference in the Tobin's Q measure is observed with respect to state, manager or foreign owned firms.
7. Conclusions
This study examines the ownership concentration and the relationship between ownership structure and performance in Turkish firms over the six-year period between 1992 and 1997. The results are found to be different from the ones observed in the literature about the firms in developed economies.
Taking ownership concentration as an endogeneous variable, it is found that size and risk are positively related with ownership concentration. Although the relationship between risk and ownership concentration is found to be similar to that in the U.S., Swedish and British companies (for example, see Demsetz and Lehn, 1985; Bergstrom and Rydqvist, 1990; Leech and Leahy, 1991), the relationship between size and concentration is the opposite of what has been found for the firms in other countries. This can be explained by the existence of relatively new stock market and the structure of Turkish firms. In addition, concentration is found to be higher in state-owned firms. However, if manager or any member of the board of directors is also one of the major shareholders, ownership concentration is found to be lower.
There are differences in the relationship between ownership concentration and firm performance depending on the measures of performance and ownership. For example, no significant relationship is observed between ownership concentration and return on assets. However, when performance is measured with respect to Tobin’s Q, a quadratic relationship is observed between Tobin’s Q and the concentration by the largest shareholder. The insignificant relationship

METU STUDIES IN DEVELOPMENT 201
between firm performance and ownership concentration observed in some studies, such as Demsetz and Lehn (1985), can be explained with the choice of the performance measure.
The results suggest that we do not observe an agency problem in Turkish firms. According to Jensen and Meckling (1976), if managers are shareholders, then they can use resources of the company favorable to themselves. However, the results indicate that if a manager is one of the largest shareholders, there is no significant difference in firm performance, unlike in British firms. Although shareholder protection is low in Turkey because of the centralized ownership structure, we do not observe a significant impact, unlike British firms in which owner-controlled firms perform better than the manager-controlled firms. In addition, if a manager is one of the major owners, the ownership is less concentrated. This finding also supports that if there is a manager who is also the owner of the company, the ownership does not need to be concentrated to monitor management. This result might be explained by the weak shareholder protection. Because of weak protection, they can get control without holding substantial ownership share according to the Turkish laws.
The quadratic relationship between ownership concentration and firm performance, measured by Tobin’s Q is also observed in Turkish firms. If less than half of the shares are held by a small group of people, we observe a positive relationship; this figure is lower in US companies at 5%. The reason might be that ownership in Turkish firms is more concentrated than that for US firms. However, the results suggest that if a single owner holds more than half of the shares, she/he might be using the company’s resources for her/his purposes instead of maximizing firm value.
All these results indicate that the characteristics of firms are important in examining the relationship between ownership structure and firm performance in different countries. All of the previous studies examine firms in English origin countries, such as the US, Britain and Australia. These countries have high ownership protection, and ownership structure is found to be affected by firm performance. However, in Turkish firms, ownership structure is found to be positively related with size and risk of the firm, and the results suggest that there is a quadratic relationship between concentration by the largest shareholder and the relative market value of the firm: as ownership concentration by the largest shareholder increases, the relative market value of firm first increases but then it declines with the increase in the largest shareholder’s concentration.
202 Zeynep ÖNDER
References
BERGSTRÖM, C. and RYDQVIST, K. (1990), “The Determinants of Corporate Ownership, An Empirical Study on Swedish Data”, Journal of Banking and
Finance, 14, 237-53. BERLE, A. A. and MEANS, G. C. (1932), The Modern Corporation and Private
Property, New York: Macmillan. BUĞRA, A. (1994), State and Business in Modern Turkey, A Comparative Study.
Albany, State University of New York Press. CHO, M. (1998), “Ownership Structure, Investment and the Corporate Value, An
Empirical Analysis”, Journal of Financial Economics, 47(1), 103-21. CHOW, C. K. W. and FUNG, M. K. Y. (1998), “Ownership Structure, Lending Bias
and Liquidity Constraints, Evidence from Shanghai’s Manufacturing Sector”, Journal of Comparative Economics, 26, 301-16.
CLAESSENS, S. and DJANKOV, S. (1999), “Ownership Concentration and Corporate Performance in the Czech Republic”, Journal of Comparative Economics, 27, 498-513.
CRASWELL, A. T., TAYLOR, S. L. and SAYWELL, R. A. (1997), “Ownership Structure and Corporate Performance”, Pasific-Basin Finance Journal, 5, 301-23.
DE CAIRES, B. (1988), The GT Guide to World Equity Markets, London: Euromoney Publications.
DEMSETZ, H. (1983), “The Structure of Ownership and the Theory of the Firm”, Journal of Law and Economics, 26(June), 375-90.
DEMSETZ, H. and LEHN, K. (1985), “The Structure of Corporate Ownership, Causes and Consequences”, Journal of Political Economy, 93(6), 1155-77.
FÜRST, O. and KANG, S. (1998), “Corporate Governance, Expected Operating Performance and Pricing”, Yale School of Management Working Paper.
HOLDERNESS, C. G. and SHEEHAN, D. P. (1988), “The Role of Majority Shareholders in Publicly Held Corporations: An Exploratory Analysis”, Journal of
Financial Economics, 20, 317-46. İSTANBUL STOCK EXCHANGE (1992-1997) Yearbook of Companies, General
Information and Financial Statements, İstanbul, IMKB, 1992-7. JENSEN, M. C. (1986), “Agency Costs of Free Cash Flow, Corporate Finance, and
Takeovers”, American Economic Review, Papers and Proceedings, 76(May), 323-9.
JENSEN, M. C. and MECKLING, W. H. (1976), “Theory of the Firm, Managerial Behavior, Agency Costs and Ownership Structure”, Journal of Financial
Economics, 3, 305-60. KARATAŞ, C. (1995), “Has Privatization improved profitability and performance of
the public enterprises in Turkey?” in P. Cook and C. Kirkpatrick (eds.) Privatization Policy and Performance, International Perspectives, Hertfordshire: Prentice Hall, Harvester Wheatsheaf.
KOLE, S. (1994), “Managerial Ownership and Firm Performance, Incentives or Awards?” Working Paper, University of Rochester.
LA PORTA, R., LOPEZ-DE-SILANES, F., SHLEIFER, A. and VISHNY, R. W. (1998), “Law and Finance”, Journal of Political Economy, 106(6), 1113-55.
————(1999), “Corporate Ownership Around the World”, The Journal of
Finance, 54(2), 471-517.
METU STUDIES IN DEVELOPMENT 203
LEECH, D. and LEAHY, J. (1991), “Ownership Structure, Control Type Classifications and the Performance of Large British Companies”, The Economic Journal, 101(November), 1418-37.
LICHTENBERG, F. R. and PUSHNER, G. M. (1994), “Ownership Structure and Corporate Performance in Japan”, Japan and the World Economy, 6, 239-61.
MCCONNELL, J. J. and SERVAES, H. (1990), “Additional Evidence on Equity Ownership and Corporate Value”, Journal of Financial Economics, 27, 595-612.
MORCK, R., SHELEIFER, A. and VISHNY, R. W. (1988), “Management Ownership and Market Valuation: An Empirical Analysis”, Journal of Financial Economics, 20, 293-315.
PI, L. and TIMME, S. G. (1993), “Corporate Control and Bank Efficiency”, Journal of
Banking and Finance, 17, 515-30. ROSS, S. A. (1977), “The Determination of Financial Structure, The Incentive
Signalling Approach”, Bell Journal of Economics, 8(Spring), 23-40. SHLEIFER, A. and VISHNY, R. W. (1986), “Large Shareholders and Corporate
Control”, Journal of Political Economy, 94(3), 461-88. SHLEIFER, A. and VISHNY, R. W. (1997), “A Survey of Corporate Governance”, The
Journal of Finance, 52(2), 737-83. STULZ, R.M. (1988), “Managerial Control of Voting Rights: Financing Policies and
the Market for Corporate Control,” Journal of Financial Economics, 20(1/2), 25-54.
YURTOĞLU, B. (2000), “Ownership Structure of the Turkish Listed Firms”, ISE Finance Award Series, 1(April), 55-84.
ZHENG, J., LIU, X. and BIGSTEN, A. (1998), “Ownership Structure and Determinants of Technical Efficiency, An Application of Data Envelopment Analysis to Chinese Enterprises (1986-1990)”, Journal of Comparative Economics, 26, 465-84.
Özet
Mülkiyet Yoğunluğu ve Şirket Performansı: Türk Şirketlerinden Bulgular
Bu çalışmada Türk şirketlerinin mülkiyet yoğunluğunu belirleyen faktörler ve
mülkiyet yapısı ile şirket performansı arasındaki ilişki incelenmektedir. Yapılan analizlerde, şirketin toplam riski ve bulunduğu endüstri kontrol edildiğinde, şirketin büyüklüğü arttıkça, mülkiyet yoğunluğunun yükseldiği görülmüştür. Türk firmalarında en büyük hissedarın payı ile Tobin Q arasında ikinci dereceden bir ilişki bulunmuştur. Sonuçlar, gelişmiş ülkelerdeki mülkiyet ve performans ilişkilerinin, gelişmekte olan piyasalar için genellenemeyeceğini göstermektedir.


![Ownership, Concentration, Convergence: Google [2010-11]](https://static.fdocuments.in/doc/165x107/559a5fac1a28abc41d8b4751/ownership-concentration-convergence-google-2010-11.jpg)