State Ownership, Firm Profitability, and Management Turnover
Upload
barcelona-graduate-school-of-economics-gseCategory
view
34download
0
Cross ownership and firm performance
Octavi Castells Pera, Jaime López Sastre, Berenice Ramirez Hart*
Barcelona Graduate School of Economics
Abstract: This paper assesses the impact of cross ownership on firm performance and
industry competition through an analysis of shareholder´s networks in Spain using a panel
regression model on a sample of non-financial listed companies between the years 2004 and
2012. The results show that there is a positive and significant effect of the number of
connections a firm has with other industry rivals through the common ownership mechanism
on its markup.
Keywords: Institutional ownership, Firm performance, Industry competition.
Classification: Empirical work – research
* E-mail Addresses: [email protected] (O. Castells Pera), [email protected] (J. López Sastre),
[email protected] (B. Ramirez Hart)

1. Introduction
The analysis of cross ownership of companies within the same industry has been a
topic of increasing interest for market regulators and researchers. As firms aim to maximize
shareholders´ value, this may incentivize them to compete less aggressively in the market,
therefore creating negative externalities for consumers.
Most of the literature in this area focuses on analyzing companies and investors in
the U.S. In our case, we target the Spanish market, for which we believe our paper is
innovative and provides important insights into the mechanics of cross ownership in this
country. We focus on three specific sectors: Food, Pharmaceutical and Energy, for which we
show the evolution of cross ownership concentration from 2004 to 2012, and the impact of
the largest shareholders on this.
Our main objective is to study the impact of common ownership on industry
competition and firm performance. We measure them by firm-level markups and market
share, respectively. However, we also acknowledge that markups contain information about
individual performance, since companies with higher markups obtain profits above the
equilibrium ones implied by perfect competitive markets. Thus, we will observe those firms
outperforming their industry rivals. The chief hypothesis we present is that more connected
firms coordinate their market strategies to compete less aggressively and perform better than
their less connected rivals.
Our results suggest that there has been an increase in the concentration of cross
ownership among Spanish listed companies in the last ten years. The impact of the largest
shareholders on this seems to vary a lot across the three industries under analysis. We find a
positive and significant effect of our measure of cross ownership on markups, which is
robust to several variations in our main specification. We do not find a significant effect on
firms´ market share.
The rest of the paper is organized as follows. Section 2 provides an overview of
related literature. Section 3 describes the theoretical base on which we base our empirical
analysis. Section 4 includes information on the data used. In Section 5, we show the
methodology applied for both the descriptive and inferential analyses. Section 6 and 7 present
our main descriptive and regression results, respectively. Finally, Section 8 concludes.

2. Literature review
From the seminal work of Bain (1951) the industry concentration has been a topic
that has generated much interest on the part of researchers, who have carried out several
studies on the relationship between this, different measures of profit rates and other
characteristics of the company. Consequently, one branch of studies derived from Bain’s
work reflects an increasing interest on the effects of the growing interconnection of
businesses through common stock ownership and how this can affect corporate
performance (Schmalensee, 1989; Demsetz and Villalonga, 2001; Bhattacharya and Graham,
2009; Azar, 2012).
In the cases described in the literature, researchers study partial control scenarios, in which
the acquiring company does not own 100% of the acquired company, presenting a situation
in which the interest of the first may or may not have an influence on the corporate decisions
of the second one changing the strategic interaction between the companies in the same
industry. On the one hand, the cross-holder has incentives to make the companies in the
portfolio compete less aggressively with the intention to maximize the aggregate profit of
these ones. Also, he may assist implicit or explicit coordination between the firms in the
portfolio. On the other hand, the acquiring firm might have some constraints to influence
the acquired one, for example the influence of other shareholders, corporate governance
structure and corporate law, leading to a scenario in which every firm maximizes its own
profit by taking care of the interest of all its shareholders.
Within the assessment of the effect of cross-ownership on market power and firm
performance, we can identify studies that evaluate two different types of cross ownership:
Partial Ownership and Institutional Shareholders. The first ones stress the competitive effect
of Partial ownership, defined as the acquisition of some percentage of a rival´s firm stock
(O'Brien, D. P., and Salop, S. C., 2000). The second ones evaluate how the presence of
institutional shareholders in companies of the same industry affects these companies
behavior. In both cases the presence of cross-ownership is expected to provide an effective
framework of incentives to influence corporate performance leading to a positive correlation
between cross-ownership and firm performance (Azar, J., 2012; He, J., and Huang, J.,2014)
, this last one measured as profit rate, Tobin’s Q and market share, among others.
Nonetheless, the authors find mixed results, showing that cross-ownership does not have a
positive correlation with firm performance (Demsetz, H. and Villalonga, B., 2001;
Bhattacharya, P. S., and Graham, M. A., 2009).
3. Theoretical review and development of hypothesis
In this section, we provide a brief overview of a theoretical model developed by Azar,
Schmalz, and Tecu (2015), in which they show the relationship between cross ownership
among industry participants and their profit maximization mechanism in a Cournot setting.
In this way, we illustrate the intuition behind our main hypothesis, which we explain next.
In a given industry with N firms and M investors companies maximize their
shareholder´s value. βij is defined as the share of equity of investor i on firm j, and πj are the
profits of company j. Thus, an investor´s total profits from his portfolio of companies are
given by 𝜋𝑖 = ∑ 𝛽𝑖𝑘𝜋𝑘𝑘 . Consequently, each firm maximizes a weighted average of its
shareholders portfolio profits, where the weights are given by βij1, and where xj is the strategy
of firm j.
max𝑥𝑗
𝜋�̂� = ∑ 𝛽𝑖𝑗
𝑀
𝑖=1
∑ 𝛽𝑖𝑘𝜋𝑘
𝑁
𝑘=1
By rearranging the formula and dividing by ∑ 𝛽𝑖𝑗𝑖 , we can rewrite the objective function as
max𝑥𝑗
𝜋�̂� = 𝜋𝑗 + ∑∑ 𝛽𝑖𝑘𝑖
∑ 𝛽𝑖𝑗𝑖𝑘≠𝑗
𝜋𝑘
This formula shows that companies are interested in maximizing their own profits
plus a linear combination of the profits of other companies where its shareholders have
equity stakes. The weight each company puts in the profits of the rest of the firms is given
by ∑ 𝛽𝑖𝑘𝑖
∑ 𝛽𝑖𝑗𝑖, which can be seen as a measure of the degree of connectivity between two
companies as a result of their cross ownership. The closer this ratio is to one, the more
interest company j has on company´s k profits, and therefore its shareholders will compare
the potential gains obtained from taking certain strategic actions (for example, increasing the
quantity of goods offered in the market) to increase j´s performance, with the losses from
the effect of these actions on firm k. Note that investors realize these potential losses on the
1 Azar, Schamlz, and Tecu (2015) use control rights to define the weight of each shareholder in the profit maximization function of each firm. They argue that control rights may differ from ownership share in practice, as different types of shares may provide different levels of power to make decisions within the company. However, because for our empirical analysis we are not able to obtain data on control rights, we assume that control of the firm is given by the share of ownership each shareholder has inside a firm, measured as the percentage of total shares held by that investor.
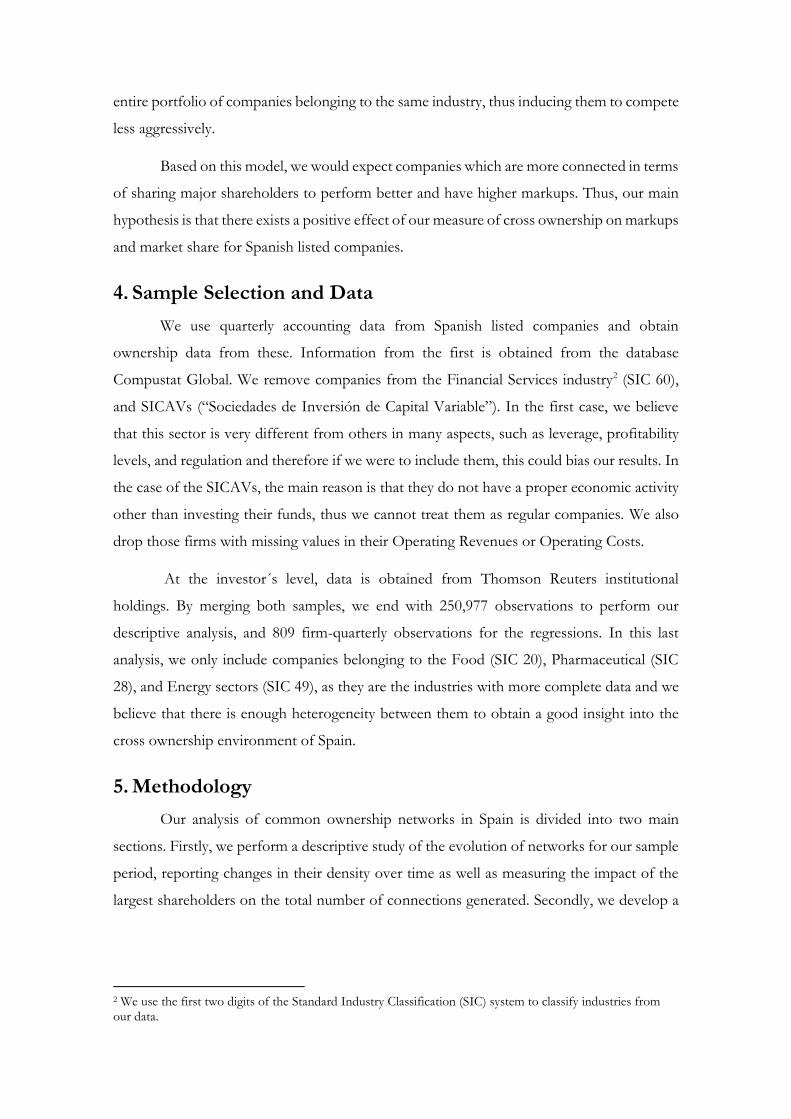
entire portfolio of companies belonging to the same industry, thus inducing them to compete
less aggressively.
Based on this model, we would expect companies which are more connected in terms
of sharing major shareholders to perform better and have higher markups. Thus, our main
hypothesis is that there exists a positive effect of our measure of cross ownership on markups
and market share for Spanish listed companies.
4. Sample Selection and Data
We use quarterly accounting data from Spanish listed companies and obtain
ownership data from these. Information from the first is obtained from the database
Compustat Global. We remove companies from the Financial Services industry2 (SIC 60),
and SICAVs (“Sociedades de Inversión de Capital Variable”). In the first case, we believe
that this sector is very different from others in many aspects, such as leverage, profitability
levels, and regulation and therefore if we were to include them, this could bias our results. In
the case of the SICAVs, the main reason is that they do not have a proper economic activity
other than investing their funds, thus we cannot treat them as regular companies. We also
drop those firms with missing values in their Operating Revenues or Operating Costs.
At the investor´s level, data is obtained from Thomson Reuters institutional
holdings. By merging both samples, we end with 250,977 observations to perform our
descriptive analysis, and 809 firm-quarterly observations for the regressions. In this last
analysis, we only include companies belonging to the Food (SIC 20), Pharmaceutical (SIC
28), and Energy sectors (SIC 49), as they are the industries with more complete data and we
believe that there is enough heterogeneity between them to obtain a good insight into the
cross ownership environment of Spain.
5. Methodology
Our analysis of common ownership networks in Spain is divided into two main
sections. Firstly, we perform a descriptive study of the evolution of networks for our sample
period, reporting changes in their density over time as well as measuring the impact of the
largest shareholders on the total number of connections generated. Secondly, we develop a
2 We use the first two digits of the Standard Industry Classification (SIC) system to classify industries from our data.

series of regressions to assess the effect of cross-ownership on firm performance and market
competition among industry participants.
5.1 Descriptive Analysis
Following Azar, Schmalz, and Tecu (2015) and Azar (2012), we define two
companies as being connected in the network if they have at least one investor with a stake
of equity3 above x% in both companies. There does not seem to be a theoretical base to
establish a threshold for two firms to be connected in the network. For example, Azar (2012)
uses thresholds of 3%, 5%, and 7% to analyze the evolution of cross-ownership in the United
States, but does not explain the rationale for this decision. In our case, we use thresholds of
1% and 3% to build the network of all listed companies in the Spanish market, and 1% to
construct the different industry sub-networks under analysis. The motivation for this
decision is that the size of the Spanish stock market, in terms of the number of firms and
investors, is considerably smaller than the US market. Thus, if we were to choose higher
thresholds, we would observe almost no connections among firms in the sample.
Additionally, it is important to consider that the size of the investments of American
shareholders is in general much larger that their Spanish counterparts. Therefore, holding a
stake of 3% in a listed Spanish company may convert an investor into the major shareholder
of that company.
We construct the adjacency matrix of each network at each point in time. For every
pair of firms (nodes) in the matrix, a value of “1” represents a connection (edge) generated
by a common shareholder, whereas a “0” represents no connection. Then, we calculate the
density of each network as a measure of how connected firms are through the cross-
ownership mechanism. A perfectly connected network would be one in which all nodes have
edges to each other, thus the density measures the percentage of existing connections over
the maximum number of potential connections. As reported by Azar (2012), the density of
a network is calculated with the following formula:
𝐷𝑒𝑛𝑠𝑖𝑡𝑦 = ∑ ∑ 𝑦𝑖𝑗𝑗≠𝑖
𝑘𝑖=1
𝑘(𝑘 − 1)/2
3 Due to data availability, we do not make distinction among the different types of shares that investors own in the sample companies (common shares, preferred shares, convertible shares, etc.). However, we are aware that shares with different voting rights enable shareholders to a different degree of influence in the decision-making of firms.
where k is the number of companies in the network, and 𝑦𝑖𝑗 equals 1 if firm i and firm j are
connected in the network. Note that by definition, the adjacency matrix is symmetric and
contains zeros in the diagonal, since a firm is not said to be connected to itself.
We also consider it useful to report the percentage of connections generated in each
network by the largest shareholders, and their evolution over time. This relates to the concept
of how concentrated the connections are within a network, as it is not the same that a high-
density network is due to a lot of different investors holding few blockholdings, or a few
number of large institutional investors holding a big number of blockholdings. First, we
consider the largest shareholders to be the ones who have held the largest number of
blockholdings during the period, where a blockholding is defined as a stake in a company
above the thresholds previously mentioned. Note that we do not require the blockholdings
to be from different companies, meaning that, for example, a shareholder with blockholdings
in three companies during the entire sample period would have held 120 blockholdings (3*40
periods). We did not consider the investors with the highest portfolio value as the largest
shareholders for the reason that there are some firms where the largest shareholder is an
individual investor holding up to 90% of the shares of the company (normally the founder
or CEO of the firm), but he/she does not hold stakes in any other company, and thus, does
not generate any connections in the networks.
5.2 Inferential Analysis
We perform a series of regressions to evaluate the effect of common ownership on
market competition of the selected industries and firm performance. In the context of our
paper, market competition and firm performance are very closely related in the following
sense: less competitive industries indicate the presence of companies that obtain profits
above the equilibrium profits implied by perfect competitive markets. Thus, we will observe
those firms outperforming their industry rivals.
We use markups as our measure of market competition and market power. We
calculate firms´ markups for every period for the companies in the three industries under
study. They are calculated in the following way:
𝑀𝑎𝑟𝑘𝑢𝑝𝑖,𝑡 = 𝑂𝑝𝑒𝑟𝑎𝑡𝑖𝑛𝑔 𝑅𝑒𝑣𝑒𝑛𝑢𝑒𝑠𝑖,𝑡
𝑂𝑝𝑒𝑟𝑎𝑡𝑖𝑛𝑔 𝐸𝑥𝑝𝑒𝑛𝑠𝑒𝑠𝑖,𝑡
We differ from Azar (2012) in the way of calculating markups, as he uses Total Cost
instead of Operating Costs. We believe that by using Operating Expenses we are able to

examine the price charged in excess of the marginal cost of producing goods for the
company, whereas if we used Total Costs we would also be considering other costs, such as
interest expenses that may differ a lot among different companies and thus, may bias our
results. Another option would be to use Cost of Goods Sold, as it would allow us to examine
the change in revenues for a company associated with an increase/decrease of the quantity
of goods sold, and thus observe how prices evolve in response to these changes. In this
sense, if revenues were to increase in a higher proportion than the cost of goods sold, we
could be observing anti-competitive incentives in companies. However, we find that Cost of
Goods Sold data from Spanish listed companies in Compustat varies a lot in the way firms
report it because of the different accounting methods used by them. This lack of
homogeneity in the reporting standards forces us to use an alternative measure, and thus
decide to use Operating Expenses4, which are reported in the same way for all companies
under study.
Our selected measure of firm performance is market share, which we define in the
following way:
𝑀𝑎𝑟𝑘𝑒𝑡 𝑆ℎ𝑎𝑟𝑒𝑖,𝑡 =𝑆𝑎𝑙𝑒𝑠𝑖,𝑡
∑ 𝑆𝑎𝑙𝑒𝑠𝑖,𝑡𝑘𝑖=1
where k is the number of firms in the industry. By using market share as our dependent
variable in the regression, the parameter of interest will reflect the expected change in the
market share of a given company due to a change in its cross-ownership measure.
To assess the effect of cross-ownership on industry competition we build a panel
regression using ordinary least squares (OLS) with the following specification:
𝑀𝑎𝑟𝑘𝑢𝑝𝑖,𝑡 = 𝛼 + 𝛽𝑁𝑐𝑜𝑛𝑛𝑒𝑐𝑡𝑖𝑜𝑛𝑠𝑖,𝑡 + 𝛾𝑋𝑖,𝑡 + 𝛿𝑍𝑖,𝑡 + 𝐹𝑖𝑟𝑚𝑖 + 휀𝑖,𝑡 (1)
where Markup is the dependent variable measuring competition. The main variable of interest
is Nconnections, which is our measure of cross-ownership. It measures the number of edges
each company has with other industry firms in the common ownership network, for every
period. We normalized this measure by dividing it by the number of firms in the network in
each quarter, since this changes over time. X is a vector of industry time-varying
characteristics, which include Average Industry Markup and Density. Z is a vector of firm-
4 Operating Expenses in Compustat data include Cost of Goods Sold, Selling, General, and Administrative Expenses, and Other Operating Expenses.
specific control variables that may have an effect in a company´s markup, such as Debt to
Assets, Ln (Assets) and Sales Growth. Finally, the variable Firm captures firm fixed effects.
As reported by He and Huang (2014), including firm fixed effects may help solve the
problem of omitted unobservable time-invariant characteristics that can be correlated with
both markup and connections, leading us to wrong interpretations of the results.
We run a second OLS regression using panel data to analyze the effect of cross-
ownership on firm performance:
𝑀𝑎𝑟𝑘𝑒𝑡 𝑆ℎ𝑎𝑟𝑒𝑖,𝑡 = 𝛼 + 𝛽𝑁𝑐𝑜𝑛𝑛𝑒𝑐𝑡𝑖𝑜𝑛𝑠𝑖,𝑡 + 𝛾𝑋𝑖,𝑡 + 𝛿𝑍𝑖,𝑡 + 𝐹𝑖𝑟𝑚𝑖 + 휀𝑖,𝑡 (2)
where Market Share is the dependent variable measuring firm performance. The independent
variables are the same ones used in the previous regression, also including firm fixed effects.
6. Descriptive analysis
6.1 Biggest shareholders in Spain based on total portfolio value
In this section, we make an introduction about major shareholders in Spain. As we
can see in Figures 1 and 2, there is a big decrease in all investors´ portfolio value around
2008. This is due to the financial crisis, as the assets held by these investors decreased in
value by large amounts. As we can observe, the major shareholders in Spain do not increase
their position to 2007 levels. The principal shareholders, ranked by total portfolio value, are
Spanish banks, such as La Caixa, Banco Santander, BBVA; international investment
institutions like Nordea, Blackrock, and Fidelity; and finally, we can also find individuals or
family groups with the majority of their shares in one company, such as Amancio Ortega
(major shareholder of Inditex), or the Entrecanales family (major shareholders of Acciona).
As we can observe in Figure 2, the major shareholder in Spain in 2012 is Amancio
Ortega, who owns shares of Inditex. La Caixa ranks second for that year, with major
positions in companies belonging to the energy sector such as Repsol or Gas natural, and
holding shares of the insurance company Abertis. La Caixa also has minor positions in a wide
range of other Spanish companies. Finally, Enel SPA, which bought the Spanish energy
company Endesa, also has a big portfolio value, although this is not very relevant for our
analysis as it only holds shares of this company.
For what we have seen, the major shareholders in Spain have invested huge amounts,
but only in a few companies. An exception to this would be La Caixa. As we are interested
in those investors with considerably big positions in different companies, we decide to take
a different approach to define and rank the largest shareholders in Spain. Specifically, we will
consider the major shareholders to be the ones who have held the largest number of block
holdings during the period under study, where a blockholding is defined as a stake in a
company’s equity above thresholds of 1% and 3%, as described in Section 4.
6.2 Biggest shareholders in Spain based on total number of blockholdings
As we can see in Tables 1 and 2, the biggest shareholder in Spain on a blockholding
basis is Bestinver. Bestinver is a fund company that invests a large part of its capital in Spain.
The company is owned by Acciona, which is held by the aforementioned Entrecanales
family. One of the other major shareholders is La Caixa, also mentioned previously, as one
of the biggest shareholders in a total portfolio value basis. Finally, we can see NBIM, which
is a Norwegian investment bank, the fund manager Fidelity, and the American investment
advisor Dimensional Fund Advisors.
At the individual industry level, we can observe that Bestinver is the major investor
in the food sector (see Table 3), and also the second biggest in the pharmaceutical sector (see
Table 4), but it does not have a big position in the energy sector (see Table 5). We can also
see some of the major players at the entire Spanish market level such as Fidelity and NBIM
having important positions in the energy and pharmaceutical industries, respectively.
6.3 Density analysis
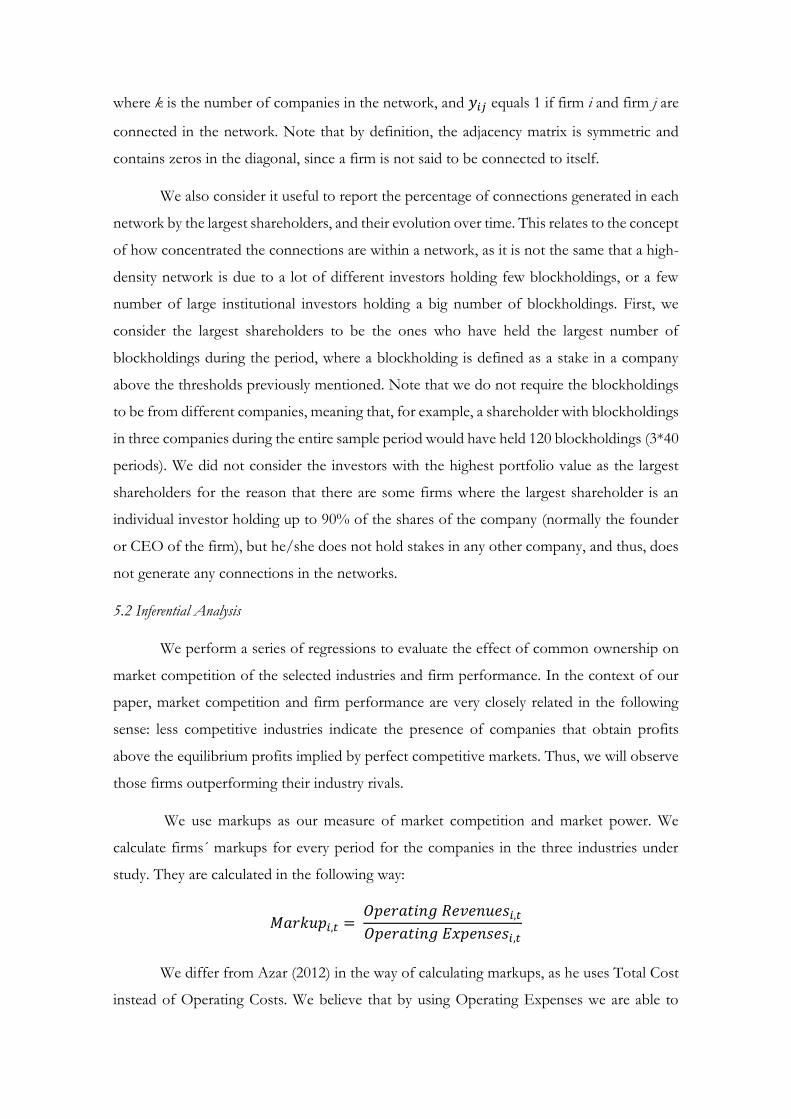
In Figures 3, 4, and 5, we provide a picture of the cross ownership networks of the
three industries (SIC 20, 28, and 49) at a specific point in time; in this case the last quarter of
2012. In this way, we visually show the level of interconnections among companies belonging
to the same industry.
With respect to the evolution of densities, we observe how, overall, the density has
increased during the reported period for the three industries under analysis (see Figure 6).
We can see a decrease from 2005-2006 for the three sectors. However, we generally observe
an increasing density over time. It can be seen how the density moves from 5%-10% on the
first years to 20% in the last ones. The pharmaceutical sector is the one that has experienced
a higher increasing trend as we can notice a network density growth from approximately 0%
to 70%.
The percentage of connections generated by the largest shareholders is very volatile
throughout our sample period for the three industries reported (see Figure 7). We can
observe how the Food and Energy sectors follow similar patterns, reaching minimum levels

in 2006. After this, they increase in 2007 to then fall again from 2008 until the end of the
period, being around 0% and 10%, respectively. In the case of the Pharmaceutical industry,
the percentage of connections generated by the major shareholders is 0% from 2004 until
the fourth quarter of 2009, when they experience a sharp increase, reaching a maximum of
around 85% during 2011. Finally, they decrease during 2012, as also happened with the Food
and Energy industries.
It is interesting to compare the evolution of densities and connections generated by
the largest shareholders between Spanish and American listed companies, which are analyzed
by Azar (2012). In both countries industry densities have had an increasing trend over time,
indicating a higher degree of connectivity among firms through their cross ownership.
Whereas in the U.S. the largest shareholders generate a big percentage of the connections5
(between 80% and 90%), and they stay flat from 2004 to 2012, in the case of Spain they vary
a lot over time. This indicates that institutional investors have a very high influence and
presence in American listed companies, while in Spain this is more ambiguous.
7. Empirical results
In this section, we present the results of our regression on the effect of cross
ownership in industry competition and firm performance.
Table 6 shows the estimation results from our two main panel regressions using
equations (1) and (2) described in Section 4. With respect to our main variable of interest,
Nconnections, we observe a positive and significant effect on Markup, although only at a 10%
significance level. This implies that companies which share investors with large stakes in their
equity with other industry rivals tend to have higher markups, suggesting the presence of
anti-competitive incentives of cross ownership. To show the economic magnitude of this
effect, the coefficient of Nconnections on Markup (0.613) conveys that a firm which is
connected to 10% of its within-industry rivals, will have a markup higher by 0.0613 points
than a company with no connections in the network. We do not find significant effect of the
overall industry density of the network on markups. These results differ from the ones
obtained by Azar (2012), where he shows a significantly negative effect of the average
number of connections of firms in the same industry on average (industry) markups, and a
significantly positive effect of common shareholder density on the same dependent variable.
This suggests that in the U.S., cross ownership concentration has an effect on markups at
5 See Chapter 4 of Azar (2012).

the industry level, whereas in Spain this relationship occurs at the individual (firm) level. The
fact that the number of listed companies in each industry in the U.S. is higher than in Spain
may also be driving these differences.
With respect to firm performance, measured by market share, we do not observe any
significant effect of the normalized number of connections on the above variable, as reported
in Column A of Table 6. In this sense, we differ from He and Huang (2014), which found a
positive and significant effect of different measures of cross ownership on market share
growth, for a sample of U.S. public companies.
Finally, we conduct a series of robustness checks to assess the quality of our main
regression results, which are presented in Tables 7 and 8, corresponding to variations in
specifications (1) and (2), respectively. In Column A of both tables, we remove company
fixed effects and perform a Generalised Least Squares (GLS) regression allowing for random
effects. Several reasons lead us to this decision. Firstly, we cannot assume that company time
variance is not present in our data. These time variances are existent in unobservable factors
on which we cannot have data. For example, manager efficiency can vary over time and
firms. Moreover, it is an unobservable factor that, because we include a 10-year sample, it
cannot be assumed to be constant over this period. Another example is the location of the
activity. Some firms during this 10-year period may move their production centers across
autonomic communities or even outside of the country. This can highly affect markups due
to the regulatory differences across Spanish regions. Moreover, each community has their
own grant programs that can have an effect as well. The level of exports of each firm may
also play an important role. Some firms in the same industry may have a different level of
exposure to international markets and currency fluctuations. For example, as a result of
exchange rates, firms competing in the same sector with higher exports can become more
competitive and get better results if exchange rates vary favorably. These changes (which
happened during our 10-year period) are not observable and affect the results over time.
We observe how the coefficient of Nconnections is still positive and significant (now at
5% significance level) for the effect on Markup. In addition, the coefficient of Density now is
significant at a 10% level, indicating that the higher the overall concentration of cross
ownership at an industry level, the lower the individual markup of companies. With respect
to the Market Share regression, both parameters remain negative and statistically not
significant.

In Column B, we also use random effects but include industry dummies to account
for the potential existence of differences across industries not included in the control
variables. The effect of Nconnections on Markup is still positive and significant, now at a 1%
level; and remains negative and not significant for the case of Market Share.
Column C reports the same GLS regression, but without industry dummies and
accounting for potential seasonality effects, for which we included quarter dummies. Again,
the parameter of our cross ownership measure remains positive and significant for the case
of Markup (at a 5% level), and negative and not significant for Market Share.
Overall, our main result from these regressions is that cross ownership of within-
industry companies by the same institutional investors increases markups of those firms,
which is consistent with our main hypothesis that common shareholders tend to relax
competition of their portfolio companies in order to obtain more gains and limit their losses.
8. Conclusions
In this paper, we provide both a descriptive and empirical analysis on the effects of cross
ownership on the strategic interaction of firms within an industry. We find a positive and
significant relationship between our measure of cross ownership and firm markups, which
provides evidence of collusive behavior among natural competitors, creating a deadweight
loss for consumers. However, we do not find a significant effect on firms´ market share.
Our results have an important implication on the regulation of the ownership structure
of firms. For this reason, we suggest that further empirical research is conducted with respect
to this topic, in order to assess regulators in setting up a new policy framework that considers
more carefully the implications that cross ownership may have in market competition.
9. References
Azar, J. (2011). A new look at oligopoly: Implicit collusion through portfolio diversification. Available at SSRN
1993364.
Azar, J., Schmalz, M. C., and Tecu, I. (2014). Anti-competitive effects of common ownership. Ross School of Business
Paper, (1235).
Bain, J. S. (1951). Relation of profit rate to industry concentration: American manufacturing, 1936-1940. The Quarterly
Journal of Economics, 293-324.

Bhattacharya, P. S., and Graham, M. A. (2009). On institutional ownership and firm performance: A disaggregated
view. Journal of Multinational Financial Management, 19(5), 370-394.
Demsetz, H., and Villalonga, B. (2001). Ownership structure and corporate performance. Journal of Corporate
Finance, 7(3), 209-233.
Edmans, A., Levit, D., and Reilly, D. (2014). Governance and Comovement Under Common Ownership.
He, J., and Huang, J. (2014). Product market competition in a world of cross ownership: Evidence from institutional
blockholdings. Available at SSRN 2380426.
O'Brien, D. P., and Salop, S. C. (2000). Competitive effects of partial ownership: Financial interest and corporate
control. Antitrust Law Journal, 559-614.
Schmalensee, R. (1989). Inter-industry studies of structure and performance. Handbook of Industrial Organization, 2.

Appendix
Figure 1: Top 25 Shareholders in Spain ranked by Total Portfolio Value.

Figure 2: Top 7 Shareholders in Spain ranked by Total Portfolio Value.
$0.00
$10,000,000,000.00
$20,000,000,000.00
$30,000,000,000.00
$40,000,000,000.00
$50,000,000,000.00
$60,000,000,000.00
2003 2004 2005 2006 2007 2008 2009 2010 2011 2012
Banco Bilbao Vizcaya Argentaria S.A.Banco Santander SABlackRock Institutional Trust Company, N.A.Caja de Ahorros y Pensiones de Barcelona (La Caixa)Capital Research Global Investors
Figure 3: Network of Food companies in 2012Q4.
1 ES0110047919 DEOLEO SA
2 ES0112501012 EBRO FOODS SA
3 ES0114297015 BARON DE LEY SA
4 ES0114930011 "bodegas bilbainas"
5 ES0115002018 BODEGAS RIOJANAS
6 ES0121501318 CAMPOFRIO FOOD GROUP SA
7 ES0125690513 DAMM SA
8 ES0158746026 "lumar seafood"
9 ES0165359011 "lab reig jofre"
10 ES0165515117 NATRA SA
11 ES0184140210 VINICOLA DEL NORTE DE ESPANA
SIC 20

Figure 4: Network of Pharmaceutical companies in 2012Q4.
1 ES0109659013 AB-BIOTICS SA
2 ES0125140A14 ERCROS SA
3 ES0134950F36 FAES FARMA SA
4 ES0157097017 ALMIRALL SA
5 ES0157261019 LABORATORIOS FARMACEUTOCOS
6 ES0163960018
7 ES0165380017 SNIACE SA
8 ES0171996004 GRIFOLS SA B class
9 ES0171996012 GRIFOLS SA
10 ES0172233118 BIOSEARCH SA
SIC 28
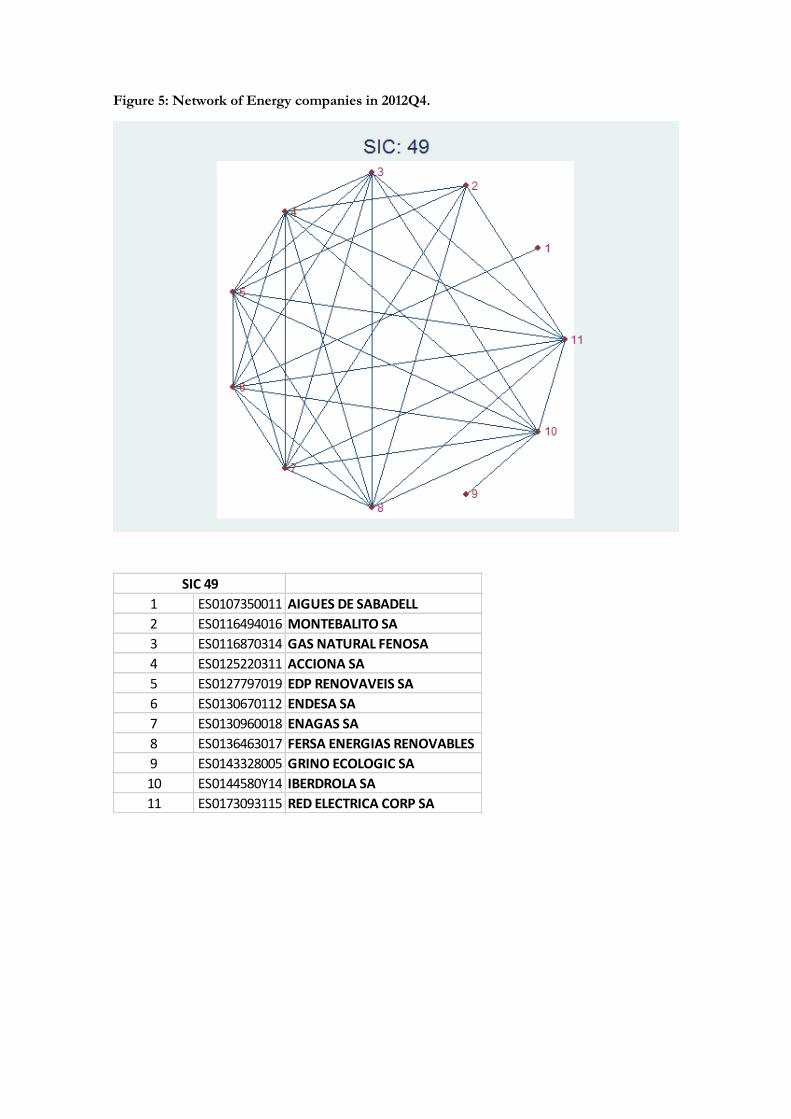
Figure 5: Network of Energy companies in 2012Q4.
1 ES0107350011 AIGUES DE SABADELL
2 ES0116494016 MONTEBALITO SA
3 ES0116870314 GAS NATURAL FENOSA
4 ES0125220311 ACCIONA SA
5 ES0127797019 EDP RENOVAVEIS SA
6 ES0130670112 ENDESA SA
7 ES0130960018 ENAGAS SA
8 ES0136463017 FERSA ENERGIAS RENOVABLES
9 ES0143328005 GRINO ECOLOGIC SA
10 ES0144580Y14 IBERDROLA SA
11 ES0173093115 RED ELECTRICA CORP SA
SIC 49

Figure 6: Network density evolution for the reported industries at 1% threshold.
Figure 7: Percentage of connections generated by the largest shareholders at 1% threshold.

Table 1: Major shareholders by block holdings all sectors at 1%.
All Companies at 1% Total number of blockholdings for the period
Bestinver Gestión S.G.I.I.C. S.A. 726
Norges Bank Investment Management (NBIM) 550
Fidelity Worldwide Investment (UK) Ltd. 305
Caja de Ahorros y Pensiones de Barcelona (La Caixa) 257
Dimensional Fund Advisors, LP 231
Table 2: Major shareholders by block holdings all sectors at 3%.
All Companies at 3% Total number of blockholdings for the period
Bestinver Gestión S.G.I.I.C. S.A. 503
Caja de Ahorros y Pensiones de Barcelona (La Caixa) 257
Banco Bilbao Vizcaya Argentaria S.A. 216
Kutxabank Gestion, SGIIC, S.A.U. 168
Caixanova, Caixa de Aforros de Vigo, Ourense e Pontevedra 162
Table 3: Major shareholders by block holdings SIC 20.
SIC 20 Total number of blockholdings for the period
Bestinver Gestión S.G.I.I.C. S.A. 78
Kutxabank Gestion, SGIIC, S.A.U. 49
Libertas 7 SA 45
Lafuente Family 42
Boag de Valores, S.L. 40
Table 4: Major shareholders by block holdings SIC 28.
SIC 28 Total number of blockholdings for the period
Norges Bank Investment Management (NBIM) 56
Bestinver Gestión S.G.I.I.C. S.A. 51
Promociones Arier, S.A. 40
BBVA Patrimonios Gestora S.G.I.I.C., S.A. 39
Ebro Foods SA 38
Table 5: Major shareholders by block holdings SIC 49.
SIC 49 Total number of blockholdings for the period
Fidelity Worldwide Investment (UK) Ltd. 65
Sociedad Estatal de Participaciones Industriales 59
Caja de Ahorros y Pensiones de Barcelona (La Caixa) 58
Kutxabank Gestion, SGIIC, S.A.U. 53
Gdf Suez SA 49
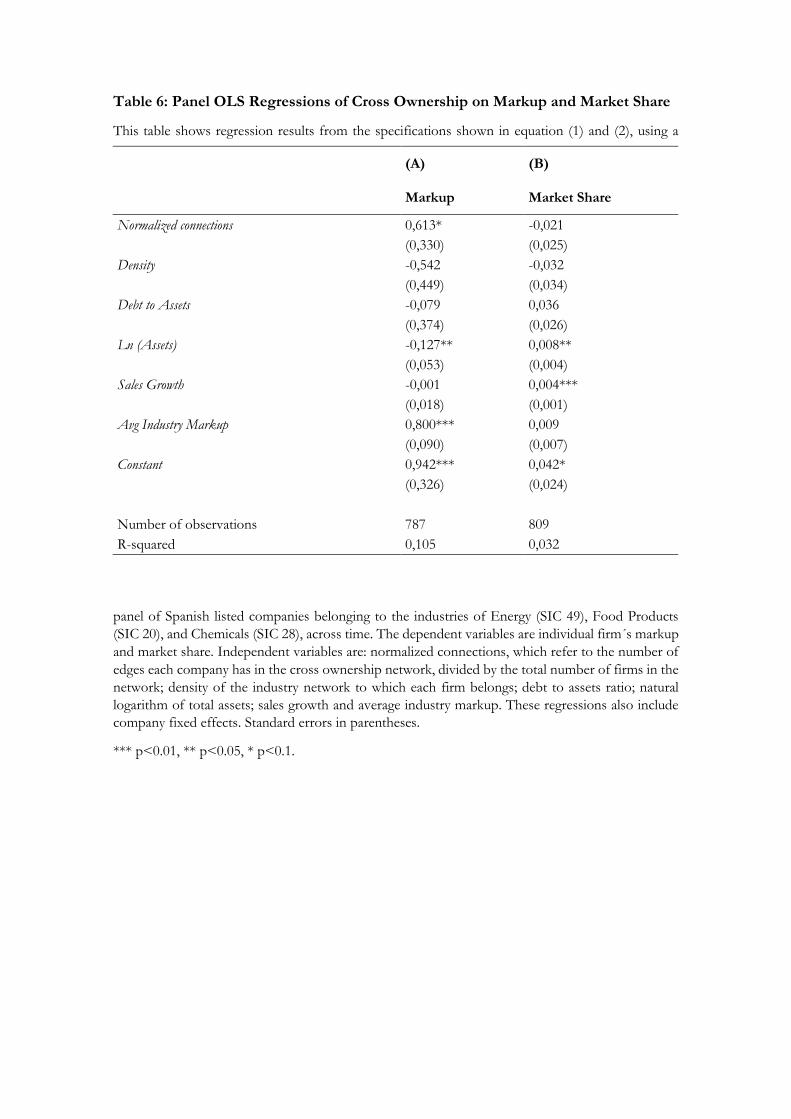
Table 6: Panel OLS Regressions of Cross Ownership on Markup and Market Share
This table shows regression results from the specifications shown in equation (1) and (2), using a
panel of Spanish listed companies belonging to the industries of Energy (SIC 49), Food Products
(SIC 20), and Chemicals (SIC 28), across time. The dependent variables are individual firm´s markup
and market share. Independent variables are: normalized connections, which refer to the number of
edges each company has in the cross ownership network, divided by the total number of firms in the
network; density of the industry network to which each firm belongs; debt to assets ratio; natural
logarithm of total assets; sales growth and average industry markup. These regressions also include
company fixed effects. Standard errors in parentheses.
*** p<0.01, ** p<0.05, * p<0.1.
(A) (B)
Markup Market Share
Normalized connections 0,613* -0,021
(0,330) (0,025)
Density -0,542 -0,032
(0,449) (0,034)
Debt to Assets -0,079 0,036
(0,374) (0,026)
Ln (Assets) -0,127** 0,008**
(0,053) (0,004)
Sales Growth -0,001 0,004***
(0,018) (0,001)
Avg Industry Markup 0,800*** 0,009
(0,090) (0,007)
Constant 0,942*** 0,042*
(0,326) (0,024)
Number of observations 787 809
R-squared 0,105 0,032
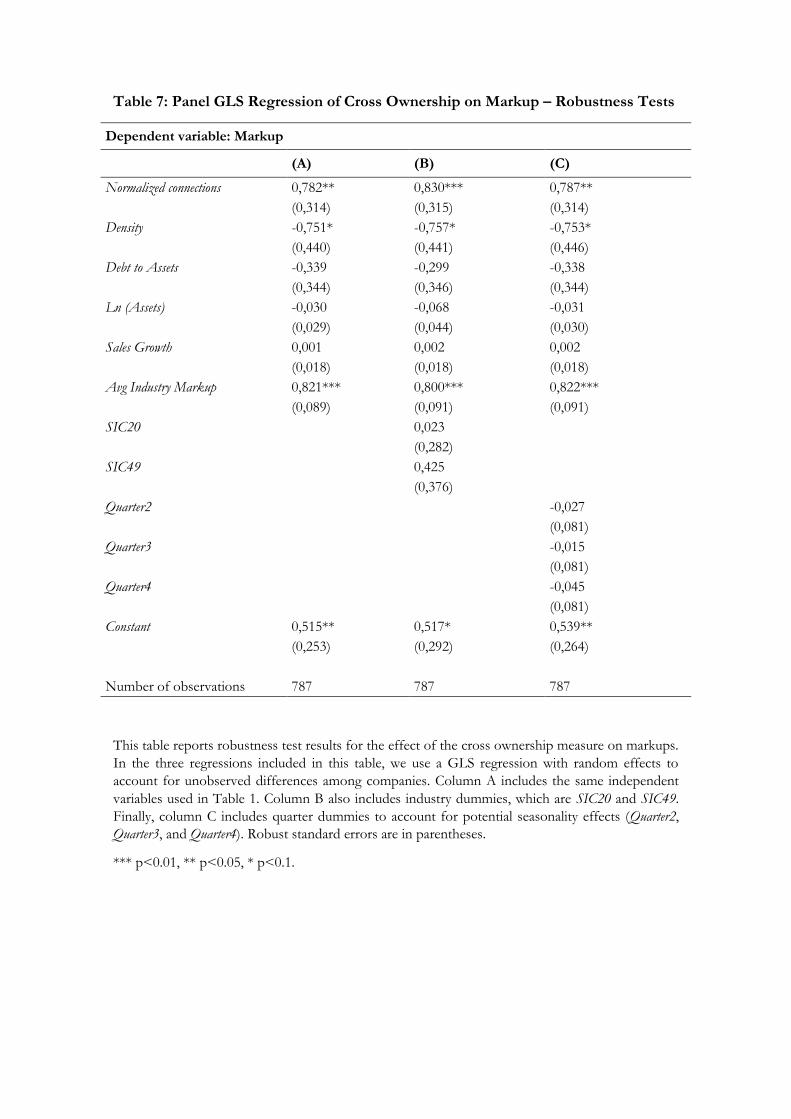
Table 7: Panel GLS Regression of Cross Ownership on Markup – Robustness Tests
Dependent variable: Markup
(A) (B) (C)
Normalized connections 0,782** 0,830*** 0,787**
(0,314) (0,315) (0,314)
Density -0,751* -0,757* -0,753*
(0,440) (0,441) (0,446)
Debt to Assets -0,339 -0,299 -0,338
(0,344) (0,346) (0,344)
Ln (Assets) -0,030 -0,068 -0,031
(0,029) (0,044) (0,030)
Sales Growth 0,001 0,002 0,002
(0,018) (0,018) (0,018)
Avg Industry Markup 0,821*** 0,800*** 0,822***
(0,089) (0,091) (0,091)
SIC20 0,023
(0,282)
SIC49 0,425
(0,376)
Quarter2 -0,027
(0,081)
Quarter3 -0,015
(0,081)
Quarter4 -0,045
(0,081)
Constant 0,515** 0,517* 0,539**
(0,253) (0,292) (0,264)
Number of observations 787 787 787
This table reports robustness test results for the effect of the cross ownership measure on markups.
In the three regressions included in this table, we use a GLS regression with random effects to
account for unobserved differences among companies. Column A includes the same independent
variables used in Table 1. Column B also includes industry dummies, which are SIC20 and SIC49.
Finally, column C includes quarter dummies to account for potential seasonality effects (Quarter2,
Quarter3, and Quarter4). Robust standard errors are in parentheses.
*** p<0.01, ** p<0.05, * p<0.1.

Table 8: Panel GLS Regression of Cross Ownership on Market Share – Robustness
Tests
Dependent variable: Market Share
(A) (B) (C)
Normalized connections -0,014 -0,016 -0,016
(0,025) (0,025) (0,025)
Density -0,035 -0,039 -0,042
(0,034) (0,034) (0,034)
Debt to Assets 0,044* 0,039 0,042*
(0,025) (0,025) (0,025)
Ln (Assets) 0,006* 0,011*** 0,007**
(0,003) (0,004) (0,003)
Sales Growth 0,004*** 0,004*** 0,003**
(0,001) (0,001) (0,001)
Avg Industry Markup 0,007 0,009 0,005
(0,007) (0,007) (0,007)
SIC20 -0,013
(0,055)
SIC49 -0,144**
(0,056)
Quarter2 0,005
(0,006)
Quarter3 -0,002
(0,006)
Quarter4 0,019***
(0,006)
Constant 0,049* 0,092** 0,042
(0,030) (0,043) (0,031)
Number of observations 809 809 809
This table reports robustness test results for the effect of the cross ownership measure on market
share. In all columns, we use a GLS regression with random effects to account for unobserved
differences among companies. Column A includes the same independent variables used in Table 1.
Column B also includes industry dummies, which are SIC20 and SIC49. Finally, column C includes
quarter dummies to account for potential seasonality effects (Quarter2, Quarter3, and Quarter4). Robust
standard errors are in parentheses.
*** p<0.01, ** p<0.05, * p<0.1.