OWNERSHIP CONCENTRATION AND CORPORATE …
243
OWNERSHIP CONCENTRATION AND CORPORATE PERFORMANCE IN EAST AFRICAN COMMUNITY (EAC): THE ROLE OF TECHNICAL EFFICIENCY ON FOREIGN OWNERSHIP AMONG PUBLICLY LISTED COMPANIES BILALI BASESA JUMANNE DOCTOR OF PHILOSOPHY FACULTY OF BUSINESS AND FINANCE UNIVERSITI TUNKU ABDUL RAHMAN JANUARY 2018
Transcript of OWNERSHIP CONCENTRATION AND CORPORATE …

OWNERSHIP CONCENTRATION AND CORPORATE
PERFORMANCE IN EAST AFRICAN COMMUNITY
(EAC): THE ROLE OF TECHNICAL EFFICIENCY ON
FOREIGN OWNERSHIP AMONG PUBLICLY LISTED
COMPANIES
BILALI BASESA JUMANNE
DOCTOR OF PHILOSOPHY
FACULTY OF BUSINESS AND FINANCE
UNIVERSITI TUNKU ABDUL RAHMAN
JANUARY 2018

OWNERSHIP CONCENTRATION AND CORPORATE
PERFORMANCE IN EAST AFRICAN COMMUNITY (EAC): THE
ROLE OF TECHNICAL EFFICIENCY ON FOREIGN OWNERSHIP
AMONG PUBLICLY LISTED COMPANIES
By
BILALI BASESA JUMANNE
Thesis submitted to the Department of Business,
Faculty of Business and Finance,
Universiti Tunku Abdul Rahman,
in partial fulfilment of the requirements for the degree of Doctor of Philosophy
in Finance
January 2018

ii
DEDICATION
To my lovely wife Anna Geoffrey Bilali and my daughter Catherine Bilali
Basesa, who offered unconditional love and support and have always been
there for me. Thank you so much!

iii
ABSTRACT
OWNERSHIP CONCENTRATION AND CORPORATE
PERFORMANCE IN EAST AFRICAN COMMUNITY (EAC): THE
ROLE OF TECHNICAL EFFICIENCY ON FOREIGN OWNERSHIP
AMONG PUBLICLY LISTED COMPANIES
Bilali Basesa Jumanne
The poor protection of minority shareholders among the publicly listed firms
in partner states of East African Community (EAC) is associated with
ownership concentration owing to a laxity to enforce legal and regulatory
frameworks. This study integrates the agency theory and resource dependency
theory to examine the role of foreign ownership when interacted with
efficiency scores towards protection of minority shareholders in the publicly
listed firms in East African Community.
Using the balanced panel data of 58 non-financial publicly listed companies in
EAC over the period of 2007-2015, the study measures corporate performance
using Tobin’s Q, Return on Assets and Return on Equity. The panel unit root
tests by Im-Pesaran-Shin and Fisher-ADF are performed and the results show
that the data are stationary at first difference. The Pedroni cointegration tests
show that variables have long-run relationships. Efficiency scores are

iv
developed using Data Envelopment Analysis technique. Moreover, this study
employs the Generalized Method of Moments estimator to overcome
endogenous problems for developing consistent and unbiased estimates to
circumvent the likelihood of reporting spurious results.
The major finding of this study is that the ownership concentration is negative
and statistically significant determinant of corporate performance. This result
implies that majority shareholders divert company assets at the expense of
minority investors to demonstrate poor corporate performance and poor
protection of minority shareholders. Also, monitoring and expropriation
behaviour executed by majority shareholders demonstrates the existence of the
U-Shaped, namely, the nonlinear relationship between ownership
concentration and corporate performance among the listed companies in the
partner states of EAC. This result suggests that, interests of all shareholders
can be aligned with corporate objectives achieved at higher level of ownership
concentration.
Moreover, the positive and significant influence of foreign ownership and the
interactive variable on corporate performance suggests that foreign ownership
can promote protection of minority shareholders. Furthermore, the results
show that at least a threshold of 0.66 of efficiency scores is required for
foreign ownership to excite superior corporate performance deliberately for
protection of minority shareholders and henceforth poverty reduction.
v
Acknowledging the importance of minority investors for meticulous capital
market developments and economic outcomes on country and company levels,
results of this study recommend to the authorities to enforce the ownership
structure diversity for efficacy corporate governance practices. Meanwhile, the
authorities are urged to build and reinforce quality institutions in their
jurisdictions for proper corporate governance practices. The importance of
institutions emanates from their ability to stimulate corporate efficiencies and
for enhancing spill over benefits of attracting potential FDI inflows henceforth
promote growth. Moreover, the authorities are advised to weigh the adoption
of minority shareholders watchdog technique from Malaysia which
demonstrated success since 2000.
Keywords: Concentration Ownership, Corporate Performance, East
African Community, Efficiency Scores, Foreign Ownership,
Minority Shareholders.

vi
ACKNOWLEDGEMENT
Pursuing this PhD study has been a truly life-drilling experience for me and it
would not have been possible to accomplish without the support and guidance
that I received from different individuals and institutions.
First and foremost, I would like to be grateful to the Almighty God for
blessing me with amiable health through the whole period of my study.
I owe my deepest gratitude to my supervisors: Prof. Dr. Choong Chee Keong
and co-supervisor: Dr. Mahmud Bin Hj Abd Wahab for their support and
encouragement. Their incisive technical guidance provided me with a strong
impetus to undertake this study. Honestly, Prof. Dr Choong Chee Keong was
always meticulously very enthusiastic and sympathetic on various parts of this
study. I affirm that; without their guidance and constant feedback, this thesis
would hardly have been achievable.
Besides my supervisors, I extend my gratitude to the UTAR community for
the moral support. I am indebted to Dr. Chong Yee Lee and Dr Gengeswari
a/p Krishnapillai for the methodological classes. My appreciation should also
reach to the committees of internal examiners during Proposal Defence (PD)
and Work Completion Seminar (WCS) for their insightful comments and
inspirations, but also for the hard questions which invited me to widen my
thesis from various perspectives. I am also indebted to the UTAR Librarians
for their reliable support and assistance regarding the library ties.

vii
I am deeply grateful to the generous funding received for attaining my PhD
study from the Institute of Finance Management (IFM).
I thank my splendid friends Daniel Koloseni, Edmund Kimaro, Herman
Mandari, Julius Macha, Musa Juma and Zacharia Elias for the moral and
emotional encouragements and for the fun moments we spent together.
I owe a special indebtedness to Mr. Ibrahim Mshindo, the Head of Finance
and Research at the Dar Es Salaam Stock Exchange (DSE) for his cordially
assistance during data collection on registered companies at DSE. I am also
grateful to Ms. Nelly Orwaya, the Data Service Officer at the Nairobi
Securities Exchange (NSE) for providing me with valuable information. I
would like also to extend my appreciation to Ms. Alice Maro of the East
African Community Head Quarters – Arusha.
I am very grateful to my family whose value to me only grows with age. I
acknowledge my parents Mr. and Mrs. Basesa, and my young brother
Nyendeza Basesa for being my true life guards. It is my privilege to thank my
wife Anna and our daughter Catherine, for their love, tolerance and continuous
encouragements bestowed to undertake this intellectually fascinating journey.
At substantial degrees it is not possible to mention everyone who contributed
for this success. Please, all accept my warm gratitude. Last but not the least,
all the remaining errors contained in this thesis are merely mine and ought not
be attributed to any of the above acknowledged persons or institutions.
viii
APPROVAL SHEET
This thesis entitled “OWNERSHIP CONCENTRATION AND
CORPORATE PERFORMANCE IN EAST AFRICAN COMMUNITY
(EAC): THE ROLE OF TECHNICAL EFFICIENCY ON FOREIGN
OWNERSHIP AMONG PUBLICLY LISTED COMPANIES” was
prepared by BILALI BASESA JUMANNE and submitted as partial fulfilment
of the requirements for the degree of Doctor of Philosophy in Finance at
Universiti Tunku Abdul Rahman.
Approved by:
_______________________________
(Prof. Dr. CHOONG CHEE KEONG) Date: __________________
Professor/Supervisor
Department of Economics
Faculty of Business and Finance
Universiti Tunku Abdul Rahman
_________________________________
(Dr. MAHMUD BIN HJ ABD WAHAB) Date: __________________
Asst. Professor/Co-supervisor
Department of Finance
Faculty of Business and Finance
Universiti Tunku Abdul Rahman

ix
SUBMISSION SHEET
FACULTY OF BUSINESS AND FINANCE
UNIVERSITI TUNKU ABDUL RAHMAN
Date: __________________
SUBMISSION OF THESIS
It is hereby certified that Bilali Basesa Jumanne (ID No: 15ABD01268) has
completed this thesis entitled “OWNERSHIP CONCENTRATION AND
CORPORATE PERFORMANCE IN EAST AFRICAN COMMUNITY
(EAC): THE ROLE OF TECHNICAL EFFICIENCY ON FOREIGN
OWNERSHIP AMONG PUBLICLY LISTED COMPANIES” under the
supervision of Professor Dr. Choong Chee Keong from the Department of
Economics, Faculty of Business and Finance, and Asst. Professor Dr. Mahmud
Bin Hj Abd Wahab from the Department of Finance, Faculty of Business and
Finance.
I understand that the University will upload softcopy of my thesis in pdf
format into UTAR Institutional Repository, which may be made accessible to
UTAR community and public.
Yours truly,
(BILALI BASESA JUMANNE)

x
DECLARATION
I, BILALI BASESA JUMANNE, hereby declare that this thesis is based on
my original work except for quotations and citations which have been duly
acknowledged. I also declare that it has not been previously or concurrently
submitted for any other degree at UTAR or other institutions.
(BILALI BASESA JUMANNE)
Date _____________________

xi
TABLE OF CONTENTS
Page
DEDICATION ii
ABSTRACT iii
ACKNOWLEDGEMENT vi
APPROVAL SHEET viii
SUBMISSION SHEET ix
DECLARATION x
TABLE OF CONTENTS xi
LIST OF TABLES xiv
LIST OF FIGURES xv
LIST OF ABBREVIATIONS xvii
CHAPTER
1.0 INTRODUCTION 1
1.1 Introduction 1
1.1.1 The Corporate Governance in East African Community 3
1.1.2 The Consequences for Weak Corporate Governance in
EAC 10
1.2 Problem Statement 19
1.3 Research Questions 22
1.4 Research Objectives 23
1.5 Significance of the Study 23
1.5.1 To Academicians 24 1.5.2 To Policymakers 25
1.6 Organisation of the Thesis 26
2.0 LITERATURE REVIEW 28
2.1 Introduction 28
2.2 Overview of Relevant Past Studies 28 2.2.1 Definitions of Terms 28 2.2.2 Theories of Corporate Governance 30 2.2.3 The Model for this Study 34

xii
2.3 Agency Theory and Resource Dependency Theory 37
2.3.1 Agency Theory and Ownership structure 37 2.3.2 Agency Theory and Corporate Performance 39 2.3.3 Resource Dependency Theory and Corporate
Performance 42
2.4 The Internal and External Mechanisms of Corporate Governance45
2.5 Overview of Ownership Structure and Corporate Performance 47 2.5.1 Ownership Concentration and Corporate Performance 47 2.5.2 Foreign Ownership and Corporate Performance 49
2.6 Foreign Ownership and Technical Efficiency 50
2.6.1 Introduction 50 2.6.2 Firm Technical Efficiency 51 2.6.3 Relationship between Foreign Ownership and
Efficiency 54
2.7 Empirical Studies on Ownership Structure and Performance 57 2.7.1 Introduction 57 2.7.2 Empirical Studies 58
2.8 Observation of the Methodology for the Past Studies 71
2.9 Summary 73
3.0 RESEARCH METHODOLOGY 74
3.1 Introduction 74
3.2 Conceptual Theoretical Framework 75
3.2.1 Theoretical Framework 75
3.2.2 Development of Empirical Model 79
3.3 Data Envelopment Analysis (DEA) Technique 86
3.4 Data type and Data Sources 90 3.4.1 Panel Data 92 3.4.2 The Research Variables 95 3.4.3 Econometric Estimations 103
3.5 Panel Unit Root Tests and Panel Cointegration Tests 104 3.5.1 Panel Unit Root Tests 104 3.5.2 Panel Cointegration Tests 113
3.6 The Fixed Effect and Random Effect Models 115 3.6.1 Introduction 115
3.6.2 The Fixed Effect Model (FEM) 115 3.6.3 The Random Effect Model (REM) 118
3.7 The Generalised Method of Moments (GMM) 120 3.7.1 Overview of GMM 120 3.7.2 The Advantages of GMM 122 3.7.3 The Application of GMM Model 123 3.7.4 Research Instruments 126
xiii
3.8 Summary 128
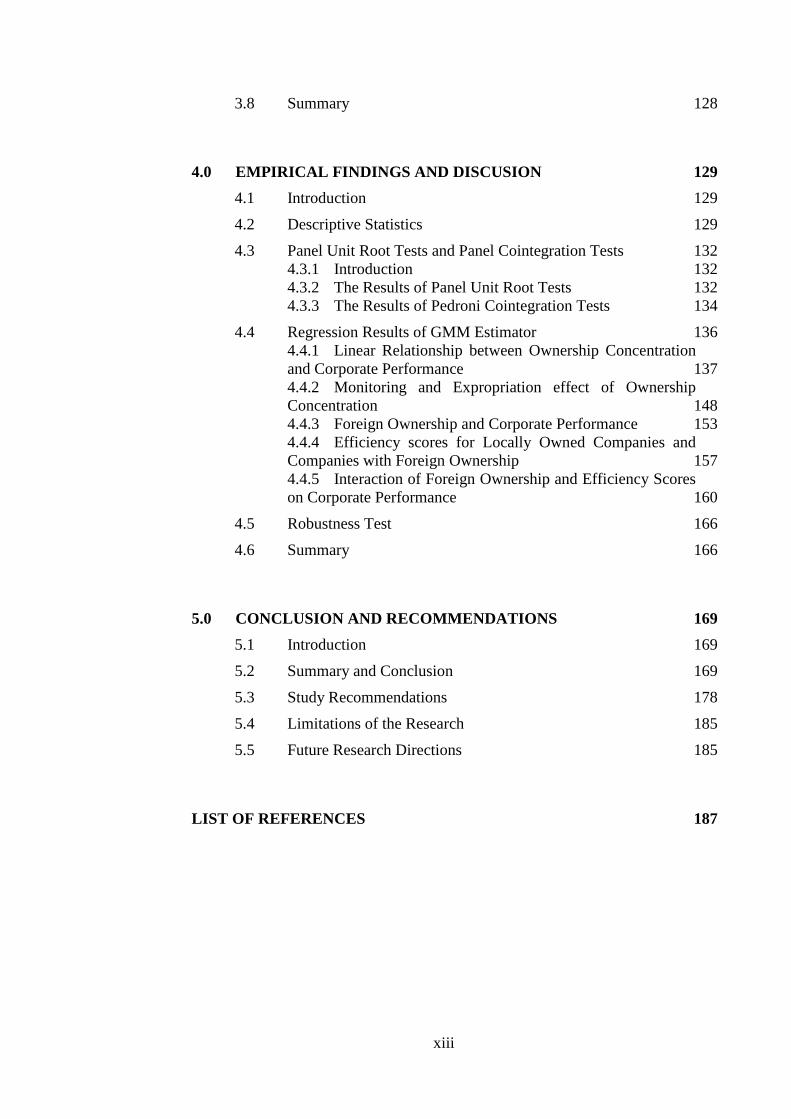
4.0 EMPIRICAL FINDINGS AND DISCUSION 129
4.1 Introduction 129
4.2 Descriptive Statistics 129
4.3 Panel Unit Root Tests and Panel Cointegration Tests 132
4.3.1 Introduction 132 4.3.2 The Results of Panel Unit Root Tests 132 4.3.3 The Results of Pedroni Cointegration Tests 134
4.4 Regression Results of GMM Estimator 136 4.4.1 Linear Relationship between Ownership Concentration
and Corporate Performance 137 4.4.2 Monitoring and Expropriation effect of Ownership
Concentration 148 4.4.3 Foreign Ownership and Corporate Performance 153 4.4.4 Efficiency scores for Locally Owned Companies and
Companies with Foreign Ownership 157
4.4.5 Interaction of Foreign Ownership and Efficiency Scores
on Corporate Performance 160
4.5 Robustness Test 166
4.6 Summary 166
5.0 CONCLUSION AND RECOMMENDATIONS 169
5.1 Introduction 169
5.2 Summary and Conclusion 169
5.3 Study Recommendations 178
5.4 Limitations of the Research 185
5.5 Future Research Directions 185
LIST OF REFERENCES 187
xiv
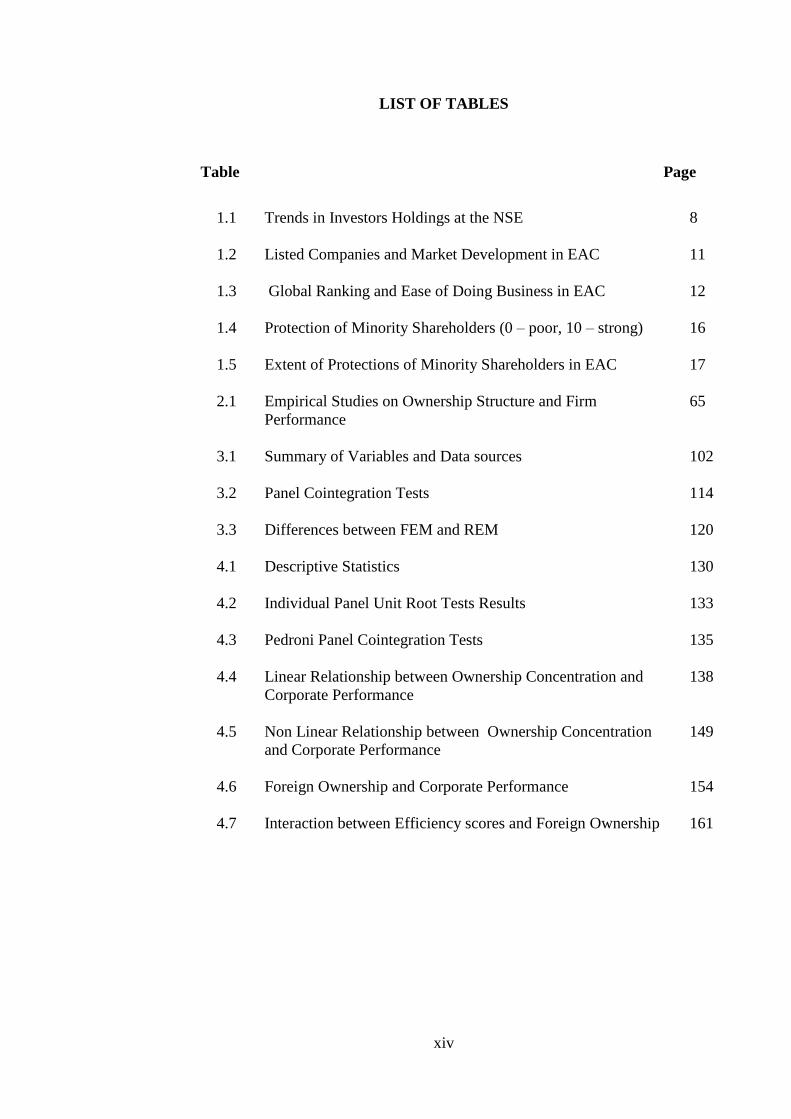
LIST OF TABLES
Table Page
1.1
1.2
1.3
1.4
1.5
2.1
3.1
3.2
3.3
4.1
4.2
4.3
4.4
4.5
4.6
4.7
Trends in Investors Holdings at the NSE
Listed Companies and Market Development in EAC
Global Ranking and Ease of Doing Business in EAC
Protection of Minority Shareholders (0 – poor, 10 – strong)
Extent of Protections of Minority Shareholders in EAC
Empirical Studies on Ownership Structure and Firm
Performance
Summary of Variables and Data sources
Panel Cointegration Tests
Differences between FEM and REM
Descriptive Statistics
Individual Panel Unit Root Tests Results
Pedroni Panel Cointegration Tests
Linear Relationship between Ownership Concentration and
Corporate Performance
Non Linear Relationship between Ownership Concentration
and Corporate Performance
Foreign Ownership and Corporate Performance
Interaction between Efficiency scores and Foreign Ownership
8
11
12
16
17
65
102
114
120
130
133
135
138
149
154
161

xv
LIST OF FIGURES
Figure Page
1.1
1.2
1.3
2.1
2.2
3.1
4.1
Trend of FDI inflows in EAC from 2005 – 2015
Trend of FDI inflows to Various Regions from 2005-2013
Protection of Minority Investors for Listed and Non-listed
Firms
Theoretical Framework
Relationship between Principals and Agents
Panel Unit Root Tests
Trend for Average Efficiencies of Foreign Ownership and
Local Ownership in EAC
14
15
18
37
38
107
158

xvi
LIST OF ABBREVIATIONS
ACP African Caribbean and Pacific
AfDB African Development Bank
ADF African Development Fund
AEC African Economic Community
ASEAN Association of Southeast Asian Nations
CEN – SAD Community of Sahel – Saharan States
CEMAC Communauté Économique des États d'Afrique Centrale
CMA Capital Market Authority
COMESA Common Market for Eastern and Southern Africa
CRS Constant Return to Scale
DEA Data Envelopment Analysis
DMU Decision Making Unit
EAC East African Community
EACCG East African Community corporate governance
EASRA East Africa Security Regulatory Authority
ECA Economic Commission for Africa
ECCAS Economic Community of Central African States
ECOWAS Economic Community of West African States
FDI Foreign Direct Investment
FEM Fixed Effect Model
GDP Gross Domestic Product
GMM Generalised Method of Moments
IGAD Inter-Governmental Authority on Development

xvii
IMF International Monetary Fund
IPS Im, Pesaran and Shin
IV Instrumental Variable
LLC Levin, Lin and Chu
LSDV Least Square Dummy Variable
MSWG Minority Shareholders Watchdogs Group
NDV National Development Visions
NSE Nairobi Security Exchanges
OECD Organisation for Economic Cooperation and
Development
ODA Official Development Assistances
OLS Ordinary Least Square
POLS Pooled Ordinary Least Square
PTAs Preferential Trade Agreements
REM Random Effect Model
RDT Resource Dependency Theory
ROA Return on Asset
ROE Return on Equity
SADC Southern Africa Development Community
SSA Sub-Saharan Africa
2SLS Two Stage Least Square
UNCTAD United Nations Conference on Trade and Development
VRS Variable Return to Scale

CHAPTER 1
INTRODUCTION
1.1 Introduction
The East African Community (EAC) is the regional integration of five partner
states, namely: the United Republic of Tanzania, Republic of Kenya, Republic
of Uganda, Republic of Rwanda and Republic of Burundi. The EAC was
established in 2000 by three mother countries Tanzania, Kenya and Uganda,
and thereafter joined by Rwanda and Burundi in 2007. The region shelters an
area of approximately 1,818 thousand square Kilometres. The population
growth is about 2.3 per cent per annum thus, about 237 million people are
expected in the year 2030 (EAC, 2011, 2015b). In 2015, the Community had a
population of approximately 149 million people (EAC, 2016).
The partner states of EAC are categorised as low income economies with the
exception of Kenya which was classified as lower-middle-income economy by
the World Bank in 2016. The EAC aims at deepening intra-regional trade that
requires a stable and competitive business environment to achieve value added
products, trade and investment by year 2020. Moreover, the region strives to
harmonise the achievability of the National Development Visions (NDVs) for
each partner state. Accordingly, the objectives of EAC need be reflected into
the economic growth of each partner state (EAC, 2015a).

2
Premised on the above understanding, Tanzania expects to achieve its NDV in
the year 2025 with high quality livelihood, good governance through the rule
of law, and developed strong and competitive economy. Kenya expects to
achieve its NDV in the year 2030 with expectations of providing high quality
life to Kenyans. Uganda’s NDV will be attained in the year 2040 with
prospects of transforming peasant society to modern and accelerated socio-
economic society. Rwanda expects to attain its NDV in the year 2020 by
achieving the middle income economy status.
In order to achieve the desired objectives and capture global competitive
environment, the partner states of EAC, among other things, need to employ
and implement quality institutions that are amiably for business ethics. In
addition, the partner states have to build sound and functioning public and
private sector partnership for efficacy corporate governance practices that will
essentially invite potential domestic and foreign investors (AfDB, 2011; EAC,
2011).
This study focuses on the efficacy of corporate governance towards corporate
performance of 58 non-financial listed firms in EAC. It is worth to note that,
the EAC region will achieve the predetermined goals through proper conduct
of corporate governance practices. Besides, the proper conduct of corporate
governance practices among the listed companies in partner states constitutes
friendly tools for attracting potential investments. Thus, effective corporate
governance practices are the bridges for protection of minority investors and
impact the capital market developments and economic outcomes on country
3
and company levels. The enrichment of corporate performance demonstrates
the catching-up of the country’s growth.
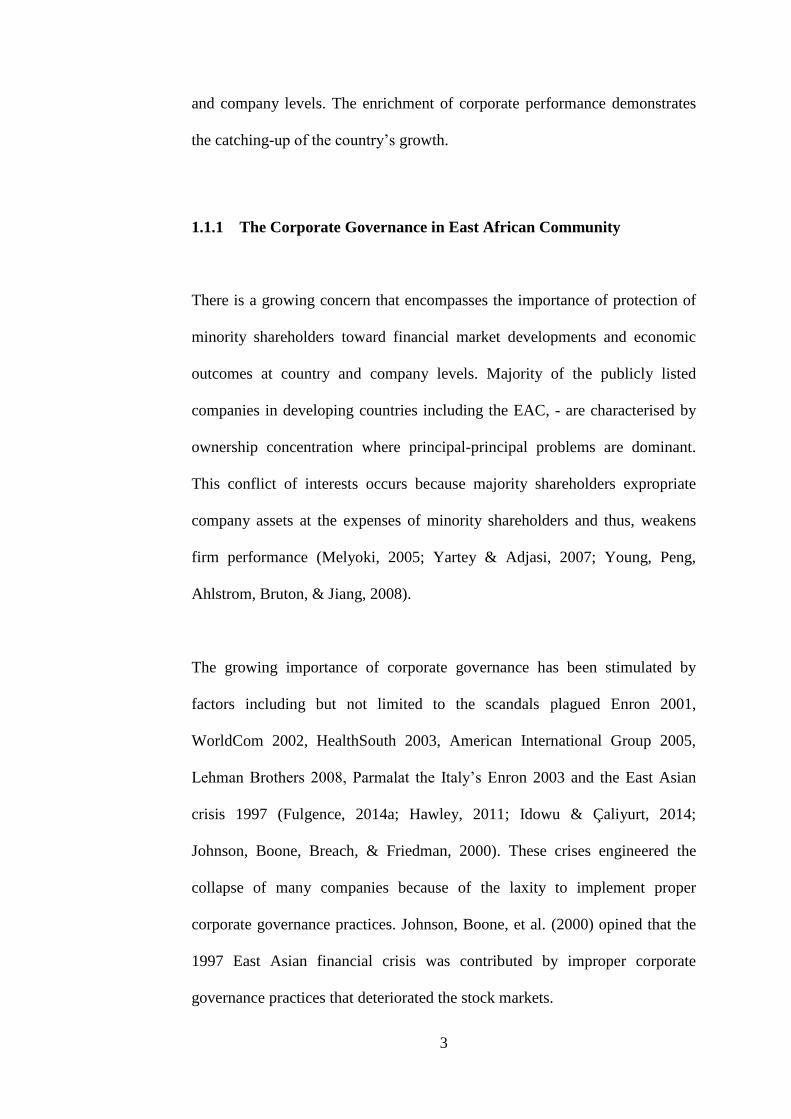
1.1.1 The Corporate Governance in East African Community
There is a growing concern that encompasses the importance of protection of
minority shareholders toward financial market developments and economic
outcomes at country and company levels. Majority of the publicly listed
companies in developing countries including the EAC, - are characterised by
ownership concentration where principal-principal problems are dominant.
This conflict of interests occurs because majority shareholders expropriate
company assets at the expenses of minority shareholders and thus, weakens
firm performance (Melyoki, 2005; Yartey & Adjasi, 2007; Young, Peng,
Ahlstrom, Bruton, & Jiang, 2008).
The growing importance of corporate governance has been stimulated by
factors including but not limited to the scandals plagued Enron 2001,
WorldCom 2002, HealthSouth 2003, American International Group 2005,
Lehman Brothers 2008, Parmalat the Italy’s Enron 2003 and the East Asian
crisis 1997 (Fulgence, 2014a; Hawley, 2011; Idowu & Çaliyurt, 2014;
Johnson, Boone, Breach, & Friedman, 2000). These crises engineered the
collapse of many companies because of the laxity to implement proper
corporate governance practices. Johnson, Boone, et al. (2000) opined that the
1997 East Asian financial crisis was contributed by improper corporate
governance practices that deteriorated the stock markets.

4
In Africa, the global financial crisis brought negative effects among the Sub-
Saharan Africa (SSA) including the partner states of EAC. These effects
inflicted the uneven economic growth among the SSA countries from about
6.5% to about 1% in 2009 before rebounding to 4% in 2010 (IMF, 2009).
Moreover, the consequences for declining Foreign Direct Investment (FDI) by
15% in 2008 worsened together the private sector financing and the flow of
Official Development Assistances (ODA) (Allen & Giovannetti, 2011; Das &
Dutta, 2013; Kumar & Singh, 2013; United Nations, 2009).
Along with the crisis, the consequences for poor corporate governance
practices awakened the developing countries including the partner states of
EAC to gauge efforts for standard corporate governance practices. On the
awake of this fatigue, the partner states of EAC incorporated codes from
different jurisdictions including the Organisation for Economic Cooperation
and Development (OECD), United Kingdom, Malaysia and South Africa. This
attempt intended to empower the East Africa Security Regulatory Authority
(EASRA) for strong Capital Markets Authorities (CMA) in the region. In
general, this action steered the building of solid guidelines for good corporate
governance practices in public listed companies and to the issuers of debts for
effective corporate performance (EAC, 2011).
Thus, the adapted standard corporate governance practices in Africa including
the partner states of EAC intended to awaken the stagnant growth that was
delayed by unstable politics, corruption, bureaucracy and weak legal systems.
It is important to note that weak corporate governance practices deter making

5
potential investment decisions in emerging markets (Khanna & Zyla, 2010;
Munisi, Hermes, & Randøy, 2014; Rwegasira, 2000).
Since the pervasiveness for the laxity to enforce legal and regulatory
environments among partner states of EAC implies underdeveloped external
mechanisms of corporate governance, a need to have well-functioning external
and internal mechanisms that promote the efficacy corporate governance
practices was necessary. The external mechanism constitutes the legal and
regulatory systems for impacting markets for corporate control and takeovers,
whereas,- the internal mechanism of corporate governance constitutes an
alternative means for protection of minority shareholders (Dyck, 2001; La
Porta, Lopez-de-Silanes, Shleifer, & Vishny, 2002; Young et al., 2008).
The publicly listed companies among partner states of EAC are dominated by
ownership concentration; an outcome of poor legal and regulatory framework
and lack of market for corporate control (Klapper & Love, 2004b; Luo, Wan,
& Cai, 2012). The lack of market for corporate control does not create threat
for hostile takeover for inefficient management because voting power is
diluted (Becht & Boehmer, 2003; Mayer, 2002). As a result, such weaknesses
deliberate the ownership and control of the company into the hands of
majority shareholders who are driven by incentives of private benefit of
control to extract company resources. The expropriation by majority
shareholders creates horizontal problem which in turn worsens the corporate
performance (Chakra & Kaddoura, 2015; La Porta et al., 2002; Young et al.,
2008). Studies have indicated that concentrated ownership stands at 65% in

6
Tanzania1 (Nyaki, 2013), 64% in Kenya2 (Mule, Mukras, & Oginda, 2013),
and above 50% in Uganda3 and Rwanda4.
The financial liberalisation that took place in 1990s towards market
development lessened barriers for international trade and initiated foreign
investors to easily access international markets. It is widely accepted that
foreign investors facilitate standard corporate governance practices and
enhances performance of targeted companies (Aggarwal, Erel, Ferreira, &
Matos, 2011; Douma, George, & Kabir, 2006; Gillan & Starks, 2003).
Moreover, foreign investors from developed economies where investor
protection is very strong, they exercise investor protection in targeted
companies that are located in weaker investor protection regions (Chakra &
Kaddoura, 2015).
It is acknowledged that countries that build stable and favourable business
environment attract potential foreign investors (Aggarwal et al., 2011).
However, this attempt requires each country to enforce the implementation of
friendly reforms that will attract potential investors. The regulatory business
environment facilitates foreign investors to transact at lower costs and eases
the cost of doing business (Gaur, Kumar, & Singh, 2014; Yang, 2015). The
laxity to implement institutional reforms among the SSA including the partner
states of EAC is of paramount to investigate (Rossouw, 2005). Recent study
carried by Barasa, Knoben, Vermeulen, Kimuyu, and Kinyanjui (2017)
1 Dar Es Salaam Stock Exchange (DSE)
2 Nairobi Stock Exchange (NSE)
3 Uganda Security Exchange (USE)
4 Rwanda Security Exchange (RSE)

7
concluded on the prevalence of weak institutions among the partner states of
EAC Kenya, Tanzania and Uganda. The authors argued that institutions in
Tanzania are much weaker compared to other partner states. It is significant to
note that, - Rwanda has been consistently appreciated for efforts undertaken so
far to reform their institutions (World Economic Forum, 2015).
Therefore, institutions that comprises with formal and informal economic,
social and political perspectives, are expected to foster social interactions by
pioneering pleasant policies necessarily for improved corporate performance.
Institutions are accredited for playing significant roles of facilitating human
interaction and thus promote productivity through investments (Bénassy-
Quéré, Coupet, & Mayer, 2007; Buchanan, Le, & Rishi, 2012; Hodgson, 2006;
North, 1990). This implies that pleasant environment minimises fears and
boosts confidence to foreign investors on their investments. However, it is
worth to note that,- the partner states of EAC have yet to attract potential
foreign investors because of laxity to enforce amiable business environment
(Eyster, 2014; Okpara, 2011).
Kenya is viewed as an icon for economic landscaping among East African
countries and it is among of the countries that established their stock market as
earlier as in 1954. However, being long existed in the market, Kenya has not
yet attracted significant number of foreign ownership among listed firms at
Nairobi Securities Exchange (NSE) as reported in Table 1.1.

8
Table 1.1: Trends in Investor Holding at the NSE
Type of Ownership/Year 2007 2008 2009 2010 2011 2012 2013 2014 2015
East African Institutions (%) 54.5 77.2 74.2 73.6 68.3 66.7 47.6 65.4 46.9
East African Individuals (%) 26.9 14.9 15.7 13.8 12.2 12.0 23.7 13.0 18.9
Foreign Ownership (%) 18.6 7.9 10.1 12.6 19.4 21.3 27. 9 21.6 26.4
Source: Capital Market Authority of Kenya - Capital Markets Bulletin (2015).
Table 1.1 highlights the trend of three categories of investors available at
Nairobi Security Exchanges (NSE) namely the East African Institutions, the
East African individuals and foreign investors. Clearly, the trend shows an
increasing albeit the small number of foreign investors among listed
companies at NSE. Therefore, this study intends also to examine the role of
efficiencies that are created by institutions to stimulate foreign ownership
towards superior firm performance which in turn promotes the protection of
minority shareholders among publicly listed companies in partner states of
EAC.
There are vast empirical studies that have been carried out on the ownership
concentration and corporate performance relations. More studies were
conducted in developed economies than emerging economies including EAC
which has dearth empirical studies. The corporate governance practices in
developed economies are built on solid and well established institutional
systems where management activities are monitored at low costs (Bajaj, Chan,
& Dasgupta, 1998; Iskander & Chamlou, 2000).
Meanwhile, in developing economies including the partner states of EAC, the
ownership concentration and firm performance relations has not received yet
9
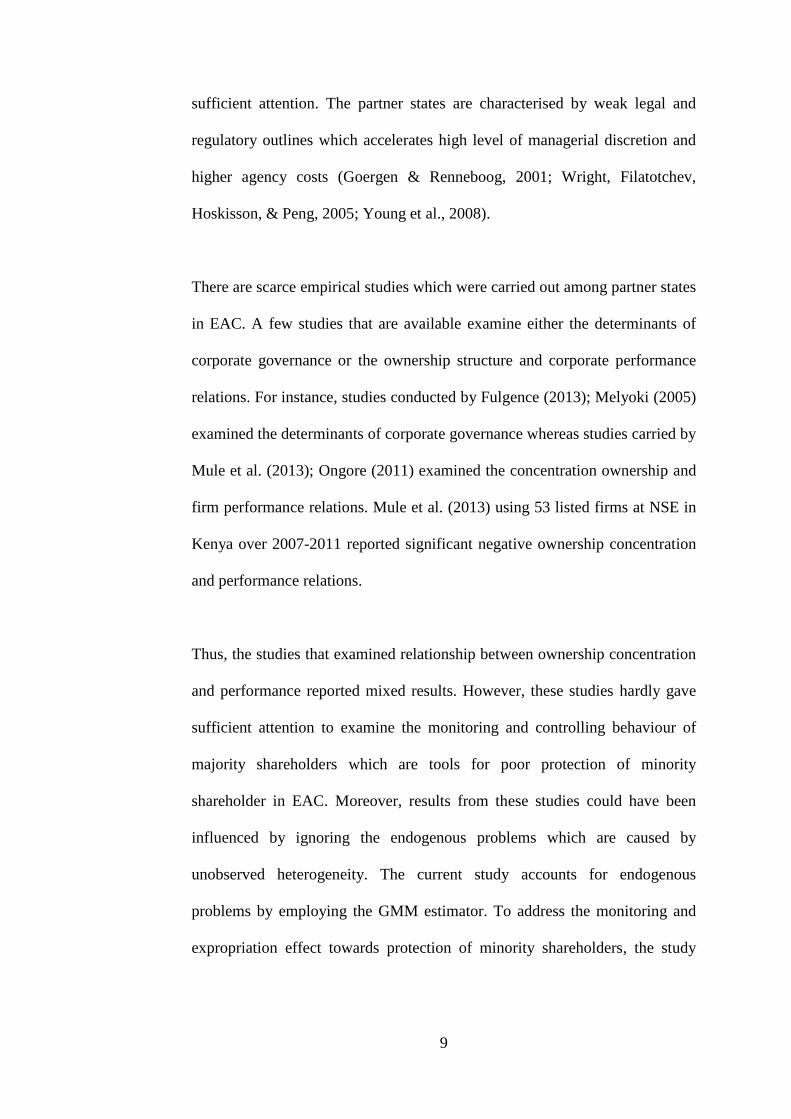
sufficient attention. The partner states are characterised by weak legal and
regulatory outlines which accelerates high level of managerial discretion and
higher agency costs (Goergen & Renneboog, 2001; Wright, Filatotchev,
Hoskisson, & Peng, 2005; Young et al., 2008).
There are scarce empirical studies which were carried out among partner states
in EAC. A few studies that are available examine either the determinants of
corporate governance or the ownership structure and corporate performance
relations. For instance, studies conducted by Fulgence (2013); Melyoki (2005)
examined the determinants of corporate governance whereas studies carried by
Mule et al. (2013); Ongore (2011) examined the concentration ownership and
firm performance relations. Mule et al. (2013) using 53 listed firms at NSE in
Kenya over 2007-2011 reported significant negative ownership concentration
and performance relations.
Thus, the studies that examined relationship between ownership concentration
and performance reported mixed results. However, these studies hardly gave
sufficient attention to examine the monitoring and controlling behaviour of
majority shareholders which are tools for poor protection of minority
shareholder in EAC. Moreover, results from these studies could have been
influenced by ignoring the endogenous problems which are caused by
unobserved heterogeneity. The current study accounts for endogenous
problems by employing the GMM estimator. To address the monitoring and
expropriation effect towards protection of minority shareholders, the study

10
examines the existence of the nonlinear relationship between ownership
concentration and corporate performance.
Additionally, previous studies have not provided adequate attention on the
stimulating ability of efficiency on the relationship between foreign ownership
and corporate performance towards the protection of minority shareholders.
Hence, this study employs Data Envelopment Analysis (DEA) technique to
develop efficiency scores which are incorporated in the relationship between
ownership concentration and corporate performance model to evaluate the
efficiency of foreign ownership towards corporate performance. The study
measures corporate performance5 using Tobin’s Q, Return on Asset (ROA)
and Return on Equity (ROE).
1.1.2 The Consequences for Weak Corporate Governance in EAC
The extent of weak corporate governance in the region varies among partner
states for a number of reasons including but not limited to social, economic
and nature of individual country. However, the costs for weak corporate
governance practices impact the achievability of the standard and quality of
life described in the NDVs of each partner state. Therefore, the reasons for
weak corporate governance practices in East African countries include the
following.
5 Corporate performance measures are detailed in chapter three

11
First, weak legal and institutional platforms among listed firms in developing
countries including the EAC are hampered by imperfect contracts, unstable
share price, low market capitalisation, frequent technology changes, principal-
principal conflicts, low dividend pay-outs, minimal investment in innovation,
flux and unstable macroeconomic factors, deficient monitoring mechanisms,
disputable managerial discretion and agency costs (Goergen & Renneboog,
2001; Wright, Filatotchev, Hoskisson, & Peng, 2005; Young et al., 2008).
The wide acknowledged fact is that stock markets are of paramount for
boosting the economic growth because of their ability to diffuse information,
mobilise savings and facilitate investments (Arestis, Demetriades, & Luintel,
2001; Oriwo, 2012). However, the partner states of EAC are characterised by
fewer listed companies in their respective stock exchange. Until 2015, the four
exchanges of EAC had 110 listed companies. This implies that, listed
companies constitute low market capitalisation. Table 1.2 details the markets
development in EAC.
Table 1.2: Listed Companies and Stock Market Development in EAC
Country Year of
Liberalisation
Establishment of Stock
Markets
Listed
Companies
2015
Market
Capitalisation
2015
1 Tanzania 1995 1996 21 US$9bn
2 Kenya 1993 1954 66 US$19bn
3 Uganda 1988 1996 18 US$7bn
4 Rwanda 1996 2005 06 US$3bn
5 Burundi6 1999 --- --- ---
Source: WB and WTO (2008) and EAC database
6 Burundi has no yet established the stock market.
12
The stock markets are supposed to be vehicles for strengthening the likelihood
for the listed firms to adhere towards standard corporate governance practices
which in turn promotes corporate performance (OECD, 2014). Additionally,
Claessens and Yurtoglu, (2012); Demb and Neubauer, (1992); Keasey,
Thompson, and Mike (2005) asserted that capital market helps firm to expand
investments, speed up growth and increase employment opportunities while
weak corporate governance reduces investors’ confidence and discourage
investments from potential investors.
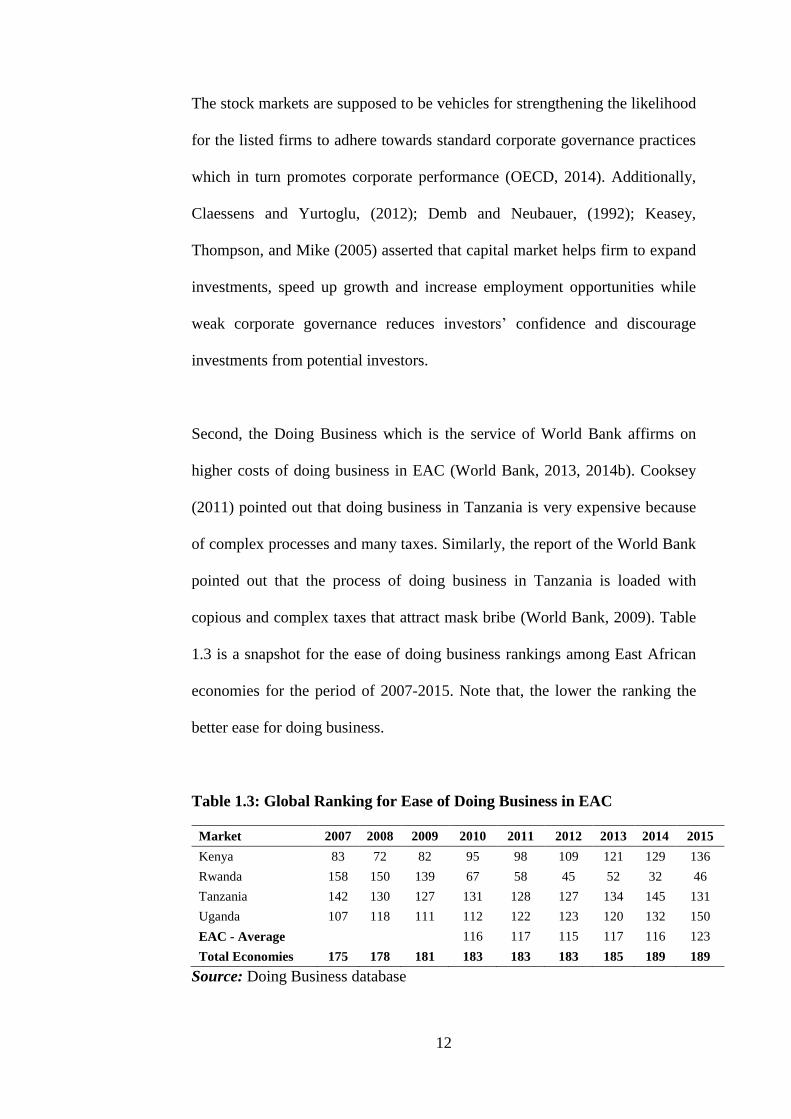
Second, the Doing Business which is the service of World Bank affirms on
higher costs of doing business in EAC (World Bank, 2013, 2014b). Cooksey
(2011) pointed out that doing business in Tanzania is very expensive because
of complex processes and many taxes. Similarly, the report of the World Bank
pointed out that the process of doing business in Tanzania is loaded with
copious and complex taxes that attract mask bribe (World Bank, 2009). Table
1.3 is a snapshot for the ease of doing business rankings among East African
economies for the period of 2007-2015. Note that, the lower the ranking the
better ease for doing business.
Table 1.3: Global Ranking for Ease of Doing Business in EAC
Market 2007 2008 2009 2010 2011 2012 2013 2014 2015
Kenya 83 72 82 95 98 109 121 129 136
Rwanda 158 150 139 67 58 45 52 32 46
Tanzania 142 130 127 131 128 127 134 145 131
Uganda 107 118 111 112 122 123 120 132 150
EAC - Average
116 117 115 117 116 123
Total Economies 175 178 181 183 183 183 185 189 189
Source: Doing Business database

13
In general, the ease for doing business among partner states in EAC is loaded
with hostile environment which hinders investors and smooth operations of
firms. As highlighted in Table 1.3, the ease for doing business commences at
the time of starting a business, getting a construction permit, getting
electricity, property registration, getting credit, investors protection, paying
taxes, cross border trading, enforcing contracts to resolve insolvency (Chakra
& Kaddoura, 2015).
Third, weak corporate governance practices accelerate worsening of potential
Foreign Direct Investment (FDI) and thus, deter the possibility to access
private external funding. This means that weak corporate governance is hostile
for potential foreign investors who are willing to make investment decisions. It
is argued that FDI inflows chase healthy institutions as institutions are robust
source of FDI (Ali, Fiess, & MacDonald, 2010; Bevan, Estrin, & Meyer,
2004).
The reality about the partner states of EAC is that, the trend of FDI inflows
has been increasing albeit decreasing rate (AfDB, 2011; Blomström & Kokko,
1997; Eyster, 2014). The laxity to enforce standard corporate governance
practices among partner states embrace hostile environment for potential
foreign investors. Lack of transparency, accountability and endemic corruption
in Sub-Saharan Africa including the partner states of EAC are among severe
barriers toward potential FDI inflows (Rubakula, 2014).

14
Existing data show that, the trend of FDI inflows among the partner states over
the period of 2005-2015 were increasing at discount rate as displayed in Fig.
1.1.
Figure 1.1: Trend of FDI Inflows in EAC from 2005-2015
Source: UNCTAD (2016)
The trend of FDI inflows as disclosed in Figure 1.1 indicates that the EAC has
never been the best destination for FDI inflows. Asiedu (2006) opined that, the
non-rich resource countries have possibility to attracting potential FDI inflows
through implementing standard institutions and good governance (Buchanan et
al., 2012). However, the listed companies among the SSA including the
partner states of EAC are laxity to implement pleasant business environment.
For justification, Figure 1.2 unveils the trend of FDI inflows to EAC and other
regions over a period 2005-2013.
-
500.0
1 000.0
1 500.0
2 000.0
2 500.0
3 000.0
3 500.0
4 000.0
4 500.0
5 000.0
2005 2006 2007 2008 2009 2010 2011 2012 2013 2014 2015
FD
I In
flo
ws
(U
S$
Mil
lio
ns)
Years
Kenya Rwanda Uganda Tanzania Burundi EAC

15
Figure 1.2: Trend of FDI Inflows to Various Regions from 2005-2013
Source: UNCTAD (2014).
Fig. 1.2 shows that FDI inflows in EAC were relatively very low compared to
other regions over the period of 2005-2013. Among the stated reasons for low
FDI inflows in EAC include weak corporate governance practices. Ayandele
and Emmanuel (2013) claimed that good corporate governance practices
facilitate the access to external financing, minimise the cost of capital,
promotes productivity and enhances low risk of systematic financial failure.
Figures 1.1 and 1.2 indicate that the partner states of EAC have had limited
initiatives to attract potential FDI inflows because of improper corporate
governance practices (Blomström & Kokko, 1997; UNCTAD, 2016).
The pitfalls outlined above result due to a laxity to implement legal and
regulatory frameworks. This unrest entails the ownership and controlling
- 20,000 40,000 60,000 80,000 100,000 120,000 140,000
EAC
SADC
ACP
ASEAN
CEMAC
CEN-SAD
COMESA
ECCAS
ECOWAS
IGAD
FDI inflows (US$ Millions)
Reg
ion
s
2013 2012 2011 2010 2009 2008 2007 2006 2005

16
rights of the company into the hands of majority shareholders. Thus,
separation of ownership and control as predicted by the Agency Theory is
violated. As pointed above, majority shareholders extract company assets at
the expenses of the minority investors resulting into horizontal problems
which in turn creates poor protection of minority investors and poor corporate
performance among the partner states (Chakra & Kaddoura, 2015; Filatotchev,
Wright, Uhlenbruck, Tihanyi, & Hoskisson, 2003; Wright et al., 2005; Young
et al., 2008).
The Global Competitive Index and the Doing Business separately reported the
degree of poor protection of minority shareholders in SSA including the EAC.
To emphasise on this, the EAC was ranked with low score for strength of
minority shareholders protection compared to other regions in 2015. Table 1.4
shows the protection of minority shareholders across regions.
Table 1.4: Protection of Minority Shareholders (0 – poor, 10 – strong)
Region
Extent of conflict
of interest
regulation index
(average: 0-10)
Extent of
Shareholder
governance
index (0-10)
Strength of minority
investor protection
index
(average: 0-10)
OECD high-income 6.4 6.2 6.3
Europe & Central Asia 6.0 5.9 5.9
South Asia 5.2 5.3 5.3
East Asia & Pacific 5.5 4.5 5.0
Middle East & North Africa 4.8 4.6 4.7
Latin America & Caribbean 5.1 4.1 4.6
Sub-Saharan Africa 4.8 4.4 4.6
Source: Doing Business Database.
Table 1.4 shows that the higher income economies implement legal and
regulatory reforms, the market for corporate control and takeover are active.

17
This implies that higher income economies are attached with standard
corporate governance practices that are friendly for investor protection. On the
other hand, the weak corporate governance practices among partner states of
EAC obstruct protection of minority shareholders. The trend for protection of
minority investors among the partner states of EAC is disclosed in Table 1.5.
The lower score implies the extent of protection of minority investors.
Table 1.5: Extent of Protections of Minority shareholders in EAC
Country 2010 2011 2012 2013 2014 2015
Kenya 100 78 87 82 60 61
Tanzania 91 99 94 110 106 104
Uganda 86 91 97 117 123 106
Rwanda 42 36 30 31 62 25
Total countries 139 142 144 148 144 140
Source: Global Competitive Index Database
Table 1.5 reveals the pervasiveness of weak protection of minority investors
among the partner states of EAC. The private benefits of control as pointed out
earlier, are the incentives for expropriation by majority shareholders at the
expense of minority investors (Claessens & Yurtoglu, 2012, 2013; La Porta et
al., 2000a; World Bank, 2013, 2014b). However, Table 1.5 indicates that
Rwanda has progressively improved on protection of minority shareholders
compared to other partner states. This is to say that Rwanda has undertaken
meticulous actions to enforce regulatory framework.
Despite the fact that Rwanda faces similar challenges as those faced by other
stock markets in EAC like illiquid and volatility, she intends to provide strong
investor protection through regional integration by furthering integration into

18
international capital markets and promoting communication structure
(Kazarwa, 2015). Nevertheless, Rwanda is argued to have complex taxes on
goods and services which is constraining for potential foreign investors.
Another factor for weak protection of minority shareholders is when security
exchanges fail to prioritise between listed and non-listed companies. Figure
1.3 discloses the consequences when stock market provides similar treatment
to minority shareholders of listed and non-listed companies.
Fig 1.3: Protection of Minority Shareholders for Listed and Non-listed Firms.
Source: Doing Business database.
The above Figure reveals that there is higher protection of minority
shareholders in economies that distinguish between listed and non-listed
companies. However, the opposite is true for economies like partner states of
EAC that do not distinguish the same. According to Doing Business, the
highly regulated markets provide high protection of minority shareholders for
listed than for non-listed companies contrary to the Sub-Saharan economies
including EAC where minority shareholders for listed and non-listed
companies receive the same treatment (Chakra & Kaddoura, 2015).

19
1.2 Problem Statement
The poor corporate governance among the partner states of EAC is associated
with unforced legal and regulatory frameworks (Mak & Kusnadi, 2005;
Munisi et al., 2014; Munisi & Randøy, 2013; Rwegasira, 2000; Transparency
International, 2017). The laxity to enforce efficacy corporate governance leads
into poor protection of minority shareholders and consequently into poor
corporate performance among listed companies of member states of EAC.
The separation between ownership and control of companies in EAC is
exploited by majority shareholders who expropriate company assets at the
expense of minority shareholders. The expropriation by majority shareholders
creates horizontal problem which is the conflict between majority and
minority shareholders known as principal - principal conflict. The poor
protection of minority shareholders is among the key factors constraining firm
performance in EAC. The prevalence of poor protection creates uncertainties
and pessimism for potential investors who would otherwise undertake
potential investments (Munisi & Randøy, 2013; Young et al., 2008).
The legal and regulatory frameworks for developed countries are well
enforced whereas the ownership concentration are associated with superior
corporate performance because of the concentrated monitoring by majority
shareholders (Berle & Means, 1933; Claessens & Djankov, 1999). The
underdeveloped legal and regulatory frameworks and markets for corporate
control in developing countries including EAC fuels concentrated ownership

20
into poor protection and poor performance (Filatotchev et al., 2003; Jiang &
Peng, 2011; Young et al., 2008). Thus, expropriation by majority shareholders
at the expense of minority shareholders perpetuates the poor protection and
weakens stock market development and threatens the survival of companies
(Kaufmann, Kraay, & Mastruzzi, 2009).
The FDI inflows offer numerous advantages to the host country including the
technological transfer, job creation, human skills, management know-how,
access of external markets, innovation, and enhance domestic firms (Keong,
2007). FDI inflows among the partner states of EAC have been increasing at
decreasing rate. The poor protection of minority shareholders sends bad signal
to foreign investors who hesitate to make investments in the region (Claessens
et al., 1999; La Porta et al., 1999, 1997, 2000; Maher & Andersson, 1999).
It is acknowledged that institutions play significant role of exciting country’s
economic growth (Acemoglu, Johnson, Robinson & Thaicharoen, 2003).
Institutions are platforms to attract foreign investors to bring with them
investment capital that will essentially contribute towards economic growth
and henceforth help towards poverty reduction. Furthermore, Gui-Diby (2014)
asserted that institutions promoted economic performance in Africa between
1995-2009 compared to when institutions were laxity implemented in 1980-
1995. This means that implementation of reforms in 1995-2009 accelerated
the catching up for more foreign investment than in 1980-1995.

21
There are recognised efforts which have been undertaken to build institutional
reforms among partner states of EAC (UNECA, 2016; United Nations
Economic Comission for Africa, 2013). However, vast literature including
Asiedu (2006) have pointed out that the laxity to enforce legal and regulatory
frameworks among African countries including partner states of EAC are still
mediocre and incomplete. The outcome is that up to date there is low
composition of foreign investors among the publicly listed companies in the
partner states of EAC regardless of the open rooms and sweet attachments that
welcome foreign investors.
However, there are dearth empirical studies among partner states in EAC that
examined corporate governance and corporate performance relations. Studies
that examined the relationship between ownership concentration and corporate
performance reported inconclusive results either positive or negative. These
mixed results could have been contributed by ignoring the important aspect of
endogeneity problem particularly the dynamic endogeneity which is ignoring
the influence of past performance (Flannery & Hankins, 2013; Nguyen,
Locke, & Reddy, 2015; Zhou, Faff, & Alpert, 2014).
Furthermore, these studies hardly gave adequate attention on examining the
monitoring and controlling behaviour of majority shareholders which are the
main source for poor protection of minority shareholder (Filatotchev, Jackson,
& Nakajima, 2013; Y. Hu & Izumida, 2008). Therefore, the current study
addresses the endogenous problems by employing the dynamic generalised
method of moments (GMM) estimator for a panel of 58 non-financial listed

22
companies at securities exchanges among partner states of EAC. To address
the monitoring and expropriation behaviour by majority shareholders, this
study examines the presence of nonlinear relationship by introducing the
squared ownership concentration on the relationship between ownership
concentration and corporate performance model.
1.3 Research Questions
This thesis is guided by the following research questions:
i) What is the relationship between concentrated ownership and corporate
performance in EAC?
ii) Do the monitoring and expropriation by majority shareholders affect
performance of the public listed companies in EAC?
iii) Does the listed companies with the foreign ownership more technically
efficient than the local ownership in EAC?
iv) What impacts do the efficiency scores can bring to foreign ownership
through integrating the agency theory and the resource dependency
theory to influence the protection of minority shareholders in EAC?
23
1.4 Research Objectives
This study intends to achieve the following objectives:
i) To examine the linear relationship between the concentrated ownership
and corporate performance among the public listed companies at the
stock exchanges in the EAC
ii) To examine the impact of monitoring and expropriation behaviour by
majority shareholders in the public listed companies in EAC.
iii) To examine the average technical efficiency of foreign ownership and
average technical efficiency of local ownership in EAC.
iv) To integrate the agency theory and resource dependency theory to
evaluate the role played by foreign ownership and its interaction with
efficiency scores toward firm performance and protection of minority
shareholders in EAC.
1.5 Significance of the Study
This study is conducted with the respect to the East African Community that
existed since 2000 with the aspirations of becoming middle income economy
by harmonizing the National Development Visions of the partner states. Thus,
the study is expected to provide the following contributions.

24
1.5.1 To Academicians
This study intends to address the problem of minority shareholders in East
African Community (EAC). The East African countries are characterised by
weak legal and regulatory frameworks and ineffective markets for corporate
control. Thus, this study relies on the internal mechanism through the
ownership structure to effectively protect minority shareholders.
The study contributes to the literature by providing empirical evidence for the
relationship between ownership concentration and corporate performance in
EAC. It accounts for unobserved heterogeneity which is the source for
endogeneity problem by employing the Generalised Method of Moments
(GMM) estimator. The GMM estimator develops consistent and unbiased
estimates that reduce the possibility of reporting spurious results. This analysis
has the basis that countries in Sub-Saharan Africa including EAC are
characterised by weak legal and regulatory frameworks which demonstrates
poor protection of minority investors.
The study will also contribute to the existing empirical literature by examining
the role played by efficiency scores to stimulate the relationship between
foreign ownership and corporate performance among partner states. This will
be achieved by integrating the agency and resource dependency theories. The
resource dependency theory asserts that companies that exploit external
sources via foreign ownership mitigates the horizontal problems and
eventually promotes protection of minority shareholders. The efficiency scores

25
are developed using the Data Envelopment Analysis technique. This aspect of
efficiency is rarely analysed in studies conducted in the context of the EAC.
Efficiency of companies has been argued as a lens to attract significant capital
investment from financial institutions and foreign investors.
1.5.2 To Policymakers
This study will serve as a vehicle to the authorities of East Africa Community,
particularly the governments and capital markets authorities to assess the
effectiveness of corporate governance practices towards economic growth and
developments of the partner states.
The majority shareholders pursue private benefit of control by diverting
company assets at the expense of the minority shareholders. Currently, there is
an extensive recognition for protection of minority shareholders because they
play potential role on the value creation and company performance (Sanjai
Bhagat & Bolton, 2008; Black, Jang, & Kim, 2006a). Also, minority investors
play the great role towards capital markets development and enhance the
growth of the economy (La Porta et al., 1997; Levine, 1999).
The extent of expropriation by majority shareholders can be established and
because of the importance for minority investors, policymakers will be
advised to alternative measures necessary for protecting minority shareholders
rights. Building business regulatory enhances the level of firms’ efficiency and
provides the possibility of enforcing the ownership structure diversification.

26
The enforcement of ownership structure welcomes the foreign ownership
among the listed companies.
Moreover, the results of this study will alert policy makers among the partner
states of the EAC to weigh the initiatives for adopting the strategy that was
introduced in Malaysia known as Minority Shareholder Watchdogs Group
(MSWG). The MSWG activism was introduced in Malaysia in 2000 and since
its establishment, it has demonstrated success (Ameer & Rahman, 2009). The
MSWG is the whistle blowers for minority shareholders who collect their
queries and table them to the company management for suitable clarification
during annual general meetings.
The World Bank through Doing Business has reported that the failure to
undertake meticulous measures may cause companies to become vulnerable to
severity by hindering potential investors to engage in companies activities and
capital market developments henceforth deters corporate performance and
economic growth of the region (Chakra & Kaddoura, 2015).
1.6 Organisation of the Thesis
Chapter one has introduced about the EAC aspirations and highlighted on the
consequences for the laxity to enforce proper conduct of corporate governance
practices. Problem statements, research questions and objectives of this study
were introduced. Furthermore, the significances of this study for academics
and policy makers were outlined. The remaining chapters of this thesis are
27
organised as follows. Chapter two of the study reviews theoretical
perspectives of corporate governance, the ownership structure, corporate
performance, DEA technique and relevant empirical past studies. Chapter
three draws the discussion of the methodology of the study, data source and
type of data. Econometric estimations for panel unit root tests and the panel
cointegration tests analysis are developed. Data envelopment analysis (DEA)
techniques for measuring technical efficiency are extensively discussed.
Chapter four discusses the empirical findings of this study while chapter five
draws the conclusion and provides the policy recommendations.

28
CHAPTER 2
LITERATURE REVIEW
2.1 Introduction
This chapter provides the theoretical framework of corporate governance by
reviewing various theories and relevant empirical studies on ownership
structure of corporate governance and the impacts of ownership structure on
corporate performance. For the ownership and firm performance relationships,
this chapter expands a discussion on efficiency of firm performance based on
DEA technique.
2.2 Overview of Relevant Past Studies
2.2.1 Definitions of Terms
2.2.1.1 Corporation
The terms corporation/company/firm have been used interchangeably to
symbolise a legal entity that is characterised by separation of ownership and
control. A firm is entirely owned by shareholders who hire managers to run
business operations. Shareholders are referred to as principals while managers
are referred to as agents. The relationship between principals and agents is the

29
principal-agent relationship known as agency theory. Agency costs emanate
from the agency problems between interests of principals and agents (Berle &
Means, 1933; Jensen, 1986; Jensen & Meckling, 1976; La Porta, Lopez-De-
Silanes, Shleifer, & Vishny, 2000; Shleifer & Vishny, 1997; Young, Peng &
Bruton, 2002).
2.2.1.2 Corporate Governance
This study is guided by the definition offered by Fulgence (2014b); Idowu and
Çaliyurt (2014); Lovell (2005); OECD (2003). The literature defines corporate
governance as a mechanism through which a business is controlled and
directed in the best manner to achieve the predetermined goal of shareholders’
wealth maximization. Thus, managers are accountable to directors who are
accountable to shareholders. The main objective is to align the conflicts of
interest and to fully utilise corporate resources towards effective firm
performance (OECD, 2009).
2.2.1.3 Controlling Shareholders
According to OICU-IOSCO (2009), a service of OECD, the definition of
controlling shareholder differs across jurisdictions. However, controlling
shareholders have been generalised to mean any shareholder or entity who
owns more than specific threshold of shares say above thirty, forty, fifty per
cent of voting share. Controlling shareholders are regarded as a largest
shareholder (block holder) and have influencing power over the corporate
30
management and decisions. Thus, the concentrated ownership implies that
many firm shares are in the hands of few shareholders (Shleifer & Vishny,
1986, 1997).
2.2.1.4 Minority Shareholders
Accordingly, the term minority shareholders can be described according to the
specific context. Thus, the OICU-IOSCO (2009) describes minority
shareholders to imply those shareholders who hardly make decisions over
corporate affairs. In turn, these shareholders should seek protection over
decision pertaining firm operations (La Porta et al., 2000a; OECD, 2004).
2.2.2 Theories of Corporate Governance
There are several theoretical perspectives regarding corporate governance. The
most common theories include agency theory, stewardship theory,
stakeholders’ theory and resource dependency theory. These theories have
originated from different backgrounds including finance, economics,
management, organisational theory, ethics and politics (Nicholson & Kiel,
2007; Rwegasira, 2000). Therefore, these four acknowledged theories are
briefly described in the following sub-sections.

31
2.2.2.1 The Agency Theory or Finance Model of Corporate Governance
The agency theory originates from economics and finance. This theory
describes the existing relationship between principals and agents within a
corporation. This relationship is built on the basis of separation between
ownership and control where principals who are the owners of the company
hire agents to control the operations of the business. The main objective for
any firm is for agents to work on behalf of principals for wealth maximisation.
It is worth to note that, agency costs could arise in case of the agency
problems (Fama & Jensen, 1983; Jensen & Meckling, 1976; Scott, 1998).
Jensen and Meckling (1976) pointed out that the agency theory is a theory
about ownership structure of the firm. The theory implies existence of interest
divergence between principals and agents and this is the main reason for the
positions of Chairperson and CEO to be held by two different individuals.
However, this theory focuses on accountability. The theory argues that it is not
possible for one group of persons to be cautiously handle money of other
people (Jensen & Meckling, 1976). Moreover, Scott (2003); Yermack (1996)
opined that separating positions of the CEO and Chairperson promotes level of
efficiency. Furthermore, outside independent directors are urged to engineer
corporate efficiency (Fich, 2005; Jensen & Meckling, 1976).

32
2.2.2.2 The Stewardship Theory of Corporate Governance
Contrary to agency theory, the stewardship theory has its roots in sociology
and psychology. The theory is based on the interests’ convergence between
principals and stewards through intrinsic motivation on achievement and self-
actualization. The stewardship theory was developed by Donaldson and Davis
(1991, 1993) whereby steward identify more utility through supportive and
pro-organisational manners than using the self-serving manners. According to
stewardship theory, the steward’s satisfaction and motivation is related to the
organisation success.
Premised on the trust between shareholders and stewards, one person holds the
positions of the Chairperson and CEO (Donaldson & Davis, 1991). The reason
for one person to hold both positions is to build centralised focus and strong
leadership from a single person to accomplish company goals (Aduda, Chogii,
& Magutu, 2013). Therefore, the theory claims that superior performance is
linked with inside directors (Donaldson & Davis, 1991, 1993). However, the
Cadbury report of 1992 plainly clarified the importance for the positions of
CEO and Chairperson to be held by two persons. Thus, untying persons who
hold positions of CEO and Chairperson stimulates corporate efficiency.
Moreover, the empirical study by Kyereboah-Coleman (2008) to selected
African countries established a significant negative effect on firm performance
whenever the positions of CEO and chairperson are held by one person.

33
2.2.2.3 The Stakeholder Theory of Corporate Governance
The stakeholder theory was developed by Freeman (1984). The theory
emanates from the view that business operations can be affected by different
individuals. Thus, the stakeholders theory takes at wide scope by including
different individuals (Aduda et al., 2013). These individuals include but not
limited to management, investors, governmental bodies, employees, political
groups, trade unions, customers, suppliers, competitors and the community
(Freeman, 1984; Scott, 2003).
The stakeholder theory claims that a business is likely to be successful if it can
create value to all stakeholders (Freeman, 1984). Thus, the theory advocates
the need for many objectives to satisfy all stakeholders. This theory has its
roots from the sociology and organisational behaviour which is based on
serving many masters at the same time (Gillan, 2006).
2.2.2.4 The Resource Dependency Theory of Corporate Governance
The resource dependency theory (RDT) was developed by Pfeffer and
Salancik (1978). This theory describes a corporation as an open system of
unforeseen events that come from external environment. Contrary to
stakeholders’ theory which involves a group of all parties affected by the
corporation, the RDT focuses on how directors of the companies can acquire
resources required by the company. The RDT asserts that to understand the
behaviour of an organization, one should study its ecology based on

34
environment science (Crook, Ketchen, Combs, & Todd, 2008; Hillman &
Dalziel, 2003; Pfeffer & Salancik, 1978).
Pfeffer and Salancik (1978) opined that the possibility for external
environment to promote corporate performance, board of directors are
required to exploit available external resources. Other scholars, Douma,
George, and Kabir (2006) have commented that in emerging economies the
RDT ranges to availability of competitive advantage to performance
advantages; the competitive advantages include the use of tangible and
intangible assets to boost corporate performance.
2.2.3 The Model for this Study
The agency theory advocates that the principal-agent relationship roots from
the separation of ownership and control that is branded with divergence of
interests. Based on trustworthy, the stewardship theory is characterised by
convergence of interests and there are no related agency costs. While the
stakeholder theory is overwhelmed by successfulness for each individual, the
RDT argues that success of corporations is enhanced through exploiting the
external environment.
Several studies on corporate governance advocate the use of agency theory to
describe ownership and performance relations. However, the agency theory
should not be generalised to be valid to all economies because in developing
economies including the EAC, the diversity of the relationship between

35
ownership and firm performance have awful intuition which is engineered by
weak legal environment and absence of market for corporate control (La Porta
et al., 1999, 1997, 2000a; Mak & Kusnadi, 2005; Melyoki, 2005; Rwegasira,
2000; Wright et al., 2005). Similarly, Rwegasira (2000); Young, Peng,
Ahlstrom, Bruton, and Jiang (2008); Young et al. (2002) have pointed out that
the agency theory by itself provides partial vision and inconclusive analysis
for developing economies including the partner states of EAC where stock
markets are still low in absorption capacity.
Because of such limitations in using one theory, Rwegasira (2000) emphasised
the need for African countries to use a model that incorporates inputs from
different models necessary to afford internationally aggressive capital markets
for economic growth and development. Thus, this study incorporates the
resource dependency theory and the agency theory for potential benefits that
can be realised from different types of ownership.
The two theories are deemed appropriate for this study because as the RDT
emphasises on incorporation of foreign ownership to diversify ownership
structure because of the use of external resource that enhances efficiency of
corporate performance (Dalziel, White, & Arthurs, 2011; Douma et al., 2006;
Durnev & Kim, 2005; Hillman & Dalziel, 2003; Nicholson & Kiel, 2007), the
agency theory emphasises on effective monitoring and controlling of company
affairs through effective boards of directors where majority are independent.
Thus, the agency theory requires the position of Chairperson and the CEO to
be held by two different persons to widening transparency and accountability.

36
Lack of transparency among African countries including partner states of EAC
has been a problem for effective corporate governance practices (Eyster, 2014;
Rwegasira, 2000; Schwab, 2014).
The diversity for ownership structure implies accommodating different types
of ownership within the company. According to resource dependency theory,
foreign ownership promotes monitoring and disciplinary role for standard
corporate governance practices. Thus, the outcomes for monitoring and
disciplinary roles is creations of the multiplier effect to the minority
shareholders (Crook et al., 2008; Douma et al., 2006; Filatotchev et al., 2003;
Hillman & Dalziel, 2003; Young et al., 2008). Therefore, the agency theory
and resource dependency theory are integrated in this study as suitable tools
for investigating the efficacy of corporate performance.
Figure 2.1 presents the theoretical framework for this study. It is worth to note
that the framework demonstrates independent and control variables to
influence dependent variable. Moreover, the Figure offers information on the
ability of efficient business environments that are decorated by quality
institutions to excite foreign ownership towards superior performance and
henceforth protection of minority of shareholders.

37
Fig. 2.1: Theoretical Framework
2.3 Agency Theory and Resource Dependency Theory
2.3.1 Agency Theory and Ownership structure
As point out earlier, the agency theory has its philosophy rooted in the
relationship between shareholders who are principals and managers who are
agents; principal-agent relationship. This relationship is created by separation
of ownership and control whereby principals hire and entrust agents for
running the business. The main objective is to maximise the shareholder’s
wealth (Jensen & Meckling, 1976). The corporate governance model by
Ownership structure:
Corporate performance:
Tobin’s Q
ROA
ROE
Firm size
Leverage
Investment
Growth opportunity
Independent variables Dependent variables
Control variables
Efficiency
Ownership concentration
Foreign ownership

38
Jensen and Meckling (1976) is the central model to explain the agency theory
and ownership structure because it demonstrates the fundamental conflict of
interest that occurs in an organisation. Figure 2.2 summarises the relationship
between principals and agents as separation of ownership and control.
Agency problems are the consequences of the conflict when agents or
controlling shareholders take actions that are contrary to preferences of either
the company or minority investors or both. Conflict of interests arise when
managers undertake non profitable investment including undertaking negative
NPV projects and diverting company resources (Djankov, La Porta, Lopez-de-
Silanes, & Shleifer, 2008; Fama & Jensen, 1983; Hermalin, 2005; Holmstrom
& Kaplan, 2001; Jensen & Meckling, 1976; Shleifer & Vishny, 1997).
Building on the knowledge from Berle and Means (1933) that focuses on the
dispersed ownership, Jensen and Meckling (1976) intended to model the
PRINCIPALS
Shareholders
AGENTS
Managers and Directors On behalf of
TASK
E.g. managing the company
To
Employs Accountable
Figure 2.2: Relationship between Principals and Agents

39
relationship between managers and principals. The agency costs associated by
this relationship include but not limited to monitoring expenditures by
shareholders, bonding expenditure by managers and the residual loss.
2.3.2 Agency Theory and Corporate Performance
Performance of the company is affected by internal and external mechanisms
of corporate governance. Efficient corporate governance mechanisms are
reflected on how they influence corporate performance. According to
Vermeulen (2013), two kinds of agency problems can be distinguished namely
vertical and horizontal problems (Dalziel et al., 2011; Young et al., 2008).
Vertical problems are the traditional conflict of interests between principals
and agents; the principal-agency problems. This kind of conflict is common in
developed economies, even though, the internal and external mechanisms of
corporate governance are effective and are vehicles towards resolving
conflicts. Internal mechanisms include bonding contracts, performance based
incentives, ownership structure and monitoring mechanism whereas external
mechanisms include legal and regulatory framework, market for corporate
control and takeovers (Dalziel et al., 2011; Young et al., 2008). The enforced
legal and regulations in developed economies enhance the board of directors
to work effectively (Demsetz & Lehn, 1985; Jensen & Meckling, 1976;
Melyoki, 2005; Young et al., 2008). Moreover, the markets for corporate
control inculcate managers with discipline against hostile takeover which in

40
turn enhance efficiency corporate performance. Berle and Means (1933)
argued that performance and dispersed ownership are inversely related.
Jensen and Ruback (1983) argued that market for corporate control in
developed economies can be noted based on stable share price, high market
capitalisation and when many companies aspiring to be listed at security
exchanges (Mayer, 2002). Market for corporate control plays significant role
of frightening to replace inefficient managements (Gillan, 2006). Thus, the
takeover being a rule for market control provides the means for curbing the
agency costs because performance decides the stake of management
(Grossman & Hart, 1980).
The horizontal agency problem is a result of conflict of interests between
majority and minority shareholders known as principal-principal problems
(Morck, Wolfenzon, & Yeung, 2005; Young et al., 2008). This kind of conflict
is mostly common in developing economies including EAC where companies
are characterised by concentrated ownership (Dharwadkar, George, &
Brandes, 2000; Melyoki, 2005). Regions with ownership concentration are
attached with extensive expropriation, weak legal and regulatory framework,
fewer listed companies, small and medium-sized companies, low dividend
pay-out (Sáez & Gutiérrez, 2015), fewer investments in innovation,
macroeconomic variables fluctuations and lack of markets for corporate
control (Filatotchev et al., 2003; La Porta et al., 1999, 2000a; Morck et al.,
2005; Rwegasira, 2000; Wright et al., 2005; Xu & Meyer, 2012; Young et al.,
2008).

41
The pervasiveness ownership concentration creates fear for minority investors
to make investment decisions (La Porta et al., 2000a). Thus, Sáez and
Gutiérrez (2015) noted that majority shareholders may decide to use dividend
policy to exploit minority investors. Berle and Means (1933) pointed out that
concentrated ownership creates concentrated monitoring necessarily for
superior performance. However, Young et al. (2008) argued that superior
performance is achieved where legal and regulations are highly enforced. In
the contrary, Rwegasira (2000) has pointed out that countries in emerging
economies including partner states of EAC are laxity to enforce legal and
regulatory outlines, as a result firms lag behind and have steadily poor
performance.
Whereas in developed economies concentrated ownership is promoted in order
to remedy principal-agent problem, in developing economies the concentrated
ownership has continued to be the main source for principal-principal
problems (Faccio, Lang, & Young, 2001; Grossman & Hart, 1980). The
concentrated ownership creates incentive for controlling shareholders to be
affiliated with managers for the expropriation of the company assets at the
expense of minority shareholders (Shleifer & Vishny, 1986, 1997). Similarly,
Backman (1999, 2004) added that there are numerous reasons that attract
expropriation by majority shareholders including but not limited to political or
personal ambitions.

42
2.3.3 Resource Dependency Theory and Corporate Performance
Numerous studies on corporate governance advocate the use of agency theory
to study the relationship between ownership and firm performance. However,
the view of agency theory cannot be generalised to be valid in developing
countries including EAC. This argument comes from the notion that
companies in EAC are dominated by weak corporate governance practices
which hinder diversity of the ownership-performance relations. It is worth to
note that, as pointed out earlier, the agency theory provides partial vision and
inconclusive analysis for developing economies where stock markets are
underdeveloped and are inefficient (Eisenhardt, 1989; Young et al., 2008,
2002).
The RDT was developed by Pfeffer and Salancik (1978) with the viewing that
a company is an open system that can be enhanced by contingencies from
external environments. These external environments provide competitive
advantages in form of tangibles and intangibles for corporate survival and
expansion. The RDT argues that the board of directors can play significant
role towards acquiring the potential resources from outside for empowering
company performance. These potential resources include information, access
to finance, players in the market place and connection to firm’s competitors
(Barney, Wright, & Ketchen, 2001; Hillman & Dalziel, 2003).
Extant studies acknowledge the importance of board of directors to bring
special treatment to the company because of their expertise and skills they

43
occupy. Thus, Booth and Deli (1999); Güner, Malmendier, and Tate (2008);
Kroszner and Strahan (2001) support that the presence of the investment
bankers to the boards is attached by their expertise to securing outside
financing. Therefore, the pivotal role of the RDT dwells on the idea that the
survival and growth of the company depends on how the board is related with
other companies that regulate the external resources that are required by the
company (Hillman, Withers, & Collins, 2009). This is because the alliance
with the provider of external resources reduces uncertainties by providing
resources needed by the company (Hillman, Cannella, & Paetzold, 2000;
Simmons, 2012).
Moreover, Hillman et al. (2000) pointed on the important roles played by the
board of directors to explore and bring external resources for survival and
growth of the company; the resources which are important for the company
include the financial capital, information expert market players and
legitimacy. Thus, the board is tasked to secure the needed sources of finance
to capacitate the company’s financing liquidity and the needy knowledgeable
market players who are equipped with market information.
By integrating the agency theory and RDT, ingredients of RDT would
stimulate the agency theory through the shareholders’ heterogeneity (Dalton,
Daily, Certo, & Roengpitya, 2003; Douma et al., 2006). In addition, the
diversity of the ownership structure are empirically justified for mitigating the
horizontal problems (Colombo, Croce, & Murtinu, 2014; Dalton et al., 2003).

44
Empirical studies by Crook, Ketchen, Combs, and Todd (2008); Dalton, Daily,
Certo, and Roengpitya (2003) opined that potential advantages accompanied
by different types of ownership include monitoring facility, human capital
(Keong, 2007) and provision of financial resources. moreover, Douma,
George, and Kabir (2006) commented that the company achieves competitive
advantages through acquiring intangible and tangible assets and that the
protection of minority shareholders in developing economies can be achieved
by including different types of ownership. This is to say that the authors are
trying to put much emphasis on heterogeneity among shareholders, either
foreign or domestic and strategic or financial resources, and more importantly
on foreign investors who have more competitive advantage attached by
benchmarking of good governance.
In general, the RDT plays potential role by underlining advantages attributed
to external sources for efficient corporate performance. These advantages can
be summarised to include human capital in terms of expertise, experience,
knowledge, reputation and skills (Hillman & Dalziel, 2003), transfer of
technology and capital flow (Barney, 2001; Barney et al., 2001; Nicholson &
Kiel, 2007; Wright et al., 2005). Therefore, better firm performance is
expected by incorporating these ingredients. Dalton et al. (2003) have added
that ownership diversification has strong impact on firm performance
especially companies with foreign investors that are based on legitimacy
principles (Mudambi & Pedersen, 2007).
45
2.4 The Internal and External Mechanisms of Corporate Governance
Since there is an extant literature that document the overwhelming status of
poor protection of minority investors in Sub-Saharan Africa including the East
African countries because of weak legal and regulatory frameworks and the
absence of market for corporate control, the aggregation of external
mechanism and internal mechanism is pivotal for effective corporate
governance. The external and the internal mechanisms of corporate
governance are responsible for protecting all shareholders including the
minority shareholders. The main objective of any company should be to
maximise shareholders’ wealth whereby interests of majority and minority
investors become aligned (Cremers & Nair, 2005; Huyghebaert & Wang,
2012; Munisi et al., 2014).
The external mechanism of corporate governance accounts for the legal and
regulatory environments which in turn influences the market for corporate
control and the takeovers. The concentrated ownership in EAC is an outcome
of the failed external mechanism. The failure of external mechanism occurs
whenever the concentrated ownership engage into expropriation of company
assets at expense of minority shareholders (Jiang & Peng, 2011; La Porta et
al., 2000a; Morck et al., 2005; Young et al., 2008).
However, the internal mechanism of corporate governance consist of
ownership structure, the board of directors, financial transparency, consistency
informational disclosure and performance incentives (Cremers & Nair, 2005;

46
Denis, 2001; Dyck, 2001; Hart, 1995; Jiang & Peng, 2011; La Porta et al.,
2002; Melyoki, 2005; Munisi et al., 2014; Peng & Jiang, 2010; Young et al.,
2008). Thus, internal mechanism of corporate governance works as alternative
mechanism following the failure of legal, regulatory and capital markets.
The functioning external and internal mechanisms of corporate governance
promote corporate performance and protection of minority investors. The
emerging economies including EAC are crowded by underdeveloped capital
markets, lack of market for corporate control and laxity to enforce legal and
regulatory frameworks. The outcomes of these obstacles entail weak corporate
governance that ruins corporate performance and jeopardise the protection of
minority shareholders (Dalziel et al., 2011; Jiang & Peng, 2011).
Thus, this study is based on the internal mechanism of corporate governance
because proper ownership structure enhances corporate performance and helps
to mitigate agency problems. The adoption of ownership structure is important
for exploring diversified skills. The proper ownership structure provides
protection of the company properties including interest convergence for all
stakeholders. Moreover, the diversified shareholders provide monitoring and
controlling tool towards actions of the majority shareholder (Huyghebaert &
Wang, 2012; Jiang & Peng, 2011).

47
2.5 Overview of Ownership Structure and Corporate Performance
Ownership structure has been cited as among the factors that determine
corporate performance ownership (Shleifer & Vishny, 1986). There are
different types of ownership that determine corporate performance but in this
study ownership is limited to concentrated and foreign ownership.
2.5.1 Ownership Concentration and Corporate Performance
Ownership concentration refers to a situation in which large percentage of
company’s shares are in hands of few shareholders. Shareholders who own
few shares in a corporation are referred to as minority shareholders. It is
argued that the ownership concentrated should imply overly monitoring which
constitute strong firm performance because companies of this nature are not
expected to invest into non-profitable investments and non-related mergers or
takeovers (Amihud & Lez, 1981; Berle & Means, 1933; Stijn Claessens &
Djankov, 1999).
Thus, the accumulated concentrated monitoring implies superior performance
and convergence of interests of all stakeholders. Grossman and Hart (1986)
insisted that because of high stake employed into the company, majority
shareholders will work entirely in order to enjoy the benefits of monitoring
and controlling endeavours. The agency theory considers the concentrated
ownership as mitigating vehicle of the agency problems which accelerates
firm performance (Jensen & Meckling, 1976).
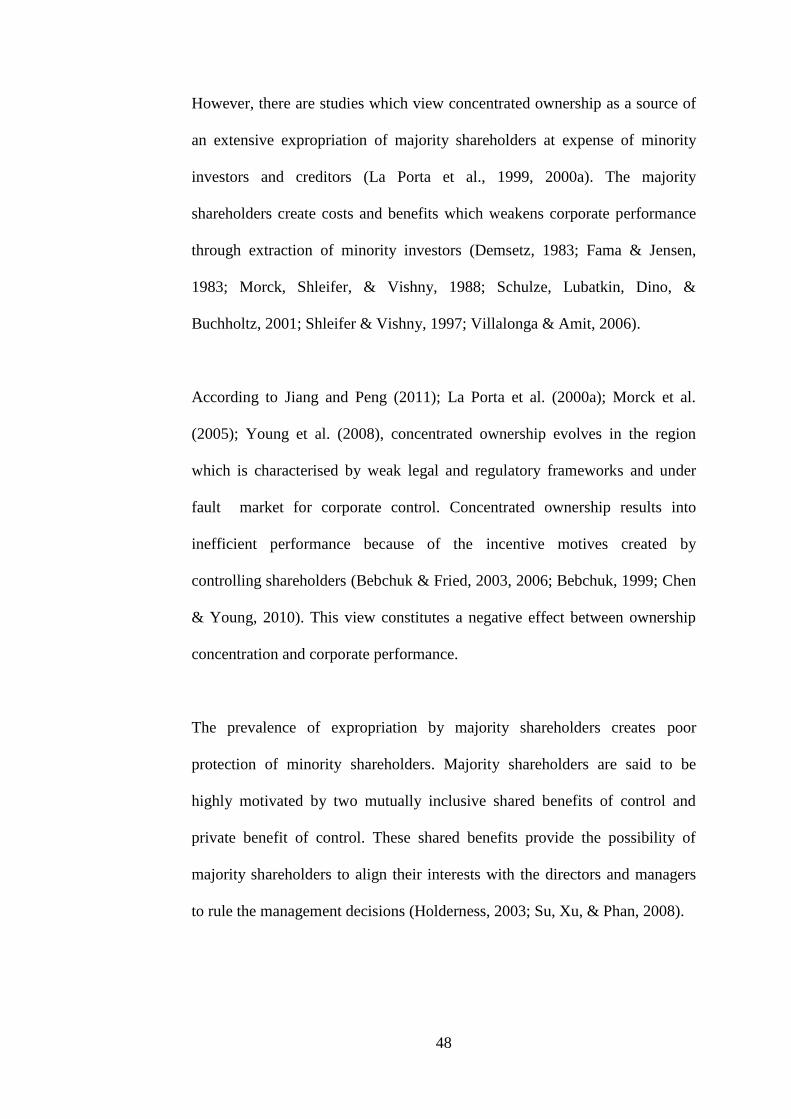
48
However, there are studies which view concentrated ownership as a source of
an extensive expropriation of majority shareholders at expense of minority
investors and creditors (La Porta et al., 1999, 2000a). The majority
shareholders create costs and benefits which weakens corporate performance
through extraction of minority investors (Demsetz, 1983; Fama & Jensen,
1983; Morck, Shleifer, & Vishny, 1988; Schulze, Lubatkin, Dino, &
Buchholtz, 2001; Shleifer & Vishny, 1997; Villalonga & Amit, 2006).
According to Jiang and Peng (2011); La Porta et al. (2000a); Morck et al.
(2005); Young et al. (2008), concentrated ownership evolves in the region
which is characterised by weak legal and regulatory frameworks and under
fault market for corporate control. Concentrated ownership results into
inefficient performance because of the incentive motives created by
controlling shareholders (Bebchuk & Fried, 2003, 2006; Bebchuk, 1999; Chen
& Young, 2010). This view constitutes a negative effect between ownership
concentration and corporate performance.
The prevalence of expropriation by majority shareholders creates poor
protection of minority shareholders. Majority shareholders are said to be
highly motivated by two mutually inclusive shared benefits of control and
private benefit of control. These shared benefits provide the possibility of
majority shareholders to align their interests with the directors and managers
to rule the management decisions (Holderness, 2003; Su, Xu, & Phan, 2008).

49
2.5.2 Foreign Ownership and Corporate Performance
Foreign ownership refers to the proportion of shares that are owned by foreign
investors in a host country (Choi, Lee, & Williams, 2011). Chari, Chen, and
Dominguez (2012); Lee (2008) pointed out that foreign ownership can be
measured by the proportion of shares held by foreign investors.
Among the important issues discussed by academicians and policy makers has
been the impact of foreign ownership to local firms. Host countries normally
attract foreign ownership by providing special attachments including firm
specific compensations which are made not available to domestic firms. Thus,
the special attachment available to foreign ownerships should result into
superior performance (Caves, 2007; Görg & Strobl, 2004) because foreign
ownership is attached with superior monitoring, management techniques, and
technological transfer that are uncommon to local firms. Thus, domestic
companies have the possibility to benefit from the spill over effect and
advanced productivity of foreign ownership (Kinda, 2012). In this line, Dalton
et al. (2003) argued that there are specified significant advantages that can be
created from heterogeneous ownership that include unique and singular
resources which can create competitive advantage for firms.
The RDT claim that the presence of foreign investors in domestic firms play a
monitoring role including standard corporate governance practices thereby
reducing the possibility of controlling shareholders to exploit firm’s assets at
expense of minority investors (Bjuggren, Eklund, & Wiberg, 2007; S. Lee,

50
2008). As mentioned earlier, the foreign ownership in developing countries
have competitive advantage accompanied by superior managerial techniques,
technology, easy access to external finances, and increase competition with
domestic companies (Mueller & Peev, 2005; Vincent Okoth Ongore, 2011).
For instance, Ongore (2011) cited that the presence of foreign ownership in
Kenya promoted superior management to some of listed companies.
Similarly, Pervan, Pervan, and Todoric (2012) pointed out that domestic
companies in Croatia which composed foreign ownership had superior
performance than companies which had no composition of foreign ownership.
This is to say that foreign controlled firms have better performance than
domestic controlled firms. However, foreign investors should not be solely
considered as cure for problems facing developing economies (Chari et al.,
2012b; Kim, 2010), rather both domestic and foreign ownership should be
seen to have positive effect to one another (Chari et al., 2012).
2.6 Foreign Ownership and Technical Efficiency
2.6.1 Introduction
The textbooks in classical microeconomics assume that companies have
similar characteristics. This presumption of homogeneity claims that
companies operate at the same level of productivity. Thus, the available
resources are required to ensure that maximum output is achieved
(Badunenko, Fritsch, & Stephan, 2006; Battese & Coelli, 1992). However,

51
companies in developing economies including the partner states of EAC
operate under less competitive environment because capital markets are less
developed (Rwegasira, 2000). As a result, level of productivity among partner
states tends to fluctuate overtime. This makes firms to be heterogeneous.
Some literature highlight that aspects such as technical, allocative, scale and
cost efficiencies are available for measuring the efficiency of the firm (Coelli,
Rao, O’Donnell, & Battese, 2005; Farrell, 1957; Oberholzer, 2014). However,
with vast measures highlighted above this study employs the technical
efficiency. The technical efficiency is employed because is superior in
assessing the ability of a corporate to convert inputs like labour and capital
into optimal output (Coelli et al., 2005). Moreover, the technical efficiency is
the only measure which is regarded as managerial efficiency because it assures
the management with the power to exhibit direct control (Isik & Hassan,
2003).
2.6.2 Firm Technical Efficiency
The concept of technical efficiency was initially introduced by Farrell (1957).
The idea behind technical efficiency is that, companies employ resources like
labour, capital and technology to achieve optimal output. This phenomenon
emanates from the fact that firms can estimate required inputs to maximise
outputs. Thus, technical efficiency comprises input-oriented and output-
oriented (Coelli et al., 2005; Coelli, Rahman, & Thirtle, 2005; Farrell, 1957).

52
Two predominant techniques are available for measuring firms’ technical
efficiency namely, the parametric and non-parametric measures. On one hand,
the parametric measures are based on the Stochastic Frontier Analysis (SFA)
and on the other hand, the non-parametric measures are based on the Data
Envelopment Analysis (DEA). The DEA technique involves the use of linear
programming whereas the SFA technique involves the use of the functional
form (Berger & Humphrey, 1997; Coelli et al., 2005; Zheka, 2005).
Studies in corporate governance analyse firms’ efficiency based on the DEA
technique. The use of DEA has an advantage since it allows for multiple
inputs and outputs and does not require presumption of functional form of the
frontier (Nedelea and Fannin, 2013; Ramanathan, 2003; Ray, 2004). Also it
has been claimed that DEA has an ability to work with small sample size. This
makes it friendly when employing the Generalised Moment of Methods. In
general, the DEA technique uses Linear programming to convert multiple
inputs and outputs into efficiency scores (Madhanagopal & Chandrasekaran,
2014; Titko, Stankevičienė, & Lāce, 2014; Zheka, 2005).
DEA has an ability to provide multi-information details for all Decision
Making Units (DMU). The more attractive information to publicly listed
companies in EAC is that DEA can describe DMUs in their efficient or
inefficient form and acts as a device for converting inefficient firms into
efficient (Berger & Humphrey, 1997).

53
DEA technique can be estimated using either the Constant Return to Scale
(CRS) or the Variable Return to Scale (VRS) models. The CRS model was
developed by Charnes, Cooper, and Rhodes (1978) whereas the VRS was
developed by Banker, Charnes, and Cooper (1984). The CRS and VRS models
are classified as radial models because they aim at obtaining utmost rate of
reduction of inputs to achieve certain level of outputs (Avkiran, Tone, &
Tsutsui, 2006; Fazli & Agheshlouei, 2009; Sueyoshi & Goto, 2012).
It is worth to note that, DEA models have another form referred to as slack
based measures (SBM) which are not discussed here but they are classified as
non-radial models (Avkiran et al., 2006; Fazli & Agheshlouei, 2009; Tone,
2001). This study is based on the radial model for reasons explained in the
proceeding paragraphs.
There are two orientations of inputs or outputs that are employed whenever
estimating efficiency scores based on CRS or VRS models. Whereas the input
oriented involves minimising inputs for the same level of outputs, the output
oriented involves maximising the output for the same level of inputs (Coelli et
al., 2005; Cooper, Seiford, & Tone, 2007; Cooper, Seiford, & Zhu, 2011). It is
important to note that, the CRS model will always generate similar scores on
either orientation but the VRS model will generate different scores (T. J.
Coelli et al., 2005; Dwivedi & Ghosh, 2014; Fare & Lovell, 1978).
Experts of DEA technique argue that CRS model is superior whenever applied
to the DMUs that operate at an optimal scale but when DMUs are not at an

54
optimal scale it is better to use VRS model. Factors such as imperfect capital
markets, technology, finance constrains and unenforced government
regulations trigger the use of VRS (Avkiran, 2006; Coelli et al., 2005; Cooper,
Seiford, & Tone, 2006; Ramanathan, 2003; Ray, 2004).
This study employs the VRS model to estimate the efficiency scores of public
listed companies in EAC. This is justified by the problems facing capital
markets in EAC which are similar to majority of developing economies in
terms of low market capitalization, fewer listed firms, imperfect capital
markets, limitations on finance and unenforced regulations (Banker &
Maindiratta, 1988; Dhanani, 2005; Glen, Karmokolias, Miller, & Shah, 1995;
Kibuthu & Osano, 2010; Kurniasih, Siregar, Sembel, & Achsani, 2011; Singh,
2003; Yabara, 2012).
2.6.3 Relationship between Foreign Ownership and Efficiency
In corporate governance perspectives, foreign ownership helps to facilitate and
enhance corporate performance (Delis & Papanikolaou, 2009). Foreign
ownership is explained by RDT to have significant positive impact on
efficiency firm performance. Thus, foreign ownership being an aspect for firm
efficiency is associated with aligning horizontal problems (Zheka, 2005).
Foreign ownership is rich in resources of foreign shareholders who are capable
of utilising business environment to enhance the level of firm efficiencies. The
presence of foreign equity in host countries has significant effect on corporate

55
performance. It is not guaranteed that firms with foreign investors will always
perform better than locally owned firms. However, companies which have
more foreign ownership significantly perform better and thus the level of
firm’s efficiency increases. This level of efficiency is contributed by easy
access to financing, training courses given to workers, technological transfer,
management know-how, employing and maintaining quality labour and access
to international market (Chen, Lin, Lin, & Hsiao, 2016; Choi et al., 2011).
Moreover, foreign ownership helps locally owned firms to intensify the R&D
activities that helps to utilise resources in technological development and
enhances corporate performance (Choi et al., 2011). Companies that have
significant number of foreign ownership have relative advantage of
managerial and technological resources. Thus, these firms utilise their scarce
resources efficiently (Zhu, Xia, & Makino, 2015) and under the enforced
institutional quality, the transaction costs become lower (Barasa et al., 2017;
Meyer, Estrin, Bhaumik, & Peng, 2009). Firms that hold foreign investors are
capable of creating partnership with other companies to extend production and
exploit economies of scale through Mergers and Acquisitions (Chen, Lin, Lin,
& Hsiao, 2016; Delis & Papanikolaou, 2009; Zahra & George, 2002).
Extant literatures have examined the influence of foreign ownership on
company efficiency and the efficiency of domestic and foreign firms. Reasons
other than those stated above are that foreign equity is less subjective to
regulations than locally owned firms. Moreover, the institution quality or
condition set ups in the host countries have been cited to facilitate foreign

56
investors to excel level of efficiencies (Berger & Humphrey, 1997; Demirguc-
Kunt & Huizinga, 2000).
Foreign ownership has also been associated with higher wage payments
among Sub-Saharan Africa firms. For instance, study carried in Kenya
concluded that firms with foreign ownership pays an average wage of about 8
per cent to 23 per cent higher than wages paid by locally owned firms. This
wage difference has positive influence for work devotion among employees
towards firm efficiencies (Foster-McGregor, Isaksson, & Kaulich, 2015;
Strobl & Thornton, 2004; Velde & Morrissey, 2003).
In general, foreign ownerships have more average efficiency based on the
quality institutions and regulatory framework of the host country that facilitate
firm efficiency. This means that the efficiency of foreign ownership is
facilitated by friendly business legal environment while dubious business legal
environment devastates operations of foreign ownership (Mian, 2006).
The institutional framework or legal environment that provide favourable
sphere for workability of foreign ownership include but not limited to
regulatory quality, government effectiveness, and political stability
(Kaufmann, Kraay, & Mastruzzi, 2010). These legal frameworks are what
constitute the governance indicators. These indicators have been empirically
verified that they contribute towards firm efficiencies. For instance, Lensink,
Meesters, and Naaborg (2008); Mian (2006) asserted that good institution
frameworks in the host country nourishes the efficiency for foreign ownership.

57
Quality institutions do not only provide efficiency gear for foreign ownership
to excel in performance, they also provide mechanism for attracting FDI
inflows which in turn impact economic growth (Acemoglu et al., 2003; Bevan
et al., 2004; World Bank, 2016a).
Premised on the above benefits, DEA technique is used to measure firm
efficiency (Bozec, Dia, and Bozec, 2010) where foreign ownership is an
enforcement for companies to practice standard corporate governance (Dalton
et al., 2003; Kinda, 2012). Thus, it is the expectation of this study that the
interaction between firm efficiency and foreign ownership should create
superb corporate performance. Therefore, in order to capture for the
differential impact of foreign ownership on firm performance, efficiencies
should be interacted with foreign ownership (Bürker, Franco, & Minerva,
2013; Zheka, 2006).
2.7 Empirical Studies on Ownership Structure and Performance
2.7.1 Introduction
This section presents empirical studies conducted by different authors on the
relationship between ownership structures and corporate performance. Two
ownership structures; ownership concentration and foreign ownership have
been empirically studied because of their impact they bring on firm
performance. Thus, by reviewing the past relevant empirical studies this study
enriches the knowledge on the corporate governance and performance in EAC.

58
2.7.2 Empirical Studies
The relationship between ownership structure and firm performance has been
extensively studied. The vast of these studies have germinated from the work
of Demsetz (1983) who claimed that incentive towards varying ownership
structure lies on the shareholders’ worth maximization. Demsetz highlighted
that there are firm specific factors which influence firm performance other
than corporate governance variables.
Factors like management skills, company philosophy, past performance and
technological innovations impact firm performance. These factors are sources
of unobserved heterogeneity which create endogeneity problems and should
be controlled to avoid reporting spurious results. This means that valid
instruments need to be introduced in the model to reduce the likelihood of
reporting biased results (Sanjai Bhagat & Jefferis, 2002; Flannery & Hankins,
2013; Y. Hu & Izumida, 2008; Nguyen et al., 2015; Zhou et al., 2014).
According to Demsetz (1983), endogeneity is a situation whereby regressors
are correlated with residuals. This situation can occur if relevant variables are
omitted in the model especially when the variables if are correlated with one
of independent variables. Thus, omission of some variables in the model is
referred to as model specification (Greene, 2014). However, the omission of
some variables in the model does not happen without creating some problems
(Baltagi, 2005).

59
Moreover, the endogeneity problem is associated with the simultaneity.
Simultaneity occurs when firm performance influences ownership structure
and at the same time ownership structure influences firm performance. In this
situation, performance and ownership structure are arguably simultaneously
determined (Wintoki, Linck, & Netter, 2012; Wooldridge, 2002).
Furthermore, the endogeneity problem is caused by unobserved heterogeneity
which affects performance and regressors. The problem of unobserved
heterogeneity may cause a researcher to report spurious relations like reporting
a negative relationship instead of positive relationship. Finally, the outcome of
this effect leads into rejecting a true hypothesis (type I error) or rejecting the
false hypothesis (type II error) (Himmelberg, Hubbard, & Palia, 1999; Klapper
& Love, 2004b; Wintoki et al., 2012).
The concept of endogeneity problem was introduced by Demsetz (1983). The
author intended to alert scholars on the likelihood of reporting biased results.
With the Demsetz’s idea in mind, it was expected that subsequent studies
would examine the impact of endogeneity. There are few subsequent studies
that have examined the endogenous problems.
The study by Demsetz and Lehn (1985) was among the first ones to
empirically examine the relationship between concentrated ownership and
corporate performance. Demsetz and Lehn intended to examine the earlier
prediction by Berle and Means (1933) that ownership concentrated and
performance have positively relationship. Demsetz and Lehn employed the

60
cross - sectional data of 511 U.S firms over 1976-1980. The ownership
concentration was categorised as 5, 20 largest owners and Herfindahl index
and performance was measured using accounting ratio. The study concluded
that there is no significant ownership concentration and performance relation.
Another study by Demsetz and Villalonga (2001) employed 223 cross-
sectional data of U.S firms over 1976-1980. After controlling endogeneity, the
study reported no statistical significant ownership structure and performance
relations. Whereas, the study by Omran et al. (2008) on a sample of 304 firms
from four Arab countries namely Egypt, Jordan, Oman and Tunisia reported
no significant ownership concentration and market value relations after
controlling endogeneity using country and firm effects as instrumental
variables on 2SLS. Similar, conclusions of no significance relationship were
reported (Demsetz & Villalonga, 2001; Holderness & Sheehan, 1988; Luo et
al., 2012; Murali & Welch, 1989; Omran et al., 2008; Tsegba & Ezi-Herbert,
2011).
McConnell and Servaes (1990); Morck et al. (1988); Short and Keasey (1999)
carried their studies by treating ownership structure as exogenously
determined and reported nonlinear relationship between ownership structure
and firm performance. Morck et al. (1988) examined the cross sectional
relationship between ownership and performance and reported significant
positive nonlinear relationship. Studies that reported a significance curvilinear
relationship between ownership structure and firm performance employed
performance measures of Tobin’s Q, ROA and ROE. Moreover, the nonlinear

61
results described the hypothesis of convergence and entrenchment behaviour
by controlling shareholders in the corporation.
Studies that reported positive relationship between concentrated ownership
and corporate performance benchmarked Berle and Means (1933). It is worth
to note that Berle and Means (1933) pointed out that concentrated ownership
increases performance because of the concentrated monitoring created by
majority shareholders. The study carried by Claessens and Djankov (1999) on
the cross sectional data of 706 Czech Republic firms over 1992-1997 reported
significant positive ownership concentration and profitability relationship. But
these results were weak when conducted a robust check for endogeneity.
Mak and Kusnadi (2005) examined 230 Singapore listed firms and 230
Malaysia listed firms reported significant positive ownership concentration
and corporate performance relationship. The results based on Malaysia firms
were further studied by Haniffa and Hudaib (2006) who used data of 347
listed companies at Kuala Lumpur Stock Exchange over 1996-2000. By
employing Tobin’s Q and ROA as company performance measures, the study
reported on significant positive relationship between ownership concentration
and ROA but significant negative relationship with the Tobin’s Q.
Likewise, there are vast studies that reported significant positive relationship
between ownership concentration and corporate performance (Bai, Liu, Lu,
Song, & Zhang, 2006; Z. Chen, Cheung, Stouraitis, & Wong, 2005; Cho &
Kim, 2007; Earle, Kucsera, & Telegdy, 2005; Gugler & Weigand, 2003;

62
Omran et al., 2008; Singh & Gaur, 2009; Thompson & Hung, 2002; Tsionas,
Merikas, & Merika, 2012). These studies concluded that the controlling
shareholders play significant monitoring role towards firm performance. For
instance, Tsionas et al. (2012) based on 107 internationally cross sectional
shipping firms in year 2009 and controlled for endogeneity problems using
GMM, reported significant positive ownership concentration and performance
relations. In general, results by Tsionas et al. (2012) are found to contradict the
earlier prediction by Berle and Means (1933) in developed economies
whereby ownership structure is dispersed.
Several other studies reported a negative relationship between concentrated
ownership and firm performance. The main argument of these studies is based
on the expropriation by the controlling shareholders at the expense of minority
shareholders (Y. Hu & Izumida, 2008). This behaviour is associated with
expropriation by controlling shareholders commonly in developing economies
(Jiang & Peng, 2011; Peng & Jiang, 2010; Young et al., 2008, 2002). For
instance, Bebchuk (1999); Morck et al. (1988); Ongore (2011) reported
significant negative relationship between ownership concentration and
corporate performance. More specifically, Ongore (2011) reported significant
negative relationship for listed firms at NSE in Kenya over 2006-2008.
Moreover, the study that was carried by Akbar, Poletti-hughes, El-faitouri, and
Zulfiqar (2016) on a sample of 435 non-financial listed firms over 1999-2009
examined the corporate governance and firm performance relationship in UK.
After controlling for endogeneity problems using GMM estimator, the study

63
reported significant negative relationship between corporate governance and
corporate performance.
Studies that examined the relationship between foreign ownership and
corporate performance are inconclusive. The resource dependence theory
argues that a corporation is an open system which allows the entrance of
external resource like foreign ownership and mergers and acquisitions to
improve corporate performance (Douma et al., 2006; Pfeffer & Salancik,
1978). Empirical evidence by Chari et al. (2010) using data collected over
1980-2006 for U.S firms and employing probit regression reported significant
positive relationship between foreign ownership and firm performance.
Bai et al. (2006) analysed the impact of foreign ownership on performance
using panel data of 1004 publicly listed companies in China. Using the OLS
for market performance measure and accounting ratio, the study concluded
that foreign ownership has positive impact on performance. Similarly, Douma
et al. (2006) applied the OLS to 1005 Indian firms for data collected over the
period of 1999-2000 and concluded on significance positive relationship
between foreign ownership and company performance. Similar results were
concluded by (Filatotchev, Stephan, & Jindra, 2008; Xu, Zhu, & Lin, 2005).
However, Tsegba and Ezi-Herbert (2011) using the cross sectional data of 73
Nigerian listed companies over the period of 2001-2007 found insignificant
relationship between foreign ownership and corporate performance.

64
The summary of the past empirical studies on ownership structure and
corporate performance are summarised in Table 2.1.

65
Table 2.1: Empirical Studies on Ownership Structure and Firm Performance
Author Market Period Variables used Data type, Methodology Summary of findings
Demsetz and Lehn (1985)
U.S. 511 firms
1976 - 1980 Accounting profit rate
Concentrated ownership (5
largest owners, 20 largest
owners, Herfindahl index)
firm size, price volatility,
instability of firm environment
Cross sectional data using
OLS.
No significant relationship between
concentrated ownership and firm performance.
McConnell and Servaes
(1990)
U.S. 1173 firms
U.S. 1093 firms
1976
1986
Tobin Q
block holders ownership
Cross sectional data,
OLS
Block holders & Tobin Q have no significant
relations.
Claessens and Djankov
(1999)
706 firms of the Czech
Republic
1992 – 1997
Profitability and labour
productivity
concentrated ownership of top
five blocks
Cross sectional data used the
OLS, Hausman test, REM
High concentrated ownership implies the higher
firms’ profitability and labour productivity.
Non monotonic relationship was found.

66
Table 2.1 (continued)
Author Market Period Variables used Data type, Methodology Summary of findings
Xu and Wang (1999) China listed companies 1993-1995 Market to value ratio, ROA,
ROE
Concentration (top 5, 10,
Herfindahl) ownership
Single equation (linear) LSDV Positive relationship between concentration
and profitability
Thomsen and Pederson
(2000)
100 non-financial European
listed firms
1991-1996 ROA, MBV, Sales growth
ownership concentration,
owner identity, sales, Beta,
leverage
Cross sectional data
OLS
Inverted U-Shaped relationship between
concentrated ownership and performance
Demsetz and Villalonga
(2001)
223 U.S. firms 1976 - 1980 Tobin Q, profit rate
Concentrated ownership
Cross sectional data,
OLS, 2SLS techniques
OLS - ownership and performance are
significant.
2SLS insignificantly explain the relationship
(La Porta et al., 2002)
27 Wealthy Economies
539 large firms
1995-1997 Tobin’s Q
Ownership concentration
growth in sales, wedge, CF
rights
Panel data, used the REM
Firms in countries with better minority
shareholder protection,
and firms with higher cash-flow rights by
controlling owners have higher performance
67
Table 2.1 (continued)
Author Market Period Variables used Data type, Methodology Summary of findings
Thompson and
Hung (2002)
Singapore ROE,
Ownership Concentration
Cross sectional data; OLS Significant positive relationship between
ownership concentration and ROE
Gugler and Weigand (2003)
U.S 491 listed firms
Germany 167 listed firms
1989-1997
1991-1996
ROA
Large shareholders, Insider
ownership
size, growth, capital intensity,
and capital structure
Panel data, used OLS, IV
Large shareholders affect firm performance
separately and exogenously, as is the case in the
German system. Total insider holdings are
endogenously determined for US firms.
Earle et al. (2005)
Hungary 168 firms
1996-2001 ROE, operating efficiency
(OE)
Ownership concentration (the
largest 2, 3, and all)
Panel data, used OLS, FEM Size of the largest blocks increases profitability
and efficiency strongly and monotonically
Bai et al. (2006)
China 1004 listed
companies
Tobin’s Q,
Concentrated ownership
Foreign ownership
Panel data; OLS Nonlinear relationship between largest
shareholders and performance. Concentrated
ownership and foreign ownership is positively
related to firm performance.
Negative relationship between the largest
shareholder and firm value.
Insider ownership is not related to firm value.

68
Table 2.1 (continued)
Haniffa and Hudaib (2006) Malaysia 347 firms listed on
KLSE
1996 - 2000 Tobin’s Q, ROA
Ownership concentration,
Gearing, CAPEX, firm size,
industry
Cross sectional data; OLS Ownership concentration has positive
significance relationship with accounting
measure.
Gearing and CAPEX are positive and
significant related with Q. Size has negative
significance.
Hu and Izumida (2008) Tokyo Stock Exchanges 1980-2005 Tobin’s Q, ROA
Ownership concentration,
Investment, Firm size, sales
growth, Volatility, Liquidity
Panel Data; FEM; GMM U-Shaped relationship between ownership
concentration and performance
Lambertides and Louca
(2008)
92 shipping firm listed on
EU stock exchanges
2002-2004 Operating performance
Foreign ownership
Panel Data; FEM Significant positive relationship between
foreign shares and operating performance
Tsegba and Ezi-Herbert
(2011)
Nigeria 73 listed companies
2001 - 2007
Tobin Q, ROE
Concentrated ownership,
Foreign ownership
Cross sectional data; OLS There is no significant impact between
concentrated, foreign ownership and firm
performance.
Vincent Okoth Ongore
(2011)
Kenya
42 listed firm from
2006-2008 ROA, ROE, DY,
ownership concentration
Cross sectional data; Pearson
correlation, Logistic
Regression and Stepwise
Regression
Negative relationship between concentrated
Ownership and performance.

69
Table 2.1 (continued)
Tsionas et al. (2012)
107 firms listed
internationally
For 2009 ROE, ROA
Concentrated ownership
Firm size, leverage, liquidity,
age
Panel data; 2SLS, 3SLS,
GMM
Significant positive relationship between
concentrated ownership and firm performance
Huang and Boateng (2013) The China
101 listed real estate firms
1999 - 2010 Tobin’s Q
concentrated ownership
size, leverage, growth
Unbalanced Panel data
VCE, FEM, GMM
Concentrated ownership has significant positive
nonlinear relationship.
Phung and Hoang (2013)
Vietnamese Listed Firms 2007-2012 Firm performance
foreign ownership
Panel data; FEM
Foreign ownership has a U-shaped relationship
with firm performance (ROA).
Pinto and Augusto (2014) 4163 non-financial
Portuguese firms
2003-2008 Operational performance,
Ownership concentration,
insider ownership,
Panel data; OLS; GMM Nonlinear relationship between ownership
concentration and operational profitability
Vintilă and Gherghina
(2014)
Romania 68 listed firms 2007-2011 Tobin’s Q
Concentrated ownership (1st,
2nd
& 3rd
major shareholders)
Unbalanced panel data;
Multivariate regression model,
FEM
The sum of the three largest shareholders
positively influence corporate performance

70
Table 2.1 (continued)
Author Market Period Variables used Data type, Methodology Summary of findings
Lozano, Martínez, and
Pindado (2015)
16 European countries;
1064Listed firms.
2000-2009 Tobin’s Q
Ownership concentration
Firm size, leverage, firm risk,
cash flow, lagged firm
performance, country and
industry dummies
Panel data; GMM system,
Hansen test, Wald test
The relationship between ownership
concentration and firm performance is U-
shaped
Nguyen, Locke, and Reddy
(2015)
Singapore and Vietnam 2008-2011 Tobin’s Q
Ownership concentration,
board size, firm size, leverage,
national governance quality
Panel data, OLS, FEM, GMM Positive relationship between ownership
concentration and performance. No evidence of
nonlinear relationship.
Rahman and Reja (2015)
Malaysia:
21 commercial banks (9
local, 12 foreign banks)
2000 - 2011 ROE, ROA,
Foreign ownership
Panel data; Multiple
regressions with FEM, REM,
GLS, and Hausman test.
Foreign ownership has no significant impacts
on performance.
Hassan, Hassan, Karim, and
Salamuddin (2016)
Bursa, Malaysia 2007-2012 Tobin’s Q
Ownership concentration, firm
size, leverage, investment,
growth, ROA
Panel data: FEM, GMM No empirical evidence of nonlinear relationship
between ownership concentration and Tobin’s
Q.
Source: Author compilation

71
2.8 Observation of the Methodology for the Past Studies
Empirical studies for ownership concentration and foreign ownership on
company performance were conducted in different markets by employing
different techniques. Table 2.1 has summarised different past studies that were
carried on different markets, periods and based on different approaches.
Table 2.1 reveals that authors carried different methodologies to achieve stated
objectives. However, the following observations were noticed. First, studies
that used the cross sectional data suffered the effect of individual
heterogeneity. The nature of cross sectional data does not offer suitable
instruments to handle possible individual differences responsible for
endogeneity of ownership (Börsch-Supan & Köke, 2002). Thus, to account for
problems of unobserved heterogeneity that are not handled by cross-sectional
data, this study employed the panel data. Panel data and their advantages are
discussed in chapter three in subsections 3.4.1 and 3.4.1.1 respectively.
Second, studies that analysed data by employing the OLS or 2SLS estimators
as highlighted in Table 2.1 suffered the endogeneity problems. It is
acknowledged that OLS estimator exists under restrictive assumptions of
homoscedasticity, autocorrelation, multicollinearity and normality (Baltagi,
2005; Gujarati & Porter, 2009). Under these restrictive assumptions, the OLS
estimator generates biased and inconsistent estimates and attracts the
likelihood of reporting spurious results (Bascle, 2008). It is asserted that if
OLS estimator is properly handled it can generate consistent parameters.
72
However, Flannery and Hankins (2013); Wintoki et al. (2012); Wooldridge
(2002) argued that the unobserved heterogeneity, simultaneity and dynamic
endogeneity constitute the endogenous problems which cannot be controlled
by OLS estimator.
Moreover, while the use of 2SLS can help to capture the unobserved
heterogeneity through the use of instrumental variables (IV), it has been
argued that there is an ambiguity of identifying suitable instruments (Bozec et
al., 2010). Moreover, Staiger and Stock (1997); Stock, Wright, and Yogo
(2002); Tsionas et al. (2012) added that some instruments are weak especially
when they are correlated by regressors. Thus any correlation between IV and
regressors will make such instruments to be invalid. In general, 2SLS suffers
endogeneity problem because error term is contemporaneously correlated.
Thus, in order to overcome problems of unobserved heterogeneity and
endogeneity that were apparent in past empirical studies, the current study
employed the dynamic GMM estimator. It is claimed that GMM estimator can
generate unbiased and efficient estimates, and also the estimator is attached
with valid instrument and lagged dependent variable (Arellano & Bond, 1991;
Blundell & Bond, 1998). The dynamic GMM estimator has been
acknowledged to be superior to other estimating techniques including OLS,
Fixed Effect Model (FEM) and Random Effect Model (REM) (Arellano,
2004; Arellano & Bond, 1991; Keong, 2007; Wintoki et al., 2012;
Wooldridge, 2002).

73
Third, studies that employed unbalanced panel data for instance Huang and
Boateng (2013); Vintilă and Gherghina (2014) included in their analysis the
companies whose data were missing; as a result, the studies constituted the
possibility of reporting biased results. In the contrary, this study employed
balanced panel data.
2.9 Summary
This chapter has developed a framework based on the agency theory and
resource dependency theory purposely for generating the likelihood of
protecting minority shareholders among partner states of the EAC. The
interests for all stakeholders can be aligned when the company achieves its
predetermined objectives. Empirical studies for ownership structure on firm
performance are summarised in Table 2.1. Numerous literature has argued that
ignoring endogenous problem create the possibility for reporting spurious
results. Thus, employing the dynamic GMM estimator intends to account for
problem associated with the omitted variables, instrumental error, simultaneity
and dynamic endogeneity. The use of panel data emanates from its proficiency
to overcome the shortcomings associated with firm heterogeneity.
Thus, the next chapter provides methodologies for achieving objectives of this
study. For econometric issues, panel data are discussed together with panel
unit root tests and panel cointegration tests. The chapter will address various
issues pertaining to endogenous problems. The DEA technique is discussed
and econometric methodology of GMM is discussed.

74
CHAPTER 3
RESEARCH METHODOLOGY
3.1 Introduction
Studies on ownership concentration and corporate performance relations are
progressively conducted in developed economies than in developing
economies including EAC. It is widely accepted that corporate governance in
developed economies are attached with sound institutional frameworks where
management activities can be easily monitored at very low costs (Bajaj et al.,
1998; Iskander & Chamlou, 2000). In developing economies including partner
states of EAC, studies on ownership concentration and firm performance
relations have received insufficient attention.
This study examines the ownership concentrations and firm performance
relations in EAC for ascertaining the monitoring and expropriation behaviour
by majority shareholders. Moreover, the study integrates the agency and
resource dependency theories to examine the role played by foreign ownership
when interacted by efficiency scores towards corporate performance and
protection of minority shareholders. This study employed the balanced panel
data of 58 non-financial publicly listed companies in four security exchanges
over the period of 2007-2015.
75
This chapter is organised in such that subsection 3.2 presents conceptual
framework whereby the model for achieving objectives are developed.
Subsection 3.3 discusses the Data envelopment analysis technique for
developing the efficiency scores. Data and data sources are described in
subsection 3.4. Subsection 3.5 analyses the panel unit root tests and panel
cointegration tests. Subsection 3.6 provides brief discussion on Fixed and
Random effect models, and Generalised Method of Moments (GMM) is
discussed under subsection 3.7.
3.2 Conceptual Theoretical Framework
The relationship between ownership structure and firm performance is
reflected by developing three models of linearity, nonlinear and the interaction
between foreign ownership and efficiency scores in the model. Thus, the
theoretical and empirical frameworks are stated in the proceeding subsections.
3.2.1 Theoretical Framework
It was argued in the literature that concentrated ownership can result into
linear relationship when concentrated monitoring is imposed by controlling
shareholders (Berle & Means, 1933; Stijn Claessens & Djankov, 1999).
However, the persistence of monitoring and expropriation creates a nonlinear
relationship.

76
3.2.1.1 Linear Relationship between Ownership Concentration and
Corporate Performance
Studies that examined the relationship between ownership concentration and
corporate performance among the listed companies in EAC reported
inconclusive results (Mang’unyi, 2011; Munisi et al., 2014; Murongo, 2013;
Nyaki, 2013; Okiro & Aduda, 2015; Ongore et al., 2011; Tusiime,
Nkundabanyanga, & Nkote, 2011; Wanyonyi & Tobias, 2013; Waweru &
Riro, 2013).
The inconclusive results on studies carried is contributed by different factors
including but not limited to the treatment of ownership concentration as
exogenously determined. Demsetz (1983) pointed out that ownership
concentration is endogenously determined. More emphasise was given by
Gujarati and Porter (2009) that, it is unlikely for a variable to be strictly
exogenous while performance depends on the past, current and future values.
Therefore, this study treated concentrated ownership as endogenously
determined.
According to the convergence effect premises, firm performance and
ownership concentrated are positive and statistically significant related (Jensen
& Meckling, 1976; Keasey et al., 1994). Empirical evidences by Cho (1998),
Himmelberg, Hubbard, & Palia (1999), Yixiang (2011) found a reverse
causality between ownership structure and performance whereby ownership
was evidenced to be endogenously determined by performance.

77
Börsch-Supan and Köke (2002) concluded that the reverse causality and
spurious correlation are the sources of endogenous problem. They argued that
spurious correlation is caused by the presence of unobservable heterogeneity
that affects performance and governance concurrently. Similarly, Himmelberg
et al. (1999) pointed out that relationship between corporate governance and
performance is influenced by some other unobserved/unmeasured factors.
Thus, based on the above discussion the linear relationship is measured using
the following model.
tttt ZXPERF 1 (3.1)
Where: PERF = corporate performance; = constant term; tX = ownership
concentration; 1 = coefficient for ownership concentration; tZ = control
variables; = coefficients for control variables tZ ; t = error term.
3.2.1.2 Monitoring and Expropriation Behaviour by Majority
Shareholders
Several studies have reported the presence of nonlinear relationship between
ownership concentration and firm performance (McConnell & Servaes, 1990;
Mikkelson, Partch, & Shah, 1997; Scholten, 2014; Thomsen & Pedersen,
2000). It is argued that nonlinear relationship occurs when controlling
shareholders are triggered by private benefit of control by expropriation at the
expense of minority investors (McConnell & Servaes, 1990; Morck et al.,
1988; Shleifer & Vishny, 1997). The monitoring and expropriation behaviour
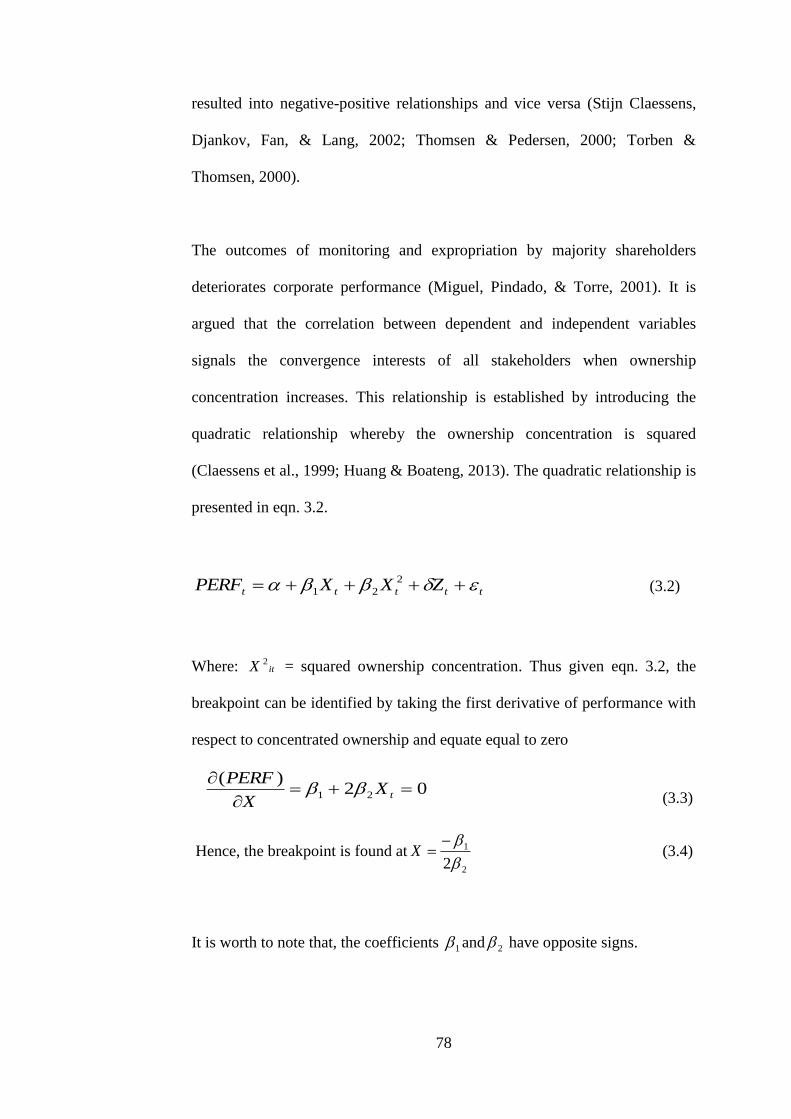
78
resulted into negative-positive relationships and vice versa (Stijn Claessens,
Djankov, Fan, & Lang, 2002; Thomsen & Pedersen, 2000; Torben &
Thomsen, 2000).
The outcomes of monitoring and expropriation by majority shareholders
deteriorates corporate performance (Miguel, Pindado, & Torre, 2001). It is
argued that the correlation between dependent and independent variables
signals the convergence interests of all stakeholders when ownership
concentration increases. This relationship is established by introducing the
quadratic relationship whereby the ownership concentration is squared
(Claessens et al., 1999; Huang & Boateng, 2013). The quadratic relationship is
presented in eqn. 3.2.
ttttt ZXXPERF 2
21 (3.2)
Where: itX 2 = squared ownership concentration. Thus given eqn. 3.2, the
breakpoint can be identified by taking the first derivative of performance with
respect to concentrated ownership and equate equal to zero
02
)(21
tX
X
PERF
(3.3)
Hence, the breakpoint is found at
2
1
2
X (3.4)
It is worth to note that, the coefficients 1 and 2 have opposite signs.

79
3.2.2 Development of Empirical Model
This study focused on the internal mechanism of corporate governance
because the external mechanism of corporate governance in partner states of
EAC are overwhelmed by poor legal and regulatory framework (Munisi et al.,
2014; Peng & Jiang, 2010). The relationship between ownership concentration
and the corporate performance was established. Weak legal and regulatory
framework bestows the ownership and control of the company into the hands
of the majority shareholders. The private benefit of control force majority
shareholders to exploit company assets at the expense of minority investors.
The ownership concentration is the main cause for poor protection of minority
shareholders.
Therefore, the first objective of the linear relationship between ownership
concentration and corporate performance is achieved through using the
following model. Note that equation 3.1 is time series equation. To make this
equation a dynamic panel model by including the cross sectional unit i, an
estimation model will look as follows.
it
N
i
itiitit ZXY 1
10 TtNi ,...,2,1;,...,2,1 (3.5)
Where: itY = corporate performance; 0 = constant term; itX = ownership
concentration; 1 = coefficient for the ownership concentration; i =
coefficient for control variables itZ namely firm size, leverage, investment
and growth; and it = error term.

80
As cited previously, Demsetz (1983) asserted that corporate performance is
affected by endogenous problems. The sources of endogeneity problems are
unobserved heterogeneity, simultaneity and instrumental error (Greene, 2014;
Wintoki et al., 2012; Wooldridge, 2002). Existing studies admit that ignoring
endogenous problems create biased and inconsistent estimates essentially for
reporting spurious results (Cho, 1998; Himmelberg, Hubbard, & Palia, 1999;
Yixiang, 2011).
As Gujarati and Porter (2009) opined above that, it is dubious to assume that a
variable is strictly exogenous while performance depends on the past, current
and future aspects. Therefore, this study accounts for endogenous problem by
employing the Generalized Method of Moments (GMM). The GMM
technique is employed because it can handle endogenous problems (Arellano
& Bond, 1991; Blundell & Bond, 1998). Several empirical studies have
reported the superiority of dynamic GMM estimator over other estimating
techniques including OLS and FEM (Keong, 2007; Wintoki et al., 2012).
Corporate performance can be improved when controlling shareholders play
positive monitoring role of the business (Shleifer & Vishny, 1986). However,
since 1990s it was discovered that controlling shareholders exercise extensive
expropriation by diverting company resources at the expense of minority
shareholders (Dalziel et al., 2011; Faccio et al., 2001; Gugler & Weigand,
2003; Johnson, LaPorta, Lopez-de-Silanes, & Shleifer, 2000).

81
Thus, the monitoring and expropriation effects have possibility of generating
nonlinear relationship between ownership concentration and corporate
performance. It is asserted that, this effect is common in countries like partner
states of EAC where ownership concentration is dominant (Chakra &
Kaddoura, 2015; Filatotchev et al., 2013; Nguyen et al., 2015) which in turn
manifest poor protection of minority shareholders. Thus, this impact of
monitoring and expropriation which creates principal-principal problem is
presented using square of the ownership concentration (McConnell & Servaes,
1990; Morck et al., 1988; Shleifer & Vishny, 1997).
It can therefore be stated amenably that the impact of ownership concentration
on corporate performance can be unclear when ownership concentration is low
and ultimately converts to positive as ownership concentration increases to a
certain level and takes a U-shaped relationship (Y. Hu & Izumida, 2008;
Nguyen et al., 2015). The U-shaped view holds also the argument that was
stated by Law and Azman-Saini (2008) on institutions and financial
development.
Therefore, the second objective of monitoring and expropriation behaviour by
majority shareholders is examined in nonlinearity relationship by including the
squared ownership concentration in the dynamic panel eqn. 3.5 and develops
the following model:
it
N
i
itiititit ZXXY 1
2
210 (3.6)

82
Where: itX 2 = square ownership concentration. The coefficients 1 and 2
carries opposite signs. The squared ownership concentration in eqn. 3.6
implies that when concentration ownership increases the expropriation effect
declines following efficient monitoring and the relationship between squared
ownership concentration and corporate performance is expected to be positive
(Y. Hu & Izumida, 2008; Nguyen et al., 2015).
The EAC region is overwhelmed by weak legal and regulatory frameworks
and thus, jeopardises the protection of minority shareholders (Berglöf &
Claessens, 2004; Melyoki, 2005). The resource dependence theory (RDT)
claims that utilisation of external financing enhances performance (Douma et
al., 2006; Hillman & Dalziel, 2003). This theory suggests that the board of
directors is required to build international linkage to accessing external
sources. In addition, Crook, Ketchen, Combs, and Todd (2008); Dalton, Daily,
Certo, and Roengpitya (2003) pointed out that heterogeneous ownership
improves monitoring know-how, human capital and financial resources. Thus,
different types of ownership are the best alternative sources for protection of
minority shareholders in developing countries. Different types of ownership
imply existence of heterogeneity among shareholders and thus, the presence of
foreign investors in the company provide benchmarking for good governance
practices and improve performance.
Based on the above proposition, foreign ownership is accommodated in the
dynamic panel equation 3.5 to examine its influencing ability on corporate

83
performance through monitoring and disciplinary role that address the
protection of minority shareholders.
(3.7)
Where: FO = foreign ownership; coefficient 2 is expected to be positive.
This is the type of ownership where a domestic company constitutes the
percentage of foreign investor.
Aggarwal et al., 2011; Young et al., (2008) opined that foreign investors play
significant role in mitigating the conflict between principals (horizontal
conflict) which is dominant in emerging economies. Foreign investors have
acquired management know-how from different countries. Thus, foreign
investors can engineer monitoring skills and inculcate transparency among
companies for protection of minority shareholders (Aggarwal et al., 2011;
Peng & Jiang, 2010). It is widely accepted that foreign institutions are
technically more efficient than domestic institutions because of what they
constitute (Barney et al., 2001; Douma et al., 2006; Hillman & Dalziel, 2003;
Kinda, 2012).
Eqn. 3.7 examines the impact of foreign ownership on firm performance.
Foreign ownership promotes firms operating efficiency and in order to
measure the operating ability and monitoring role, the interaction between
foreign ownership (FO) and firm efficiency (EF) was created. This involved
the estimation of efficiency scores using Data Envelopment Analysis (DEA).
ititiititit ZFOXY 210

84
This study achieves the third objective by estimating the efficiency scores for
public listed companies in EAC using DEA technique. However, the
estimation of the efficiency scores for listed firms requires the selection of
relevant input and output variables (Ray, 2004; Wagner & Shimshak, 2007). It
should be noted that, the third objective intended to measure the technical
averages efficiencies for locally owned companies and companies that
embrace foreign ownership. This required estimating the average efficiency
scores for each year by taking the summation of scores in a particular year and
divides it by number of companies. This means that after estimating efficiency
score using DEA, then the average scores in each year are estimated using the
following formula.
ij
n
ji
tij
tN
EFF
EFF
1,
(3.8a)
Where: tEFF is the average efficiency score in a particular year ― t ‖,
tijEFF is the total efficiency scores in a particular year and ijN is the total
number of either thi firms (locally owned companies) or thj firms (foreign
owned companies) in a particular year. Detailed information on how to
calculate the efficiency scores is presented in subsection 3.3.
The efficiency scores based on DEA were then incorporated by foreign
ownership to create interaction term. The introduction of interactive term
between foreign ownership and firm efficiency meant to boost foreign
ownership with efficiency environment and to capture the disparity impact of
foreign ownership on corporate performance (Bürker et al., 2013; Zheka,

85
2006). Thus, this study achieves the fourth objective by introducing the
interactive term in the following model:
(3.8b)
Note that: FO*EF is the interactive term, 3 = coefficient for interactive term
which is expected to be positive. The coefficient 2 is expected to decline in
magnitude compared with the previous coefficient of foreign ownership
because of impact created by efficiency. However, the coefficient for the
ownership concentration 1 is expected to improve positively.
From eqn. 3.8b, foreign investors played the monitoring and disciplinary roles.
The interaction between foreign ownership and efficiency is linked with less
information asymmetry by foreign ownership necessarily for standard
corporate governance practices (Chen, Ghoul, Guedhami, & Wang, 2014). The
positive relationship between the interactive variable and performance is
expected. Meanwhile, the introduction of efficiency in the model might
decline foreign ownership to negative before bouncing back to positive
because of the impact created by efficiency. In case the coefficient of foreign
ownership becomes negative, it will imply that there is a certain threshold of
efficiency which is required to accelerate optimal performance (Greenaway,
Guariglia, & Yu, 2014).
itit
n
i
iititititit ZEFFOFOXY 1
3210 )*(

86
Premised on the above explanations, the threshold value of efficiency score for
optimal performance to accelerate foreign ownership on performance can be
estimated by differentiating eqn. 3.8b with respect to FO as follows.
it
it
it EFFO
Y32
)(
(3.8c)
Therefore, at this point it will be necessary to solve for EF in eqn.3.8c at the
stationary point whereby at stationary point 0)(
it
it
FO
Y, then solve for EF
given that 2 and 3 will be known.
3.3 Data Envelopment Analysis (DEA) Technique
This study achieves the third objective by estimating the efficiency scores for
publicly listed companies in EAC using DEA technique as outlined above.
This subsection provides detailed information on how to calculate efficiency
scores using DEA.
Literature slightly emphasises on how to choose relevant input and output
variables because few studies presume that DEA variables are naturally
known. It is extensively accepted that decision making units (DMUs) employ
resources in their operations and that outcomes are expected from these
resources. Resources employed by firm are referred to as inputs while
outcomes are referred to as outputs (Madhanagopal & Chandrasekaran, 2014;
Oberholzer, 2014; Wagner & Shimshak, 2007).

87
Proponents of DEA technique argue that the technique focuses on developing
a parsimonious model that uses as many variables as desirable but as few
variables as possible. On aggregate, DEA variables should not exceed one
third or should be two or three times the sum of DEA variables of the DMUs
in the study (Bowlin, 1998; Cooper et al., 2007; Dyson, Allen, Camanho, &
Shale, 2001; Golany & Roll, 1989; Jenkins & Anderson, 2003; Olesen &
Petersen, 2015; Ramanathan, 2003; Sharma & Yu, 2015).
Given the above understanding, different approaches for selecting rational and
relevant DEA variables are offered. These approaches include but not limited
to judgmental screening (Golany & Roll, 1989), application of regression and
correlation analysis (Jenkins & Anderson, 2003; Lewin, Morey, & Cook,
1982), an iterative technique (Kittelsen, 1993; Pastor, Ruiz, & Sirvent, 2002),
the stepwise DEA algorithm (Sharma & Yu, 2015; Wagner & Shimshak,
2007) and the genetic algorithm (Madhanagopal & Chandrasekaran, 2014).
The approaches outlined above provide the benchmark for selecting relevant
DEA variables. The challenge is that, criteria applied to any of these
approaches are somewhat subjective. However, the proponents of corporate
governance and corporate performance studies propose the fixed assets, equity
capital, labour, expenses, total revenue and profit as the most relevant DEA
variables (Madhanagopal & Chandrasekaran, 2014; Oberholzer, 2014; Wang,
Jeng, & Peng, 2007; Zimková, 2014).

88
Accordingly, this study employed input vectors of fixed assets, staff expenses,
and equity capital. Fixed assets are the combination of the tangible and
intangible assets because these assets demonstrate the vital for survival of any
company. Equity capital is included as one of the factors of production
because the capital is raised for expanding the business. Staff expenses which
encompass salaries and wages are included as input because expenses are
essential during the process of production. In this regard, staff expenses are
regarded to be part of costs of doing business.
Two output variables of total revenue and profit are employed. Revenue is
included because it is the real value and that management cannot easily
manoeuvre operating revenue using earnings (Nanka-Bruce, 2011). Also,
profit is included because of its ability to access the efficiency of management
to utilise each dollar employed in the firm to generate return (Beveren, 2010;
Colombo, Croce, & Murtinu, 2014; Levinsohn & Petrin, 2003; Nanka-Bruce,
2011; Olley & Pakes, 1996; Staal & Brogaard, 2011; Van Biesebroeck, 2007).
It is worth to note that, all DEA variables used in this study are real variables
implying that they are adjusted with purchasing power parity (PPP) and
exchange rate. This study is in line with previous studies which emphasised
for data adjustments (Madhanagopal & Chandrasekaran, 2014; Nanka-Bruce,
2011).
This research uses DEA methodology to compute the efficiency scores of
firms which is a fraction of outputs to inputs (Cooper et al., 2007, 2011).

89
Inputs and outputs data for DMU j are jmjj xxx ,,2,1 ,..., and jsjj yyy ,,2,1 ...,
respectively (m inputs, s outputs). The VRS is expressed with the efficiency
score known as a real variable and a non-negative vector variable (Banker
et al., 1984).
This study is in line with Farrell (1957) who proposed the use of input oriented
because input-oriented can gauge technical inefficiency of some firms in a
radial (proportional) decrease in input usage to produce the same level of
output (Coelli et al., 2005; Fazli & Agheshlouei, 2009). Moreover, the reason
for this study to employ input orientation was triggered by companies to
accomplish existing requirements that are mainly decided by the total
resources available. Contrary, other companies have fixed amount of resources
to be accomplished to achieve maximum output, and it would be logical to
employ the output orientation.
Thus, the VRS model developed is as follows:
min
Subject to
0
1
0
0
1
j
n
j
rrjj
i
n
j
ijj
yy
xx
(3.9)
Thus, eqn. 3.9 is typical a CRS model. Hence, eqn.3.9 is converted to VRS by
introducing the convexity constraint which allows an inefficient firm to be

90
benchmarked against similar firm size. The need to introduce convexity
constraint is that it enhances the VRS model to produce efficiency scores that
are greater than or equal to efficiency scores generated via the CRS model.
Thus, the constraint that converts the CRS to VRS is denoted hereunder.
n
j
j
1
1
: is the convexity constraint. Every time,
0, rjij yx
Note that 0ix and 0ry are the levels of thi inputs and thr outputs for 0DMU
respectively, j represents weights for inputs and outputs and n number of
firms. = technical efficiency of jth DMU such that 10 ; 1 implies
DMU is technically efficient otherwise the DMU is inefficient (Bonin, Hasan,
& Wachtel,2005; Delis & Papanikolaou, 2009; Lu, Wang, Hung, & Lu, 2012;
McDonald, 2009; Ramalho, Ramalho, & Henriques, 2010).
3.4 Data type and Data Sources
This study employed firm panel data of 58 non-financial listed firms collected
over the period of 2007-2015. The 58 companies were obtained by excluding
banks and insurance companies because they have different regulations. The
period 2007 is chosen because during this year two countries namely Rwanda
and Burundi joined the integration of East African Community (EAC).
Moreover, in 2007 the stock markets in the EAC region with exception of
Kenya were at their initial stages of establishment. For clarification and more
details refer to chapter one, Table 1.2.

91
During the year 2007, the stock markets in EAC implemented automated
trading system (DSE, 2011). Automation was initiated as a means to cut
higher running costs and inefficiency that is one of key challenges of most
African stock markets and hence facilitate liquidity (Massele, Darroux,
Jonathan, & Fengju, 2013; Yartey & Adjasi, 2007). Data source and variables
for this study are summarised in Table 3.1.
The scope for this study is the partner states of EAC for reasons that: first, the
partner states like other African countries, are dominated by conflict of interest
between controlling and minority shareholders which is engineered by weak
legal protection of minority shareholders (Ayandele & Emmanuel, 2013;
Eyster, 2014; Rwegasira, 2000; Schwab, 2014; Young et al., 2008).
Second, the partner states have established the common union and common
market since 2009 and 2010 respectively. The establishment of common
market intended to create free competitive environment for companies. The
transferability of technology, fiscal policy, capital and labour are among the
key issues for the common market. The creation of free competitive
environment helps companies to absorb and utilise proper corporate
governance practices for efficiency corporate performance.
Third, in connection with the above reasons, in 2014 the partner states signed
a protocol of formulating common currency through the monetary union and it
is expected to be implemented within ten years. To achieve the monetary
policy objective, the EAC has harmonised the macroeconomic policies. The

92
EAC intends to establish the political federation to facilitate stable country
policies and promote strong political stability and enhance cooperation for
international integration.
Fourth, the EAC have established the protocol for East African Community
corporate governance (EACCG) and have gazetted the guidelines for good
corporate governance for publicly listed companies. Therefore, there is a need
to assess the current governance towards performance so that the guidelines
would facilitate the region to overcome poor corporate governance practices
that harm corporate performance.
3.4.1 Panel Data
Baltagi (2005) defines panel data as the pooling of observations on cross
sectional of households, firms and country for several periods of time. Panel
data can be described as balanced or unbalanced (incomplete) panel data. The
balanced panel data occurs when all the observations are available for the
entire periods of the study while unbalanced panel data constitutes missing
observations of some firms in some periods of the study (Baltagi, 2005;
Gujarati & Porter, 2009). This study employed the balanced panel data
because the observations cover the entire period of study 2007-2015 and it
restricts for new entries to avoid the possibility of reporting biased results.
Previous studies on corporate governance were dominated by time series and
cross sectional data. In recent years, literature on corporate governance has

93
diverged greatly from macro modelling to micro modelling of financing. The
use of panel data has surpassed the time series and cross sectional data
(Baltagi, 2005; C Hsiao, 2003).
Time series technique is referred to as a technique where data for an individual
or unit are collected severally. Observation made on an individual or unit is
referred to as single time series or univariate time series. Time series is non-
deterministic by nature because it is difficult to predict what will happen in the
future while some past patterns will continue to predict the future (Cochrane,
1997). Because time series process depends on the past behaviour of the main
variable rather than the explanatory variable, the system is referred to as black
box. According to Box and Jenkins, they assert that at least 50 observations
are required to perform the time series analysis.
Time series involves collection of the data from an individual or unit over
several periods whereas, the cross sectional is data collected from units or
individuals at one point time. On the other hand, panel data combines the time
series and cross sectional data (Gujarati & Porter, 2009). Therefore, panel data
accounts for both time and dimension (Gujarati & Porter, 2009).
The conventional time series has several drawbacks including the problems of
autocorrelation. Autocorrelation occurs when the residuals are not independent
to each other and its covariance deviates from zero. On the other hand, the
cross sectional data regression suffers from heteroskedasticity. Sometimes

94
panel data are described as pooled data or simply pooling of time series and
cross sectional observations, longitudinal data or micro panel data.
3.4.1.1 Advantages of Panel Data
There are several advantages for using panel data over time series and cross
sectional data (Baltagi, 2005; Hsiao, 2003).
First, panel data takes into account the heterogeneity among corporations
because each firm has specific characteristics. Time series and cross sectional
data have shortcoming of developing biased results because they cannot
control for heterogeneity among firms (Arellano, 2004). The ability for panel
data to control for heterogeneity is important because of firm-invariant or
time-invariant. Moreover, when variables that affect performance are omitted
or not available in the model, time series and cross sectional data will tend to
generate biased estimates.
Second, panel data are superior in controlling for spurious correlation whereby
the unobserved or unmeasured factors are controlled draconically and do not
appear in the regression model (Bozec, Dia & Bozec, 2010). The third
advantage of panel data is its ability to providing more informative data that
allow for variability, less co-linearity and creates more degree of freedom and
efficiency. Time series data are more affected by autocorrelation and
multicollinearity while cross sectional data are affected by heteroscedasticity.

95
Fourth, while cross sectional data are required to be studied severally, panel
data is more suitable for studying the dynamics of change. This means that
changes in economic policy are well studied using panel survey. Thus,
because corporate performance changes overly so employing cross-sectional
data will have greater likelihood of generating biased results.
Another advantage of panel data lies on its flexibility for researchers to
construct and test complicated behavioural models including technical
efficiency using panel data which cannot be captured using either time series
or cross sectional data.
3.4.2 The Research Variables
The empirical models that were developed above have the explanatory
variables, dependent variables and control variables. Based on the agency
theory and the resource dependency theory, the variables employed are
discussed here below.
3.4.2.1 Dependent Variables
This study employed corporate performance as a dependent variable. The
predominant measures of corporate performance are accounting and market
measures (Munisi & Randoy, 2013). This study considered the market and
accounting measures in corporate performance.
96
The Tobin’s Q was the proxy for the market performance, while Return on
Assets (ROA) and Return on Equity (ROE) were the proxies for accounting
performance (Aliabadi, 2013; Sanjay Bhagat & Bolton, 2009; Delen, Kuzey,
& Uyar, 2013; Tayeh, Al-jarrah, Tarhini, & Kingdom, 2015). The accounting
measures is based on what has been accomplished by the management
(backward-looking) and the market measures is referred to what the
management accomplish (forward-looking) (Demsetz & Villalonga, 2001).
The Tobin’s Q was introduced by Tobin (1969) to measure the future
investment performance of the firm. The model was successful in measuring
business performance and thus, it was extended to other studies (Chung &
Pruitt, 1994; Davies et al., 2005; Delen et al., 2013; Demsetz & Villalonga,
2001; Lang & Litzenberger, 1989; Lindenberg & Ross, 1981; Oulton, 1981;
Smirlock, Gilligan, & Marshall, 1984). However, the Tobin’s Q model had
undergone several modifications from its complexity to simplicity. For
instance, Chung and Pruitt (1994) simplified the complexity algorithm that
were earlier proposed by (Lang & Litzenberger, 1989; Lindenberg & Ross,
1981). The complexity for using the original Tobin’s Q was associated with
data availability especially the replacement cost of assets.
Tobin’s Q was explained as the market value of firm’s assets divided by the
replacement cost (Yermack, 1996). However, this study adopts Tobin’s Q
based on the equity market value to equity book value which was applied by
(Chen, Chung, Hsu, & Wu, 2010; Kang, Wang, Bang, & Woo, 2015; La Porta
et al., 2002; Munisi & Randoy, 2013). These authors opined that the modified

97
Tobin’s Q model generated good estimate. The higher or lower the Tobin’s Q
the better or worse the corporate governance mechanism towards firm
performance (Davies et al., 2005; Himmelberg et al., 1999; Hsu & Jang, 2009;
Kang, Lee, & Huh, 2010).
The accounting ratios are used because market measures rely on expected
future performance. Thus, ROA was employed to represent the ability of the
company to generate profit from the assets employed. The ROE represented
the efficiency of management to generate profit for every dollar invested in the
company and it is a useful measure for making comparison with other
companies in similar industry (Aliabadi, 2013; Athanasoglou, Brissimis, &
Delis, 2005; Bahhouth & Gonzalez, 2014; Chen et al., 2012; Core,
Holthausen, & Larcker, 1999; Davies et al., 2005; Ekholm & Maury, 2014;
Tavitiyaman, Qu, & Qiu, 2011). Thus, the higher ratio implies that
management is effective to utilise scarce resources of the company.
3.4.2.2 Independent Variables
The ownership concentrated is used to measure the influence of majority
shareholders towards corporate performance. Several studies that emanated
after Demsetz and Lehn (1985) classified ownership concentration based on
the clusters of the block holders. Ownership concentration is measured by the
sum of shares held by the largest shareholders as the percentage of ownership
(Demsetz & Lehn, 1985; Harold Demsetz, 1983; Earle, Kucsera, & Telegdy,

98
2005). Thus, the sum of the block holders carries significant explanations to
measure the impact of the majority shareholders.
Accordingly, foreign ownership as per resource dependence theory in a
domestic firms play monitoring role by installing standard corporate
governance practices thereby reducing the ability of controlling shareholders
to exploit firm’s assets at the expense of minority investors (Bjuggren et al.,
2007; S. Lee, 2008).
It is argued that,- foreign investors should not be considered as a cure for
problems facing developing economies (Chari et al., 2012; Kim, 2010). The
finding of Chari et al. (2012) concluded that foreign ownership and corporate
governance are positively related. Effect of foreign ownership can be captured
using different ways including the use of dummy variables 1 if a firm has
offshore owner and 0 otherwise (Mueller et al., 2003). Where, Lee (2008)
pointed out that foreign ownership can be measured by the proportion of
shares held by foreign investors. This study measures foreign ownership as the
percentage of shares owned by foreign investors.
3.4.2.3 Control Variables
Control variables are variables that can influence the relationship between
ownership structure and firm performance. The power of control variables is
that they have an ability to influence both ownership and corporate

99
performance but they are uncorrelated with the error term. There are number
of reasons for including the control variables.
The first reason is associated with the ability of reducing the biasness effect
caused by omitted variables, measurement error and simultaneity. This
constitutes the controlling of unobserved heterogeneity and dynamic
endogeneity (Hu & Izumida, 2008; Nguyen et al., 2015). Therefore, in order to
critically assess the impact of ownership structure on firm performance it is
necessary to include control variables (McConnell & Servaes, 1990; Morck et
al., 1988; Thomsen & Pedersen, 2000).
The second reason is associated with the absence of the market for corporate
control among partner states in EAC which could help to align interests of the
managers and shareholders (Demsetz & Lehn, 1985). This study has included
firm size, leverage, growth opportunity, and investment as control variables.
There are other variables that could be used but those mentioned were
identified to carry strong impact for the context of the Sub Saharan countries
especially the EAC (Munisi et al., 2014; Munisi & Randoy, 2013). The
rationale for including these variables is provided below.
The firm size is included as a control variable because the size of a firm
predicts the ability of the firm to access external source of financing. The
effect of firm size can be measured when normalised by taking the natural
logarithm of total assets of the firm (Core et al., 1999; Fama & French, 2000).
This study employed total assets because they are related with total resources

100
of the firm and the effects of firm size among partner states in EAC are based
on the resources of the firm. Extant studies report positive relationship
between firm size and corporate performance because of the capability of
large firm to exploit economies of scale (Beiner, Drobetz, & Schmid, 2006;
Black, Jang, & Kim, 2006b; Munisi et al., 2014). Thus, the proxy for firm size
is taken to be the natural logarithm of total assets (S. Lee, 2009).
The leverage is another control variable included in this study because
leverage of the company entails its creditworthy. Firms that employ high level
of debt are expected to have better performance than non-debt companies. The
regions to which protection of minority shareholders is high then leverage
positively affect performance (González, 2013). On this regard, the debt
issuers impose scrutiny to monitoring the activities of the debt firm while the
debt firm will want to keep its reputations. To proxy for leverage, the total
debt to total assets is used (Colombo et al., 2014).
Shleifer and Vishny (1997) claimed that the firm that acquires higher debt
should work hard in order to avoid the bankruptcy risk. Similarly, Jensen
(1986) maintained that the firm that acquires higher debts has minimal agency
problems which consequently induce efficiency corporate performance. The
signalling hypothesis predicts positive relationship between leverage and
corporate performance (Ross, 1977), whereas the pecking order theory
predicts negative relationship between leverage and firm performance (Myers
& Majluf, 1984; Myers, 1984; Myers, 1977).

101
The sales growth is another control variable to be introduced because sales
growth explains growth opportunities (Black et al., 2006a). This implies that
year to year sales growth is an indicative that companies are growing. Studies
on corporate governance and performance argue that growth opportunities
proved to be the cause rather than the consequences of governance structure
(Wintoki et al., 2012). Those companies that admire the fast growing should
have the part of their financing from external sources (Durnev & Kim, 2005).
Essentially, the efficacy corporate governance should result into lowering the
company cost of capital (Beiner et al., 2006).
The sales growth is measured as the percentage change of the current sales to
preceding years’ sales divided by the preceding years’ sales (Durnev & Kim,
2005). Therefore, positive relationship between sales growth and corporate
performance is expected (Gompers, Ishii, & Metrick, 2003).
The fourth control variable is investment. This is a macroeconomic variable
which can be described as the capital expenditure (CAPEX) of the company.
The CAPEX refers to capital expenditure whereby a firm purchases and
acquires new properties and equipment for increasing its investments (Arslan,
Florackis, & Ozkan, 2014; United Nations, 2010). It is claimed that increasing
investment creates multiplier effect on the performance of the firm. The
impact of investment on performance offsets myopic insight by managers
through long term investments (Samuel, 2000; Stein, 1988, 1989). The
expenditure to acquire new investments by firms generates innovative

102
potentials through R&D which stimulates corporate performance (Durnev &
Kim, 2005).
The capital expenditures engineer the prospective future returns of a company
and hence coined as the investment opportunity which can be measured as the
ratio of capital expenditure to fixed assets. Therefore, capital expenditure and
firm performance are expected to be positively related (Akbar, Poletti-Hughes,
El-Faitouri, & Shah, 2016; Chen et al., 2010; Lang, Stulz, & Walkling, 1989).
Table 3.1 Summary of Variables and Data Sources
Variables Description Source
Dependent variables (Performance measures)
Tobin’s Q (%)
Computed as the market value of assets divided by
the book value of assets, where the market value of
assets equals the book value of assets plus the
market value of common equity less the sum of the
book value of common equity.
Bloomberg;
Stock Markets of Partner
states
ROA (%)
Computed as the ratio of operating profit to total
assets.
Bloomberg;
Stock Markets of Partner
states
ROE (%) Computed as the ratio of net income to total Equity.
Bloomberg;
Stock Markets of Partner
states
Independent variables(Ownership structure)
X
The ownership concentration is the
percentage of shares held by the largest
shareholder (%).
+, -
Bloomberg; Stock Markets
of partner states
FO
Foreign ownership measured by the
proportion of shares held by foreign
investors (%).
+, -
Bloomberg; Stock Markets
of partner states
Control variables
SIZ Firm size measured by natural logarithm
of total assets +, -
Bloomberg;
Stock Markets of Partner
states
LEV Leverage measured by Book value of
Total debts / book value of Total assets. +, -
Bloomberg;
Stock Markets of Partner
states

103
Table 3.1 (continued)
GROW Growth is measured by average annual
growth of sales to the past year +, -
Bloomberg;
Stock Markets of Partner
states
INV The Investment is computed by dividing
the CAPEX to Total Assets +, -
Bloomberg;
Stock Markets of Partner
states
DEA variables
Inputs (US$ Millions)
Fixed Assets Combination of tangible and intangible assets but
adjusted by PPP and exchange rate
Bloomberg; Stock Markets
of Partner states
Expenses These are real values of staff expenses
Bloomberg; Stock Markets
of Partner states
Equity capital This explains financial capital attributed by the
shareholders. Real values are used
Bloomberg; Stock Markets
of Partner states
Outputs (US$ Millions)
Total sales Real values of operating revenue
Bloomberg; Stock Markets
of Partner states
Profit These are net profit at the end of the year. Real
values are used.
Bloomberg; Stock Markets
of Partner states
Source: Author compilation
It is worth to note that in SSA region including the partner states of EAC, it is
somewhat challenging to collect market information data from one source
only. Therefore apart from Bloomberg database available at UTAR library,
data were also collected from the stock exchanges of partner states of EAC.
3.4.3 Econometric Estimations
This study employed panel data of 58 non-financial public listed companies in
EAC over the period of 2007-2015. These data are used to create relationships
between dependent and independent variables using GMM. Data are analysed
using GMM in order to generate consistent and unbiased parameters and

104
minimise the likelihood of reporting spurious results. Details for GMM are
provided on subsection 3.7.
3.5 Panel Unit Root Tests and Panel Cointegration Tests
This section introduces two panel data models the panel unit root tests and the
panel cointegration test analysis. These panel data models are important in
regression analysis as described in the specific subsections 3.5.1 and 3.5.2.
3.5.1 Panel Unit Root Tests
3.5.1.1 Overview of Panel Unit Root
Panel unit root tests are intended to examine the data stationarity. The Panel
unit root tests are becoming preferred to the standard time series unit root tests
because they have greater power compared to low power of time series. The
greater power of panel data comes from their data which provide more
information on the variations and observations against the conventional time
series data (Taylor & Sarno, 1998).
Another referenced advantage of the panel unit root tests over standard time
series unit root test is that the panel unit root test has an asymptotic
distribution which is normal and standard compared to non-standard limiting
distribution of time series data (Barbieri, 2009; Keong, 2007).

105
The importance for testing stationarity is acknowledged for providing relevant
parameters because some variables tend to fluctuate overtime and could
trigger reporting spurious results (Gujarati & Porter, 2009; Mahadeva &
Robinson, 2004). For instance, Demsetz (1983) argued that factors like firm
size, industry classification and shareholder protection contributes to the
optimal ownership level to fluctuate overtime. Mahadeva and Robinson (2004)
highlighted that if regression is applied to non-stationarity estimates, it could
trigger the likelihood of reporting misleading and spurious result. In general,
testing for stationarity has an advantage of making accurate predictions.
Numerous studies recognised the growing importance of studies to examine
the panel unit root tests in heterogeneous panels (Baltagi & Kao, 2000).
Testing for unit root in time series data has been a normal phenomenon but
now the unit root tests are conducted in panel data where data are assumed to
be heterogeneous (Gujarati & Porter, 2009; Hsiao, 2003). The reasons for
testing for data stationarity are to assess if the ups and downs of data are
permanent or temporary. The ups and downs have to be known because of
their impacts in making forecasting.
The validity for panel unit root tests lies on their size and power they provide
when explaining and reporting results. The size of panel unit root tests dictates
the level of the probability to commit type I error, whereas the power dictates
the probability of committing type II error (Baltagi, 2005; Gujarati & Porter,
2009). For instance, Hurlin and Mignony (2007) observed that the unit root
test has lower power in a small sample size which becomes difficult to

106
differentiate the persistence of stationary series or non-stationary series.
Moreover, Baltagi and Kao (2000) pointed out that the lower power problems
can be overcome by increasing the number of observations. However,
Maddala (1999) criticised the relevance of comparing powers between tests
that results from different null hypotheses.
The time series unit root test and panel unit root test are distinguished on the
basis of the heterogeneity, cross sectional dependence and small sample
biasness (Hurlin & Mignony, 2007; Keong, 2007). Heterogeneity is not a
problem for the time series because individuals are assumed to be
homogeneous. Panel data assume that individuals are dynamic so the panel
unit root test should take into account of the heterogeneity (Hsiao, 2003;
Keong, 2007; Moon & Perron, 2004; Pesaran & Smith, 1995).
The panel unit root tests are classified as either first generation or second
generation. The first generation of the panel data unit root tests are based on
the assumption that data are independent and identically distributed (i.i.d)
across firms. Thus, the first generation restricts all cross sectional to be
independent that is no cross - sectional correlation in panels whereas the
second generation requires all cross sections to be dependent, that is, there is
cross - sectional correlation in panels (Barbieri, 2006). The second generation
assumes that the correlation across units constitutes nuisance parameters.
Explicitly, the distinction between first and second generations of panel unit
root tests is in Figure 3.1.

107
Figure 3.1: Panel Unit Root Tests
Source: Author compilation
The second generation was criticised for its lack of natural order that results
into inefficient estimators (Quah, 1994). It was also critiqued for creating less
efficient parameters and it becomes spurious when pooled OLS is used to
estimate the panel regression on cross sectional dependence (Phillips and Sul,
2003). The cross sectional dependency has greater impact when sample size is
small because it makes the unit root test to have less power. In order to
increase the power of the test there is a need to increase observations (Baltagi
& Kao, 2000). It is worth to note that the cross-sectional correlation
dependence is still under development (Barbieri, 2006).
Panel Unit Root
Tests
Homogeneous
Heterogeneous
Breitung (2000)
Hadri (2000)
Levin, Lin, & Chu (2002)
Maddala & Wu (1999)
Choi (2001)
IPS (2003)
Bai & Ng (2001, 2004)
Moon & Perron (2004)
Phillips & Sul (2003)
Pesaran (2003, 2007)
O'Connell (1998)
Chang (2002, 2004)
Panel Unit Root
Tests
1st Generation
2nd
Generation
Cross - sectional independence
Cross - sectional dependence

108
To account for the three issues of dynamic panels as mentioned above,
Phillips and Sul (2003) developed asymptotic theory that tests for coefficients
of heterogeneity and proposed the Modified Hausman test to account for
homogeneity. These authors, proposed the use of median unbiased estimator to
tackle the problem of small sample biasness, but the procedure was used to
provide benchmark for other complex models such as corrected IV/GMM
(Hahn & Kuersteiner, 2002; Hsiao & Zhang, 2015).
However, the issue of heterogeneity is one of the advantages of panel data as it
benefits from pooling during panel regression despite that it can generate
misleading outcome and invalidate inferences (Keong, 2007). Thus,
carefulness is required whenever one intends to use the second generation for
cross sectional dependence in testing homogeneity in non-stationarity panels
because of its shortcomings as narrated above.
3.5.1.2 The Panel unit root tests Methodology
It was mentioned earlier that there are two types of panel unit root tests. These
panel unit root tests are classified as common roots and individual roots.
Common roots are based on homogeneity of the autoregressive coefficients,
whereas individual roots are based on heterogeneity of the autoregressive
coefficients. However, given the individual firm differences, heterogeneity is
vital issue to be addressed whenever addressing the panel unit root tests
(Hsiao, 2003). The seminal paper by Levin and Lin (1992, 1993), LL and
Levin, Lin, and Chu (2002), LLC thereafter restrict coefficients to be

109
homogeneous. This implies that individuals have similar rate of convergence.
The restrictive assumptions made on alternative hypothesis of LL and LLC
about homogeneity is unrealistic because it distorts size and lowers the power
(Maddala & Kim, 2002). It was this restrictive assumption that led for
development of heterogeneous based models (Baltagi, 2005). The
heterogeneity models include those developed by Choi (2001); Hadri (2000);
Im, Pesaran, and Shin (2003); Maddala and Wu (1999).
Premised on the above discussion and the summarised Fig.3.1, this study
employed three panel unit root tests that are capable of accounting for
heterogeneity among firms in EAC. These models are the Im et al. (2003)
thereafter IPS and the method of combining p-value tests thereafter Fisher-
ADF of Choi (2001); Maddala and Wu (1999). The general structure of panel
unit root test that will be considered takes the following form.
i
l
ititiltiiltiiit dyyy
1
,1, (3.10)
Where itd is the deterministic component, i is the corresponding coefficient,
i =1, 2…N and t =1, 2... T; i is a coefficient of lagged dependent variable or
autoregressive coefficients; it is error term that is idiosyncratic residual.
3.5.1.2.1 The Im, Pesaran and Shin (2003) Panel Unit Root Tests
The IPS test is regarded as the simplification of the LL test because it is
viewed as a test that combines evidences from several independent unit root

110
tests. IPS has overcome shortcoming of LLC (Barbieri, 2006). The IPS is
based on the assumptions that companies are heterogeneous and they are
independent. This test is well known as (Im et al., 2003) that allows for
heterogeneity in autoregressive parameter i which is contrary to (Levin et
al., 2002) who have restrictive hypothesis that the autoregressive coefficient
i are homogeneous, implying that all individuals are assumed to have
homogeneous autoregressive coefficients. Thus IPS (1997, 2003) test is the
generalization of the LL test because is more powerful. The IPS can be argued
as follows:
i
t
ittilitiiitit yyy
1
1,,1, (3.11)
The null hypothesis is defined as:
0:0 iH ; i = 1, 2… N (3.12)
The alternative hypothesis is defined as follows:
0:1 iH i = 1, 2… 1N ; and,
0:1 iH i = NN ,...,11 , with NN 10 (3.13)
The alternative hypotheses allow some individual series to have a unit roots.
The IPS t – bar statistic is averaged based on Augmented Dickey - Fuller
(ADF) statistic by assuming ),( iiiTt with ),...,( ,1, iiii denote for t –
statistic for testing unit root in the thi company, where
N
t
iiiNT TtN
t1
),(1
(3.14)

111
Constrained with the restrictive assumptions that requires all cross sections to
be independent then )1,0(NtNT as T and as when N based on
Lindberg – Levy central limit theory.
For standardization of IPS based on ADF, estimations of expected value and
variance of t-bar statistic have to be calculated, that is )),(( iiiTtE and
)),(( iiiTtVar values. Therefore, because of standardization, IPS converge to
a standard normal distribution under a null of non-stationarity
N
i iiiT
N
i iiiTNT
t
tN
tEN
tN
W
1
1
)0)0,(var(1
)0)0,((1
)1,0(,
Nd
NT
(3.15)
Where: the values )0( iiTtE and )0( iiTtVar are calculated by IPS
using simulations using different values of T’s and si ' .
3.5.1.2.2 Fisher – ADF Tests
The IPS performed the Monte – Carlo Simulation to test the power of their
own IPS test and Levin and Lin (LL) tests on an assumption that all cross
sections are independent. The IPS test was found to be more powerful than
LL. The comparison simulation test on three tests of IPS, LL and MW that
was conducted by Maddala and Wu (1999), MW hereafter based on the
assumption that all cross sections were dependent, which resulted into worse
LL test. MW argued that these tests can not rescue the PPP because of their

112
lower power. The combining P – value tests is the test statistic suggested by
Maddala and Wu (1999) which was later expanded by Choi (2001) based on
the Fisher (1932) type test.
The starting point for this test is based on the same heterogeneous assumption
as IPS model eqn. 3.11, with the same null and alternative hypotheses. This
test statistics is based on the observed significance level and assumption that
there is a unit root test static and the test statistics are continuous and the
corresponding p - value denoted by ip are uniform (0, 1).
Based on the restrictive assumption that all cross sections are independent,
(Maddala & Wu, 1999) and (Choi, 2001) proposed the following Fisher type
test
N
i
ipP1
ln2 (3.16)
Eqn. 3.16 combines the p – value of each unit root from each cross section i
to test for a panel unit root and P is distribute at chi – square distribution with
2N degree of freedom as 1T N , to control for large N samples, (Choi,
2001) proposed the modified P statistic standardized
2
)2ln2(1
1
N
iN
Z
(3.17)
(Choi, 2001) argued that the combining p – value provided results that were in
favour of PPP contrary to IPS because the combined test had an added

113
improved predetermined sample power. The power of Z test was three times
more than the IPS test (Baltagi, 2005).
3.5.1.3 Conclusion for the Panel Unit Root Tests
The analysis above has identified two categories of panel unit root tests
namely; those based on homogeneity assumptions and heterogeneity
assumptions. However, this study analyses the listed companies in East
African countries which have different (heterogeneity) characteristics. The
LL(S) and IPS have the same null hypothesis of unity root, but different
alternative hypothesis. The LL(S) is based on homogeneity of autoregressive
coefficients and data are based on pooled regression whereas IPS is based on
heterogeneity of autoregressive coefficients and does not require pooling of
the data but on the mean of the Augmented Dickey Fuller statistic. The MW
and IPS are preferably used because they have higher power and size tests
compared to LLC (Maddala & Kim, 2002).
3.5.2 Panel Cointegration Tests
3.5.2.1 Introduction
Cointegration tests aims at establishing the existence of long–run relationship
between ownership structure variables and firm performance. It was stated
earlier that panel data favours the heterogeneity nature of individual firms.

114
3.5.2.2 Cointegration Tests
It is argued that if data are stationary it implies that they are cointegrated (Lee
& Lin, 2010). Thus, cointegration tests justify for long-run relations among
variables. The notable tests for measuring the panel cointegration include Kao
(1999) and Pedroni (2004) which are residual based test statistics using the
null hypothesis of no cointegration. Table 3.2 outlines features of two tests.
Table 3.2: Panel Cointegration Tests
Test Hypothesis test Model specification Properties
Kao (1999) H0: no cointegration
H1: Homogeneous Varying intercepts
Common slopes
LSDV estimator
They are residual based tests
They are DF and ADF type tests
They have standard normal limiting
distribution
Low power when N and T are small
When T < 10, and N large all tests
have large size distortion and low
power.
Pedroni (2004) H0: no cointegration
H1: Heterogeneous Varying dynamics
Heterogeneous fixed
effect
Heterogeneous trend
terms
They are residual tests
They have standard normal limiting
distribution
For T>100 all tests have the same
power
For T<20, group t-statistics are
most powerful
Source: Author compilation
This study presumes that firms are heterogeneity. It employed the Pedroni
panel cointegration tests because of heterogeneity assumption on the
alternative hypothesis contrary to Kao panel cointegration that is based on
homogeneity assumption. Pedroni (2004) introduced seven tests as presented
in Table 3.2 which allow heterogeneity of the intercept and slope of the
cointegration model. Also the tests take into account of the common time
factors (within dimensions) and allow for heterogeneity across countries

115
(between dimensions) using estimated residuals. The Pedroni model includes
individuals fixed specific effects and time trends regression.
3.6 The Fixed Effect and Random Effect Models
3.6.1 Introduction
Basically, panel data are of two types namely fixed effect method (FEM) and
random effect model (REM). These differ on how heterogeneity is captured
and the estimation technique used in each model. This section draws the facts
about FEM and REM that justify undertaking the GMM estimator.
3.6.2 The Fixed Effect Model (FEM)
The FEM model, estimate variables using the Ordinary Least Square (OLS)
and assumes that the heterogeneity (individual firm effects) can be captured
using only an intercept term, and that the heterogeneity is associated with
regressors on the right hand side (Gujarati & Porter, 2009). The FEM model is
basically described using an intercept and slope.
The FEM assumes that different firms have different intercepts but each firm
intercept does not vary overtime (time – invariant), at the same time the slope
of each firm does not vary overtime. This situation can be interpreted using the
following equation:

116
itititiit uXXY 33221 (3.18)
Where the subscript i on the intercept i1 )...3,2,1( ni suggests that there are
different firms and each firm have different intercept accounted for by
differences in management style, philosophy or employment of new
technology (Gujarati & Porter, 2009); itY represents dependent variable where
i = entity and t = time; itX represents explanatory variables, itu represents an
error term. In case equation 3.18 was to be written as it1 , it would mean that
the intercept for each firm would change over time, that is, time – variant. The
term fixed effect is applied here to imply that intercepts of individuals are time
– invariant ,...,, 321 , are coefficients or slopes of the explanatory variables
and are constant meaning that they are time invariant.
Second, to insure that fixed effect intercepts vary over time, dummy variables
should be introduced in the model using the differential intercept dummy
technique to formulate a least square dummy variable (LSDV) model. For
instance if there are 4 individuals that is N = 4, then the model looks as
follows:
itititiiiit uXXDDDY 33224433221 (3.19)
Where: 12 iD for individual 2, 0 otherwise; 13 iD for individual 3, 0
otherwise; 14 iD for individual 4, 0 otherwise. 432 ,, : are coefficients
attached to dummy variables called the differential intercept coefficients. They
are called so because these coefficients provide information by how much the
value of the individual indicated by 1 differs from the intercept coefficient of

117
the reference individual (Gujarati & Porter, 2009). So, 2 tells by how much
individual 2 differs from the benchmark and thus 21 will be the real
intercept for individual 2, other intercepts are computed the same way.
Equation 3.19 involves 4 individuals, but only three dummy variables are
introduced in the model i.e. always we consider the 1m rule. This helps to
avoid falling into the dummy-variable trap or avoid falling into perfect
collinearity simply perfect multicollinearity whereby any individual is treated
as a benchmark or reference and every time when a dummy variable is
introduced, the intercept must be dropped in order not to fall into the dummy-
variable trap.
Third, the previous equation 3.19 is called one way fixed effect because it
allowed for individual effect to occur and introduced the dummy variables.
But again some factors such as technological changes, and external effects
might be responsible for changes to occur over time. Thus, time effects can be
captured by introducing time dummies in the model as follows:
ititiitiitiiti
itiitiititiiiit
uXDXDXDXD
XDXDXXDDDY
346245334233
32222133224433221
(3.20)
Eqn. 3.20 allows for both individual and time effects and is termed as a two
way fixed effect model resulting into 6 more variables. The number of
interactive terms should equal the dummy variables times the number of
explanatory variables. It is worth to note that when the number of dummy

118
variables become too many in the model, the degree of freedom become too
low and hence increases the risk of multicollinearity (Gujarati & Porter, 2009).
In general, by combining both individual effects and time effects, more
complications arise. Thus, the error term itu should be reflected on the
assumptions and issues of heteroscedasticity and autocorrelation be
considered.
3.6.3 The Random Effect Model (REM)
Contrary to the FEM model, the estimation of Random Effect Model (REM) is
by the Generalised Least Square (GLS) and it is used when FEM fails. REM
assumes that individual effects are captured by an intercept and random error.
The error term here is independent with the regressors and REM is so referred
to as error component model (Gujarati & Porter, 2009).
The rationale behind the REM model is that unlike the FEM, the unobserved
effects are assumed to be random and uncorrelated with the regressors; this is
most important prediction because the biggest drawback of REM model is the
biasness of estimate. REM allows for time invariants that are absorbed by
intercepts in the FEM. The ECM is formulated from equation 3.18 but now the
intercept i1 is assumed to be random with mean value expressed as follows.
11 )( iE (3.21)
And intercept value for individual company i can be expressed as follows.

119
ii 11 Ni ,...,3,2,1 (3.22)
Where 0)( iE and 2)( iVar (3.23)
Substituting equations 3.18 and 3.21 we obtain
itiititit uXXY 33221 (3.24)
itititit wXXY 33221 (3.25)
Such that:
itiit uw (3.26)
Where: i = cross section, error component, itu = idiosyncratic error which is
the combination of time series and cross section error component. In this case,
itw
is not correlated with any explanatory variable in the model. The
component of the error terms is what makes the Random effect model referred
to error component model (ECM).
It should be noted that under the FEM, each cross sectional unit has its own
fixed intercept value and produces unbiased estimates for β although can be
subjected from high sample to sample variability. The ECM, the intercepts
represents the mean value of all the intercepts and the error component and
that can be biased to estimates of β. The difference between FEM and REM is
summarised in Table 3.3.

120
Table 3.3 Differences between FEM and REM
Fixed Effect Model Random Effect Model
Functional form itiit itXuY )( )( itiitit uXY
Assumption - Individual effects are not correlated with regressors
Intercepts Varying across group and/or time Constant
Error variances Constant Randomly distributed across group and/or time
Slopes Constant Constant
Estimation LSDV, within effect estimation EGLS – Estimated Generalized Least Square
Hypothesis test F test Breusch-Pagan LM test
Source: Author compilation
These two techniques FEM model and REM model have shortcomings that
should be addressed. Studies that applied the fixed and random effect model to
establish the relationship between corporate governance and firm performance
encountered the endogeneity problem (Demsetz & Lehn, 1985; Demsetz &
Villalonga, 2001; Himmelberg et al., 1999). Endogeneity is the main problem
facing both the FEM and the REM. The GMM system is introduced to take
into account the shortcomings of FEM and REM.
3.7 The Generalised Method of Moments (GMM)
3.7.1 Overview of GMM
The generalised method of moments (GMM) is an estimation model that was
formalised by Hansen (1982) to give a non – parametric approach for deriving
efficient estimators. The GMM is argued to be an advanced approach for
constructing meaningful relationship between corporate governance and firm
performance (Schultz, Tan, & Walsh, 2010).

121
In many studies, the relationship between dependent and independent
variables is performed using the OLS that require researchers to take into
account the assumptions underlying the residual values including
multicollinearity, autocorrelation and homoscedasticity based on Gauss –
Markov Theorem (Greene, 2014; Gujarati & Porter, 2009; Wooldridge, 2002).
It is argued that OLS generates biased and inconsistent estimates especially
when there is endogeneity problem which occurs when residuals are correlated
with the regressors Wooldridge (2002). This implies that the presence of
endogeneity violates the condition of exogeneity caused by omitted variables,
measurement error and simultaneity causality (Bascle, 2008).
Studies that employed the fixed effect model (FEM) like (Earle et al., 2005;
Vintilă & Gherghina, 2014) have greater chance of encountering problems of
simultaneity, measurement error and unobserved heterogeneity. This is
because when the FEM stands alone cannot handle endogeneity problems and
thus, biased estimates is generated (Baltagi, 2005). In this regard, the FEM
model should be accompanied by many instrumental variables (IV) in order to
overcome correlation between regressors and error term.
However, Bozec et al. (2010); Bozec and Dia (2012) cautioned that the
inclusion of many IV in the FEM model leads to a problem of identifying
valid instruments that can impact dependent and independent variables.
Moreover, Roodman (2009) added that using too many instruments can
generate significant sample biasness this is because instrumental variables are

122
described of having inability to exploit all information available especially on
small sample size. (Bascle, 2008) argued for upgrading to GMM in order to
create efficient and unbiased parameters.
3.7.2 The Advantages of GMM
This study employed the generalized method of moments (GMM) estimator to
analyse the impact of ownership structure on corporate performance for the
panel data of 58 non-financial listed companies among partner states in EAC.
The use of GMM estimator roots on its superiority compared to other panel
data models. The GMM estimator has the following advantages.
First, GMM estimator helps to account for the potential sources of
endogeneity which cannot be controlled by FE and REM (Arellano & Bond,
1991; Blundell & Bond, 1998; Pham, Suchard, & Zein, 2011; Schultz et al.,
2010). Thus, GMM can account for unobserved heterogeneity, causality effect
and simultaneity. Hence, it allows the prevailing corporate governance to be
subject of the past performance namely the dynamic endogeneity. More
importantly, GMM estimator allows the past firm performance to be used as
instrumental variable Thomsen and Pedersen (2000); Wintoki et al. (2012).
Second, it was stated earlier that instrumental variables cannot absorb
advantages of exploiting information available in the sample data because
these instruments should not be correlated with the residuals. The GMM does
the reverse of the IV which is sufficient for generating efficient estimates

123
(Arellano & Bond, 1991). Therefore, the dynamic GMM estimator can
generate efficient estimators for reporting unbiased results. Keong (2007);
Wintoki et al. (2012) added that the GMM generates efficient estimates while
controlling for endogenous problems.
Third, the GMM estimator is consistent even when the sample size is small.
When a series is moderately or highly persistent, the GMM presents low bias
and produces efficient estimates. The efficiency of GMM over other
estimators such as OLS was reported by (Blundell & Bond, 1998) on the
superiority and the accuracy they gain under the small sample size.
3.7.3 The Application of GMM Model
To address the problem of endogeneity that cannot be captured by the FEM
and REM, the literature on dynamic panel data model (Arellano & Bond,
1991; Blundell & Bond, 1998) insists on applying the GMM. The rationale for
applying the GMM estimator focuses on improving the OLS – Fixed Effect
Model estimates by allowing the past performance to explain the current
corporate governance. This means that the past performance is used as an
instrument to account for simultaneity unlike the OLS or the traditional FEM.
The effect of ownership on firm performance under the restrictive assumption
of firm heterogeneity can be presented using dynamic panel data (DPD) model
as recommended by Arellano and Bond (1991).

124
itiitiitiitpit ZXykY 1 (3.27)
Where: itY is firm performance for firm i at time t , 1ity is the lagged firm
performance, itX explanatory variables, itZ are control variable, i and i are
vector coefficients for explanatory and control variables respectively, i firm
level fixed effect and it the error term.
Eqn. (3.27) renders one source of endogeneity known as simultaneity that
occurs when 0),( ititit ZXE . Simultaneity is a situation that occurs when
explanatory variables and dependent variable are reversely determined. This
suggests that ownership and performance influence one another. The possible
way to handle simultaneity problem is to apply simultaneous equations. The
literature suggests that at least one of the control variables should not alternate
into other equations because of a need to identify exogenous variables.
However, Gujarati and Porter (2009) argued that it is improper and unrealistic
to assume that a variable is strictly exogenous while the variable depends on
the past, current and future values of the error term. Indeed, it is not easy to
identify the true instruments (Tsionas et al., 2012).
Moreover, another source of endogeneity problem is unobserved heterogeneity
which occurs when 0),( ititi ZXE . The unobserved heterogeneity occurs
when firm specific characteristics correlate with the endogenous regressors to
affect performance. Firm specific characteristics include managerial ability
and company philosophy that impacts corporate performance (Demsetz, 1983;

125
Hermalin & Weisbach, 2003). Thus the OLS traditional fixed effect regression
cannot account for the fixed part of unobserved heterogeneity and thus why
Wooldridge (2002) pointed that there will be potential bias and inconsistence
in reporting results.
Thus, the above endogenous problems can be controlled by employing the
GMM estimator that generates consistent and unbiased estimates. The GMM
estimator is argued to be superior in controlling unobserved heterogeneity,
simultaneity and past performance known as dynamic endogeneity (Y. Hu &
Izumida, 2008; Nguyen et al., 2015). Thus, from eqn. 3.30 the first differenced
model is introduced underneath.
ititiitiitpit ZXykY 1 (3.28)
Where 0p , and is an operator for the first difference. The first difference
eliminates the constant term and firm specific effect that is fixed effect based
on the time invariant and unobserved heterogeneity. The lagged performance
in eqn. (3.28) is an instrument where GMM should be used to estimate the
lagged performance as an instrumental variable (Arellano & Bond, 1991;
Harold Demsetz & Villalonga, 2001).
Thus, the past performance is used to explain the current performance. In
order for this instrument to be valid it is required not be correlated with the
disturbance term but correlated with regressors. These instruments by their
nature are assumed as weak instruments (Tsionas et al., 2012). An instrument

126
is said to be weak if it is weakly correlated with the regressors and
uncorrelated with the residuals. In the same vein, for an instrument to be valid
it should be exogenous (Stock et al., 2002).
However, in a case where correlation between the instrument variable and the
unobservable firm specific effect ( 0),( 1 itityE ) exists, then it is
required again to take a first difference of eqn. (3.28). It is worth to note that
the instrumental variables are components of the GMM estimator.
3.7.4 Research Instruments
3.7.4.1 EViews 9
This study employed the Econometrics Views (EViews 9) to run and execute
this quantitative study. According to Bossche (2011), EViews is a statistical
software package for establishing relationship between variables in regression
analysis. It is also used for making forecasting. It is powerful software because
of its ability in handling time series, cross sectional and panel data. EViews
offers useful data management, high quality graphics and tabular models
outputs, model specification, the estimation output and fitted values and
residuals (Bossche, 2011). In terms of inputs and outputs, EViews support
numerous formats including Excel, SPSS, SAS, and STATA.
127
3.7.4.2 Efficiency Management System (EMS) Software
This study employed Efficiency Management System (EMS) software for
computation of efficiencies based on DEA technique. The EMS software was
developed at the University of Dortmund, Germany and the software free for
academic society.
Several software for DEA computations are available including but not limited
to Data Envelopment Analysis (Computer) Programme (DEAP) that was
developed at the University of New England, Australia. The DEAP software is
a DOS based computer program and requires creating many and complex files
which results into taking longer time for DEA computations. Moreover,
General Algebraic Modelling Systems (GAMS) software was developed to
deal with large and complex problems. Thus, GAMS software operates when
it is incorporated with a solver. However, GAMS software does not have the
command to allow the computation of linear programming to be repeated
severally as the requirement for DEA computation (Ramanathan, 2003).
Accordingly, EMS software is chosen because it does not limit the number of
Decision Making Units (DMUs) and it handles multiple inputs and outputs.
The developer of the EMS software affirms that up to 5,000 DMUs and 40
inputs and outputs can be handled. Moreover, EMS software does not limit the
size of computation analysis and thus the size of analysis is judged by the
memory of the user’s computer. Furthermore, the EMS software accepts data
that are in MS Excel or text format and therefore can perform repeated linear

128
programming that are required for DEA computation (Avkiran, 2006;
Ramanathan, 2003).
3.8 Summary
This chapter has highlighted the procedures for achieving the objectives. The
chapter has pointed out the importance for testing data stationarity and long
run relationship. Econometric estimations for this are based on the
heterogeneity among the partner states of EAC. Because of the existing firm
specific characteristics, this study accounts for endogenous problems by
employing the GMM estimator.
The next chapter provides the discussion of the findings. In general, it
provides the implication of the results and assesses the achievability of the
objectives.

129
CHAPTER 4
4.0 EMPIRICAL FINDINGS AND DISCUSION
4.1 Introduction
The focus of this chapter is centred on the empirical results and discussion of
stationarity, long run relationship of ownership structure and performance for
publicly listed companies among partner states in EAC. The econometric
estimations are offered on the basis of brief discussion presented in chapter
three. These results are organised in subsections where subsection 4.2
summarises the descriptive statistics of this study; subsection 4.3 offers the
panel unit root tests and the panel cointegration tests; subsection 4.4 presents
and discusses the estimates of the dynamic panel model and the efficiency
scores and subsection 4.4 summarises the whole chapter.
4.2 Descriptive Statistics
This section reports the descriptive statistics of this study. It highlights mainly
the level of ownership concentration in the EAC region. The results for
descriptive statistics are presented in Table 4.1.
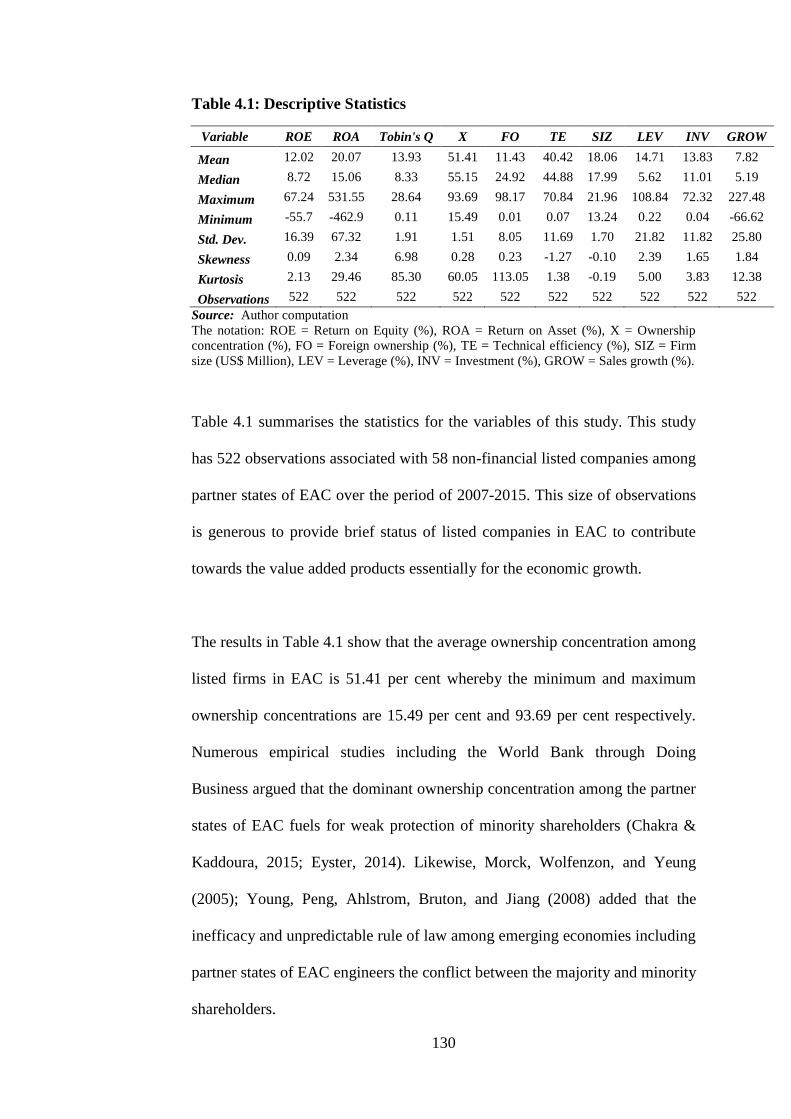
130
Table 4.1: Descriptive Statistics
Variable ROE ROA Tobin's Q X FO TE SIZ LEV INV GROW
Mean 12.02 20.07 13.93 51.41 11.43 40.42 18.06 14.71 13.83 7.82
Median 8.72 15.06 8.33 55.15 24.92 44.88 17.99 5.62 11.01 5.19
Maximum 67.24 531.55 28.64 93.69 98.17 70.84 21.96 108.84 72.32 227.48
Minimum -55.7 -462.9 0.11 15.49 0.01 0.07 13.24 0.22 0.04 -66.62
Std. Dev. 16.39 67.32 1.91 1.51 8.05 11.69 1.70 21.82 11.82 25.80
Skewness 0.09 2.34 6.98 0.28 0.23 -1.27 -0.10 2.39 1.65 1.84
Kurtosis 2.13 29.46 85.30 60.05 113.05 1.38 -0.19 5.00 3.83 12.38
Observations 522 522 522 522 522 522 522 522 522 522
Source: Author computation
The notation: ROE = Return on Equity (%), ROA = Return on Asset (%), X = Ownership
concentration (%), FO = Foreign ownership (%), TE = Technical efficiency (%), SIZ = Firm
size (US$ Million), LEV = Leverage (%), INV = Investment (%), GROW = Sales growth (%).
Table 4.1 summarises the statistics for the variables of this study. This study
has 522 observations associated with 58 non-financial listed companies among
partner states of EAC over the period of 2007-2015. This size of observations
is generous to provide brief status of listed companies in EAC to contribute
towards the value added products essentially for the economic growth.
The results in Table 4.1 show that the average ownership concentration among
listed firms in EAC is 51.41 per cent whereby the minimum and maximum
ownership concentrations are 15.49 per cent and 93.69 per cent respectively.
Numerous empirical studies including the World Bank through Doing
Business argued that the dominant ownership concentration among the partner
states of EAC fuels for weak protection of minority shareholders (Chakra &
Kaddoura, 2015; Eyster, 2014). Likewise, Morck, Wolfenzon, and Yeung
(2005); Young, Peng, Ahlstrom, Bruton, and Jiang (2008) added that the
inefficacy and unpredictable rule of law among emerging economies including
partner states of EAC engineers the conflict between the majority and minority
shareholders.

131
Furthermore, Table 4.1 reveals that the partner states of EAC have attracted
the foreign ownership at an average of 11.43 per cent. This implies that, the
region requires scrupulous efforts to attract potential foreign investors to
acquiring more capital for financing. It is worth to note that the cost for doing
business in EAC has been reported to be very high because of weak business
regulations (Eyster, 2014; World Bank, 2014a, 2016b). A study carried by
Barasa et al. (2017) pointed out that the partner states of the EAC namely
Kenya, Tanzania and Uganda are overwhelmed with weak institutions. In
general, the enforced quality institutions are urged to enhance the lowering of
the transaction costs (Skoog, 2005).
Additionally, Table 4.1 reveals that the minimum and maximum foreign
ownership among listed companies in EAC stands at 0.01 per cent and 98.17
per cent respectively. This implies that some companies have attracted
substantial number of foreign investors in their ownership to improve capital.
This is possible because the East African countries have agreed to liberalise
the restrictions on foreign ownership and thus, Tanzania and Kenya allow
foreign investors to a total control of listed companies similarly to Uganda and
Rwanda which were the first to allow foreign ownership up to 100 per cent
(Republic of Kenya, 2015; U.S. Department of State, 2015; United Republic
of Tanzania, 2014).
Also, as per Table 4.1, the average technical efficiency for publicly listed
companies among partner states of EAC is 40.42 per cent whereas the
minimum and maximum efficiencies are 0.07 per cent and 70.84 per cent

132
respectively. The reported result of technical efficiency, it shows that capital
markets in partner states of EAC pose serious problems of efficiency (Barasa
et al., 2017).
4.3 Panel Unit Root Tests and Panel Cointegration Tests
4.3.1 Introduction
To examine the long-run relationship and policy implications, one should first
examine the existence of stationarity among variables using the panel unit root
tests. This subsection discusses two tests results namely the panel unit root
tests and the panel cointegration tests.
4.3.2 The Results of Panel Unit Root Tests
The objective for testing data stationarity rests on two aspects of forecasting
and policy implications. To test for data stationarity, two panel unit root tests
of IPS and Fisher – ADF type for individual unit roots were conducted. The
output for the panel unit root tests are presented in Table 4.2.

133
Table 4.2: Individual Panel Unit Root Tests Result
Note: Null Hypothesis: Unit root. The asterisks *** implies significant at 1% significance
level. Probabilities for Fisher tests are computed using an asymptotic Chi-square distribution.
IPS tests statistics are computed using asymptotic normality. Automatic lag length selection
based on SIC for both IPS and Fisher ADF tests. The notation: ROA = Return on Assets, ROE
= Return on Equity, X = Ownership concentration, X2 = squared ownership concentration, FO
= Foreign Ownership, EFF = Efficiency, LEV = Leverage, SIZ = Firm Size, INV =
Investment, GROW = Growth.
The results reported in Table 4.2 indicate that data have unit root that means
data are non-stationary at level. The Tobin’s Q has mixed results on Fisher-
ADF tests. The presence of unity root at level implies that data are
unpredictable either at temporary or permanent shocks and labelled unfit for
forecasting and policy implications.
Thus, the presence of unit root at level triggered to perform the first difference
for all variables. After conducting the first difference test, all variables became
stationary and statistically significant at one per cent level of significance on
Im, Pesaran and Shin (IPS) Tests FISHER – ADF Tests
Level (trend
and intercept) First Difference
(intercept)
Level (trend
and intercept)
First Difference
(intercept)
Tobin’s Q -0.603
(0.273) (0)
-13.383***
(0.000) (1)
223.304
(0.015)(0)
544.982***
(0.000)(1)
ROA -0.272
(0.392) (1)
-9.442***
(0.000) (1)
185.497
(0.373)(0)
450.607***
(0.000)(1)
ROE -1.444
(0.074) (1)
-12.030***
(0.000) (1)
208.917
(0.069)(1)
516.283***
(0.000)(1)
X -0.081
(0.467)(1)
-7.323***
(0.000)(1)
167.316
(0.109)(1)
313.195***
(0.000)(1)
X2
-0.095
(0.462) (1)
-7.873***
(0.000) (1)
167.630
(0.106)(1)
321.777***
(0.000)(0)
FO -0.949
(0.171) (1)
-8.405***
(0.000) (1)
130.849
(0.988)(0)
383.425***
(0.000)(1)
FO*EFF -1.155
(0.123)(1)
-10.820***
(0.000)(1)
177.118
(0.546)(0)
480.219***
(0.000)(1)
LEV -0.745
(0.228)(1)
-10.427***
(0.000)(1)
209.607
(0.0646)(0)
462.147***
(0.000)(1)
SIZ -0.054
(0.478)(1)
-8.115***
(0.000)(1)
170.870
(0.675)
406.122***
(0.000)(1)
INV -0.369
(0.355)(1)
-17.297***
(0.000)(1)
203.573
(0.110)(1)
633.628***
(0.000)(1)
GROW -0.164
(0.434)(1)
-16.662***
(0.000)(1)
204.275
(0.103)(1)
660.162***
(0.000)(1)

134
both intercept and trends. Therefore, stationarity implies that data can sustain
any temporary or permanent shocks and any effects brought by shocks are
immersed and become part of the system. Thus, the data for this study can be
used for forecasting and policy implications. The small p-values were the basis
for detecting the presence of the unit root and stationarity.
Table 4.2 tells the presence of data stationarity for ownership structure, control
variables and corporate performance for 58 non-financial listed companies
among partner states of EAC. The existence of data stationarity furthered
examination of the long-run relationships using panel cointegration analysis.
4.3.3 The Results of Pedroni Cointegration Tests
The presence of data stationarity provides a cornerstone to examine the long-
run relationship between variables. The Pedroni cointegration tests were
employed because they take into accounts for the heterogeneity among
countries in EAC. The results for Pedroni tests are presented in Table 4.3.

135
Table 4.3: Pedroni Panel Cointegration Tests
Pedroni Tests Tobin’s Q ROA ROE
i. Panel v-Statistic
Individual Intercept and Trend
No Intercept or Trend
-3.838
(0.999)
-55.098
(1.000)
5.678***
(0.000)
-442.221
(1.000)
-46.620
(1.000)
-243.607
(1.000)
ii. Panel rho-Statistic
Individual Intercept and Trend
No Intercept or Trend
7.682
(1.000)
4.468
(1.000)
6.364
(1.000)
0.500
(0.691)
9.389
(1.000)
5.091
(1.000)
iii. Panel PP-Statistic
Individual Intercept and Trend
No Intercept or Trend
-13.232***
(0.000)
-5.316***
(0.000)
-16.174***
(0.000)
-15.614***
(0.000)
-16.485***
(0.000)
-14.117***
(0.000)
iv. Panel ADF-Statistic
Individual Intercept and Trend
No Intercept or Trend
-7.726***
(0.000)
-4.105***
(0.000)
-13.366***
(0.000)
-14.255***
(0.000)
-21.470***
(0.000)
-8.251***
(0.000)
v. Group rho-Statistic
Individual Intercept and Trend
No Intercept or Trend
10.417
(1.000)
7.665
(1.000)
10.596
(1.000)
6.824
(1.0000)
11.901
(1.000)
9.245
(1.000)
vi. Group PP-Statistic
Individual Intercept and Trend
No Intercept or Trend
-17.376***
(0.000)
-11.148***
(0.000)
-17.767***
(0.000)
-18.898***
(0.000)
-26.840***
(0.000)
-12.129***
(0.000)
vii. Group ADF-Statistic
Individual Intercept and Trend
No Intercept or Trend
-7.964***
(0.000)
-6.498***
(0.000)
-7.178***
(0.000)
-10.728***
(0.000)
-12.457***
(0.000)
-7.142***
(0.000)
Note: Null Hypothesis: No cointegration; p-values are in the brackets Automatic lag length
selection based on SIC. The asterisks *** implies significance of Null Hypothesis at 1%
significance level
The panel cointegration test is conducted on the ground that the existence of
data stationarity implies that data are cointegrated. Lee and Lin (2010) argued
that when data are stationary, it implies the presence of data cointegration just
like when corporate performance is related with ownership structure whereby
this association purports for making statistical inferences. Moreover, it is vital

136
to emphasise that the relationship between variables can deviate in short-run
but ultimately will recollect in the long-run (Lee, Lin, & Chang, 2011).
Referring to Table 4.3, the null hypothesis of no cointegration of four tests out
of seven Pedroni tests can be rejected in favour of the alternative hypothesis.
This implies that, variables have long-run relationship. The three measures of
Tobin’s Q, ROA and ROE presented in Table 4.3, have at least four tests out
of seven tests to reject the null hypothesis of no cointegration at one per cent
significance level. This implies that, - there is an existence of stable long-run
relationship of the variables for listed companies in EAC.
4.4 Regression Results of GMM Estimator
The use of GMM was justified earlier in chapter three for its proficiency on
generating consistent and unbiased estimates. The superiority of GMM over
other technique comprises the way it overcomes the consequences of rejecting
the true hypothesis or rejecting the false hypothesis.
The lagged performance is included in the GMM as instrument to account for
a problem of unobserved heterogeneity. This means that it is necessary for the
instrumental variables to be included in the GMM model. The ownership
concentration is endogenously determined and that problem of endogenous
should be taken into account. Thus, the regression results for this study are
discussed in the following sub-sections.

137
4.4.1 Linear Relationship between Ownership Concentration and
Corporate Performance
This study examined the linear relationship between ownership concentration
and corporate performance for 58 non-financial listed companies in EAC. The
purpose was to ascertain the claims that under weak rules and regulatory
framework, the ownership concentration would result into expropriation by
majority shareholders at the expenses of minority shareholders.
The regression output for linear relationship between ownership concentration
and corporate performance is presented in Table 4.4. Meanwhile, the first and
foremost explanation highlights the lagged dependent variables.
According to Table 4.4, results show that lagged dependent variables for
accounting and market performance measures are statistically significant at
one per cent significance level. Moreover, the validity of instruments are
justified by the probabilities for J-statistics because they are above 10 per cent
for accounting and market performance measures (Roodman, 2009a). The
statistical significance of lagged variable and the probabilities of J-Statistics
which is above 0.1 suggest that instrumental variables attached with the GMM
are valid and offer stable estimates for reporting consistence and unbiased
results. This is in line with Flannery and Hankins (2013); Law and Azman-
Saini (2008); Wintoki et al. (2012).
Thus, premised with the above findings, it can be argued that the empirical
results that are attached with this study are appropriate for making statistical

138
inferences. Moreover, one lagged performance was used because it is
contended to be appropriate to capture the effect of past towards current
performance. This is in line with Nguyen et al. (2015); Roodman (2009a);
Zhou et al. (2014).
Table 4.4: Linear Relationship between Ownership Concentration and
Corporate Performance
Dependent variable
Tobin’s Q ROE ROA
Variable Coefficie
nt
Test
Statistics
Coefficie
nt
Test
Statistics
Coeffici
ent
Test
Statistics
Performance (-1)
0.227 13.86***
(0.000)
-0.229
-81.47***
(0.000)
-0.276
-11.72***
(0.000)
X -0.588 -5.58***
(0.000)
-0.071
-4.83***
(0.000)
-0.778
-14.87***
(0.000)
SIZ 0.259 9.68***
(0.000)
-0.089
-14.05***
(0.000)
-0.266
-12.59***
(0.000)
LEV -0.233 -1.81*
(0.071)
-0.206
-31.95***
(0.000)
-0.177
-5.13***
(0.000)
INV 0.040 3.67***
(0.000)
0.037
31.67***
(0.000)
0.052
4.315***
(0.000)
GROW 0.264 16.88***
(0.000) 0.023
13.99***
(0.000)
0.200
15.47***
(0.000)
Cross-section fixed (first differences)
S.E. of Regression 0.511 0.118 0.235
J - Statistics 29.054 39.761 38.598
Prob(J – Statistics) 0.113 0.163 0.135
Note: The asterisks ***, ** and * imply significant at 1%, 5% and 10% level of significant
respectively; Dynamic panel data are reported with test statistics of t-statistics where p-values
are in parentheses. The notation: Performance (-1) = lagged performance, X = Ownership
concentration, LEV = Leverage, SIZ = Firm Size, INV = Investment, GROW = Growth.
7 Table 4.3 is based on regression model ititiitit ZXY 10
Where itY stands for Tobin’s Q, ROE and ROA, itZ stands for control variables, it is an
error term.

139
4.4.1.1 Accounting Performance Measures
This study employs the return on equity (ROE) and return on assets (ROA) as
the accounting performance measures. Results presented in Table 4.3 reveal
that the coefficient for ownership concentration is negative and statistically
significant determinant of ROE and ROA at one per cent significance level.
The negative coefficients imply that ownership concentration has significant
deterioration on corporate performance in EAC. This is to say that, majority
shareholders pursue their private benefit of control by diverting company’s
assets at the expense of the minority shareholders.
Thus, increasing of one per cent in ownership concentration deteriorates ROE
and ROA by 0.071 per cent and 0.778 per cent respectively. The negative
relationship between concentrated ownership and corporate performance shed
lights that the horizontal conflict between majority and minority shareholders
interests’ thereafter principal-principal conflict is pervasive among listed
companies in partner states of EAC. The conflict arises because majority
shareholders exercise excessive power by diverting company’s assets at the
expenses of minority shareholders.
The negatively and statistically significant correlation between ownership
concentration and corporate performance is in line with the findings of Ongore
(2011) who concluded on significant negative relationship between ownership
concentrated and corporate performance among listed companies at Nairobi
Securities Exchange (NSE) in Kenya. Moreover, the result coincides with the

140
findings that were published by Doing Business (2015) the agent of the World
Bank that, weak legal and regulation frameworks in developing economies
including partner states of EAC constitute weak protection of minority
shareholders. Therefore, the weak protection of minority investors constitutes
the negative impacts toward the financial market developments which in turn
frustrate the economic growth at the country and the company level.
The ownership concentration which is an ingredient of internal mechanism is
the determinant of corporate governance. Ownership concentration functions
well under the supervision of the board of directors, and the board of directors
functions well under established institutions. One of the obstacles facing the
partner states of the EAC is weak institutional quality. The laxity to enforce
institutional quality constitutes weak functional corporate governance
practices. Thus, the ownership and control of the company are driven by
majority shareholders. The majority shareholders capitalise on this weakness
to expropriate company assets which in turn may cause companies to collapse.
This negative and statistically significant relationship between ownership
concentration and performance is in line with (La Porta, Lopez-de-Silanes,
Shleifer, and Vishny, 2000, 2002; Yartey and Komla, 2007; Young, Peng,
Ahlstrom, Bruton, and Jiang, 2008). These authors argued that the horizontal
conflicts in emerging economies are caused by divergence of interests between
controlling shareholders and minority shareholders. The expropriation by
controlling shareholders deteriorates firms’ performance. Alongside with ROE
and ROA, Bhagat and Bolton, (2009); Maher and Andersson, (1999)

141
concluded that better corporate governance stimulate corporate performance
whereas weak corporate governance discourage corporate performance.
This study included four control variables. These variables include the firm
leverage. The results show that leverage has negative coefficients. The
negative coefficient is statistically significant determinant of ROE and ROA at
one per cent significance level. Leverage is argued to be the sign of the
company creditworthy. This study measures leverage using total debts that
embrace short term debt and long term debt. Note that, short term debts are
intended to meet working capital requirements whereas long term debts are
employed to meet investment requirements.
Thus, the negative relationship connotes the vein that several firms in EAC
prefer short term debts. The preference for short term debts emanates from the
higher costs that attached to debts. This argument is in line with Kodongo,
Mokoaleli-Mokoteli, and Maina (2015); Makoni (2014) who pointed out that
the cost of debts in EAC is very high because financial markets are small for
bond markets to be active.
Therefore, the high costs of debt among partner states of EAC constitute
negative and significant effect between leverage and performance. In general,
high cost of debt in EAC prompts companies to employ short term debts and
rely on internal financing which are presumed to be cheaper than external
financing. This result is in line with study that was carried among the partner
states of EAC by Ayako, Kungu, and Githui (2015); Mwangi, Makau, and
142
Kosimbei (2014) who concluded that preference of equity financing is
associated with higher cost of debt (Kodongo et al., 2015; Makoni, 2014).
Thus, an increase of one per cent of leverage implies weakening the corporate
performance by 0.206 per cent and 0.177 per cent of ROE and ROA
respectively.
Moreover, the negative relationship between leverage and firm performance
implies that leverage does not improve corporate performance in the region
which is overwhelmed by poor protection of minority investors (González,
2013). The negative relationship between leverage and corporate performance
is in line with Haniffa and Hudaib (2006) who reported significant negative
relationship between leverage and performance.
Furthermore, the pecking order theory states that leverage generates negative
effect on corporate performance (Myers, 1984; Myers & Majluf, 1984).
Additionally, the negative relationship could also justify the concern by vast
literatures that annual reports for low leveraged companies do not disclose
detailed information of their companies which signify lack of transparency
(Adelopo, 2011; Broberg, Tagesson, & Collin, 2010).
The firm size is another control variable that was included in this study. The
results show that firm size is negative and statistically significant to corporate
performance at one per cent significance level. The negative relationship was
unanticipated because smaller firms are well associated with the ability to

143
attract predictors and investor pessimism for their alleged inability, ceteris
paribus, maintains sufficient future cash flows.
The results suggest that listed companies among partner states in EAC
whereby majority are small sized incur higher costs to exploit the economies
of scale. This is true for many countries along the SSA region (Munisi &
Randøy, 2013; Okpara, 2011). These companies are deficient to absorb
resources necessarily for superb corporate performance and thus, they require
injection of the expertise and experience for efficacy performance. It is worth
to note that, larger companies are acknowledged to be well-organised than
smaller companies. The market power for small firms does not guarantee them
an entrée to capital markets; as a result they have limited access to exploit
potential investment opportunities essentially to expand their investment
horizon for higher performance (Yasuda, 2005).
Therefore, any change of the company size by one per cent deters ROE and
ROA by 0.089 per cent and 0.267 respectively. The negative and statistically
significant relationship coincides with Makoni (2014) who argued that small
firms among partner states in EAC, particularly Tanzania depend on internal
and retentions for financing. Moreover, these companies are characterised by
erratic historical performance and limited collaterals which are obstacles to
access external sources from financial institutions. Premised with the above
observation, it was argued that internal financing is the dominant form of
financing (about 78 per cent) employed by firms in SSA region (Makoni,
2014). This argument is consistent with the view that firms which employ
144
short term debts in their financing mix generate lower firm performance
(Zeitun & Tian, 2007).
Another control variable for this study is investment ratio. This variable has
positive and statistically significant with ROE and ROA respectively. The
term investment explains the ability of the company to use capital (capital
expenditure) to acquire new investments in property and equipment. Table 4.3
shows that any alteration of 1 per cent in investment increases ROE and ROA
by 0.037 per cent and 0.052 per cent respectively. This is true because it is less
likely for majority shareholders to jeopardise valuable investments undertaken
in previous years.
The positive relationship between investment and corporate performance is in
line with Durnev and Kim (2005) who argued that investment opportunities
are more valuable in weaker regulatory systems. Thus the significant positive
relationship implies that capital expenditures enhance the prospective future
returns of firms in EAC as hypothesised by prior studies including Akbar,
Poletti-Hughes, et al. (2016); Chen et al. (2010); Lang et al. (1989).
Similarly, growth opportunity which is assessed based on the current and
previous sales have positive and significant impact on company performance.
This means that an increase by one per cent of sales increases ROE and ROA
by 0.023 per cent and 0.200 per cent respectively. This implies that regardless
of the size, companies are capable of generating reasonable year to year sales.
The year to year sales emanate from investments undertaken previously. In
145
general, this result is the consequence of the positive relationship between
capital expenditure and corporate performance. Majority of listed companies
showed attractive year to year sales growth which is good indication for
growth. This finding is in line with Claessens et al. (2002); Durnev and Kim
(2005); Gompers et al. (2003).
4.4.1.2 Market Performance Measures by Tobin’s Q
Given that the accounting performance measures concentrates on what the
management has accomplished namely backward-looking, the market
performance measures concentrates on what the management need to
accomplish referred to the forward-looking.
Based on Table 4.3, the result shows that ownership concentration is negative
and statistically significant with Tobin’s Q at one per cent significance level.
The negative and statistically significant coefficient of ownership
concentration was reported for accounting performance measures. Thus, an
increase by one per cent of ownership concentration deteriorates Tobin’s Q by
0.588 per cent. This implies that the market perceives performance to be well
explained by dispersed shareholders than with concentrated shareholders. This
is because concentrated ownership is associated with principal-principal
conflicts which in turn necessitate higher monitoring costs and thus accruing
higher risks. The significant negative effect of majority shareholders on
market performance is attached with conflicts between majority and minority

146
shareholders (Demsetz & Lehn, 1985; Pound, 1988; Thomsen, Pedersen, &
Kvist, 2006).
Moreover, the expropriation by majority shareholders creates negative image
in the eyes of potential investors who withhold intensive capital; as the result,
it obstructs the growth of stock markets. Challenges facing growth of stock
markets among the partner states in EAC include, insufficient capital, that is,
limited liquidity which is associated with low market capitalisation (EAC,
2015b). It is widely established that developed capital markets is significant
determinant of the firm growth and the economic growth.
The extent of majority shareholders to divert company assets at the expense of
minority shareholders justifies the contention that protection of minority
shareholders in EAC is still an enigma. When compared with other developing
markets, the Doing Business (2015) ranked the Sub-Saharan Africa including
the EAC the lowest score of 4.6 out of 10 on the strength to protect minority
shareholders as evidenced in highlighted in Table 1.4.
All the control variables have similar effect as those reported by accounting
performance measures except for firm size which turned out to be positive and
statistically significant at one per cent significance level. Positive significant
relationship between firm size and Tobin’s Q implies that the market perceives
small sized companies impacts corporate performance by taking advantages
emanating from economic changes because of the possibility of these firms to
be flexibly to restructure. Moreover, the market performance is reflected by
147
the potential investment opportunities that influence performance. This finding
is in line with Bhattacharyya and Saxena (2009). Thus, increasing one per cent
of firm size will significantly stimulate market performance by 0.259 per cent.
The growth opportunity has positive and significantly correlation with Tobin’s
Q. This implies that growth and Tobin’s Q are complementary because
Tobin’s Q is a measure of growth opportunities. The situation in EAC is that
there is aspiration for listed companies to grow and there is greater need for
external financing to capture investment opportunities which in turn should
facilitate standard corporate governance practices (Klapper & Love, 2004a).
Thus, an increase by one per cent in growth opportunity will enhance
corporate performance by 0.264 per cent. Moreover, the relationship between
growth and Tobin’s Q justifies that growth opportunities are the cause rather
than the consequences of governance structure. The finding of this study is in
line with Francis, Hasan, and Wu (2013); Tobin (1969); Wintoki et al. (2012).
The negative and significant relationship between leverage and Tobin’s Q
implies that the market perceives the existence of closeness between
companies and lenders does not enhance corporate performance. Thus, an
increase of one per cent on leverage deteriorates company performance by
nearly 0.233 per cent as measured by the Tobin’s Q. This finding implies that
the undeveloped financial markets in EAC constitute higher costs to acquire
external financing from financial institutions. In general, companies desire
internal financing and retentions in their financing structure.

148
The negative relationship concur with measures required to amend weak
corporate governance such that equity should replace debt for growth (Reed,
2002). The negative and statistically significant of leverage and Tobin’s Q is
in line with Pamburai, Chamisa, Abdulla, and Smith (2015); Weir, Laing, and
Mcknight (2002).
The next subsection examines the consequences of increased ownership
concentration towards corporate performance. The monitoring and controlling
effects are explained by cash flows right. Thus, there is a need to examine the
outcome to corporate performance when ownership concentration increases to
certain degree. Thus, squaring the ownership concentration necessitated to
examine the presence of nonlinear relationship.
4.4.2 Monitoring and Expropriation effect of Ownership Concentration
The weak legal and regulatory platforms are the main sources for concentrated
ownership resulting into horizontal problems. The results from the preceding
sub-sections argued that private benefits of control are incentives for majority
shareholders to divert firm assets at the expense of minority investors.
It was stated in chapter three that the squared ownership concentration can
justify the monitoring and expropriation conduct for the principal-principal
problem (McConnell & Servaes, 1990; Morck et al., 1988; Shleifer & Vishny,
1997). Thus, the nonlinear relationship between ownership concentrated and
corporate performance is reported in Table 4.5.

149
Table 4.5: Nonlinear Relationship between Ownership Concentration and
Corporate Performance8
Dependent variable
Tobin’s Q ROE ROA
Variable Coefficie
nt
Test
Statistics
Coefficie
nt
Test
Statistics
Coefficie
nt
Test
Statistics
Performance (-1)
0.351 2.232**
(0.026) 0.319
16.103***
(0.000) -0.285
-11.6***
(0.000)
X -8.745 -1.962*
(0.051) -0.996
-3.602***
(0.004) -0.891
-2.79***
(0.005)
X2 4.578
2.097**
(0.037) 0.481
3.516***
(0.005) 0.472
2.99***
(0.003)
SIZ 0.364 7.811***
(0.000) -0.003
-2.100**
(0.037) 0.009
2.48**
(0.014)
LEV -0.325 -2.037**
(0.043) 0.062
4.054***
(0.001) 0.053
8.103***
(0.000)
INV 0.038 1.383
(0.168) 0.004
1.260
(0.209) 0.018
13.17***
(0.000)
GROW -0.045 -2.63***
(0.009) 0.037
8.663***
(0.000) 0.011
4.22***
(0.000)
Cross-section fixed (first differences)
S.E. of Regression 0.657 0.035 0.031
J - Statistics 20.336 24.660 25.797
Prob (J – Statistics) 0.257 0.172 0.173
Note: The asterisks ***, ** and * imply significant at 1%, 5%, 10% level of significant
respectively. Dynamic panel data are reported with test statistics of t-statistics where p-values
are in parentheses. The notation: Performance (-1) = lagged performance, X = Ownership
concentration, X2 = squared ownership concentration, LEV = Leverage, SIZ = Firm Size, INV
= Investment, GROW = Growth.
The results presented in Table 4.5 reveal that the lagged ROE has changed to
positive as compared to result in Table 4.4 where it was negative. Also, results
show that the lagged ROA declines negatively from Table 4.4 to 4.5. The
result for higher ROE is in line with the DuPont financial analysis model
which asserts that ROE is related with ROA by equity multiplier (financial
leverage). The square ownership concentration indicates that firms are more
financed by shareholder’s equity than debt financing which results into lower
8 Table 4.4 is based on the regression model ititiititit ZXXY 2
210
Where itY stands for Tobin’s Q, ROE and ROA, itZ stands for control variables, it is an
error term.

150
ROA. By the same margin of increased shareholders’ equity and lowering
liability, the ROE increases (Bodie, Kane, & Marcus, 2014).
The coefficient for ownership concentration is negative whereas the
coefficient for square ownership concentration is positive. The negative and
positive results are statistically significant at one per cent significance level for
the accounting performance measures and the market performance measures.
The positive and significant coefficients for the squared ownership
concentration on performance measures demonstrate existence of U-shaped
relations between ownership concentration and firm performance among
publicly listed firms in partner states of EAC.
The U-shape relationship implies that,- as concentration ownership exceeds
certain threshold, the entrenchment effect declines as the consequence of cash
flows right and thus, interests of all stakeholders become compromised.
Additionally, the U-shaped relationship suggests the trade-off and efficiency
between expropriation and monitoring behaviour respectively. Some literature
argues that higher scope of ownership concentration promotes superior
corporate performance because at this level of ownership the private costs of
control are higher than private benefits (Chen, Ho, Lee, & Shrestha, 2004;
Filatotchev et al., 2013; Hu & Izumida, 2008; Nguyen et al., 2015).
Thus, majority shareholders tend to expropriate minority investors at low level
of ownership concentration and incentives are achieved by exercising the
monitoring role when ownership concentration increases. Moreover, when

151
level of ownership concentration increases the interest-alignment effect is
achieved by protecting all shareholders and attaining company’s objectives.
These results imply that an increase by one per cent in squared ownership
concentration, ROE and ROA increases by 0.481 per cent and 0.472 per cent
respectively. Moreover, another implication from this result is that any
increase in the level of squared ownership concentration generates a total net
effect of 0.996 - 0.481 = 0.515 per cent for ROE and 0.891 – 0.472 = 0.419
per cent for ROA while the total net effect generated by Tobin’s Q is 8.745 –
4.578 = 4.167 per cent.
In any context, the ability to maintain this level of performance bears a spill
over benefit of creating steady interest-alignments for all shareholders. To
maintain interest-alignments for all stakeholders, controlling shareholders in
conjunction with the management are required to reduce the degree of earning
management. There are empirical evidences which suggest that earnings
management pose negative impact to minority shareholders. The earnings
management has been reported to prevail among the listed companies in the
partner states of the EAC (Waweru & Riro, 2013).
The positive and statistically significant relationship on squared concentration
ownership and corporate performance is in line with Bai, Qiao, Joe, Song, and
Junxi (2004); Ding, Zhang, and (Zhang,) 2007; Hu and Izumida (2008); Tian
(2001). These authors pointed out that the problem associated with private
benefit of control can be improved to enhance performance provided that
concentrated ownership is increased at a certain level. Thus, the consequence

152
of squared ownership concentration to excite superior performance boosts the
attitude and confidence of the minority shareholders to vote with hearts than
with feet.
Likewise when Tobin’s Q is applied, the squared ownership concentration is
positive and statistically determinant of corporate performance at five per cent
significance level. Initially an increase by one per cent in the ownership
concentration would deteriorate corporate performance by -8.745 per cent.
Meanwhile, an increase in squared concentration ownership by one per cent
would enhance corporate performance by 4.578 per cent. This result implies
that when ownership concentration is sufficiently large, the corporate
performance as measured by Tobin’s Q increases with an increased ownership
concentration. The finding of this study is consistent with results reported by
Cheung, Jiang, Limpaphayom, and Lu (2008); Tian (2001).
This increase which is interpreted as squared ownership concentration will
exacerbate incentives to extract private benefit of control because at this level
of ownership which is associated with cash flow rights makes the costs of
control to be higher than benefits of control (Lozano et al., 2015). Thus, the
squared ownership concentration impacts corporate performance positively.
The next subsection of this study incorporates the idea from the resource
dependency theory which says enlarging ownership structure offers significant
impact towards corporate performance. Thus, foreign ownership is
incorporated in the model and examines its effect on corporate performance.

153
4.4.3 Foreign Ownership and Corporate Performance
The presence of foreign ownership among the listed companies in EAC should
be the catalyst to promote corporate performance. Superior corporate
performance is expected to be in favour of all shareholders because of the
interest alignments and more essentially the company objectives will be
achieved. However, performance of foreign ownership can be highly excited
with friendly and conducive working environment of the host country.
The analysis for the foreign ownership and corporate performance is based on
the GMM regression output displayed in Table 4.6.

154
Table 4.6: Foreign Ownership and Corporate Performance9
Dependent variable
Tobin’s Q ROE ROA
Variable Coefficie
nt
Test
Statistics
Coefficie
nt
Test
Statistics
Coefficie
nt
Test
Statistics
Performance (-1)
0.197 5.792***
(0.000) -0.257
-7.759***
(0.000) -0.180
-11.80***
(0.000)
X -0.452 -3.228***
(0.001) 0.108
4.167***
(0.000) -0.015
-4.31***
(0.000)
FO 0.281 7.687***
(0.000) 0.071
5.244***
(0.000) 0.003
8.27***
(0.000)
SIZ 0.073 1.186
(0.236) -0.189
-15.04***
(0.000) 0.007
3.67***
(0.003)
LEV -0.532 -4.941***
(0.000) -0.142
-6.755***
(0.000) 0.033
13.99***
(0.000)
INV 0.082 4.052***
(0.001) 0.022
5.439***
(0.000) 0.016
20.69***
(0.000)
GROW 0.185 8.781***
(0.000) 0.042
3.235***
(0.001) 0.022
14.69***
(0.000)
Cross-section fixed (first differences)
S.E. of Regression 0.522 0.122 0.029
J - Statistics 29.623 28.343 30.578
Prob(J – Statistics) 0.100 0.246 0.105
Note: The asterisks ***, ** and * imply significant at 1%, 5%, and 10% level of significant
respectively. Dynamic panel data are reported with test statistics of t-statistics where p-values
are in parentheses. The notation: Performance (-1) = lagged performance, X = Ownership
concentration, FO = Foreign Ownership, LEV = Leverage, SIZ = Firm Size, INV =
Investment, GROW = Growth.
The introduction of foreign ownership in the model offers explanation to the
ownership concentration and foreign ownership itself. Thus, the discussion of
ownership concentration on corporate performance will be sequentially
followed by the discussion of foreign ownership on corporate performance.
The coefficients for concentrated ownership for Tobin’s Q, ROE and ROA
measures are negative, positive and negative respectively. The coefficients are
9 This table 4.6is based on regression model
ititiititit ZFOXY 210
Where itY stands for Tobin’s Q, ROE and ROA, itZ stands for control variables, it is an
error term.

155
statistically significant determinants of corporate performance at one per cent
significance level. The introduction of foreign ownership in the model has
impacted the magnitude of ownership concentration. Results in Table 4.6
show that the magnitude for ownership concentration to worsen performance
has significantly declined for Tobin’s Q and ROA. Meanwhile, the ownership
concentration and ROE are positive and significantly correlated to imply that
convergence of interest. The essential feature is that, - when the foreign
ownership was introduced in the model the deterioration scale of ownership
concentration dropped significantly.
Thus, the magnitude for ownership concentration to deter company assets has
dropped significantly for Tobin’s Q and ROA whereby the net effect achieved
for Tobin’s Q is -0.452 – (-0.588) = 0.136 per cent; ROA is -0.015 – (-0.778)
= 0.763 per cent. Meanwhile, the extent for majority shareholders to
expropriate minority shareholders has been dazed by foreign ownership when
performance is measured by ROE. Thus, ROE has achieved the net effect of
0.108 – (-0.071) = 0.179 per cent. This implies that the presence of foreign
ownership mitigates the extent at which majority shareholders expropriate
company assets at the expense of minority shareholders.
On the other hand, the coefficients for foreign ownership are positive and
statistically significant at one per cent significance level. Thus, an increase of
one per cent in foreign ownership improves corporate performance by 0.281
per cent, 0.003 per cent and 0.071 per cent when performances are measured
by Tobin’s Q, ROA and ROE respectively. This result implies that protection

156
of minority shareholders among partner states in EAC can be achieved when
ownership structure is diversified. This argument is in line with the resource
dependency theory that encompassing the ownership structure through foreign
ownership which has positive and significant impact towards corporate
performance. The finding of this study is in line with Aggarwal et al. (2011);
Douma et al. (2006); Peng and Jiang (2010); Randøy and Goel (2003); Young
et al. (2008).
According to resource dependency theory (RDT), the presence of foreign
investors in domestic firms promote monitoring role which in turn provide the
likelihood for protection of minority investors (Bjuggren et al., 2007; S. Lee,
2008). However, friendly environment for foreign investors should be efficient
for them to execute maximum efficiency. It is ascertained that conducting
business in corrupt environments encompasses higher transaction costs
(Munisi et al., 2014; Rwegasira, 2000).
The next subsection of the study examines the average efficiency scores for
listed locally owned firms and firms with composition of foreign ownership.
This study also employs efficiency score to examine how efficiency stimulates
foreign ownership towards corporate performance. This involves developing
the interactive variable between foreign ownership and efficiency scores.

157
4.4.4 Efficiency scores for Locally Owned Companies and Companies
with Foreign Ownership
Efficiency scores were calculated using DEA technique. Then average
technical efficiency scores were estimated for each year and presented in
Figure 4.1. These averages of efficiency scores were calculated by taking the
summation of scores in a particular year, divide by number of companies. The
estimation of the average scores for each year was guided by the following
estimate
ij
n
ji
tij
tN
EFF
EFF
1,
Where: tEFF is the average efficiency score in a particular year ― t ‖,
tijEFF is the total efficiency scores in a particular year and ijN is the total
number of either thi firms (locally owned companies) or thj firms (foreign
owned companies) in a particular year.
Figure 4.1 reports the average of the efficiency scores for locally owned and
foreign ownership. Because the decision making units (DMUs) among the
partner states of EAC are not at optimal scale and the capital markets are
underdeveloped, the variable return to scale (VRS) was employed. It is worth
to note that constant return to scale (CRS) was not appropriate in this study
because of the requirement that the DMUs should be operating under the
optimal scale (Avkiran, 2006; Ramanathan, 2003). Note that, - the efficiency
score of zero implies DMU is inefficient while one implies efficient DMU.

158
Figure 4.1: Trends for Average Efficiencies of Foreign Ownership and
Local Ownership in EAC
The efficiency scores for companies that accommodate foreign ownership are
higher than locally owned firms. The trend shows that on average each year
since 2007 through 2015, the efficiency score for foreign owned firms are
higher than locally owned firms. This means that, foreign ownership
constitutes management know-how, skilled labour and monitoring by adhering
on standard corporate governance practices. This finding is in line with
Aggarwal et al. (2011); Foster-Mcgregor et al. (2015); Huang and Shiu
(2009); Willmore (1986). These authors argued that companies which embrace
foreign investors in their ownership have advantages that emanates from
investment capital, access to foreign market, management skills and they are
more efficient compared to the locally owned firms.
0.000
0.100
0.200
0.300
0.400
0.500
0.600
0.700
0.800
0.900
2007 2008 2009 2010 2011 2012 2013 2014 2015
Eff
icie
ncy
sco
res
Local Foreign

159
On average the efficiency scores for companies with foreign ownership are
higher than locally owned firms. This could have been contributed by special
package available to foreign investors. However, the initial reforms of
business regulatory environment constitute significant impact towards
efficiency of foreign ownership. Thus, on-going reforms in legislative and
regulations in Rwanda and Kenya provide the platform for foreign ownership
to excel firm performance. Doing Business, an agent of the World Bank has
esteemed efforts commenced by Rwanda to reform and enforce institutional
regulations that continuously facilitate ease of doing business for foreign
investors (Chakra & Kaddoura, 2015; CPIA Africa, 2016; Gui-Diby, 2014).
Moreover, foreign ownership has tendency to improve efficiency as time goes
on compared to locally owned firms. This is because when foreign ownership
accommodates efficiency, corporate performance increases. Previous studies
confirmed that foreign ownership enjoyed superior productivity after at least
three years of operations because of the financial resources injected into a
company (Chari, Chen, & Dominguez, 2012a).
In general, companies that accommodate foreign investor in their jurisdiction
outperform the locally owned firms by developing promotion investment
benefits (Aggarwal et al., 2011; Peng & Jiang, 2010; Young et al., 2008). It is
widely accepted that foreign institutions are more efficient than domestic
institutions because foreign ownership adheres to best practices (Barney et al.,
2001; Douma et al., 2006; Hillman & Dalziel, 2003; Kinda, 2012).

160
Moreover, foreign ownership provides spill over benefit to the domestic
owned firm by creating competitive environment and transfer of know-how.
This means that the presence of foreign ownership can promote the crowding-
in effect to domestic companies and thus improve corporate performance
(Foster-McGregor et al., 2015).
4.4.5 Interaction of Foreign Ownership and Efficiency Scores on
Corporate Performance
It was noted that the presence of foreign ownership improved the corporate
performance of the listed companies in EAC. However, as stated earlier in
chapter two that foreign ownership neither brings miracles nor should it be
considered as the therapy for problems facing the EAC.
Explicitly, the constructive business environments excite foreign ownership
with opportunity to excel efficiency of corporate performance. Therefore, this
study introduces the interactive variable (efficiency score * foreign ownership)
to evaluate the ability of efficiency scores to stimulate foreign ownership
towards superior corporate performance. The results for interaction variable
and corporate performance are reported in Table 4.7.

161
Table 4.7: Interaction between Efficiency Score and Foreign Ownership10
Dependent variable
Tobin’s Q ROE ROA
Variable Coefficie
nt
Test
Statistics
Coefficie
nt
Test
Statistics
Coefficie
nt
Test
Statistics
Performance (-1)
0.214 2.214**
(0.027) 0.200
7.707***
(0.000) -0.152
-11.92***
(0.000)
X 0.787 0.981
(0.327) 0.019
3.558***
(0.001) 0.033
6.62***
(0.000)
FO -0.223 -0.166
(0.868) -0.024
-9.25***
(0.000) -0.054
-27.89***
(0.000)
FO*EFF 0.047 0.036
(0.971) 0.032
12.85***
(0.000) 0.082
46.85***
(0.000)
SIZ 0.320 1.358
(0.175) -0.020
-10.9***
(0.000) 0.008
4.98***
(0.000)
LEV -0.417 -0.707
(0.480) -0.009
-0.70***
(0.484) 0.041
20.64***
(0.000)
INV 0.248 2.649***
(0.008) 0.005
2.572**
(0.011) 0.019
13.02***
(0.000)
GROW 0.182 1.483
(0.139) 0.029
12.68***
(0.000) 0.017
17.48***
(0.000)
Cross-section fixed (first differences)
S.E. of Regression 0.653 0.024 0.037
J - Statistics 26.517 26.946 22.867
Prob (J – Statistics) 0.187 0.213 0.351
Note: The asterisks *** and ** imply significant at 1% and 5% level of significant
respectively. Dynamic panel data are reported with test statistics of t-statistics where p-values
are in parentheses. The notation: Performance (-1) = lagged performance, X = Ownership
concentration, FO = Foreign Ownership, FO*EFF = interactive term, LEV = Leverage, SIZ =
Firm Size, INV = Investment, GROW = Growth.
Basing on Table 4.7, the analysis for interaction term which is an interaction
between efficiency scores and foreign ownership offers different insights on
accounting performance measures and market performance measures as
reported in the sub-sections underneath. Note that, the main focus here is
directed on the ability of efficiency to boost foreign ownership and also the
impact it brings on ownership concentration towards performance.
10
Table 4.6 is based on the regression
ititiititit ZEFFFOFOXY )*(3210
Where itY stands for Tobin’s Q, ROE and ROA, itZ stands for control variables, it is an
error term.

162
4.4.5.1 Accounting Performance Measures
Table 4.7 reveals that ownership concentration and corporate performance
measures are positive and statistically significant at one per cent significance
level. This implies that introduction of efficiencies in the model rejuvenates
ownership concentration for superb performance. The reason is that efficiency
scores have impacted foreign ownership to impart and implement proper
corporate governance practices. Efficiency implies that foreign investors are
able to intervene and utilizes the management skills, awakening the R&D
activities and vitalises the firm to produce competitive products at low cost.
The interactive term of foreign ownership and efficiency implies that foreign
ownership is linked with less information asymmetry hence proper conduct of
corporate governance practices because ownership concentration has become
part of working system. Therefore, an increase of one per cent in ownership
concentration increases corporate performance measures of ROA and ROE by
0.033 per cent and 0.019 per cent respectively. Because efficiency seems to
excite foreign ownership, it is expected that company objectives will be
achieved and the horizontal conflicts are mitigated.
Moreover, an increase of one per cent in interactive term of EFFFO *
increases corporate performance measures of ROA and ROE by 0.082 per cent
and 0.032 per cent respectively. The significant positive effect of efficiencies
on the relationship between foreign ownership and corporate performance
signals the importance of quality institution and regulations for provision of

163
friendly business environment that ease doing business. This implies that
foreign ownership is attached with superior monitoring role, disciplinary role
and operating ability. These results are consistent with Ali et al. (2010);
Buchanan et al. (2012); R. Chen et al. (2014); Doing Business (2015); Gui-
Diby (2014).
Furthermore, the results show that when efficiency scores were interacted with
foreign ownership, foreign ownership variable converted to negative and
statistically significant at one per cent significance level. This impact has
made the corporate performance declined by 0.054 per cent and 0.024 per cent
for ROA and ROE respectively. This decline can be explained that a certain
degree of local ownership is required for optimal output. This result is in line
with Greenaway et al. (2014). The fundamental backup for the efficiency to
stimulate foreign ownership is based on the disciplinary and monitoring roles
played by foreign investors because the monitoring benefits are far higher than
the monitoring costs (Bae, Min, & Jung, 2011; Chen, Harford, & Li, 2007;
Lien, Tseng, & Wu, 2013).
Therefore, given the importance of efficiency to stimulate the relationship
between foreign ownership and corporate performance the threshold for the
value of efficiency for optimal performance created by foreign ownership can
be determined. For ROA, the minimum efficiency score to affect the
relationship can be calculated mathematically as follows:
itittiit ZEFFOFOXROAROA )*(082.0054.0033.0152.0 1,
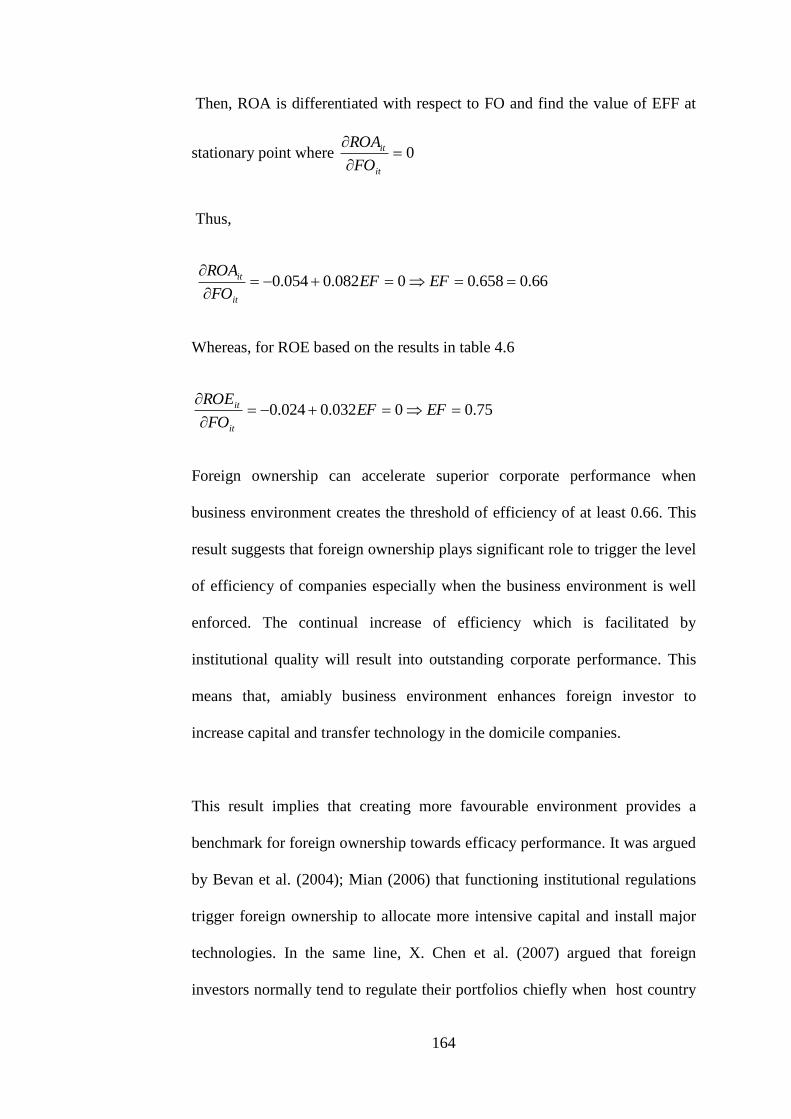
164
Then, ROA is differentiated with respect to FO and find the value of EFF at
stationary point where 0
it
it
FO
ROA
Thus,
66.0658.00082.0054.0
EFEF
FO
ROA
it
it
Whereas, for ROE based on the results in table 4.6
75.00032.0024.0
EFEF
FO
ROE
it
it
Foreign ownership can accelerate superior corporate performance when
business environment creates the threshold of efficiency of at least 0.66. This
result suggests that foreign ownership plays significant role to trigger the level
of efficiency of companies especially when the business environment is well
enforced. The continual increase of efficiency which is facilitated by
institutional quality will result into outstanding corporate performance. This
means that, amiably business environment enhances foreign investor to
increase capital and transfer technology in the domicile companies.
This result implies that creating more favourable environment provides a
benchmark for foreign ownership towards efficacy performance. It was argued
by Bevan et al. (2004); Mian (2006) that functioning institutional regulations
trigger foreign ownership to allocate more intensive capital and install major
technologies. In the same line, X. Chen et al. (2007) argued that foreign
investors normally tend to regulate their portfolios chiefly when host country

165
facilitate amicable business environment. Thus, foreign owners promote
corporate governance practices necessary for protection of minority
shareholders (Aggarwal et al., 2011; Huang & Shiu, 2009).
The efficiency created by foreign ownership is also contributed by the ability
of foreign investors to replace inefficient management with efficient one. This
replacement provides the company with an opportunity to fully execute the
operating ability. Moreover, the foreign owners employ more expertise and
high skilled labour to facilitate the standard corporate governance practices.
Thus, the consequence of the interaction enhances efficiency corporate
performance and the spill over benefits for protection of minority
shareholders. In turn, the protection of minority investors promotes capital
market developments and economic outcomes in terms of the country and
company levels.
4.4.5.2 Market Performance Measures
The market performance as measured by Tobin’s Q has yielded results which
are not significant. The results in Table 4.7 show that the coefficient for
foreign ownership has dropped after the introduction of interaction variable
whereby the coefficient for interactive variable is positive but not statistically
significant because they have higher p - values )1.0( p .

166
The introduction of interaction variable in the model resulted into declining of
the coefficient for foreign ownership. However, the interaction variable which
has positive coefficient of 0.047 is not statistically significant. This situation
where interactive variable is not significant can be interpreted as follows.
First, before the interaction of efficiency on the relationship between foreign
ownership and corporate performance, the relationship between foreign
ownership and performance was positive and statistically significant.
Second, after the interaction, the coefficients for foreign ownership and
interaction variable became negative and positive respectively as it was
expected, but they are non-significant. This situation is associated by the
market which perceives portion of foreign equity to be itself efficient. This is
because of selectivity and creaming by foreign investors which acquire
ownership into domestic firms that are well established, productive and are
already active. This is what is explained by complementary hypothesis that
foreign ownership creates efficiency through selecting productive acquisition
(Bozec et al., 2010; Sabirianova, Peter, & Svejnar, 2005).
4.5 Robustness Test
It was stated earlier that GMM estimator is attached with instrumental
variables which are supposed to be valid; that they should be exogenous and
relevant (Murray, 2006; Schaffer, Baum, & Stillman, 2003; Stock & Yogo,
2005). This study has proposed four instrumental variables referred as control
variables: firm size, leverage, investment and sales growth. These variables

167
are needed to account for endogenous problem due to dynamic endogeneity
and unobserved heterogeneity (Y. Hu & Izumida, 2008; Nguyen et al., 2015;
Thomsen & Pedersen, 2000; Wintoki et al., 2012). Also, valid instruments are
needed to avoid falling in the trap of generating biased estimates (Murray,
2006; Stock & Yogo, 2005).
The test that was developed by Sargan in 1958 is prominent for testing validity
of instrumental variables because its methodology is directly connected to the
Hansen’s GMM estimator (Arellano, 2002; Schaffer et al., 2003). Therefore,
the study employed Sargan - Hansen test where the J-Statistics were used to
examine the fitness of the model. The calculated J-statistics were above 0.1
(Table 4.4, 4.5, 4.6 and 4.7) to imply that the attached control variables are
valid. Therefore, instrumental variables attached to GMM offer stable
estimates for reporting consistence and unbiased results.
4.6 Summary
This chapter has reported results for data stationarity based on IPS tests and
Fisher-ADF tests where long-run relationship has been established based on
Pedroni cointegration tests. The results show that data are stationary at first
difference and there exists the long-run relationship between variables to
imply that these empirical results are suitable for policy implication and
forecasting.

168
The dynamic GMM estimator was employed to overcome endogenous
problems associated with unobserved heterogeneity, omitted variables and
simultaneity. This is because ownership concentration is dynamic endogenous
whereby the past performance can predict current performance. The use of
GMM estimator ensured generating consistent and unbiased estimates to
circumvent the likelihood of reporting spurious result.
The accounting and market performance measures concluded on negative and
statistically significant between ownership concentration and performance.
The incentives for expropriation by the majority shareholders at expenses of
minority investors arises because monitoring benefits exceed monitoring costs
which endangers protection of minority investors and corporate performance.
The expropriation and monitoring behaviour depicts the nonlinear relationship
between ownership concentration and corporate performance. Thus, when
ownership concentration increases at certain level, the incentive for free riding
declines which encompasses higher monitoring costs compared to monitoring
benefits. The interest-convergence for stakeholders is achieved and thus,
minority shareholders gain confidence for undertaking investments.
Moreover, the locally owned firms embracing foreign investors are
significantly efficient than locally owned firms because of the monitoring and
disciplinary roles. Thus, foreign investors stimulate superior performance. The
interaction between efficiency scores and foreign ownership creates superior
corporate performance because of the combination of operating skills and
monitoring role that institute standard corporate governance practices.

169
CHAPTER 5
5.0 CONCLUSION AND RECOMMENDATIONS
5.1 Introduction
This chapter presents the concluding remarks and recommendations based on
the results presented in the previous chapter. The chapter is divided into
several subsections; subsection 5.2 presents summary and conclusion and
subsection 5.3 reports recommendations. Subsection 5.4 highlights the study
limitations whereas; subsection 5.5 suggests the areas for future researches.
5.2 Summary and Conclusion
This study examined the efficiency of corporate governance towards corporate
performance among 58 non-financial publicly listed companies in partner
states of EAC. The underdeveloped external corporate governance mechanism
was linked with laxity to enforce legal and regulatory frameworks; as a result,
ownership and control of companies were monitored by majority shareholders.
The study was based on the internal mechanism of ownership structure where
ownership concentration has propagated poor protection of minority
shareholders.

170
Chapter one pointed out that on the one hand the EAC aimed at building stable
and competitive business environment appropriately for good conduct of
corporate governance practices and henceforth attracts potential domestic and
foreign investors. On the other hand, the prevailed situation among publicly
listed firms in partner states of EAC was dominated by ownership
concentration which constituted to poor protection of minority investors.
Extant literature including the World Bank, had documented on the poor
protection of minority shareholders that constituted to high cost of doing
business in the EAC (Chakra & Kaddoura, 2015). The chapter also highlighted
that the hostile business environment among listed firms faded the catching up
of the potential FDI inflows in the region.
Chapter two presented the theoretical overview of corporate governance
particularly the agency theory and resource dependency theory that were
incorporated in this study. Relevant past studies were identified and were
summarised in tables by including main findings. However, some observations
were made particularly based on the past studies which used the cross
sectional data on the inherent problem of individual heterogeneity.
It was noted that the nature of cross sectional data did not offer for instruments
to account for possible endogeneity problem (Börsch-Supan & Köke, 2002). It
was also stated that the restrictive nature of the OLS estimator to deal with the
assumptions for homoscedasticity, autocorrelation and multicollinearity
resulted into inconsistent and biased estimates that led to reporting spurious
results. Moreover, it was reported that FEM, GLS and 2SLS suffer the
171
problem of endogeneity and thus the use of panel data and GMM estimator
reduces the likelihood of reporting spurious correlations.
Chapter three was embedded with the research methodology for achieving
research objectives. It aimed at providing achievability of the relationship
between ownership concentration, foreign ownership and firm performance.
The chapter highlighted the importance of enlarging the ownership structure to
incorporate foreign ownership as postulated by resource dependency theory
which argued that external environment promotes superior performance and
protection of minority shareholders (Dalziel et al., 2011; Douma et al., 2006).
The chapter also discussed the dependent variables emanated from accounting
and market performance measures, independent variables and control
variables. The panel unit root tests of IPS and Fisher-ADF tests and Pedroni
panel cointegration tests which account for data heterogeneity were discussed.
The Data envelopment analysis (DEA) technique was outlined and used to
examine input and output variables for developing efficiency scores based on
variable return to scale (VRS). Moreover, advantages of Panel data and GMM
estimator were discussed.
Chapter four encompassed the empirical findings of this study. The IPS tests
and Fisher-ADF tests confirmed that data are stationary at their first level. The
stationarity implied that data were stable and that under strong shocks and
fluctuations they could be used for making long-run forecasting. This implied
that any effects brought by shocks could be immersed and become part of the

172
working system. Also, the Pedroni cointegration tests confirmed that data had
long run relationship to mean that, data had stable long run relationship for
publicly listed companies in EAC. The GMM estimator was employed to
generate consistent and unbiased estimates.
This study intended to achieve four objectives. The first objective was
achieved by examining the linear relationship between ownership
concentration and corporate performance among publicly listed firms in
partner states of EAC. The results showed that the ownership concentration
was negative and statistically significant determinant of corporate performance
as measured by Tobin’s Q, ROE and ROA. This negative impact validated the
significant deterioration of corporate performance at one per cent significance
level. This implied that controlling shareholders pursued the private benefit of
control to expropriate company’s assets at the expense of minority
shareholders. The significant negative relationship between concentrated
ownership and corporate performance shed lights that horizontal conflict
between majority shareholders and minority shareholders known as principal-
principal conflict is persistent.
The negative relationship between ownership concentration and corporate
performance had also been concluded by Ongore (2011) for listed companies
at Nairobi Securities Exchange in Kenya. Moreover, the World Bank report
through the Doing Business (2015) had reported that the laxity to implement
legal and regulation framework among the SSA including partner states of
EAC fuelled for weak protection of minority shareholders. Thus, the
173
consequence for negative effect of ownership concentration towards poor
protection of minority shareholders devastated the financial market
developments and economic growth at the country and the company levels.
The second objective was achieved by examining monitoring and
expropriation behaviour by majority shareholders. This behaviour constituted
the trade-off and efficiency of expropriation and monitoring role respectively.
Thus, to achieve this objective, it required to examine nonlinear relationship
by introducing squared ownership concentration in the relationship between
ownership concentration and corporate performance. The nonlinearity was
achieved for Tobin’s Q, ROE and ROA. The coefficients for ownership
concentration and squared ownership concentration were statistically
significant, negative and positive respectively at one per cent significance
level. The significant coefficient for squared ownership concentration implied
that as concentration ownership increased at certain threshold, the
expropriation effect declined whereas commitment by majority shareholders to
monitoring company operations increased. Therefore, this constitutes the so
called interests-alignments for all stakeholders. This result was in line with Hu
and Izumida (2008).
In general, an adjustment by one per cent in squared ownership concentration
improved ROE and ROA by 0.481 per cent and by 0.472 per cent respectively.
Moreover, the squared ownership concentration had created a total net effect
of 0.515 per cent for ROE and 0.419 per cent for ROA. Meanwhile, an
increase by one per cent in squared concentration ownership enhances Tobin’s

174
Q from -8.745 per cent to 4.578 per cent. This means, corporate performance
could be enhanced when ownership concentration increased.
Thus, the achieved interest-alignment could be maintained provided that the
majority shareholders were ready to curb the stance of earnings management
popularly known as creative accounting. The vast literature argued that
earning management had negative effects on minority shareholders. Vast
empirical evidences that supported the existing state of earnings management
among the publicly listed companies in partner states of EAC were presented
(Kaboyo & Wamwea, 2014; Ndirangu & Iraya, 2016; Schwab, 2013; Waweru
& Riro, 2013).
It is important to note that when ownership concentration increased, incentive
for private benefits declined to imply its linkage with accumulated cash flow
rights. Additionally, this would imply that the monitoring costs were higher
than the monitoring benefits. Thus, the positive and significant relationship
between squared ownership concentration and corporate performance was in
line with Cheung et al. (2008); Y. Hu and Izumida (2008); Lozano et al.
(2015); Tian (2001).
The third objective was achieved by examining the average technical
efficiency for domestic companies that accommodated foreign ownership and
average technical efficiency for locally ownership. The fundamental intention
was to examine average technical efficiencies for these ownerships. This was
achieved by developing efficiency scores using DEA technique. On average,

175
foreign ownership were more technically efficient than locally owned firms
over a period of study, 2007-2015. This implied that, foreign ownership were
attached with management know how, monitoring and disciplinary role by
stressing proper conduct of corporate governance practices. The findings of
this study were in line with Aggarwal et al. (2011); Foster-McGregor et al.
(2015); R. Huang and Shiu (2009) who had concluded that the on average the
foreign owned firms were more technically efficient than the locally owned
firms because foreign investors normally improved efficiency continuously as
compared with locally owned firms and that foreign investor engage in
developing promotion investment benefits and employ higher skilled labour
(Aggarwal et al., 2011; Peng & Jiang, 2010; Young et al., 2008).
Furthermore, because foreign investors have more expertise compared to
locally investors the technical efficient are higher than locally owned firms
because of the efficient utilisation of resources. Previous studies confirmed
that foreign ownership excel corporate performance at least three years in their
operations following the injection of tremendous resources in the company
(Chari et al., 2012a; R. Chen, Ghoul, Guedhami, & Wang, 2017).
The fourth objective was achieved by introducing the interactive variable
which was the interaction between efficiency scores and foreign ownership
(efficiency scores * foreign ownership). The interactive variable intended to
assess the ability of efficiency to stimulate foreign ownership towards superior
corporate performance. This was meant to examine and evaluate impact of

176
foreign ownership to promote firm performance before interaction and after
interaction with the efficiency scores.
The results indicated that the introduction of foreign ownership in the model
before interaction with efficiencies has resulted into foreign ownership to
impact ROA and ROE positively and statistically significant at one per cent
significance level. Thus, an increase of one per cent in foreign ownership
improved ROA and ROE by 0.003 per cent and 0.071 per cent respectively.
This implied that corporate performance could be improved by diversifying
the ownership structure. The resource dependency theory argues that external
sources namely the foreign ownership creates spill over benefits for corporate
performance (Hillman, Withers, & Collins, 2009). The significant positive
relationship between foreign ownership and corporate performance was in line
with Aggarwal et al. (2011); Douma et al. (2006); Lee (2008); Randøy and
Goel (2003) who had argued that the presence of foreign investors in domestic
firms facilitated the monitoring role thereby providing likelihood for
protection of minority shareholders and improve corporate performance.
It was also noted that the introduction of foreign ownership in the model
before interaction had reduced the magnitude of ownership concentration to
deteriorate ROA and ROE. Besides reducing the magnitude of deterioration,
its effect on ROA remained negative whereas for ROE was converted to
positive. This result is justified by the achieved net effect of 0.136 per cent,
0.763 per cent and 0.179 per cent for Tobin’s Q, ROA and ROE respectively.

177
This implies that the presence of foreign investors mitigates the extent of
majority shareholders to expropriate company assets.
Furthermore, interaction variable of foreign ownership and efficiency score
revealed significant results toward corporate performance. First, the
coefficient of ownership concentration changed from negative to positive and
statistically significant determinant of corporate performance at one per cent
significance level. The changes from negative to positive effect rejuvenates
the ownership concentration to become part of a working system and creates
the net effect of 0.033 per cent and 0.019 per cent on ROA and ROE
respectively. It was pointed out that, the friendly business environment would
fuel foreign ownership to install proper conduct of corporate governance
practices to generate dividends by accelerating corporate performance and
protection of minority shareholders. Hence, efficiency scores stimulated
foreign ownership for the company to achieve predetermined goals and
mitigating horizontal problems (Aggarwal et al., 2011).
Also it was shown that efficiency score in the model created negative and
significant impact on foreign ownership such that corporate performance
declined by 0.054 per cent and 0.024 per cent for ROA and ROE respectively.
The decline implied that there was a certain level of efficiency necessary to
boost foreign ownership toward superior performance. In this view, foreign
ownership had accelerated optimal corporate performance when the firm
efficiency threshold was at least 0.66. The negative coefficient of foreign
ownership implied that certain degree of efficiency was required to perform

178
optimally (Greenaway et al., 2014). The fundamental backup for the efficiency
to stimulate foreign ownership was acquainted with higher monitoring benefits
than the monitoring costs (Bae, Min, & Jung, 2011; Chen, Harford, & Li,
2007; Lien, Tseng, & Wu, 2013).
It has been indicated that, the introduction of interaction variable in the model
as measured by Tobin’s Q had made the coefficient for foreign ownership not
statistically significant. The interaction variable was also positive as expected
but again the impact is not statistically significant. After interaction, the
coefficients for foreign ownership and interaction term were negative and
positive respectively as expected but non-significant. This implied that the
market perceives the foreign equity by itself to be efficient. The possible
explanation rendered here was that foreign investors acquire ownership into
domestic firms that were assumed to be well established, productive and
active. This is what is explained by complementary hypothesis that foreign
ownership created efficiency through selecting productive acquisition
(Sabirianova et al., 2005).
5.3 Study Recommendations
This study examined the relationship between ownership concentration and
foreign ownership on corporate performance. The agency theory had argued
that separation between ownership and control promotes corporate
performance. However, the underdeveloped external mechanism of corporate
governance among partner states of the EAC confirmed the weak legal and

179
regulatory frameworks (Munisi & Randøy, 2013). The weak legal and
regulatory framework had fuelled majority shareholders to control and
exercise full discretion over corporate operations contrary to the agency
theory.
Extant literature has argued that ownership concentration in emerging
economies including partner states in EAC plots expropriation of the minority
investors. Thus, horizontal problems were linked with poor protection of
minority shareholders. This study incorporated the resource dependency
theory following its enthusiasm that enlarging ownership structure electrify
the protection of minority shareholders (Aggarwal et al., 2011; Douma et al.,
2006). The study was built on four objectives whose results were discussed in
chapter four.
This study has contributed to the existing literature with the empirical
evidence for the partner states of EAC that ownership concentration has
negative and statistically significant relationship with Tobin’s Q, ROA and
ROE at one per cent significance level. The negative relationship justifies the
on-going debates that majority shareholders in EAC are driven by private
benefit of control to extract company assets at the expense of minority
shareholders. Thus, this result validates that the persistent poor protection of
minority investors among the listed companies in EAC which is associated
with the ownership concentration.

180
This study has also contributed to the existing literature by providing
empirical evidence that at lower level of ownership concentration, majority
shareholders expropriate company assets and thus obstruct firm performance.
It was also verified that at higher level of ownership concentration, controlling
investors have incentives to aggressively promote corporate performance
through concentrated monitoring role. Thus, the expropriation and monitoring
behaviour pertaining to majority shareholders reveals existence of a U-Shaped
namely, a nonlinear relationship between ownership concentration and
corporate performance among listed firms in partner states of the EAC.
Moreover, this study has contributed to the existing literature by providing
empirical evidence that the integration between agency theory and resource
dependency theory essentially solicit mitigation of the horizontal problems
henceforth providing protection of minority shareholders. This is assessed by
introducing the interactive variable emanated from the interaction between
efficiency scores and foreign ownership to encompass the monitoring role and
disciplinary role. The interactive term accelerates foreign ownership to
promote corporate performance essentially to achieve interest-alignment for
all shareholders. Therefore, the efficiency scores are capable to stimulate
foreign ownership towards superior corporate performance.
In general, based on the first objective of this study, the pervasiveness of
ownership concentration among listed companies in partner states of EAC will
continue to be vital source for poor protection of minority shareholders. The
minority shareholders are bypassed by majority shareholders when making

181
significant decision about company operations. It is widely acknowledged that
poor protection of minority shareholders deters capital market developments
(Ameer & Rahman, 2009; Croci & Petmezas, 2010; Othman & Borges, 2015).
Thus, based on the empirical results of this study the following measures are
recommended to the authorities and policy makers of the partner states of
EAC in order to initiate the protection of minority shareholders.
First, this study suggests that there is a need to reinforce the diversity of
ownership structure to accommodate the foreign ownership among listed
companies in the partner states of the EAC. The empirical evidence from this
study has confirmed the know-how of foreign ownership to promote firm
performance. Moreover, the validation was boosted when efficiency was
interacted with foreign ownership for superior corporate performance. When
efficiency scores were interacted with foreign ownership, the scope for foreign
ownership to potentially influence corporate performance was noticed to
trigger interest alignments for all stockholders and thus promote the protection
of minority shareholders.
The authenticity about the partner states of EAC about foreign ownership is
that the region has not yet been a good destination for foreign investors in the
publicly listed companies. There are advantages attached with the presence of
foreign ownership including transfer of technology and ease access to capital,
the reasons for many countries including partner states of EAC to attract
significant basket of foreign investors in their territories.

182
Second, the positive effect of efficiency on the relationship between foreign
ownership and corporate performance exposes the importance of building
better institutional environment among the partner states of EAC. It is widely
argued that the economic growth of several economies are partly explained by
quality institutions (Acemoglu et al., 2003; North, 1990, 2016). It is worth to
note that institutions are moulded to ease suspicions in human interactions.
The quality institutions have positive influence towards foreign ownership to
excute efficiency on corporate performance. Building friendly business
enviromnent that encompasses regulatory frameworks is necessary measure to
accelerate FDI inflows henceforth stimulates economic growth (Ali et al.,
2010; Bénassy-Quéré et al., 2007).
The partner states of EAC are overwhelmed by lack of transparency,
accountability and corruption. The transparency, accountability and corruption
constitute quality institutions which are directly linked with poverty reduction
(Bräutigam & Knack, 2014; Hyden, 2007). On this regard, Bräutigam and
Knack (2014) argued that meagre institutions contribute towards declining of
capital investments among African countries including the partner states of
EAC. The lack of transparency spearheads mask bribery and exaggerates
transaction costs which are unfriendly for FDI inflows. Moreover, the level of
corruption among partner states of EAC crafts uncertainties and weakens the
level of public and capital investments (Transparency International, 2017;
UNECA, 2016).

183
Premised with the situation pertaining the partner states of EAC, the quality
institutions are needed to indoctrinate certainty and polish human interactions.
Thus, necessary quality institutions needed to sharpen interactions include but
not limited to the government effectiveness, regulatory quality, rule of law and
control of corruption (Kaufmann et al., 2010). The implementation of these
components will necessitate the socio-economic relations and promote the
catching up of potential FDI inflows and henceforth economic growth.
Thus, the region which has functional institutional quality provides higher
scope for protection of minority shareholders. This emanates from the sound
rules and regulations to overcome horizontal problems between majority and
minority shareholder. Moreover, regulatory burden facilitates the promotion of
private sector development through imposed capital investment in their
operations. In the absence of better institutional environment the region might
continue to experience the declining of FDI inflows. It was argued by Asiedu
(2006) that the disadvantaged non-rich resource countries can attract potential
FDI inflows in their countries via building institutional credibility while
lowering the costs for doing business.
Third, the partner states of EAC are urged to weigh the possibilities for
adopting the Minority Shareholders Watchdog Group (MSWG) activism.
Among the alternatives for promoting healthy corporate governance requires
the protection of minority shareholders. The objectives of MSWG make them
being referred to as the whistle-blowers for Minority shareholders. Thus,
MSWG preferably work into environments that are crowded with weak legal

184
and regulatory framework such that the minority shareholders are limited to
participate in making important decisions pertaining company operations. This
activism enhances the minority shareholders to become active members to
participate in matters pertaining company operations. The MSWG has been
successful in protecting interests of minority shareholders through
shareholders activism in Malaysia since its adoption in year 2000 (Othman &
Borges, 2015).
The MSWG collects queries from minority shareholders; the queries are then
presented to the management of the company who will be required to provide
answers during the annual general meeting (Ameer & Rahman, 2009; Othman
& Borges, 2015). In this way, minority shareholders are represented in annual
general meetings and helped to build confidence in making investment
decisions.
Thus, the partner states of EAC could adopt the MSWG strategy as one among
alternative strategies for protection of minority shareholders rights, henceforth
stimulates capital market developments and economic spill over benefits. The
electrifying concerns for initiating MSWG among the partner states of EAC
emanates from the pervasiveness ownership concentration to expropriate
minority shareholders. The MSWG strategy could work as the agent of
security exchanges with the contemplation that governments cannot do
everything meanwhile the laws are somewhere sleeping in book shelves.

185
Therefore, if the financial markets amongst the partner states of EAC remain
underdeveloped and authorities in their jurisdictions are laxity to enforce the
quality institutions and the ownership concentration perseveres, the future
performance of companies will be in jeopardy and eventually companies may
collapse, and moreover, the EAC would stack to achieve the aspired
objectives.
5.4 Limitations of the Research
The study has analysed the relationship between ownership structure and
corporate performance. This study was based on the panel data of 58 non-
financial listed companies among partner states of EAC. The EAC region aims
at building stable and competitive business platform that companies could
contribute for economic growth of the region. It is worth to note that the
financial companies have remarkable contribution for the economic growth.
Moreover economic growth is contributed by both listed and unlisted
companies. It can be concluded that this study was biased to non-financial
publicly listed companies in partner states of the EAC.
5.5 Future Research Directions
This study examined the relationship between ownership concentration and
foreign ownership on corporate performance. This study employed panel data
for 58 non-financial listed firms among the partner states of EAC. Meanwhile,
the EAC region desires building stable and competitive business platform for

186
companies to generate value added investments toward economic growth.
Further studies should be carried on for panel data of financial listed
companies to assess the effect of the economic reforms that have been
undertaken within the region towards corporate performance.
The dynamic GMM estimator has generated results on accounting and market
performance measures. While results for accounting measures ROA and ROE
have absolutely normal coefficients, the results for the market performance
measure Tobin’s Q were very interesting. This means that when analysing the
expropriation and monitoring behaviour using Tobin’s Q, the coefficients for
ownership concentration and squared ownership concentration turned overly
very large -8.745 and 4.578 respectively. Therefore, these results attract for
further theoretical investigation acquainted with these aftermaths.
Moreover, this study has examined performance of ownership concentration.
More analysis was conducted by squaring the ownership concentration and
examined the expropriation and monitoring behaviour by majority
shareholders. The study concluded that at higher level of ownership
concentration, there is an interest alignments associated with commitment for
monitoring by majority shareholders because of the cash flows right where
monitoring benefits are lower than costs. However, it would be very
interesting to establish the threshold for different levels of ownership
concentration required to maximise optimally.

187
LIST OF REFERENCES
Acemoglu, D., Johnson, S., Robinson, J., & Thaicharoen, Y. (2003).
Institutional causes, macroeconomic symptoms: Volatility, crises and
growth. Journal of Monetary Economics, 50(1), 49–123.
Adelopo, I. (2011). Voluntary disclosure practices amongst listed companies
in Nigeria. Advances in Accounting, 27(2), 338–345.
Aduda, J., Chogii, R., & Magutu, P. O. (2013). An Empirical Test of
Competing Corporate Governance Theories on the Performance of Firms
Listed at the Nairobi Securities Exchange. European Scientific Journal,
9(13), 107–137.
AfDB. (2011). Eastern Africa: Regional Integration Strategy Paper 2011 -
2015.
Aggarwal, R., Erel, I., Ferreira, M., & Matos, P. (2011). Does governance
travel around the world? Evidence from institutional investors. Journal of
Financial Economics, 100(1), 154–181.
Akbar, S., Poletti-hughes, J., El-faitouri, R., & Zulfiqar, S. (2016). More on
the relationship between corporate governance and firm performance in
the UK: Evidence from the application of generalized method of
moments estimation. Research in International Business and Finance,
38, 417–429.
Ali, F., Fiess, N., & MacDonald, R. (2010). Do Institutions Matter for Foreign
Direct Investment? Open Economies Review, 21(2), 201–219.
Aliabadi, S. (2013). The Most Value Relevant Accounting Performance
Measure by Industry Northeastern Illinois University Northeastern
Illinois University. Journal of Accounting and Finance, 13(1), 22–35.
Allen, F., & Giovannetti, G. (2011). The effects of the financial crisis on Sub-
Saharan Africa. Review of Development Finance, 1(1), 1–27.
Ameer, R., & Rahman, R. A. (2009). The impact of minority shareholder
watchdog group activism on the performance of targeted firms in
Malaysia. Asian Academy of Management Journal of Accounting and
Finance, 5(1), 67–92.

188
Amihud, Y., & Lez, B. (1981). Risk Reduction as a Managerial Motive for
Conglomerate Mergers. The Bell Journal of Economics, 12(2), 605–617.
Arellano, M. (2004). Panel Data Econometrics: Advanced Texts in
Econometrics. (A. Pagan & M. Watson, Eds.) (1st ed.). Oxford New
York: Oxford University Press Inc.
Arellano, M., & Bond, S. (1991). Some Tests of Specification for Panel Data:
Monte Carlo Evidence and an Application to Employment Equations.
Review of Economic Studies, 58(2), 277.
Arestis, P., Demetriades, P. O., & Luintel, K. B. (2001). Financial
Development and Economic Growth : The Role of Stock Markets.
Journal of Money, Credit and Banking, 33(1), 16–41.
Arslan, Ö., Florackis, C., & Ozkan, A. (2014). Financial Flexibility, Corporate
Investment and Performance: Evidence from Financial Crisis. Review of
Quantitative Finance and Accounting, 42(2), 211–250.
Asiedu, E. (2006). Foreign Direct Investment in Africa: The Role of Natural
Resources, Market Size, Government Policy, Institutions and Political
Instability. The World Economy, 29, 63–77.
Athanasoglou, P. P., Brissimis, S. N., & Delis, M. D. (2005). Bank-specific,
industry-specific and macroeconomic determinants of African Islamic
banks’ profitability (25 No. 32026). Working Paper (Vol. 3). BANK OF
GREECE.
Avkiran, N. K. (2006). Productivity Analysis in the Service Sector with Data
Envelopment Analysis. (N. K. Avkiran, Ed.)N K Avkiran (Third Edit, Vol.
3). Brisbane, Australia: N K Avkiran, UQ Business School, The
University of Queensland.
Avkiran, N. K., Tone, K., & Tsutsui, M. (2006). Bridging radial and non-
radial measures of efficiency in DEA. Annals of Operations Research,
164(1), 127–138.
Ayako, A., Kungu, G., & Githui, T. (2015). Determinants of the Performance
of Firms Listed At the Nairobi Securities Exchange. Research Journal of
Finance and Accounting, 6(12), 157–165.

189
Ayandele, I. A., & Emmanuel, I. (2013). Corporate Governance Parctices and
Challenges in Africa. European Journal of Business and Management,
5(4), 51–59.
Backman, M. (2004). The Asian Insider: Unconventional Wisdom for Asian
Business. (Aardvark, Ed.) (1st ed.). PALGRAVE MACMILLAN.
Badunenko, O., Fritsch, M., & Stephan, A. (2006). What Determines the
Technical Efficiency of a Firm? The Importance of Industry, Location,
and Size (Working paper 33/2006). Friedrich-Schiller-Universität Jena.
Bae, S. C., Min, J. H., & Jung, S. (2011). Trading behavior, performance, and
stock preference of foreigners, local institutions, and individual investors:
Evidence from the Korean stock market. Asia-Pacific Journal of
Financial Studies, 40(2), 199–239.
Bahhouth, V., & Gonzalez, R. (2014). Are Financial Measures Leading
Indicators to Firm Performance? International Journal of Business,
Accounting, and Finance, 8(2), 37–49.
Bai, C.-E., Liu, Q., Lu, J., Song, F. M., & Zhang, J. (2006). An Empirical
Study on Corporate Governance and Market Valuation in China.
Frontiers of Economics in China, 1(1), 83–111.
Bai, C., Qiao, L., Joe, L., Song, F. M., & Junxi, Z. (2004). An Empirical Study
on Corporate Governance and Market Valuation in China. Journal Of
Comparative Economics, 32(4), 599–616.
Bajaj, M., Chan, Y.-S., & Dasgupta, S. (1998). ’The relationship between
ownership,financing decisions and firm performance: A signaling model.
Journal of the Academy of Marketing Science, 39(3), 723–744.
Baltagi, B. H. (2005). Econometric Analysis of Panel Data. (B. H. Baltagi,
Ed.) (3rd ed.). West Sussex PO19 8SQ, England: John Wiley & Sons Ltd.
Baltagi, B. H., & Kao, C. (2000). Nonstationary Panel, Cointegartion in Panels
and Dynamic Panels: A Survey. Advances in Econometrics, 15, 7–51.
Banker, R. D., Charnes, A., & Cooper, W. W. (1984). Some models for
estimating technical and scale inefficiencies in data envelopment
analysis. Management Science, 30(9), 1078–1092.

190
Banker, R. D., & Maindiratta, A. (1988). Nonparametric Analysis of
Technical and Allocative Efficiencies in Production. Econometrica,
56(6), 1315–1332.
Barasa, L., Knoben, J., Vermeulen, P., Kimuyu, P., & Kinyanjui, B. (2017).
Institutions, resources and innovation in East Africa: A firm level
approach. Research Policy, 46(1), 280–291.
Barbieri, L. (2006). Panel Unit Root Tests: A Review. Quaderni del
Dipartimento di Scienze Economiche e Sociali, Serie Rossa, N.43.
Università Cattolica del Sacro Cuore, Piacenza.
Barbieri, L. (2009). Panel Cointegration Tests: A Review. Quaderni del
Dipartimento di Scienze Economiche e Sociali, Serie Rossa, N.43.
Università Cattolica del Sacro Cuore, Piacenza.
Barney, J. (2001). Is the Resource-Based ―View‖ a useful perspective for
strategic management research? yes. Academy of Management Review,
26(1), 41–56.
Barney, J., Wright, M., & Ketchen, D. J. J. (2001). The resource based view of
the firm: Ten years after 1991. Journal of Management, 27(6), 625–641.
Bascle, G. (2008). Controlling for endogeneity with instrumental variables in
strategic management research. Strategic Organization, 6(3), 285–327.
Battese, G. E., & Coelli, T. J. (1992). Frontier production functions, technical
efficiency and panel data: With application to paddy farmers in India.
Journal of Productivity Analysis, 3(1–2), 153–169.
Bebchuk, L. A. (1999). A rent-protection theory of corporate ownership and
control. NBER Working Paper Series.
Bebchuk, L. A., & Fried, J. M. (2003). Executive Compensation as an Agency
Problem. Journal of Economic Perspectives, 17(3), 71–92.
Bebchuk, L. A., & Fried, J. M. (2006). Pay without Performance: Overview of
the issues. Academy of Management Perspectives, 20(1), 5–24.
Becht, M., & Boehmer, E. (2003). Voting control in German corporations.
International Review of Law and Economics, 23(1), 1–29.
191
Beiner, S., Drobetz, W., & Schmid, M. (2006). An integrated framework of
corporate governance and firm valuation. European Financial, 12(2),
249–283.
Bénassy-Quéré, A., Coupet, M., & Mayer, T. (2007). Institutional
determinants of foreign direct investment. World Economy, 30(5), 764–
782.
Berger, A. N., & Humphrey, D. B. (1997). Efficiency of Financial lnstitutions:
International Survev and Directions for Future Research. European
Journal of Operational Research, 98(2), 175–212.
Berglöf, E., & Claessens, S. (2004). Corporate Governance and Enforcement,
(August 2015).
Berle, A. A., & Means, G. C. (1933). The Modern Corporation and Private
Property. (A. A. Berle & G. C. Means, Eds.). New York: The Macmillan
Company.
Bevan, A., Estrin, S., & Meyer, K. (2004). Foreign investment location and
institutional development in transition economies. International Business
Review, 13(1), 43–64.
Beveren, I. Van. (2010). Total Factor Productivity Estimation : a Practical
Review, 1–38.
Bhagat, S., & Bolton, B. (2008). Corporate governance and firm performance.
Journal of Corporate Finance, 14, 257–273.
Bhagat, S., & Bolton, B. (2009). Corporate Governance and Firm
Performance: Recent Evidence, (May), 1–57.
Bhagat, S., & Jefferis, R. H. (2002). The Econometrics of Corporate
Governance Studies. (S. Bhagat & R. H. J. Jr, Eds.). London, England:
The MIT Press, Cambridge, MA.
Bhattacharyya, S., & Saxena, A. (2009). Does the Firm Size Matter? An
Empirical Enquiry into the Performance of Indian Manufacturing Firms.
MPRA Paper No. 13029, University Library of Munich, Germany.

192
Bjuggren, P.-O., Eklund, J. E., & Wiberg, D. (2007). Ownership structure,
control and firm performance: the effects of vote-differentiated shares.
Applied Financial Economics, 17(16), 1323–1334.
Black, B. S., Jang, H., & Kim, W. (2006a). Does corporate governance predict
firms’ market values? Evidence from Korea. Journal of Law, Economics,
and Organization, 22(2), 366–413.
Black, B. S., Jang, H., & Kim, W. (2006b). Predicting firms’ corporate
governance choices: Evidence from Korea. Journal of Corporate
Finance, 12(3), 660–691.
Blomström, M., & Kokko, A. (1997). Regional Integration and Foreign
Direct Investment (NBER Working Paper No. NBER Working Paper No.
6019).
Blundell, R., & Bond, S. (1998). Initial conditions and moment restrictions in
dynamic panel data models. Journal of Econometrics, 87(1), 115–143.
Bodie, Z., Kane, A., & Marcus, A. J. (2014). Investments. (S. A. Ross & F.
Modigliani, Eds.) (10th ed.). New York, NY 10121: McGraw-Hill
Education.
Bonin, J. P., Hasan, I., & Wachtel, P. (2005). Bank performance, efficiency
and ownership in transition countries. Journal of Banking and Finance,
29(1 SPEC. ISS.), 31–53.
Booth, J. R., & Deli, D. N. (1999). On executives of financial institutions as
outside directors. Journal of Corporate Finance, 5(3), 227–250.
Börsch-Supan, A., & Köke, J. (2002). An applied econometricians’ view of
empirical corporate governance studies. German Economic Review, 3(3),
295–326.
Bossche, F. A. M. Van Den. (2011). Fitting State Space Models with EViews.
Journal of Statistical Software, 41(8), 1–16.
Bowlin, W. (1998). An Introduction to Data Envelopment Analysis (DEA).
Journal of Cost Analysis, 7(November 1998), 3–7.
193
Bozec, R., & Dia, M. (2012). Convergence of corporate governance practices
in the post-Enron period: behavioral transformation or box-checking
exercise? Corporate Governance, 12(2), 243–256.
Bozec, R., Dia, M., & Bozec, Y. (2010). Governance-Performance
Relationship: A Re-examination Using Technical Efficiency Measures.
British Journal of Management, 21(3), 684–700.
Bräutigam, D. A., & Knack, S. (2014). Foreign Aid, Institutions, and
Governance in Sub-Saharan Africa. Economic Development and Cultural
Change, 52(2), 255–285.
Broberg, P., Tagesson, T., & Collin, S.-O. Y. (2010). What explains variation
in voluntary disclosure? A study of the annual reports of corporations
listed on the Stockholm Stock Exchange. Journal of Management and
Governance, 14(4), 351–377.
Buchanan, B. G., Le, Q. V., & Rishi, M. (2012). Foreign direct investment and
institutional quality: Some empirical evidence. International Review of
Financial Analysis, 21(24), 81–89.
Bürker, M., Franco, C., & Minerva, G. A. (2013). Regional Science and Urban
Economics Foreign ownership , firm performance, and the geography of
civic capital. Regional Science and Urban Economics, 43(6), 964–984.
Caves, R. E. (2007). Multinational Enterprise and Economic Analysis. (J.
Pencavel, Ed.) (Third Edit, Vol. 53). New York: Cambridge University
Press.
Chakra, N. A., & Kaddoura, H. (2015). Protecting minority investors. Doing
Business, World Bank.
Chang, Y. (2002). Nonlinear IV unit root tests in panels with cross-sectional
dependency. Journal of Econometrics, 110, 261–292.
Chang, Y. (2004). Bootstrap unit root tests in panels with cross-sectional
dependency. Journal of Econometrics, 120(2), 263–293.
Chari, A., Chen, W., & Dominguez, K. M. E. (2012a). Foreign ownership and
firm performance: Emerging market acquisitions in the United States.
IMF Economic Review, 60(1), 1–42.
194
Chari, A., Chen, W., & Dominguez, K. M. E. (2012b). Foreign Ownership and
Firm Performance: Emerging Market Acquisitions in the United States.
IMF Economic Review, 60(1), 1–42.
Charnes, A., Cooper, W. W., & Rhodes, E. (1978). Measuring the efficiency
of decision making units. European Journal of Operational Research,
2(6), 429–444.
Chen, C. J., Lin, B. W., Lin, Y. H., & Hsiao, Y. C. (2016). Ownership
structure, independent board members and innovation performance: A
contingency perspective. Journal of Business Research, 69(9), 3371–
3379.
Chen, M. H., Hou, C. L., & Lee, S. (2012). The impact of insider managerial
ownership on corporate performance of Taiwanese tourist hotels.
International Journal of Hospitality Management, 31(2), 338–349.
Chen, R., Ghoul, S. El, Guedhami, O., & Wang, H. (2014). Do state and
foreign ownership affect investment efficiency? Evidence from
privatizations. Journal of Corporate Finance, 42, 408–421.
Chen, R., Ghoul, S. El, Guedhami, O., & Wang, H. (2017). Do state and
foreign ownership affect investment efficiency? Evidence from
privatizations. Journal of Corporate Finance, 42(C), 408–421.
Chen, S.-S., Ho, K. W., Lee, C.-F., & Shrestha, K. (2004). Nonlinear Models
in Corporate Finance Research: Review, Critique, and Extensions.
Review of Quantitative Finance and Accounting, 22(2), 141–169.
Chen, W. P., Chung, H., Hsu, T. L., & Wu, S. (2010). External financing
needs, corporate governance, and firm value. Corporate Governance,
18(3), 234–249.
Chen, X., Harford, J., & Li, K. (2007). Monitoring: Which institutions matter?
Journal of Financial Economics, 86(2), 279–305.
Chen, Y. Y., & Young, M. N. (2010). Cross-border mergers and acquisitions
by Chinese listed companies : A principal – principal perspective. Asia
Pacific Journal of Management, 27, 523–539.
Chen, Z., Cheung, Y.-L., Stouraitis, A., & Wong, A. W. S. (2005). Ownership
concentration, firm performance, and dividend policy in Hong Kong.
Pacific-Basin Finance Journal, 13, 431–449.

195
Cheung, Y. L., Jiang, P., Limpaphayom, P., & Lu, T. (2008). Does corporate
governance matter in China? China Economic Review, 19(3), 460–479.
Cho, D. S., & Kim, J. (2007). Outside directors, ownership structure and firm
profitability in Korea. Corporate Governance, 15(2), 239–250.
Cho, M. H. (1998). Ownerhip structure, investment, and the corporate value:
an empirical analysis. Journal of Financial Economics, 47, 103–121.
Choi, I. (2001). Unit root tests for panel data. Journal of International Money
and Finance, 20(2), 249–272.
Choi, S. B., Lee, S. H., & Williams, C. (2011). Ownership and firm innovation
in a transition economy: Evidence from China. Research Policy, 40(3),
441–452.
Chung, K. H., & Pruitt, S. W. (1994). A Simple Approximation of Tobin’s q.
Financial Management, 23(3), 70–74.
Claessens, S., & Djankov, S. (1999). Ownership Concentration and Corporate
Performance in the Czech Republic. Journal of Comparative Economics.
Claessens, S., Djankov, S., Fan, J., & Lang, L. (1999). Expropriation of
Minority Shareholders in East Asia. Washington, DC: World Bank.
Claessens, S., Djankov, S., Fan, J. P. H., & Lang, L. H. P. (2002).
Disentangling the Incentive and Entrenchment Effects of Large
Shareholdings. Journal of Finance, LVII(6), 2741–2771.
Claessens, S., & Yurtoglu, B. (2012). Corporate Governance and
Development: An Update. Washington, DC 20433.
Claessens, S., & Yurtoglu, B. B. (2013). Corporate governance in emerging
markets: A survey. Emerging Markets Review, 15, 1–33.
Coelli, T. J., Rao, D. S. P., O’Donnell, C. J., & Battese, G. E. (2005). An
introduction to efficiency and productivity analysis. (T. J. Coelli, D. S. P.
Rao, C. J. O’Donnell, & G. E. Battese, Eds.) (2nd ed.). New York, USA:
Springer Sceine+Business Media, Inc.

196
Coelli, T., Rahman, S., & Thirtle, C. (2005). Technical, Allocative, Cost and
Scale Efficiencies in Bangladesh Rice Cultivation: A Non-parametric
Approach. Journal of Agricultural Economics, 53(3), 607–626.
Colombo, M. G., Croce, A., & Murtinu, S. (2014). Ownership structure ,
horizontal agency costs and the performance of high-tech entrepreneurial
firms. Small Bus Econ, 42, 265–282.
Cooksey, B. (2011). Public goods, rent and business in Tanzania. The Africa
Power and Politics (Vol. 6). London.
Cooper, W. W., Seiford, L. M., & Tone, K. (2006). Introduction to Data
Envelopment Analysis and Its Uses. Data envelopment analysis: a
comprehensive text with models, applications, references and DEA-solver
software.
Cooper, W. W., Seiford, L. M., & Tone, K. (2007). Data Envelopment
Analysis - A Comprehensive Text with Models, Applications, References
and DEA-Solver Software (2nd ed.). Springer.
Cooper, W. W., Seiford, L. M., & Zhu, J. (2011). Handbook on Data
Envelopment Analysis. (W. W. Cooper, L. M. Seiford, & J. Zhu,
Eds.)Customer Satisfaction Evaluation: Methods for Measuring and
Implementing Service Quality (2nd ed., Vol. 139). Springer US.
Core, J. E., Holthausen, R. W., & Larcker, D. F. (1999). Corporate
governance, chief executive officer compensation, and firm performance.
Journal of Financial Economics, 51(3), 371–406.
CPIA Africa. (2016). Assessing Africa’s Policies and Institutions (Vol.
98118). Washington.
Cremers, M. K. J., & Nair, V. B. (2005). Governance Mechanisms and Equity
Prices. The Journal of Finance, LX(6), 2859–2894.
Croci, E., & Petmezas, D. (2010). Minority shareholders’ wealth effects and
stock market development: Evidence from increase-in-ownership M&As.
Journal of Banking and Finance, 34(3), 681–694.
Crook, T. R., Ketchen, D. J., Combs, J. G., & Todd, S. Y. (2008). Strategic
resources and performance: A meta-analysis. Strategic Management
Journal, 29(11), 1141–1154.

197
Dalton, D. R., Daily, C. M., Certo, S. T., & Roengpitya, R. (2003). Meta-
analyses of Financial Performance and Equity: Fusion or Confusion?
Academy of Management Journal, 46(1), 13–26.
Dalziel, T., White, R. E., & Arthurs, J. D. (2011). Principal Costs in Initial
Public Offerings. Journal of Management Studies, 48(6), 1346–1364.
Das, D. K., & Dutta, C. B. (2013). Global Financial Crisis and Foreign
Development Assistance Shocks in Least Developing Countries. Journal
of Economic Development, 38(2), 1–42.
Davies, J. R., Hillier, D., & McColgan, P. (2005). Ownership structure,
managerial behavior and corporate value. Journal of Corporate Finance,
11(4), 645–660.
del Gatto, M., di Liberto, A., & Petraglia, C. (2011). Measuring productivity.
Journal of Economic Surveys, 25(5), 952–1008.
Delen, D., Kuzey, C., & Uyar, A. (2013). Measuring firm performance using
financial ratios: A decision tree approach. Expert Systems with
Applications, 40(10), 3970–3983.
Delis, M. D., & Papanikolaou, N. I. (2009). Determinants of bank efficiency:
Evidence from a semi-parametric methodology. Managerial Finance,
35(3), 260–275.
Demb, A., & Neubauer, F.-F. (1992). The Corporate Board: Confronting the
Paradoxes. (O. U. PRESS, Ed.). New York Oxford: Oxford University
Press, Inc.
Demirguc-Kunt, A., & Huizinga, H. (2000). Determinants of commercial bank
interest margins and profitability: Some international evidence. World
Bank Economic Review, 13, 379–408.
Demsetz, H. (1983). The Structure of Ownership and the Theory of the Firm.
The Journal of Law and Economics, 26(2), 375–390.
Demsetz, H., & Lehn, K. ennet. (1985). The Structure of Corporate
Ownership: Causes and Consequences. Journal of Political Economy,
93(6), 1155–1177.
198
Demsetz, H., & Villalonga, B. (2001). Ownership structure and corporate
performance. Journal of Corporate Finance, 7(3), 209–233.
Denis, D. K. (2001). Twenty-five years of corporate governance research …
and counting. Review of Financial Economics, 10(3), 191–212.
Dhanani, A. (2005). Corporate dividend policy: The views of British financial
managers. Journal of Business Finance and Accounting, 32(7–8), 1625–
1672.
Dharwadkar, B., George, G., & Brandes, P. (2000). Privatization in Emerging
Economies: An Agency Theory Perspective. Academy of Management
Review, 25(3), 650–669.
Ding, Y., Zhang, H., & Zhang, J. (2007). Private vs State Ownership and
Earnings Management: evidence from Chinese listed companies.
Corporate Governance: An International Review, 15(2), 223–238.
Djankov, S., LaPorta, R., Lopez-de-Silanes, F., & Shleifer, A. (2008). The law
and economics of self-dealing. Journal of Financial Economics, 88(3),
430–465.
Donaldson, L., & Davis, J. H. (1991). Stewardship Theory or Agency Theory:
Australian Journal of Management, 16(June 1991), 49–66.
Donaldson, L., & Davis, J. H. (1993). The Need for Theoretical Coherence
and Intellectual Rigour in Corporate Governance Research: Reply to
Critics of Donaldson and Davis. Australian Journal of Management,
18(2), 213–224.
Douma, S., George, R., & Kabir, R. (2006). Foreign and domestic ownership,
business groups, and firm performance: Evidence from a large emerging
market. Strategic Management Journal, 27(7), 637–657.
DSE. (2011). Blue Print.
Durnev, A., & Kim, E. H. (2005). To steal or not to steal: Firm attributes, legal
environment, and valuation. Journal of Finance, 60(3), 1461–1493.
Dwivedi, A. K., & Ghosh, P. (2014). Efficiency Measurement of Indian Sugar
Manufacturing Firms: A DEA Approach (working paper series No.
CREED/2014/01). India.

199
Dyck, I. J. A. (2001). Ownership Structure, Legal Protections, and Corporate
Governance. In N. (Eds. . In Pleskovic, B. and Stern (Ed.), annual World
Bank Conference on Development Economics 2000. Washington.
Dyson, R. G., Allen, R., Camanho, A. s., & Shale, E. A. (2001). Pitfalls and
protocols in DEA. European Journal of Operational Research, 132(2),
245–259.
EAC. (2011). East African Community Development Strategy (2011 / 12 –
2015 / 16). Strategy, (August), 1–215.
EAC. (2015a). EAC Vision 2050: Regional Vision for Socio-Economic
Transformation and Development.
EAC. (2015b). East African Community Facts and Figures 2015. Arusha,
Tanzania.
EAC. (2016). East African Community Facts and Figures 2016. Arusha,
Tanzania.
Earle, J. S., Kucsera, C., & Telegdy, Á. (2005). Ownership Concentration and
Corporate Performance on the Budapest Stock Exchange: Do Too Many
Cooks Spoil the Goulash? Corporate Governance, 13(2), 1–11.
Eisenhardt, K. M. (1989). Making Fast Strategic Decisions in High-Velocity
Environments. Academy of Management Journal, 32(3), 543–576.
Ekholm, A., & Maury, B. (2014). Portfolio Concentration and Firm
Performance. Journal of Financial and Quantitative Analysis, 49(4),
903–931.
Eyster, G. (2014). Economic Development and Regional Integration in the
East African Community. Indiana University, Policy Analysis.
Faccio, M., Lang, L. H. P., & Young, L. (2001). Dividends and expropriation.
American Economic Review, 91(1), 54–78.
Fama, E. F., & French, K. R. (2000). Testing Tradeoff and Pecking Order
Predictions About Dividends and Debt (Working Paper No. 506 No.
506). University of Chicago Graduate School of Business.

200
Fama, E. F., & Jensen, M. C. (1983). Separation of Ownership and Control.
The Journal of Law and Economics, 26(2), 33.
Fare, R., & Lovell, C. A. K. (1978). The Measurement of Eciency of
Production. Journal of Economic Theory, 19, 150–162.
Farrell, M. J. (1957). The Measurement of Productive Efficiency. Journal of
the Royal Statistical Society. Series A (General), 120(3), 253–290.
Fazli, S., & Agheshlouei, V. (2009). A hybrid measure of efficiency in
performance measurement: An application to concrete industries. Gazi
University Journal of Science, 22(4), 277–285.
Fich, E. M. (2005). Are Some Outside Directors Better than Others? Evidence
from Director Appointments by Fortune 1000 Firms. The Journal of
Business, 78(5), 1943–1972.
Filatotchev, I., Jackson, G., & Nakajima, C. (2013). Corporate governance and
national institutions: A review and emerging research agenda. Asia
Pacific Journal of Management, 30(4), 965–986.
Filatotchev, I., Stephan, J., & Jindra, B. (2008). Ownership structure, strategic
controls and export intensity of foreign-invested firms in transition
economies. Journal of International Business Studies, 39(7), 1133–1148.
Filatotchev, I., Wright, M., Uhlenbruck, K., Tihanyi, L., & Hoskisson, R. E.
(2003). Governance, organizational capabilities, and restructuring in
transition economies. Journal of World Business, 38(4), 331–347.
Flannery, M. J., & Hankins, K. W. (2013). Estimating dynamic panel models
in corporate finance. Journal of Corporate Finance, 19(1), 1–19.
Foster-McGregor, N., Isaksson, A., & Kaulich, F. (2015). Foreign Ownership
and Labour in Sub-Saharan African Firms. African Development Review,
27(2), 130–144.
Francis, B., Hasan, I., & Wu, Q. (2013). Professors in the boardroom and their
impact on corporate governance and firm performance. Financial
Management (Forthcoming), 547–581.
Freeman, R. (1984). Strategic management: A stakeholder approach. (E. M.
Epstein, Ed.) (1st ed.). United States of America: Pitman Publishing Inc.

201
Fulgence, S. E. (2013). Determinants of Corporate Governance Internet
Reporting; Empirical Evidence from Tanzania (Vol. 3).
Deutschland:LAP Lambert Academic Publishing.
Fulgence, S. E. (2014a). Corporate Governance in Tanzania. In S. O. Idowu &
K. T. C. Aliyurt (Eds.), Corporate Governance An International
Perspective (p. 401). Springer-Verlag Berlin Heidelberg.
Fulgence, S. E. (2014b). Corporate Governance in Tanzania. In S. O. Idowu &
K. T. C. Aliyurt (Eds.), Corporate Governance An International
Perspective (1st ed., pp. 157–185). New York Dordrecht London:
Springer-Verlag Berlin Heidelberg.
Gaur, A. S., Kumar, V., & Singh, D. (2014). Institutions, resources, and
internationalization of emerging economy firms. Journal of World
Business, 49(1), 12–20.
Gillan, S. L. (2006). Recent Developments in Corporate Governance: An
Overview. Journal of Corporate Finance, 12(3), 381–402.
Gillan, S., & Starks, L. (2003). Corporate Governance , Corporate Ownership ,
and the Role of Institutional Investors : A Global Perspective. Journal of
Applied Finance, 13(2), 4–22.
Glen, J. D., Karmokolias, Y., Miller, R. R., & Shah, S. (1995). Dividend
policy and behavior in emerging markets: To Pay or Not to Pay. In
International finance Corporation WB-WP 26 (pp. 1–40). Washington,
DC 20433 USA: The World Bank.
Goergen, M., & Renneboog, L. (2001). Investment policy, internal financing
and ownership concentration in the UK. Journal of Corporate Finance,
7(3), 257–284.
Golany, B., & Roll, Y. (1989). An application procedure for DEA. Omega the
Inter-National Journal of Management Science, 17(3), 237–250.
Gompers, P., Ishii, J. L., & Metrick, A. (2003). Corporate Governance and
Equity Prices. Quarterly Journal of Economics, 118, 107–155.
González, V. M. (2013). Leverage and corporate performance: International
evidence. International Review of Economics and Finance, 25, 169–184.
202
Görg, H., & Strobl, E. (2004). Foreign direct investment and local economic
development: Beyond productivity spillovers. In Globalisation,
Productivity and Technology (p. 29). Institute of International Economics
in Washington.
Greenaway, D., Guariglia, A., & Yu, Z. (2014). The more the better? Foreign
ownership and corporate performance in China. European Journal of
Finance, 20(7–9), 681–702.
Greene, W. H. (2014). Econometric Analysis. Seventh edition. (Seventh Ed).
New York University: Pearson Education Limited - Prentice Hall ©
2012.
Grossman, S. J., & Hart, O. D. (1980). Takeover bids , the free-rider problem ,
and the theory of the corporation. The Bell Journal of Economics, 11(1),
42–64.
Grossman, S. J., & Hart, O. D. (1986). The Costs and Benefits of Ownership:
A Theory of Vertical and Lateral Integration. Journal of Political
Economy, 94(4), 691–719.
Gugler, K., & Weigand, J. rgen. (2003). Is ownership really endogenous ?
Applied Economics Letters, 10, 483–486.
Gui-Diby, S. L. (2014). Impact of foreign direct investments on economic
growth in Africa: Evidence from three decades of panel data analyses.
Research in Economics, 68(3), 248–256.
Gujarati, D. N., & Porter, D. C. (2009). Basic Econometrics. (A. E. Hilbert,
Ed.) (5th Edtion). The McGraw-Hill Series.
Güner, A. B., Malmendier, U., & Tate, G. (2008). Financial expertise of
directors. Journal of Financial Economics, 88(2), 323–354.
Hadri, K. (2000). Testing for stationarity in heterogeneous panel data.
Econometrics Journal, 3, 148–161.
Hahn, J., & Kuersteiner, G. (2002). Asymptotically Unbiased Inference for a
Dynamic Panel Model with Fixed Effects When Both n and T Are Large.
Econometrica, 70(4), 1639–1657.
203
Haniffa, R., & Hudaib, M. (2006). Corporate Governance Structure and
Performance of Malaysian Listed Companies. Journal of Business
Finance & Accounting, 33(7&8), 1034–1062.
Hart, O. (1995). Corporate Governance: Some Theory and Implications. The
Economic Journal, 105(430), 678–689.
Hawley, J. P. (2011). Corporate Governance, Risk Analysis, and the Financial
Crisis: Did Universal Owners Contribute to the Crisis? In J. P. Hawley, S.
J. Kamath, & A. T. Williams (Eds.), Corporate Governance Failures The
Role of Institutional Investors in the Global Financial Crisis (p. 345).
United States of America: University of Pennsylvania Press Philadelphia,
Pennsylvania 19104-4112 www.upenn.edu/pennpress.
Hermalin, B. E. (2005). Trends in Corporate Governance Trends in Corporate
Governance. The Journal of Finance, LX(5), 2351–2384.
Hermalin, B. E., & Weisbach, M. S. (2003). Boards Of Directors As An
Endogenously Determined Institution: A Survey Of The Economic
Literature. Economic Policy Review, 9(1), 7.
Hillman, A. J., Cannella, A. A., & Paetzold, R. L. (2000). The Resource
Dependence Role of Corporate Directors: Strategic Adaptation of Board
Composition in Response to Environmental Change. Journal of
Management Studies, 37(2), 235–256.
Hillman, A. J., & Dalziel, T. (2003). Boards of directors and firm-
performance: integrating agency and resource dependence perspectives.
Academy of Management Review, 28(3), 383–396.
Hillman, A. J., Withers, M. C., & Collins, B. J. (2009). Resource dependence
theory: A review. Journal of Management, 35(6), 1404–1427.
Himmelberg, C. P., Hubbard, R. G., & Palia, D. (1999). Understanding the
determinants of managerial ownership and the link between ownership.
Journal of Financial Economics, 53, 353–384.
Hodgson, G. M. (2006). What Are Institutions? Journal of Economic Issues,
XL(1), 1–25.
Holderness, C. G. (2003). A Survey of Blockholders and Corporate Control.
Federal Reserve Bank of New York.

204
Holderness, C. G., & Sheehan, D. P. (1988). The role of majority shareholders
in publicly held corporations. Journal of Financial Economics, 20, 317–
346.
Holmstrom, B. (1979). Moral Hazard and Observability. The Bell Journal of
Economics, 10(1), 74–91.
Holmstrom, B. (1982). Moral hazard in teams. The Bell Journal of Economics,
11(2), 74–91.
Holmstrom, B., & Kaplan, S. N. (2001). Corporate Governance and Merger
Activity in the United States: Making Sense of the 1980s and 1990s.
Journal of Economic Perspectives, 15(2), 121–144.
Hsiao, C. (2003). Analysis of Panel Data. (A. Chesher & M. O. Jackson, Eds.)
(2nd ed.). New York: Cambridge Universirty Press.
Hsiao, C., & Zhang, J. (2015). IV, GMM or likelihood approach to estimate
dynamic panel models when either N or T or both are large. Journal of
Econometrics, 187(1), 312–322.
Hsu, L.-T. (Jane), & Jang, S. (Shawn). (2009). Effects of restaurant
franchising : Does an optimal franchise proportion exist ? International
Journal of Hospitality Management, 28, 204–211.
Hu, H. W., Tam, O. K., & Tan, M. G.-S. (2010). Internal governance
mechanisms and firm performance in China. Asia Pacific Journal of
Management, 27(4), 727–749.
Hu, Y., & Izumida, S. (2008). Ownership Concentration and Corporate
Performance: A Causal Analysis with Japanese Panel Data. Corporate
Governance, 16(4), 342–358.
Huang, R., & Shiu, C.-Y. (2009). Local Effects of Foreign Ownership in an
Emerging Financial Market: Evidence from Qualified Foreign
Institutional Investors in Taiwan. Financial Management, 38(3), 567–
602.
Huang, W., & Boateng, A. (2013). The role of the state, ownership structure,
and the performance of real estate firms in China. Applied Financial
Economics, 23(10), 847–859.

205
Hurlin, C., & Mignony, V. (2007). Second Generation Panel Unit Root Tests.
halshs- 00159842.
Huyghebaert, N., & Wang, L. (2012). Expropriation of Minority Investors in
Chinese Listed Firms : The Role of Internal and External Corporate
Governance Mechanisms. Corporate Governance: An International
Review, 20(3), 308–332.
Hyden, G. (2007). Governance and poverty reduction in Africa. In
Proceedings of the National Academy of Sciences of the United States of
America, (Vol. 104, pp. 16751–16756).
Idowu, S. O., & Çaliyurt, K. T. (2014). Corporate governance: An
International Perspective (1st ed.). Springer-Verlag Berlin Heidelberg.
Im, K. S., Pesaran, M. H., & Shin, Y. (2003). Testing for unit roots in
heterogeneous panels. Journal of Econometrics, 115(1), 53–74.
Isik, I., & Hassan, M. K. (2003). Efficiency, Ownership and Market Structure,
Corporate Control and Governance in the Turkish Banking Industry.
Journal of Business Finance & Accounting, 30(9/10), 1363–1421.
Iskander, M. R., & Chamlou, N. (2000). Corporate Governance: A
Framework for Implementation. Washington, DC: The World Bank
Group.
Jenkins, L., & Anderson, M. (2003). A multivariate statistical approach to
reducing the number of variables in data envelopment analysis. European
Journal of Operational Research, 147, 51–61.
Jensen, M. C. (1986). Agency Costs of Free Cash Flow, Corporate Finance,
and Takeovers. The American Economic Review, 76(2), 323–329.
Jensen, M. C. (1986). Agency Costs of Free Cash Flow , Corporate Finance ,
and Takeovers Agency Costs of Free Cash Flow , Corporate Finance ,
and Takeovers. American Economic Review, 76(2), 323–329.
Jensen, M. C., & Meckling, W. H. (1976). Theory of the Firm: Managerial
Behavior, Agency Costs and Ownership Structure. Journal of Financial
Economics, 3(4), 305–360.

206
Jensen, M. C., & Ruback, R. S. (1983). The Market For Corporate Control:
The Scientific Evidence. Journal of Financial Economics, 11, 5–50.
Jiang, Y., & Peng, M. W. (2011). Principal-principal conflicts during crisis.
Asia Pacific Journal of Management, 28, 683–695.
Johnson, S., Boone, P., Breach, A., & Friedman, E. (2000). Corporate
governance in the Asian financial crisis. Journal of Financial Economics,
58(1–2), 141–186.
Johnson, S., LaPorta, R., Lopez-de-Silanes, F., & Shleifer, A. (2000).
Tunneling. The American Economic Review, 90(2), 22–27.
Kaboyo, O. W., & Wamwea, G. M. (2014). Motivation Factors for Earning
Management Pracice in Public Listed Companies in Kenya. In 5th
African International Business and Management (AIBUMA) (p. 38).
Kang, H.-W., Wang, G. W. Y., Bang, H.-S., & Woo, S.-H. (2015). Economic
performance and corporate financial management of shipping firms.
Maritime Economics & Logistics, (May 2015), 1–14.
Kang, K. H., Lee, S., & Huh, C. (2010). Impacts of positive and negative
corporate social responsibility activities on company performance in the
hospitality industry. International Journal of Hospitality Management,
29, 72–82.
Kaufmann, D., Kraay, A., & Mastruzzi, M. (2009). Governance Matters VIII:
Aggregate and Individual Governance Indicators 1996-2008 (The World
Bank, Policy Research Working Paper No. 4978).
Kaufmann, D., Kraay, A., & Mastruzzi, M. (2010). The Worldwide
Governance Indicators: A Summary of Methodology, Data and
Analytical Issues (The World Bank, Policy Research Working Paper No.
5430). The World Bank, Policy Research Working Paper 5430.
Kazarwa, W. (2015). The Challenges of Emerging Stock Markets in Africa:
Case of Rwanda Stock Exchange. East African Journal of Science and
Technology, 5(1), 257–265.
Keasey, K., Short, H., & Watson, R. (1994). Directors â€TM
Ownership and
the Performance of Small and Medium Sized Firms in the U . K . Small
Business Economics, 6, 225–236.
207
Keasey, K., Thompson, S., & Mike, W. (2005). Corporate Governance:
Accountability, Enterprise and International Comparisons. In K. Keasey,
S. Thompson, & M. Wright (Eds.), (p. 464). John Wiley & Sons Ltd,.
Keong, C. C. (2007). The Role of Private Capital Flows on GDP of Low,
Middle and High Income Group Countries. PhD Thesis, Universiti Putra
Malaysia, Malaysia.
Khanna, V., & Zyla, R. (2010). Survey Says …Corporate Governance Matters
to Investors in Emerging Market Companies. Washington, DC 20433
USA.
Kibuthu, G., & Osano, E. (2010). Developing Securities Markets in East
Africa : Challenging , but Well Worth the Effort. IFC - WB Group.
Kim, H. (2010). Does Corporate Governance or Transparency Affect Foreign
Direct Investment? World Academy of Science, Engineering and
Technology, 4(7), 159–166.
Kinda, T. (2012). Foreign ownership, sales to multinationals and firm
efficiency: the case of Brazil, Morocco, Pakistan, South Africa and
Vietnam. Applied Economics Letters, 19(6), 551–555.
Kittelsen, S. a. C. (1993). Stepwise DEA; Choosing variables for measuring
technical efficiency in Norwegian electricity distribution. Resources and
Energy.
Klapper, L. F., & Love, I. (2004a). Corporate Governance, Investor
Protection, and Firm Performance in Emerging Markets. Journal of
Corporate Finance, 10(5), 703–728.
Klapper, L. F., & Love, I. (2004b). Corporate governance, investor protection,
and performance in emerging markets. Journal of Corporate Finance,
10(5), 703–728.
Kodongo, O., Mokoaleli-Mokoteli, T., & Maina, L. (2015). Capital structure,
profitability and firm value: panel evidence of listed firms in Kenya.
African Finance Journal, 17(1), 1–20.
Kroszner, R. S., & Strahan, P. E. (2001). Bankers on boards: : Monitoring,
conflicts of interest, and lender liability. Journal of Financial Economics,
62(3), 415–452.

208
Kumar, N., & Singh, J. P. (2013). Global Financial Crisis: Corporate
Governance Failures and Lessons. Journal of Finance, Accounting &
Management, 4(1), 21–34.
Kurniasih, A., Siregar, H., Sembel, R., & Achsani, N. A. (2011). Corporate
Dividend Policy in an Emerging Market : Evidence from Indonesia Stock
Exchange ( IDX ) 2001-2008. International Research Journal of Finance
and Economics, 72(72).
Kyereboah-Coleman, A. (2008). Corporate governance and firm performance
in Africa: a dynamic panel data analysis. Studies in Economics and
Econometrics, 32(2), 1–24.
La Porta, R., Lopez-de-Silanes, F., & Shleifer, A. (1999). Corporate
Ownership Around the World. The Journal of Finance, 54(2), 471–517.
La Porta, R., Lopez-de-Silanes, F., Shleifer, A., & Vishny, R. (1997). Legal
Determinants of External Finance. The Journal of Finance, LII(3), 1131–
1150.
La Porta, R., Lopez-de-Silanes, F., Shleifer, A., & Vishny, R. (2000a).
Investor protection and corporate governance. Journal of Financial
Economics, 58, 3–27.
La Porta, R., Lopez-de-Silanes, F., Shleifer, A., & Vishny, R. (2002). Investor
Protection and Corporate Valuation. The Journal of Finance, 57(3),
1147–1170.
La Porta, R., Lopez-de-Silanes, F., Shleifer, A., & Vishny, R. W. (2000b).
Agency Problems and Dividend Policies Around the World. American
Finance Association, 55(1), 1–33.
Lambertides, N., & Louca, C. (2008). Ownership structure and operating
performance: evidence from the European maritime industry. Maritime
Policy & Management: The Flagship Journal of International Shipping
and Port Research, 35(4), 395–409.
Lang, L. H. P., & Litzenberger, R. H. (1989). Dividend announcements: Cash
Flow Signaling vs. Free Cash Flow Hypothesis? Journal of Financial
Economics, 24(1), 181–191.

209
Lang, L., Stulz, R., & Walkling, R. A. (1989). Managerial performance,
Tobin’s Q, and the gains from successful tender offers. Journal of
Financial Economics, 24(1), 137–154.
Law, S. H., & Azman-Saini, W. N. W. (2008). The Quality of Institutions and
Financial Development. MPRA Paper 12107. University Library of
Munich, Germany.
Lee, S. (2008). Ownership Structure and Financial Performance: Evidence
from Panel Data of South Korea (2008-17 No. 17) (Vol. 6). University of
Utah, Department of Economics, No. 2008-17.
Lee, S. (2009). Corporate governance and firm performance. The University
of Utah.
Lee, S.-C., & Lin, C.-T. (2010). An accounting-based valuation approach to
valuing corporate governance in Taiwan. Journal of Contemporary
Accounting and Economics, 6(2), 47–60.
Lee, S.-C., Lin, C.-T., & Chang, P.-T. (2011). An Ohlson valuation framework
for valuing corporate governance: The case of Taiwan. Pacific Basin
Finance Journal, 19(4), 420–434.
Lensink, R., Meesters, A., & Naaborg, I. (2008). Bank efficiency and foreign
ownership: Do good institutions matter? Journal of Banking and Finance,
32(5), 834–844.
Levin, A., Lin, C. F., & Chu, C. S. J. (2002). Unit root tests in panel data:
Asymptotic and finite-sample properties. Journal of Econometrics,
108(1), 1–24.
Levine, R. (1999). Law, Finance, and Economic Growth. Journal of Financial
Intermediation, 8, 8–35.
Levinsohn, J., & Petrin, A. (2003). Production Functions Estimating to
Control for Using Inputs Unobservables. The Review of Economic
Studies, 70(2), 317–341.
Lewin, A. Y., Morey, R. C., & Cook, T. J. (1982). Evaluating the
administrative efficiency of courts. Omega, 10(4), 401–411.

210
Lien, D., Tseng, M. C., & Wu, S. (2013). Foreign investors in Taiwan: Their
roles and government perspectives. Business Horizons, 56(6), 749–756.
Lindenberg, E. B., & Ross, S. A. (1981). Tobin’s Q Ratio and Industrial
Organization. The Journal of Business, 54(1), 1–32.
Lovell, A. (2005). Ethics in Business: A Literature Review. ICAS Research
Publications. The Institute of Chartered Accountants of Scotland.
Lozano, M. B., Martínez, B., & Pindado, J. (2015). Corporate governance,
ownership and firm value: Drivers of ownership as a good corporate
governance mechanism. International Business Review, xxx, 11.
Lu, W. M., Wang, W. K., Hung, S. W., & Lu, E. T. (2012). The effects of
corporate governance on airline performance: Production and marketing
efficiency perspectives. Transportation Research Part E: Logistics and
Transportation Review, 48(2), 529–544.
Luo, J., Wan, D., & Cai, D. (2012). The private benefits of control in Chinese
listed firms : Do cash flow rights always reduce controlling shareholders ’
tunneling ? Asia Pacific Journal of Management, 29(2341), 499–518.
Maddala, G. S. (1999). On the Use of Panel Data Methods with Cross-Country
Data. ANNALES D’ÉCONOMIE ET DE STATISTIQUE, (N° 55-56),
429–449.
Maddala, G. S., & Kim, I.-M. (2002). Unit Roots, Cointegration and Structure
Change. (G. . Maddala & I.-M. Kim, Eds.). UK: Cambridge University
Press.
Maddala, G. S., & Wu, S. (1999). A comparative study of unit root tests with
panel data and a new simple test. Oxford Bulletin of Economics and
Statistics, 61(S1), 631–652.
Madhanagopal, R., & Chandrasekaran, R. (2014). Selecting Appropriate
Variables for DEA Using Genetic Algorithm (GA) Search Procedure.
International Journal of Data Envelopment Analysis and Operations
Research, 1(2), 28–33.
Mahadeva, L., & Robinson, P. (2004). Unit Root Testing to Help Model
Building. Handbook in Central Banking, (22), 1–53.

211
Maher, M., & Andersson, T. (1999). Corporate Governance: Effects on Firm
Performance and Economic Growth. Organisation for Economic Co-
operation and Development.
Mak, Y. T., & Kusnadi, Y. (2005). Size really matters : Further evidence on
the negative relationship between board size and firm value. Pacific-
Basin Finance Journal, 13, 301–318.
Makoni, P. L. (2014). Finance and firm characteristics in Tanzania. Banks and
Bank Systems, 9(4), 92–98.
Mang’unyi, E. E. (2011). Ownership Structure and Corporate Governance and
Its Effects on Performance: A Case of Selected Banks in Kenya.
International Journal of Business Administration, 2(3), 2–18.
Massele, J., Darroux, C., Jonathan, H., & Fengju, X. (2013). Challenges faced
by Dar-es-Salaam Stock Exchange Market in Tanzania, 4(15), 36–43.
Mayer, C. (2002). Corporate Cultures and Governance: Ownership, Control
and Governance of European and US Corporations. In F. Barca & M.
Becht (Eds.), “The Control of Corporate Europe”, (p. 36). Oxford
University Press Inc.
McConnell, J. J., & Servaes, H. (1990). Additional evidence on equity
ownership and corporate value. Journal of Financial Economics, 27(2),
595–612.
McDonald, J. (2009). Using least squares and tobit in second stage DEA
efficiency analyses. European Journal of Operational Research, 197(2),
792–798.
Melyoki, L. L. (2005). Determinants of Effective Corporate Governance in
Tanzania. PhD Thesis, University of Twente, Enschede.
Meyer, K. E., Estrin, S., Bhaumik, S., & Peng, M. W. (2009). Institutions,
resources and entry strategies in emerging economies. Strategic
Management Journal, 30(1), 61–80.
Mian, A. (2006). Distance constraints: The limits of foreign lending in poor
economies. Journal of Finance, 61(3), 1465–1505.

212
Miguel, A. De, Pindado, J., & Torre, C. De. (2001). Ownership Structure and
Firm Value : New Evidence from the Spanish Corporate Governance
System. Economia, 34(9).
Mikkelson, W. H., Partch, M. M., & Shah, K. (1997). Ownership and
operating performance of companies that go public. Journal of Financial
Economics, 44, 281–307.
Moon, H. R., & Perron, B. (2004). Testing for a unit root in panels with
dynamic factors. Journal of Econometrics, 122(1), 81–126.
Morck, R., Shleifer, A., & Vishny, R. W. (1988). Management ownership and
market valuation: An Empirical Analysis. Journal of Financial
Economics, 20, 293–315.
Morck, R., Wolfenzon, D., & Yeung, B. (2005). Corporate Governance,
Economic Entrenchment, and Growth. Journal of Economic Literature,
43(3), 655–720.
Mudambi, R., & Pedersen, T. (2007). Agency Theory and Resource
Dependency Theory : Complementary Explanations for Subsidiary Power
in Multinational Corporations (SMG WP 5/2007 No. 5). Basingstoke.
Mueller, D. C., Dieti, H., & Peev, E. (2003). Ownership and Performance.pdf.
Journal for Institutional Innovation, Development & Transition.
Mueller, D. C., & Peev, E. (2005). Ownership Structures and Investment
Performance in Central and Eastern Europe. Journal for Institutional
Innovation, Development and Transition, (October), 14–15.
Mule, R. K., Mukras, M. S., & Oginda, M. N. (2013). Ownership
Concentration and Financial Performance of Listed Firms in Kenya: an
Econometric Analysis using Panel Data. European Scientific Journal,
9(28), 194–211.
Munisi, G., Hermes, N., & Randøy, T. (2014). Corporate boards and
ownership structure: Evidence from Sub-Saharan Africa. International
Business Review, 23(4), 785–796.
Munisi, G., & Randoy, T. (2013). Corporate Governance and Company
Performance across Sub-Saharan African Countries. Journal of
Economics and Business, 70, 92–110.

213
Munisi, G., & Randøy, T. (2013). Corporate governance and company
performance across Sub-Saharan African countries. Journal of
Economics and Business, 70, 92–110.
Murali, R., & Welch, J. B. (1989). Agents, Owners, Control and Performance.
Journal of Business Finance & Accounting, 16(3), 385–398.
Murongo, T. M. (2013). Corporate Governance and Financial Performance of
Commercial Banks in Uganda: a Case of Stanbic Bank Uganda Limited.
Mwangi, L. W., Makau, S. M., & Kosimbei, G. (2014). Relationship between
Capital Structure and Performance of Non- Financial Companies Listed
In the Nairobi Securities Exchange, Kenya. Global Journal of
Contemporary Research in Accounting, Auditing and Business Ethics
(GJCRA), 1(2), 72–90.
Myers, S. C. (1984). The Capital Structure Puzzle. The Journal of Finance,
39(3), 575–592.
Myers, S. C., & Majluf, N. S. (1984). Corporate financing and investment
decisions when firms have information that investors do not have.
Journal of Financial Economics, 13(2), 187–221.
Nanka-Bruce, D. (2011). Corporate Governance Mechanisms and Firm
Efficiency. International Journal of Business and Management, 6(5), 28–
40.
Ndirangu, E. W., & Iraya, C. (2016). The Effect Of Cross Listing On The
Accounting Quality Of Firms Cross Listed In East African Markets.
European Scientific Journal, 12(10), 403–416.
Nedelea, I. C., & Fannin, J. M. (2013). Technical efficiency of Critical Access
Hospitals: An application of the two-stage approach with double
bootstrap. Health Care Management Science, 16(1), 27–36.
Nguyen, T., Locke, S., & Reddy, K. (2015). Ownership concentration and
corporate performance from a dynamic perspective: Does national
governance quality matter? International Review of Financial Analysis,
41, 148–161.
Nicholson, G. J., & Kiel, G. C. (2007). Can Directors Impact Performance? A
Case Based Test of Three Theories of Corporate Governance. Corporate
Governance: An International Review, 15(4), 585–608.

214
Niţoi, M., & Spulbar, C. (2015). An Examination of Banks’ Cost Efficiency in
Central and Eastern Europe. Procedia Economics and Finance,
22(November 2014), 544–551.
North, D. C. (1990). Institutions, Institutional Change and Economic
Performance. Cambridge University Press. Cambridge.
North, D. C. (2016). Institutions and Economic Theory. The American
Economist, 61(1), 72– 76.
Nyaki, J. V. (2013). A Critical Analysis of Tanzanian Corporate Governance
Regulation and its Impacts on Foreign Investment, (May), 1–9.
Oberholzer, M. (2014). A Model To Estimate Firms’ Accounting-Based
Performance: A Data Envelopment Approach. International Business &
Economics Research Journal, 13(6), 1301–1314.
OECD. (2003). Public Sector Transparency and Accountability: Making it
Happen.
OECD. (2004). Corporate Governance: A Survey of OECD Countries. (OECD
& S. Group, Eds.)Oecd. OECD Publications Service.
OECD. (2009). OECD Factbook 2009: Economic, Environmental and Social
Statistics. Paris.
OECD. (2014). Corporate Governance Factbook.
OICU-IOSCO. (2009). Protection of Minority Shareholders in Listed Issuers:
Final Report. Corporate Governance.
Okiro, K., & Aduda, P. J. (2015). The Effect of Corporate Governance and
Capital Structure on Performance of Firms Listed at the East African
Community Securities Exchange. European Scientific Journal, 11(7),
517–546.
Okpara, J. O. (2011). Factors constraining the growth and survival of SMEs in
Nigeria: Implications for poverty alleviation. Management Research
Review, 34(2), 156–171.

215
Olesen, O. B., & Petersen, N. C. (2015). Stochastic Data Envelopment
Analysis—A review. European Journal of Operational Research, 251(1),
2–21.
Olley, S., & Pakes, A. (1996). The Dynamics of Productivity in the
Telecommunications Equipment Industry. Econometrica.
Omran, M. M., Bolbol, A., & Fatheldin, A. (2008). Corporate governance and
firm performance in Arab equity markets: Does ownership concentration
matter? International Review of Law and Economics, 28(1), 32–45.
Ongore, V. O. (2011). The relationship between ownership structure and firm
performance : An empirical analysis of listed companies in Kenya.
African Journal of Business Management, 5(6), 2120–2128.
Ongore, V. O., K’Obonyo, P. O., & Ogutu, M. (2011). Implications of Firm
Ownership Identity and Managerial Discretion on Financial Performance:
Empirical Evidence from Nairobi Stock Exchange. International Journal
of Humanities and Social Science, 1(13), 187–195.
Oriwo, E. A. (2012). The Relationship between Macro Economic Variables
and Stock Market Performance in Kenya.
Othman, S., & Borges, W. G. (2015). Shareholder Activism in Malaysia: Is It
Effective? Procedia - Social and Behavioral Sciences, 172, 427–434.
Oulton, N. (1981). Aggregate Investment and Tobin’s Q: The Evidence from
Britain. Oxford Economic Papers, New Series, 33(2), 177–202.
Pamburai, H. H., Chamisa, E., Abdulla, C., & Smith, C. (2015). An analysis of
corporate governance and company performance: a South African
perspective. South African Journal of Accounting Research, 29(2), 115–
131.
Pastor, J. T., Ruiz, J. L., & Sirvent, I. (2002). A statistical test for nested radial
DEA models. Operations Research, 50(4), 728–735.
Pedroni, P. (2004). Panel Cointegration: Asymptotic and Finite Sample
Properties of Pooled Time Series Tests With an Application To the Ppp
Hypothesis. Econometric Theory, 20(3).
216
Peng, M. W., & Jiang, Y. (2010). Institutions behind family ownership and
control in large firms. Journal of Management Studies, 47(2), 253–273.
Pervan, M., Pervan, I., & Todoric, M. (2012). Firm Ownership and
Performance : Evidence for Croatian Listed Firms. World Academy of
Science, Engineering and Technology, 6(1), 964–970.
Pesaran, M. H. (2003). A Simple Panel Unit Root Test in the Presence of
Cross Section Dependence (Vol. 3). Mimeo: Mimeo, University of
Southern California.
Pesaran, M. H. (2007). A Simple Panel Unit Root Test in the Presence of
Cross-section Dependence. Journal of Applied Econometrics, 22, 265–
312.
Pesaran, M. H., & Smith, R. (1995). Estimating long-run relationships from
dynamic heterogeneous panels. Journal of Econometrics, 68(1), 79–113.
Pfeffer, J., & Salancik, G. R. (1978). The External Control of Organizations:
A Resource Dependence Perspective. New York: Harper & Row.
Pham, P. K., Suchard, J. -a., & Zein, J. (2011). Corporate governance and
alternative performance measures: evidence from Australian firms.
Australian Journal of Management, 36(3), 371–386.
Phillips, P. C. B., & Sul, D. (2003). Dynamic panel estimation and
homogeneity testing under cross section dependence. Econometrics
Journal, 6(1), 217–259.
Phung, D. N., & Hoang, T. P. T. (2013). Corporate Ownership and Firm
Performance in Emerging Market: A Study of Vietnamese Listed Firms.
In Proceedings of World Business and Social Science Research
Conference (pp. 1–16). Novotel Bangkok on Siam Square, Bangkok,
Thailand.
Quah, D. (1994). Exploiting Cross Section Variation for Unit Root Inference
in Dynamic Data. Economics Letters, 44(1–2), 9–19.
Rahman, N. A. A., & Reja, A. F. M. (2015). Ownership Structure and Bank
Performance. Journal of Economics, Business and Management, 3(5),
483–488.
217
Ramalho, E. a., Ramalho, J. J. S., & Henriques, P. D. (2010). Fractional
regression models for second stage DEA efficiency analyses. Journal of
Productivity Analysis, 34(3), 239–255.
Ramanathan, R. (2003). An Introduction to Data Envelopment Analysis: A
Tool for Performance Measurement. (R. Ramanathan, Ed.) (First). New
Delhi l Thousand Oaks l London: Sage Publications India Pvt Ltd.
Randøy, T., & Goel, S. (2003). Ownership structure, founder leadership, and
performance in Norwegian SMEs: Implications for financing
entrepreneurial opportunities. Journal of Business Venturing, 18(5), 619–
637.
Ray, S. C. (2004). Data Envelopment Analysis: Theory and Techniques for
Economic and Operations Research. (S. C. Ray, Ed.) (First). New York,
USA: Cambridge University Press.
Reed, D. (2002). Corporate Governance Reforms in Developing Countries.
Journal of Business Ethics, 37, 223–247.
Republic of Kenya. (2015). The Capital Markets (Foreign Investors)
Regulations with 2015 Amendments. Nairobi, Kenya.
Roodman, D. (2009a). A Note on the Theme of Too Many Instruments.
Oxford Bulletin of Economics and Statistics, 71(1), 135–158.
Roodman, D. (2009b). How to do xtabond2: An introduction to difference and
system GMM in Stata. Stata Journal, 9(1), 86–136.
Ross, S. A. (1977). The Determination of Financial Structure: The Incentive
Signalling Approach. Bell Journal of Economics, 8(1), 23–40.
Rossouw, G. J. (2005). Business Ethics and A Global Survey. Business &
Society, 44(1), 32–39.
Rubakula, G. (2014). The New Public Management and its Challenges in
Africa. Public Policy and Administration Research, 4(4), 85–97.
Rwegasira, K. (2000). Corporate Governance in Emerging Capital Markets:
whither Africa? Corporate Governance: An International Review, 8(3),
258–267.

218
Sabirianova, K., Peter, K. S., & Svejnar, J. (2005). Foreign Investment,
Corporate Ownership, and Development: Are Firms in Emerging
Markets Catching Up to the World Standard? (No. 1457). Bonn.
Sáez, M., & Gutiérrez, M. (2015). Dividend Policy with Controlling
Shareholders. Theoretical Inquiries in Law, 16(1), 107–130.
Samuel, C. (2000). Does shareholder myopia lead to managerial myopia? A
first look. Applied Financial Economics, 10(5), 493–505.
Scholten, M. (2014). Ownership structure and firm performance : Evidence
from the Netherlands. University of Twente.
Schultz, E. L., Tan, D. T., & Walsh, K. D. (2010). Endogeneity and the
corporate governance - performance relation. Australian Journal of
Management, 35(2), 145–163.
Schulze, W. S., Lubatkin, M. H., Dino, R. N., & Buchholtz, A. K. (2001).
Agency Relationships in Family Firms: Theory and Evidence.
Organization Science, 12(2), 99–116.
Schwab, K. (2013). The Global Competitiveness Report 2012-2013. (K.
Schwab, X. Sala-i-Martín, & B. Brende, Eds.). Geneva: World Economic
Forum.
Schwab, K. (2014). The Global Competitiveness Report: World Economic
Forum. (K. Schwab, Ed.) (Full). Geneva: World Economic Forum.
Scott, R. (2003). Rational, Natural, and Open Systems. (C. DeJohn, Ed.) (5th
ed.). Pearson Education, Inc.
Sharma, M. J., & Yu, S. J. (2015). Stepwise regression data envelopment
analysis for variable reduction. Applied Mathematics and Computation,
253, 126–134.
Shleifer, A., & Vishny, R. W. (1986). Large Shareholders and Corporate
Control. The Journal of Political Economy, 94(3), 461–488.
Shleifer, A., & Vishny, R. W. (1997). A Survey of Corporate Governance.
Journal of Financial Economics, 52(2), 737–783.

219
Short, H., & Keasey, K. (1999). Managerial ownership and the performance of
firms: Evidence from the UK. Journal of Corporate Finance, 5(1), 79–
101.
Simmons, C. (2012). Will You Be on Our Board of Directors? We Need Help:
Media Corporations, Environmental Change, and Resource Dependency
Theory. Journalism & Mass Communication Quarterly, 89(1), 55–72.
Singh, A. (2003). Competition, Corporate Governance and Selection in
Emerging Markets. The Economic Journal, 113(491), 443–464.
Singh, D. A., & Gaur, A. S. (2009). Business Group Affiliation, Firm
Governance, and Firm Performance: Evidence from China and India.
Corporate Governance: An International Review, 17(4), 411–425.
Skoog, G. E. (2005). Supporting the Development of Institutions – Formal and
Informal Rules: An Evaluation Theme Basic Concepts (UTV Working
Paper No. 3). SIDA,UTV WP/3.
Smirlock, M., Gilligan, T., & Marshall, W. (1984). Tobin’s Q and the
Structure - Performance Relationship. The American Economic Review,
74(5), 1051–1061.
Staal, S., & Brogaard, M. (2011). Developments in Total Factor Productivity
within the Danish Manufacturing Sector: Reallocation, Technical
Efficiency and Capital Structure. Aarhus University, Denmark.
Staiger, D., & Stock, J. H. (1997). Instrumental Variables Regression with
Weak Instruments. Econometrica, 65(3), 557–586.
Stein, J. C. (1988). Takeover Threats and Managerial Myopia. Journal of
Personality and Social Psychology, 96(1), 61–80.
Stein, J. C. (1989). Efficient Capital Markets , Inefficient Firms : A Model of
Myopic Corporate Behavior. Quarterly Journal of Economics, 104(4),
655–669.
Stewart Myers. (1977). Determinants of corporate borrowing. Journal of
Financial Economics, 5, 147–175.

220
Stock, J. H., Wright, J. H., & Yogo, M. (2002). A Survey of Weak Instruments
and Weak Identification in Generalized Method of Moments. Journal of
Business & Economic Statistics, 20(4), 518–529.
Strobl, E., & Thornton, R. (2004). Do Large Employers Pay More? The Case
of Five Developing African Countries. Journal of Economic
Development, 29(1), 137–161.
Su, Y., Xu, D., & Phan, P. H. (2008). Principal – Principal Conflict in the
Governance of the Chinese Public Corporation. Management and
Organization Review, 4(1), 17–38.
Sueyoshi, T., & Goto, M. (2012). DEA environmental assessment of coal fired
power plants: Methodological comparison between radial and non-radial
models. Energy Economics, 34(6), 1854–1863.
Tavitiyaman, P., Qu, H., & Qiu, H. (2011). The impact of industry force
factors on resource competitive strategies and hotel performance.
International Journal of Hospitality Management, 30(3), 648–657.
Tayeh, M., Al-jarrah, I. M., Tarhini, A., & Kingdom, U. (2015). Accounting
vs . Market-based Measures of Firm Performance Related to Information
Technology Investments. International Review of Social Sciences and
Humanities, 9(1), 129–145.
Taylor, M. P., & Sarno, L. (1998). The behavior of real exchange rates during
the post-Bretton Woods period. Journal of International Economics,
46(2), 281–312.
Thompson, P., & Hung, A. C. (2002). Cracking the Singapore Code of
Corporate Governance: A step towards World-Class Corporate
Governance and Superior Performance. Nottingham University Business
School, United Kingdom.
Thomsen, S., & Pedersen, T. (2000). Ownership Structure and Economic
Performance in the Largest European Companies. Strategic Management
Journal, 21(6), 689–705.
Thomsen, S., Pedersen, T., & Kvist, H. K. (2006). Blockholder ownership:
Effects on firm value in market and control based governance systems.
Journal of Corporate Finance, 12(2), 246–269.

221
Tian, L. (2001). Government Shareholding and the Value of China’s Modern
Firms (No. 395).
Titko, J., Stankevičienė, J., & Lāce, N. (2014). Measuring bank efficiency :
DEA application. Technological and Economic Development OF
ECONOMY, 20(4), 739–757.
Tobin, J. (1969). Equilibrium Approach To Monetary Theory. Journal of
Money, Credit and Banking, 1(1), 15–29.
Tone, K. (2001). A slacks-based measure of efficiency in data envelopment
analysis. European Journal of Operational Research, 130(3), 498–509.
Torben, P., & Thomsen, S. (2000). The Causal Relationship between Insider
Ownership , Owner Identity and Market Valuation among the Largest
European Companies. Strategic Management Journal, 21(6), 689–705.
Transparency International. (2017). Corruption Perceptions Index 2016.
Transparency International. Berlin, Germany.
Tsegba, I. N., & Ezi-Herbert, W. (2011). The Relationship between
Ownership Structure and Firm Performance: Evidence from Nigerian
Listed Companies. African Journal of Accounting, Economics, Finance
and Banking Research, 7(7), 51–63.
Tsionas, M. G., Merikas, A. G., & Merika, A. A. (2012). Concentrated
ownership and corporate performance revisited: The case of shipping.
Transportation Research Part E: Logistics and Transportation Review,
48(4), 843–852.
Tusiime, I., Nkundabanyanga, S. K., & Nkote, I. N. (2011). Corporate
governance : Ownership structure , board structure and performance of
public sector entities. Journal of Public Administration and Policy
Research, 3(9), 250–260.
U.S. Department of State. (2015). Uganda Investment climate statement 2015.
UNCTAD. (2016). World Investment Report 2016- Investor Nationality:
Policy Challenges. Geneva: United Nations.
UNECA. (2016). Measuring corruption in Africa: The international
dimension matters- African Governance Report IV (4th ed.). Addis
Ababa, Ethiopia: United Nations Economic Commission for Africa.

222
United Nations. (2009). Assessing the impact of the current financial and
economic crisis on global FDI flows. Special Issue. UNCTAD, United
Nations, New York.
United Nations. (2010). World Economic and Social Survey 2010: Retooling
Global Development. (United Nations, Ed.) (E/2010/50/). New York:
United Nations publication.
United Nations Economic Comission for Africa. (2013). Two Decades of
Trade Liberalisation and Market Expansion in Eastern Africa: Towards a
New Economic Geography?
United Republic of Tanzania. (2014). Capital Markets and Securities (Foreign
Investor) Regulation 2014. Dar Es Salaam, Tanzania: Government
Printer, Dar Es Salaam.
Van Biesebroeck, J. (2007). Robustness of productivity estimates. Journal of
Industrial Economics, 55(3), 529–569.
Velde, D. W. te, & Morrissey, O. (2003). Do Workers in Africa Get a Wage
Premium if Employed in Firms Owned by Foreigners? Journal of African
Economies, 12(1), 41–73.
Vermeulen, E. P. M. (2013). “Beneficial Ownership and Control: A
Comparative Study - Disclosure, Information and Enforcement”, OECD
Corporate Governance Working Papers, No. 7, OECD Publishing
(OECD Corporate Governance Working Papers, No. 7 No. No.7).
Villalonga, B., & Amit, R. (2006). How do family ownership, control and
management affect firm value? Journal of Financial Economics, 80(2),
385–417.
Vintilă, G., & Gherghina, Ş. C. (2014). The Impact of Ownership
Concentration on Firm Value. Empirical Study of the Bucharest Stock
Exchange Listed Companies. Procedia Economics and Finance, 15(14),
271–279.
Wagner, J. M., & Shimshak, D. G. (2007). Stepwise selection of variables in
data envelopment analysis: Procedures and managerial perspectives.
European Journal of Operational Research, 180(1), 57–67.

223
Wang, J. L., Jeng, V., & Peng, J. L. (2007). The Impact of Corporate
Governance Structure on the Efficiency Performance of Insurance
Companies in Taiwan. The Geneva Papers on Risk and Insurance Issues
and Practice, 32(2), 264–282.
Wanyonyi, D., & Tobias, W. (2013). Effects of Corporate Governance on
Financial Performance of Listed Insurance Firms in Kenya. Public Policy
and Administration Research, 3(4), 1–26.
Waweru, N. M., & Riro, G. K. (2013). Corporate Governance , Firm
Characteristics and Earnings Management in an Emerging Economy.
JAMAR, 11(1), 43–64.
Weir, C., Laing, D., & Mcknight, P. J. (2002). Internal and external
governance mechanisms: their impact on the performance of large UK
public companies. Journal of Business Finance & Accounting, 29, 579–
611.
Willmore, L. (1986). The Comparative Performances of Foreign and Domestic
Firms in Brazil. World Development, 14(4), 489–502.
Wintoki, M. B., Linck, J. S., & Netter, J. M. (2012). Endogeneity and the
dynamics of internal corporate governance. Journal of Financial
Economics, 105(3), 581–606.
Wooldridge, J. M. (2002). Econometric Analysis of Cross Section and Panel
Data. (J. M. Wooldridge, Ed.). London, England: The MIT Press,
Cambridge, MA.
World Bank. (2009). United Republic of Tanzania Public Expenditure and
Financial Accountability Review 2009 International Standards on
Auditing Joint Assistance Strategy for Tanzania.
World Bank. (2013). Doing Business in the East African Community.
World Bank. (2014a). Doing Business 2014: Smarter Regulations for Small
and Medium-Size Enterprises (10th ed.). Washington, DC 20433, USA:
World Bank Group.
World Bank. (2014b). Doing Business 2014 Regional Profile : East Africa
Community (EAC).
224
World Bank. (2014c). Doing Business 2015: Going Beyond Efficiency.
Washington, DC: World Bank Group.
World Bank. (2016a). Doing Business 2016: Measuring Regulatory Quality
and Efficiency. Washington, DC: World Bank.
World Bank. (2016b). Doing business 2016: Measuring Regulatory Quality
and Efficiency. Washington, DC 20433: World Bank.
Wright, M., Filatotchev, I., Hoskisson, R. E., & Peng, M. W. (2005). Guest
Editors’ Introduction Strategy Research in Emerging Economies:
Challenging the Conventional Wisdom. Journal of Management Studies,
42(1), 1–33.
Xu, D., & Meyer, K. E. (2012). Linking Theory and Context: ―Strategy
Research in Emerging Economies‖ after Wright et al. 2005. Journal of
Management Studies, (February), 1–40.
Xu, L. C., Zhu, T., & Lin, Y. (2005). Politician control , agency. Economics of
Transition, 13(1), 1–24.
Yabara, M. (2012). Capital Market Integration: Progress Ahead of the East
African Community Monetary Union (WP/12/18 No. WP/12/18).
Yang, M. (2015). Ownership participation of cross-border mergers and
acquisitions by emerging market firms. Management Decision, 53(1),
221–246.
Yartey, C. A., & Adjasi, C. K. (2007). Stock Market Development in Sub-
Saharan Africa: Critical Issues and Challenges (WP?07/209). IMF -
Working paper. IMF, African Department.
Yermack, D. (1996). Higher market valuation of companies with a small board
of directors. Journal of Financial Economics, 40, 185–211.
Yixiang, Z. (2011). Empirical Research on Ownership Structure and Corporate
Performance Based on the Perspective of Dynamic Endogeneity. Energy
Procedia, 5, 1878–1884.

225
Young, M. N., Peng, M. W., Ahlstrom, D., Bruton, G. D., & Jiang, Y. (2008).
Corporate Governance in Emerging Economies: A Review of the
Principal – Principal Perspective. Journal of Management Studies, 45(1),
196–221.
Young, M. N., Peng, M. W., & Bruton, G. D. (2002). Governing the
corporation in emerging economies: a principal-principal perspective.
Academy of Management Proceedings, 1–8.
Zahra, S. A., & George, G. (2002). Absorptive Capacity : A Review, and
Extension. Academy of Management Review, 27(2), 185–203.
Zeitun, R., & Tian, G. G. (2007). Capital structure and corporate performance:
evidence from Jordan. Australasian Accounting Business and Finance
Journal, 1(4), 40–61.
Zheka, V. (2005). Corporate governance, ownership structure and corporate
efficiency: The case of Ukraine. Managerial and Decision Economics,
26(7), 451–460.
Zheka, V. (2006). Corporate Governance and Firm Performance in Ukraine.
Cntre Economic Reform and Transformation (Vol. xxx).
Zhou, Q., Faff, R., & Alpert, K. (2014). Bias correction in the estimation of
dynamic panel models in corporate finance. Journal of Corporate
Finance, 25, 494–513.
Zhu, H., Xia, J., & Makino, S. (2015). How do high-technology firms create
value in international M&A? Integration, autonomy and cross-border
contingencies. Journal of World Business, 50(4), 718–728.
Zimková, E. (2014). Technical Efficiency and Super-Efficiency of the
Banking Sector in Slovakia. Procedia Economics and Finance,
12(March), 780–787.


![Ownership, Concentration, Convergence: Google [2010-11]](https://static.fdocuments.in/doc/165x107/559a5fac1a28abc41d8b4751/ownership-concentration-convergence-google-2010-11.jpg)