THE IMPACT OF OWNERSHIP CONCENTRATION PERFORMANCE...
150
THE IMPACT OF OWNERSHIP CONCENTRATION AND BOARD GOVERNANCE ON FIRM PERFORMANCE: MALAYSIAN PUBLIC LISTED PROPERTY COMPANIES BY CHOONG HONG HUAN EMILY HUANG YI LIN SAI SING TZEH WONG HUEY MIIN YEOW CHAI TING A research project submitted in partial fulfillment of the requirement for the degree of BACHELOR OF BUSINESS ADMINISTRATION (HONS) BANKING AND FINANCE UNIVERSITI TUNKU ABDUL RAHMAN FACULTY OF BUSINESS AND FINANCE DEPARTMENT OF FINANCE APRIL 2014
Transcript of THE IMPACT OF OWNERSHIP CONCENTRATION PERFORMANCE...

THE IMPACT OF OWNERSHIP CONCENTRATION
AND BOARD GOVERNANCE ON FIRM
PERFORMANCE: MALAYSIAN PUBLIC LISTED
PROPERTY COMPANIES
BY
CHOONG HONG HUAN
EMILY HUANG YI LIN
SAI SING TZEH
WONG HUEY MIIN
YEOW CHAI TING
A research project submitted in partial fulfillment of the
requirement for the degree of
BACHELOR OF BUSINESS ADMINISTRATION
(HONS) BANKING AND FINANCE
UNIVERSITI TUNKU ABDUL RAHMAN
FACULTY OF BUSINESS AND FINANCE
DEPARTMENT OF FINANCE
APRIL 2014
The Impact of Ownership Concentration and Board Governance on Firm Performance
Undergraduate Research Project ii Faculty of Business and Finance
Copyright @ 2014
ALL RIGHTS RESERVED. No part of this paper may be reproduced, stored in a
retrieval system, or transmitted in any form or by any means, graphic, electronic,
mechanical, photocopying, recording, scanning, or otherwise, without the prior
consent of the authors.
The Impact of Ownership Concentration and Board Governance on Firm Performance
Undergraduate Research Project iii Faculty of Business and Finance
DECLARATION
We hereby declare that:
(1) This UBFZ3026 undergraduate Research Project is the end result of our own
work and that due acknowledgement has been given in the references to ALL
sources of information be they printed, electronic, or personal.
(2) No portion of this paper research project has been submitted in support of any
application for any other degree or qualification of this or any other university,
or other institutes of learning.
(3) Equal contribution has been made by each group member in completing the
research project.
(4) The word count of this research report is 22,929 words.
Name of Student: Student ID: Signature
1. CHOONG HONG HUAN 10ABB05306 __________
2. EMILY HUANG YI LIN 11ABB02302 __________
3. SAI SING TZEH 10ABB04552 __________
4. WONG HUEY MIIN 10ABB06639 __________
5. YEOW CHAI TING 11ABB01739 __________
Date: 10 APRIL 2014
The Impact of Ownership Concentration and Board Governance on Firm Performance
Undergraduate Research Project iv Faculty of Business and Finance
ACKNOWLEDGEMENT
This research project has been successfully completed with the assistance of
various authorities. We would like to take this opportunity to thank all those who
have helped in carrying out the research. Each of those who have offered
comments and suggestions has our thanks.
First of all, we would like to thank to University Tunku Abdul Rahman (UTAR)
for giving us this opportunity to conduct this research, topic as “The Impact of
Ownership Concentration and Board Governance on Firm Performance:
Malaysian Public Listed Property Companies”. Besides that, it provides a
completed research database for us to conduct this research project.
Secondly, we would like to express our deep gratitude to our research supervisor,
Cik Zuriawati Binti Zakaria for her patient guidance, enthusiastic encouragement
and useful critiques of this research work. During these two semesters, her
guidance, advice, valuable suggestion, constructive comment and commitment to
reply our queries promptly throughout this research work. Her willingness to give
her precious time so generously has been highly appreciated
Thirdly, we are grateful for the outstanding support from our parents and friends
who helped us a lot in finalizing this project within the limited time frame.
Finally, a special thanks to each of the members who contribute and participant in
this research work. They willing to scarified their valuable time and holidays in
order to work hard together to complete this research project. During this period,
we had developed deeper friendship with each other, thereby give us more
inspiration to complete this research successfully.
The Impact of Ownership Concentration and Board Governance on Firm Performance
Undergraduate Research Project v Faculty of Business and Finance
TABLE OF CONTENTS
Page
Copyright Page ……………………………………………………….….............ii
Declaration …………………………………………………...……………..…..iii
Acknowledgement …………………………………………..…….….…..……...iv
Table of Content ……………………………………………………..…………..v
List of Tables ……………………………………………………………..………x
List of Figures ……………………………………………..…………...………..xi
List of Abbreviations ……………………………………..……………...……...xii
List of Appendices …………………………………………..………….……...xiv
Preface ……………………………………………......…..………………..…….xv
Abstract ………………………………………………………………..………xvi
CHAPTER 1 RESEARCH OVERVIEW …..…...………………………………1
1.0 Introduction ………………………….……………………………. 1
1.1 Research Background.………………...……..…………………...1
1.1.1 Ownership Concentration…………………………………....2
1.1.2 Corporate Governance..………………………………...……6
1.1.2.1 Board Size………………………………………...7
1.1.2.2 Board Independence…………………………………9
1.2 Problem Statement ………………………….…………………….11
1.3 Research Objective ……………………………..............................13
1.3.1 General Objectives ………………………………………...13
1.3.2 Specific Objectives ……………………………...................13
1.4 Research Question ……………….……………….………………13
1.5 Hypothesis of the Study ……………………….….……………....13
1.6 Significant of Study ………………………………………………14
1.7 Chapter Layout …………………………………………………...15
1.8 Conclusion ……………………………………………...………...17
CHAPTER 2 LITERATURE REVIEW …………………………...…………….18
2.0 Introduction …………………………….……………….…...…….18
The Impact of Ownership Concentration and Board Governance on Firm Performance
Undergraduate Research Project vi Faculty of Business and Finance
2.1 Review of Literature …………………………………………..…..18
2.1.1 Independent Variables………………………………………19
2.1.1.1 Ownership Concentration and Firm Performance.…...19
2.1.1.2 Board Size and Firm Performance................................21
2.1.1.3 Board Independence and Firm Performance………....23
2.1.2 Control Variables……………………………………………25
2.1.2.1 Firm Growth and Firm Performance .….……….…....25
2.1.2.2 Firm Size and Firm Performance ……………...…….27
2.1.2.3 Leverage and Firm Performance …………....…...…..29
2.2 Review of Relevant Theoretical Models ……………………….....31
2.2.1 Theory of Intellectual Capital of Corporate Governance…...31
2.2.2 Agency Cost ………………………………………………...34
2.2.3 Stewardship Theory ……………………………………......36
2.3 Proposed Theoretical Framework…..……………………………...38
2.4 Hypotheses Development ……………………………...……….....39
2.4.1 Ownership Concentration Influence the Firm‟s Performance in
Property Industry………………………..……………...…...39
2.4.2 Board Size Influence the Firm‟s Performance in Property
Industry……………………………...…………....…………39
2.4.3 Board Independence Influence the Firm‟s Performance in
Property Industry ……………………...……………………40
2.5 Conclusion …………………………………….………..…………40
CHAPTER 3 METHODOLOGY ………………………………….…..………. 41
3.0 Introduction …………………………………………...….………. 41
3.1 Research Design ……………………………………..……………41
3.2 Data Collection Method ……………………………..……………41
3.2.1 Secondary Data ………………………………….…………. 42
3.3 Sampling Design ……………………………………..………….. 43
3.3.1 Target Population ………………………………...………… 43
3.3.2 Sampling companies…………………………………….44
3.3.3 Sampling Technique………………………...…..……….......44
3.3.3.1 E- Views 6…….…….………………………………44
3.3.3.2 Panel Data………….……………….…….…………45
The Impact of Ownership Concentration and Board Governance on Firm Performance
Undergraduate Research Project vii Faculty of Business and Finance
3.3.4 Sampling Size …………………………………...…………. 46
3.4 Data Processing ………………………………………...………… 48
3.4.1 Dependent Variable ……………………………...……….... 49
3.4.1.1 Firm Performance …………….…………...………… 49
3.4.2 Independent Variables …………………………....…………50
3.4.2.1 Ownership Concentration …………………………… 50
3.4.2.2 Board Size ………………………….………..………. 50
3.4.2.3 Board Independence……………………….………… 51
3.4.3 Control Variables …………………………………..……… 51
3.4.3.1 Firm Growth ……………………………….…..……. 51
3.4.3.2 Firm Size ………………….……..………….. ……….52
3.4.3.3 Leverage …………………………………………….. 52
3.5 Data Analysis ………………………………..…………………… 45
3.6 Diagnostic Checking………………………………………………52
3.6.1 Normality of Residuals Test ………………………………...53
3.6.2 Multicollinearity …………………….……………….……..53
3.6.3 Heteroscedasticity …………………………….……………..54
3.6.4 Autocorrelation ………………………………………..….....55
3.7 Panel Regression Model………………………………………….55
3.7.1 Pooled OLS or Constant Coefficient Model……..……55
3.7.2 Fixed Effect Model (FEM)………………..……….………..56
3.7.3 Random Effect Model (REM)……………….………………57
3.8 Regression Analysis………………………………………………..58
3.8.1 F Test ………………………………………………………58
3.8.2 T Test …………………………………………..……………60
3.9 Conclusion …………………….…………………………………...60
CHAPTER 4 DATA ANALYSIS ……………………………………………....61
4.0 Introduction ……………………………………………………......61
4.1 Descriptive Analysis ………….…………………………………...61
4.1.1 Tobin‟s Q (TQ)………………………………………………62
4.1.2 Ownership Concentration (OC)……………………………...62
4.1.3 Board Size (BS)……………………………………………...62
4.1.4 Board Independence (BI)………………………………….....63
The Impact of Ownership Concentration and Board Governance on Firm Performance
Undergraduate Research Project viii Faculty of Business and Finance
4.1.5 Firm Growth (FG)……………………………………………63
4.1.6 Firm Size (FS)………………………………………………..64
4.1.7 Leverage (LE)………………………………………………..64
4.2 Diagnostic Checking……………………………………………….64
4.2.1 Normality Test……………………………………………….64
4.2.2 Multicollinearity……………………………………………..66
4.2.3 Autocorrelation………………………………………………67
4.3 Panel Regression Analysis………………………………………...68
4.3.1 Poolibility Hypothesis Testing………………………………68
4.3.2 Hausman Hypothesis Testing………………………………69
4.4 Regression Analysis………………………………………………..71
4.4.1 R-Square……………………………………………………71
4.4.2 F Statistic…………………………………….………….….72
4.4.3 T Statistic………………………………………..……….…73
4.4.3.1 Ownership Concentration (OC)……………………….75
4.4.3.2 Board Size (BS)……………………………….......…..75
4.4.3.3 Board Independence (BI)……………………………...76
4.4.3.4 Firm Growth (FG)…………………………………….76
4.4.3.5 Firm Size (FS)………………………………………...77
4.4.3.6 Leverage (LE)…………………………………………77
4.5 Conclusion……………………………………...………………..81
CHAPTER 5 DISCUSSION, CONCLUSION AND IMPLICATIONS ….....….82
5.0 Introduction …………………………………………………….….82
5.1 Summary of Regression Statistics……………………………….82
5.2 Discussion of Major Finding ……………………………………...86
5.2.1 Ownership Concentration …………………………………...86
5.2.2 Board Size …………………………………………………...87
5.2.3 Board Independence ………………………………………...88
5.2.4 Firm Growth ………………………………………………...90
5.2.5 Firm Size …………………………………………………….91
5.2.6 Leverage ……………………………………………………..91
5.3 Implications of the Study…………………………………………..92
5.3.1 Property Industry ……………………………………………92

The Impact of Ownership Concentration and Board Governance on Firm Performance
Undergraduate Research Project ix Faculty of Business and Finance
5.3.2 Policy Maker ………………………………………………...93
5.3.3 Investor ……………………………………………………...94
5.3.4 Academic…………………………………………………….94
5.4 Limitations of the Research Study ………………………………...95
5.5 Recommendations for Future Study ……………………………..95
5.6 Conclusion ………………………………………………………...96
References………………………………………………………………………..98
Appendices ……………………………………………………………………..114
The Impact of Ownership Concentration and Board Governance on Firm Performance
Undergraduate Research Project x Faculty of Business and Finance
LIST OF TABLES
Page
Table 1.1 : Ownership Changes of Public Listed Companies in East
Asia………………………………………………………………..5
Table 1.2 : Rules and Recommendations on the Number of Independent
Director on Boards of Companies in Asian Countries……….10
Table 3.1 : Sources of Variables…………………..………………………….42
Table 3.2 : Data Filtration for Model 1…………………………………….47
Table 3.3 : Data Filtration for Model 2 and Model 3………………………...47
Table 4.1 : Summary of Descriptive Statistic of All Variables ……………...61
Table 4.2 : Jarque-Bera (JB) Test….………………………………………....64
Table 4.3 : Correlation in All Firms (Model 1)……………………………....66
Table 4.4 : Correlation in High Ownership Concentration Firms (Model 2)...66
Table 4.5 : Correlation in Low Ownership Concentration Firms (Model 3)…66
Table 4.6 : Durbin-Watson Test……………………………………………...67
Table 4.7 : Poolibility Test…………………..………………………………68
Table 4.8 : Hausman Test……………………………...……………………..70
Table 4.9 : R-Square………………………………………………………….71
Table 4.10 : F-Statistic………………………………………………………...72
Table 4.11 : Historical Hypothesis for Independent Variables.....…………….73
Table 4.12 : T Statistic for Model 1, 2 and 3 ………….………………………74
Table 4.13 : Comparison between Expectations and Regression Results for
Model 1…………………………………………………….……..79
Table 5.1 : Summary of T-Statistic Results (Model 1)...……………………..83
Table 5.2 : Summary of T-Statistic Results (Model 2)...……………………..84
Table 5.3 : Summary of T-Statistic Results (Model 3)...……………………..84
Table 5.4 : The Relationships between Firm Performance and Its Expected
Theories for Model 1……………………………………………..86
The Impact of Ownership Concentration and Board Governance on Firm Performance
Undergraduate Research Project xi Faculty of Business and Finance
LIST OF FIGURES
Page
Figure 2.1: Intellectual Capital Model of Board 33
Figure 2.2: Proposed Theoretical Framework 38
Figure 3.1: Data Processing 47

The Impact of Ownership Concentration and Board Governance on Firm Performance
Undergraduate Research Project xii Faculty of Business and Finance
LIST OF ABBREVIATIONS
ACGA Asian Corporate Governance Association
AMEX American Stock Exchange
BI Board Independence
BM Bursa Malaysia
BS Board Size
CEO Chief Executive Officer
CLT Central Limit Theorem
CMP Capital Market Master Plan
EMU European Monetary Union
FEC Federated Electrical Contractors
FEM Fixed Effect Model
FG Firm Growth
FS Firm Size
FSMP Financial Sector Master Plan
IPO Initial Public Offering
ISE Istanbul Stock Exchange
KSE Karachi Stock Exchange
LE Leverage
MCCG Malaysia Code on Corporate Governance
MICG Malaysian Institute of Corporate Governance
MSWG Minority Shareholders Watchdog Group
NASDAQ National Association of Securities Dealers Automated
Quotations
NSE Nigerian Stock Exchange
NYSE New York Stock Exchange
Obs Observations
OC Ownership Concentration
OECD Organization for Economic Co-operation and Development
OLS Ordinary Least Square
PM Profit Margin
R&D Research and Development
The Impact of Ownership Concentration and Board Governance on Firm Performance
Undergraduate Research Project xiii Faculty of Business and Finance
REM Random Effects Model
ROA Return on Asset
ROE Return on Equity
ROS Return on Sales
ROSC Report on Observance of Standards and Codes
SC Securities Commission
TQ Tobin‟s Q
TSE Tokyo Stock Exchange
The Impact of Ownership Concentration and Board Governance on Firm Performance
Undergraduate Research Project xiv Faculty of Business and Finance
LIST OF APPENDICES
Page
Appendix 1: List of 94 Malaysian Public Listed Property Companies during
2005 to 2010 (Model 1, 564 Obs)………………………………..114
Appendix 2: List of High Ownership Concentration Malaysian Public Listed
Property Companies during 2005 to 2010 (Model 2, 32
Obs) ……………………………………………………………..117
Appendix 3: List of High Ownership Concentration Malaysian Public Listed
Property Companies during 2005 to 2010 (Model 3, 532
Obs)…………………………………………………………...…119

The Impact of Ownership Concentration and Board Governance on Firm Performance
Undergraduate Research Project xv Faculty of Business and Finance
PREFACE
This research project is submitted in partial fulfillment of the requirement for
Bachelor of Business Administration (Hons) Banking and Finance. Cik Zuriawati
Binti Zakaria is the supervisor for this research project. This final year project is
made solely by the authors but it is based on the researches of others and the
sources are quoted in references.
There are a lot of researches and studies conclude on this topic, yet, there are very
few of them study about the variables in corporate governance which have impact
on the firm performance in Malaysian public listed property companies. This
research is interested to get more in depth understanding on the model of the
variables in corporate governance that will influence the firm performance.
Therefore, „the impact of ownership concentration and board governance on firm
performance: Malaysian public listed property companies‟ is chosen as the topic
for this research.
Writing this report is difficult but the researchers have gained a lot of knowledge
regarding the corporate governance in public listed companies which may be
helpful for their future career.
The Impact of Ownership Concentration and Board Governance on Firm Performance
Undergraduate Research Project xvi Faculty of Business and Finance
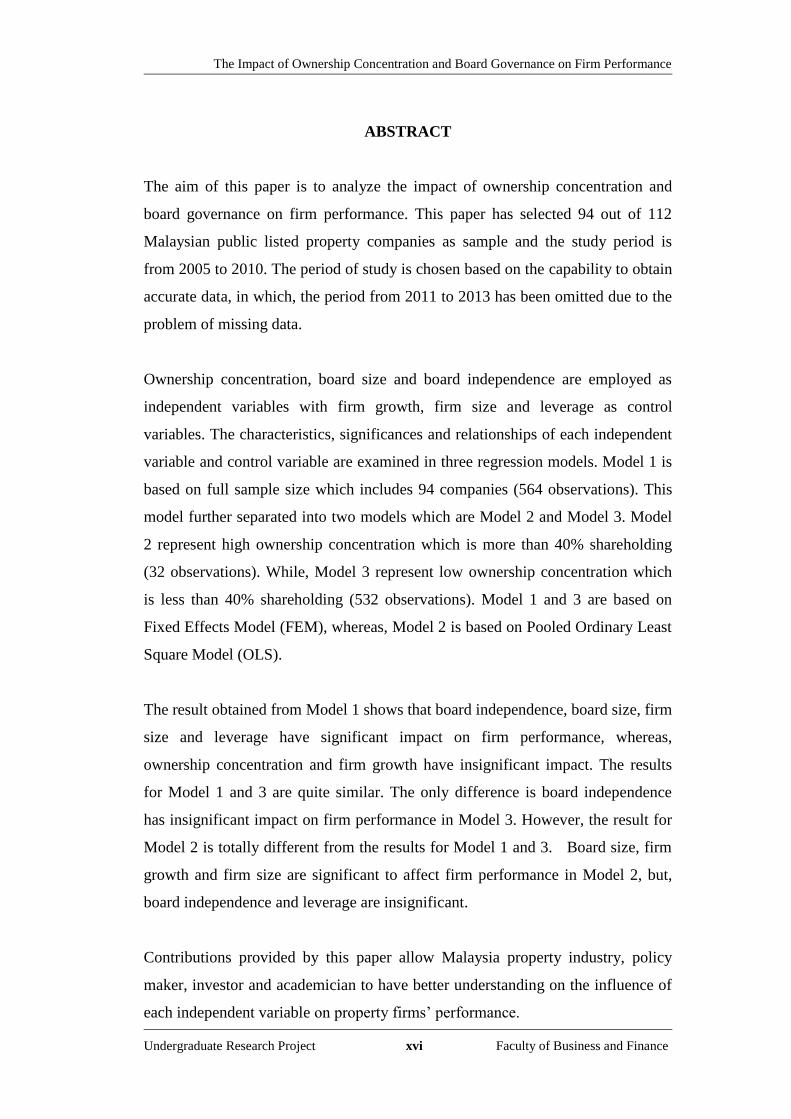
ABSTRACT
The aim of this paper is to analyze the impact of ownership concentration and
board governance on firm performance. This paper has selected 94 out of 112
Malaysian public listed property companies as sample and the study period is
from 2005 to 2010. The period of study is chosen based on the capability to obtain
accurate data, in which, the period from 2011 to 2013 has been omitted due to the
problem of missing data.
Ownership concentration, board size and board independence are employed as
independent variables with firm growth, firm size and leverage as control
variables. The characteristics, significances and relationships of each independent
variable and control variable are examined in three regression models. Model 1 is
based on full sample size which includes 94 companies (564 observations). This
model further separated into two models which are Model 2 and Model 3. Model
2 represent high ownership concentration which is more than 40% shareholding
(32 observations). While, Model 3 represent low ownership concentration which
is less than 40% shareholding (532 observations). Model 1 and 3 are based on
Fixed Effects Model (FEM), whereas, Model 2 is based on Pooled Ordinary Least
Square Model (OLS).
The result obtained from Model 1 shows that board independence, board size, firm
size and leverage have significant impact on firm performance, whereas,
ownership concentration and firm growth have insignificant impact. The results
for Model 1 and 3 are quite similar. The only difference is board independence
has insignificant impact on firm performance in Model 3. However, the result for
Model 2 is totally different from the results for Model 1 and 3. Board size, firm
growth and firm size are significant to affect firm performance in Model 2, but,
board independence and leverage are insignificant.
Contributions provided by this paper allow Malaysia property industry, policy
maker, investor and academician to have better understanding on the influence of
each independent variable on property firms‟ performance.
The Impact of Ownership Concentration and Board Governance on Firm Performance
Undergraduate Research Project Page 1 of 134 Faculty of Business and Finance
CHAPTER 1: RESEARCH OVERVIEW
1.0 Introduction
This study aim to investigate and analyze factors that might affect the
performance of Malaysian public listed property firms, which includes ownership
concentration (OC), board size (BS), board independence (BI), firm growth (FG),
firm size (FS) and leverage (LE) of the companies. This chapter covers research
background, problem statement, research objective, research questions, hypothesis
that are to be tested, significant of this study and chapter layout.
1.1 Research Background
Asian financial crisis, especially in July 1997, had proven that a company to have
good corporate governance does matter. This issue has then attracted attention
from many agencies in Asia countries, including in Malaysia (Ariff, Ibrahim &
Othman, 2007). The reason is because bad corporate governance standard has
been blamed to contribute to the Asian financial crisis happen in 1997 and 1998
(Liew, 2008). Furthermore, Liew (2008) argued the effectiveness of policy
implemented for corporate governance reform in Malaysia, the policies has not
accommodate in solving or focusing strictly on local problems in the country. The
author further justify that corporate governance reforms in Malaysia have not been
adequate in affecting the foreign investors‟ attention. Moreover, in Malaysia Code
on Corporate Governance (MCCG), 2012 clearly state that Malaysia‟s investor
confidence seriously affected by the Asian Financial Crisis. Thus, policy makers
have now focusing on to enhance the corporate governance standard in Malaysia.
This show that Malaysia agency recognize the value of implementing a
sustainable corporate governance in support the economy and facing crisis in
future.

The Impact of Ownership Concentration and Board Governance on Firm Performance
Undergraduate Research Project Page 2 of 134 Faculty of Business and Finance
The main resource in corporate governance policies development in Malaysia can
be view in the Malaysian Code on Corporate Governance (MCCG), Financial
Sector Master Plan (FSMP) and Capital Market Master Plan (CMP). Malaysia
also established two institutions for the development of corporate governance
which include the Minority Shareholders Watchdog Group (MSWG) and
Malaysian Institute of Corporate Governance (MICG). MICG intention is to
increase the recognition and implementation of good corporate governance in
Malaysia corporate, whereas, MSWG is to protect the interests of minority
shareholders through shareholders activism.
1.1.1 Ownership Concentration
The blockholders can be defined as the parties who own large percentage
shares and bonds in the company. In terms of shares, the company
decisions are often being influenced significantly by the voting right of
these owners. In the term of blockholder, different country will have
different limit. For example, blockholders are those external stakeholder
who holds at least ten percent of the outstanding equity in the countries
such as United Kingdom, Arab and Pakistan (Beekes, Pope & Young,
2004; Javid & Iqbal, 2010; Omran, Bolbol & Fatheldin, 2008), while
investors who own at least five percent of company shares are considered
to be blockholders in Malaysia, which is supported by Barclay, Holderness
and Sheehan (2008). Besides, Ibrahimy and Ahmad (2012) also claim that
shareholders who owned at least five percent of company shares are
blockholders.
Ownership concentration can be defined as the number of blockholders
and the percentage of the blockholders owns the company shares. Ritcher
and Weiss (2013) define ownership concentration as the allocation of
ownership rights among different parties who own the firm collectively.
The Impact of Ownership Concentration and Board Governance on Firm Performance
Undergraduate Research Project Page 3 of 134 Faculty of Business and Finance
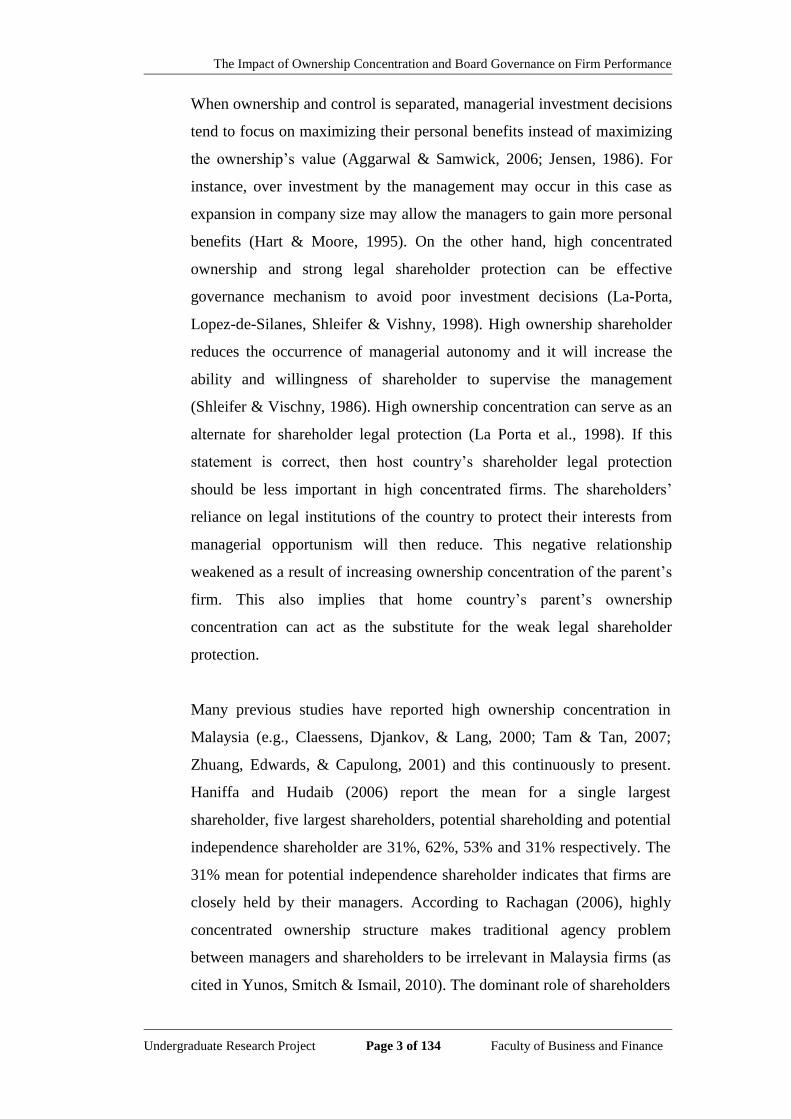
When ownership and control is separated, managerial investment decisions
tend to focus on maximizing their personal benefits instead of maximizing
the ownership‟s value (Aggarwal & Samwick, 2006; Jensen, 1986). For
instance, over investment by the management may occur in this case as
expansion in company size may allow the managers to gain more personal
benefits (Hart & Moore, 1995). On the other hand, high concentrated
ownership and strong legal shareholder protection can be effective
governance mechanism to avoid poor investment decisions (La-Porta,
Lopez-de-Silanes, Shleifer & Vishny, 1998). High ownership shareholder
reduces the occurrence of managerial autonomy and it will increase the
ability and willingness of shareholder to supervise the management
(Shleifer & Vischny, 1986). High ownership concentration can serve as an
alternate for shareholder legal protection (La Porta et al., 1998). If this
statement is correct, then host country‟s shareholder legal protection
should be less important in high concentrated firms. The shareholders‟
reliance on legal institutions of the country to protect their interests from
managerial opportunism will then reduce. This negative relationship
weakened as a result of increasing ownership concentration of the parent‟s
firm. This also implies that home country‟s parent‟s ownership
concentration can act as the substitute for the weak legal shareholder
protection.
Many previous studies have reported high ownership concentration in
Malaysia (e.g., Claessens, Djankov, & Lang, 2000; Tam & Tan, 2007;
Zhuang, Edwards, & Capulong, 2001) and this continuously to present.
Haniffa and Hudaib (2006) report the mean for a single largest
shareholder, five largest shareholders, potential shareholding and potential
independence shareholder are 31%, 62%, 53% and 31% respectively. The
31% mean for potential independence shareholder indicates that firms are
closely held by their managers. According to Rachagan (2006), highly
concentrated ownership structure makes traditional agency problem
between managers and shareholders to be irrelevant in Malaysia firms (as
cited in Yunos, Smitch & Ismail, 2010). The dominant role of shareholders
The Impact of Ownership Concentration and Board Governance on Firm Performance
Undergraduate Research Project Page 4 of 134 Faculty of Business and Finance
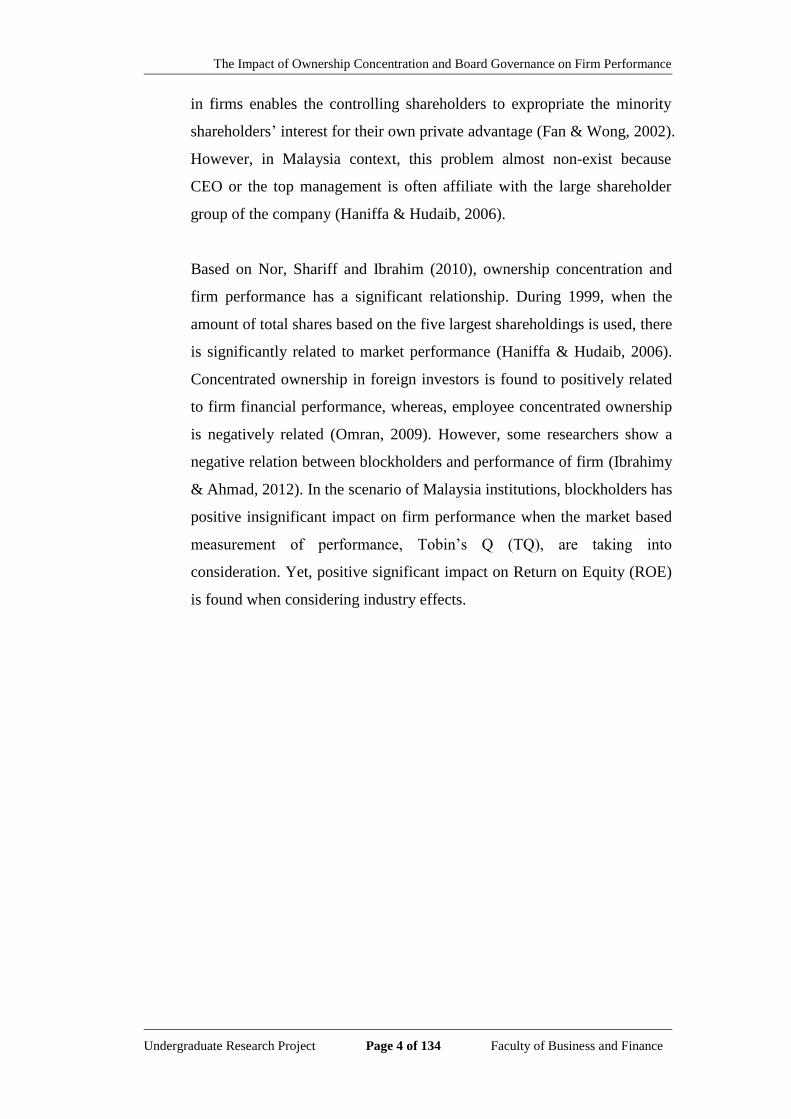
in firms enables the controlling shareholders to expropriate the minority
shareholders‟ interest for their own private advantage (Fan & Wong, 2002).
However, in Malaysia context, this problem almost non-exist because
CEO or the top management is often affiliate with the large shareholder
group of the company (Haniffa & Hudaib, 2006).
Based on Nor, Shariff and Ibrahim (2010), ownership concentration and
firm performance has a significant relationship. During 1999, when the
amount of total shares based on the five largest shareholdings is used, there
is significantly related to market performance (Haniffa & Hudaib, 2006).
Concentrated ownership in foreign investors is found to positively related
to firm financial performance, whereas, employee concentrated ownership
is negatively related (Omran, 2009). However, some researchers show a
negative relation between blockholders and performance of firm (Ibrahimy
& Ahmad, 2012). In the scenario of Malaysia institutions, blockholders has
positive insignificant impact on firm performance when the market based
measurement of performance, Tobin‟s Q (TQ), are taking into
consideration. Yet, positive significant impact on Return on Equity (ROE)
is found when considering industry effects.
The Impact of Ownership Concentration and Board Governance on Firm Performance
Undergraduate Research Project Page 5 of 134 Faculty of Business and Finance
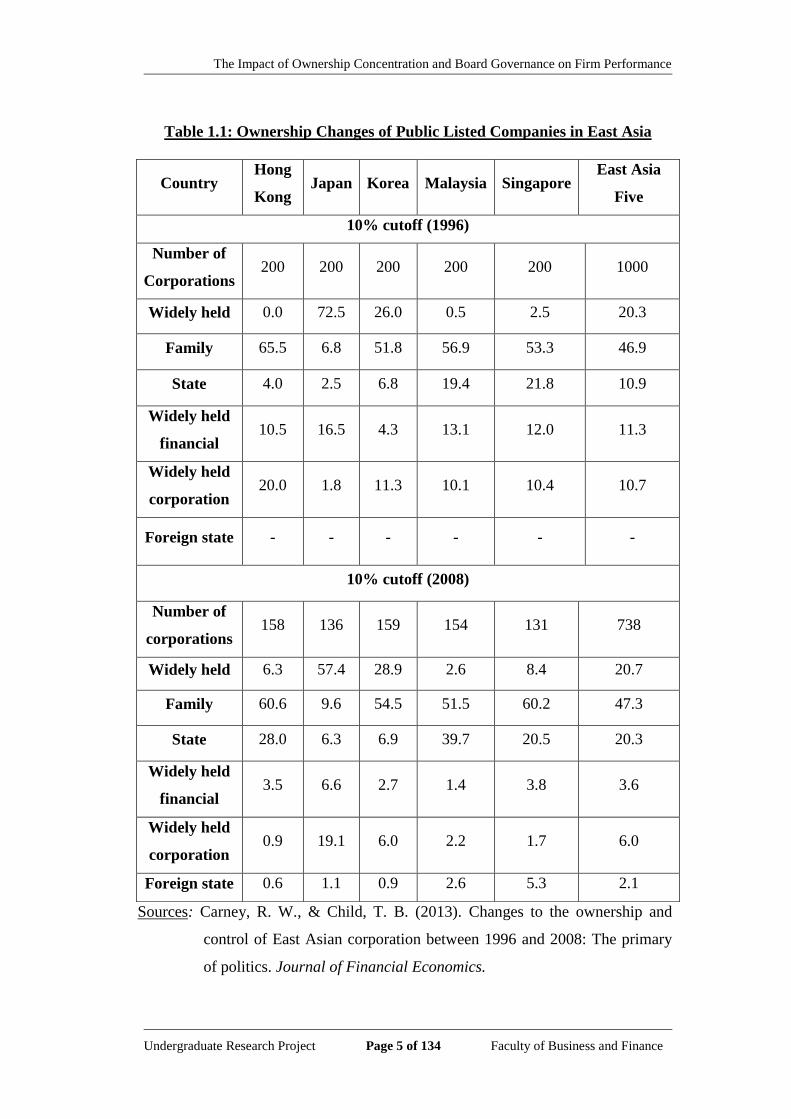
Table 1.1: Ownership Changes of Public Listed Companies in East Asia
Sources: Carney, R. W., & Child, T. B. (2013). Changes to the ownership and
control of East Asian corporation between 1996 and 2008: The primary
of politics. Journal of Financial Economics.
Country Hong
Kong Japan Korea Malaysia Singapore
East Asia
Five
10% cutoff (1996)
Number of
Corporations 200 200 200 200 200 1000
Widely held 0.0 72.5 26.0 0.5 2.5 20.3
Family 65.5 6.8 51.8 56.9 53.3 46.9
State 4.0 2.5 6.8 19.4 21.8 10.9
Widely held
financial 10.5 16.5 4.3 13.1 12.0 11.3
Widely held
corporation 20.0 1.8 11.3 10.1 10.4 10.7
Foreign state - - - - - -
10% cutoff (2008)
Number of
corporations 158 136 159 154 131 738
Widely held 6.3 57.4 28.9 2.6 8.4 20.7
Family 60.6 9.6 54.5 51.5 60.2 47.3
State 28.0 6.3 6.9 39.7 20.5 20.3
Widely held
financial 3.5 6.6 2.7 1.4 3.8 3.6
Widely held
corporation 0.9 19.1 6.0 2.2 1.7 6.0
Foreign state 0.6 1.1 0.9 2.6 5.3 2.1
The Impact of Ownership Concentration and Board Governance on Firm Performance
Undergraduate Research Project Page 6 of 134 Faculty of Business and Finance
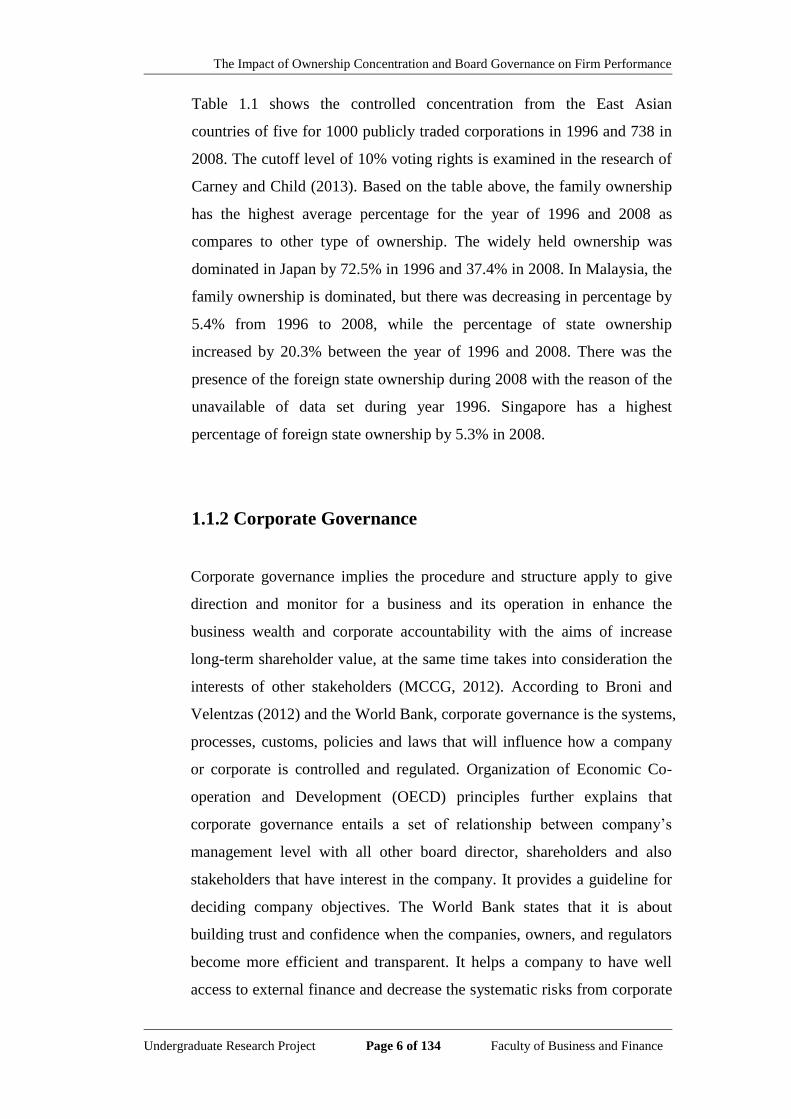
Table 1.1 shows the controlled concentration from the East Asian
countries of five for 1000 publicly traded corporations in 1996 and 738 in
2008. The cutoff level of 10% voting rights is examined in the research of
Carney and Child (2013). Based on the table above, the family ownership
has the highest average percentage for the year of 1996 and 2008 as
compares to other type of ownership. The widely held ownership was
dominated in Japan by 72.5% in 1996 and 37.4% in 2008. In Malaysia, the
family ownership is dominated, but there was decreasing in percentage by
5.4% from 1996 to 2008, while the percentage of state ownership
increased by 20.3% between the year of 1996 and 2008. There was the
presence of the foreign state ownership during 2008 with the reason of the
unavailable of data set during year 1996. Singapore has a highest
percentage of foreign state ownership by 5.3% in 2008.
1.1.2 Corporate Governance
Corporate governance implies the procedure and structure apply to give
direction and monitor for a business and its operation in enhance the
business wealth and corporate accountability with the aims of increase
long-term shareholder value, at the same time takes into consideration the
interests of other stakeholders (MCCG, 2012). According to Broni and
Velentzas (2012) and the World Bank, corporate governance is the systems,
processes, customs, policies and laws that will influence how a company
or corporate is controlled and regulated. Organization of Economic Co-
operation and Development (OECD) principles further explains that
corporate governance entails a set of relationship between company‟s
management level with all other board director, shareholders and also
stakeholders that have interest in the company. It provides a guideline for
deciding company objectives. The World Bank states that it is about
building trust and confidence when the companies, owners, and regulators
become more efficient and transparent. It helps a company to have well
access to external finance and decrease the systematic risks from corporate
The Impact of Ownership Concentration and Board Governance on Firm Performance
Undergraduate Research Project Page 7 of 134 Faculty of Business and Finance
crisis and financial scandals. Corporate governance enables a country to
control over the investments thus promote employment and economic
growth. A better monitoring can detect corporate inefficiencies and
reduces the corporate exposure to financial crisis. However, Shleifer and
Vishny (1997) defines corporate governance as the way in which capital
providers guard their invested capital and to get a return from its by
ensuring that managers do not misuse the capital on unprofitable project or
took the capital they supply. In other words, corporate governance is the
way that the suppliers of finance control the act of managers.
Corporate governance is broadly view as the governance of the board.
Corporate board of directors are the central aspect of the internal
governance of a corporation which responsible to provide strategic
direction (Lefort & Urzua, 2008). In addition, board of director also
function as the separation of ownership and control which reponsible to
control the agency problem between disperse shareholders and the
management team in a corporation (Fama & Jensen, 1983). They are the
control mechanism for monitoring the behavior of the top management.
Corporate Governance Blue Print (2011) states that, the main
responsibility of board is to create a corporate culture. Thus, the board‟s
role in governance is very important. The elements of corporate
governance usually measure as in the control board size as well as board
independence.
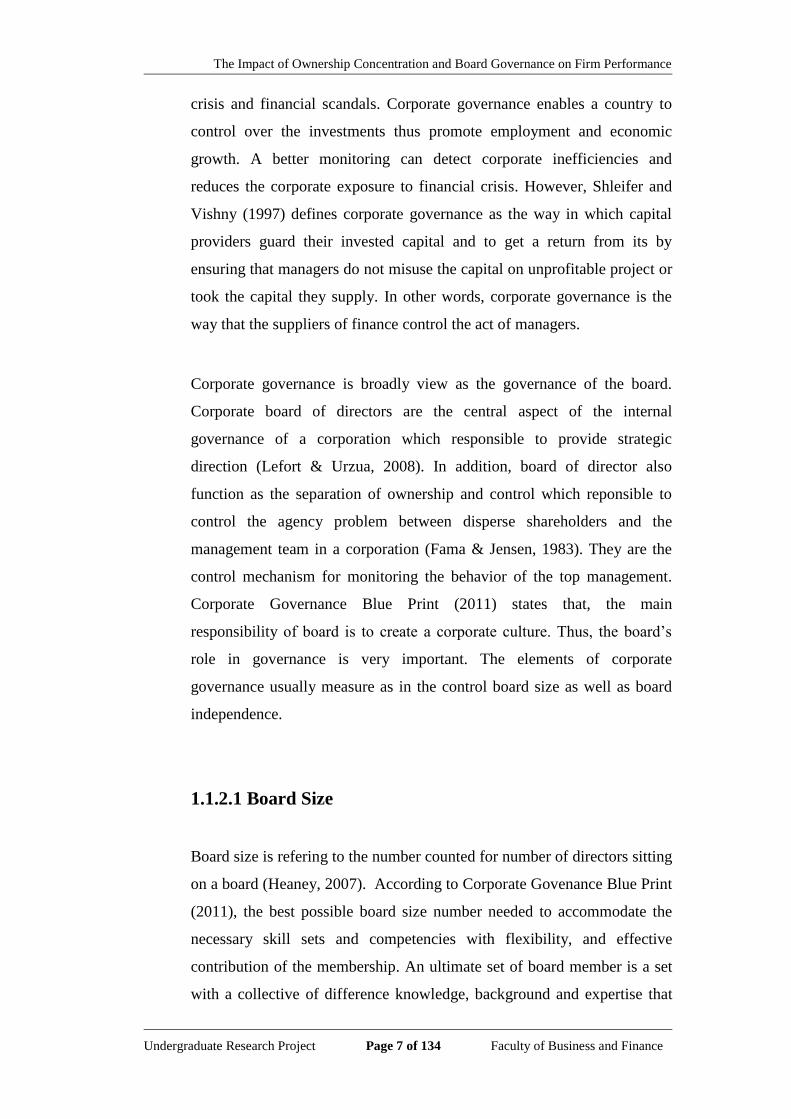
1.1.2.1 Board Size
Board size is refering to the number counted for number of directors sitting
on a board (Heaney, 2007). According to Corporate Govenance Blue Print
(2011), the best possible board size number needed to accommodate the
necessary skill sets and competencies with flexibility, and effective
contribution of the membership. An ultimate set of board member is a set
with a collective of difference knowledge, background and expertise that

The Impact of Ownership Concentration and Board Governance on Firm Performance
Undergraduate Research Project Page 8 of 134 Faculty of Business and Finance
bring benefits in making the best result which then improves the firm
performance. The number of board in Malaysia companies is different. The
size is differ depends on the needs as due to the nature, size and board
culture of a business. Based on the survey from Corporate Govenance Blue
Print (2011), it reveals that the average board size is six to seven. Taking
examples from Bursa Malaysia, Keladi Maju Bhd, KSL Holdings Bhd and
Petaling Tin Bhd, the company board consists of seven directors. Apart
from that, Tenaga National Bhd, Maybank Bhd and YTL Land &
Development Bhd are holding, more than average, twelve, twelve and
thirteen members respectively. Linck, Netter and Yang (2008) reveal the
trend of rapid decrease in board size in large US firms in 1990s. Moreover,
Heaney (2007) finds the board size in East Asian firm from 1997 to 2002,
on average, increase in Indonesia and decrease in Philippines and
Singapore.
Conger and Lawler (2009) who study on the relationship between board
size and corporate performance, argue that there is no one suitable size for
all board as the right size for a particular board is driven by how effective
the board can work as a team. They find that most of CEOs suggest that
their company ideal board size is between eight to twelve directors.
However, they suggest that a size of nine to thirteen board members is the
most likely right size for the majority of corporate boards, although this
number may be too small for a large corporation. Conger and Lawler
(2009) further propose that board size ought to be more than thirteen in the
case of the need for a broad area of knowledge and where there is a
number of significant stakeholder grouping is need to be present on the
board. The result is consistent with the findings of Bennedsen, Kongsted
and Nielsen (2008), they separate the effect of large board size and small
board size. First, no effect on performance is found when the board size at
the level of below than six directors (small board size). Second, a
significantly negative effect is found when the size of boards is from six to
more members. This result show that board size need to be at the ultimate
size as insufficient number of board will not result in firm performance and
go beyond the ideal board size may reduce a firm performance. Negative
The Impact of Ownership Concentration and Board Governance on Firm Performance
Undergraduate Research Project Page 9 of 134 Faculty of Business and Finance
effect of large board size on firm performance may be cause by inability of
the board to communicate effectively as the number increase (Guest, 2009).
1.1.2.2 Board Independence
Board independence is referring to the board members that have no interest
or ties to the company which could affect the independent of objective
judgement. An independence board member shall put the interest of the
company in priority above all other interests in making decision. A person
who has been appointed as independent director should be not related with
the management and not involve in any dealing or other relationship which
could get in the way of practicing independent decision or act in the best
interests of the company (Corporate Governance Blue Print, 2011). Linck,
et al. (2008) find that there is a trend of increasing more independent board
in the US firms in 1990s. This finding consistent with the Spencer Stuart
Board Index (2011) which reports that the independent directors in US
listing firms increase by 4% in 5 years where the increment is 77% in 2001,
81% in 2006 and 84% in 2011. For examples in Malaysia, Alliance
financial Group Bhd has six independent directors out of thirteen board
members and Genting Malaysia Bhd has six independent directors out of
nine board members. In Malaysia property industry, Berjaya Assets Bhd
has six independent directors out of ten board members and IJM Land Bhd
comprise of three independent directors out of seven board members. All
of the companies above are listed in Bursa Malaysia.
After the event of Asian Financial Crisis, many Asian countries have take
the initiative to establish rules and recommendations for the number of
independent board director as an effort to exercising corporate governance.
The table below shows the rules and recommended set for the number of
independent directors in a company board by corporate governance agency
in Asian Countries.
The Impact of Ownership Concentration and Board Governance on Firm Performance
Undergraduate Research Project Page 10 of 134 Faculty of Business and Finance
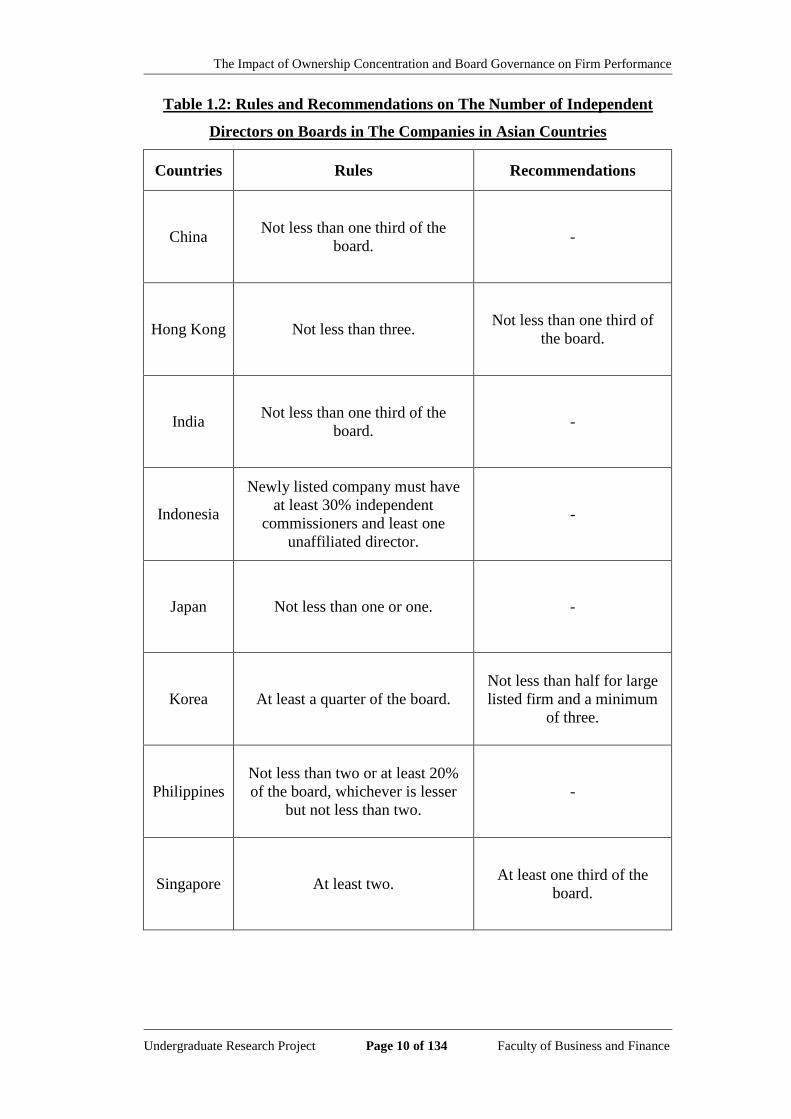
Table 1.2: Rules and Recommendations on The Number of Independent
Directors on Boards in The Companies in Asian Countries
Countries Rules Recommendations
China Not less than one third of the
board. -
Hong Kong Not less than three. Not less than one third of
the board.
India Not less than one third of the
board. -
Indonesia
Newly listed company must have
at least 30% independent
commissioners and least one
unaffiliated director.
-
Japan Not less than one or one. -
Korea At least a quarter of the board.
Not less than half for large
listed firm and a minimum
of three.
Philippines
Not less than two or at least 20%
of the board, whichever is lesser
but not less than two.
-
Singapore At least two. At least one third of the
board.

The Impact of Ownership Concentration and Board Governance on Firm Performance
Undergraduate Research Project Page 11 of 134 Faculty of Business and Finance
Countries Rules Recommendations
Taiwan
Newly listed firms must have not
less than two independent directors
and one independent supervisor.
At least two and not less
than 20% of the board.
Thailand Not less than one third of the board
and no less than three. -
Malaysia Not less than two or one-third of
the board, whichever is higher.
Not less than one third of
the board.
Sources: Asian Corporate Governance Association (ACGA),( 2010). Hong Kong
Table 1.1 shows the rules and recommendations on corporate governance
that implement by their government. It shows that most of the rules and
recommendations from the country stated above require corporate to
maintain at least two or one-third or up to 50% of the board of director to
be independent.
1.2 Problem Statement
The forthcoming mega initial public offerings (IPO), approval for new rail lines
and the award of government land project have made property sector a “new dawn”
in Malaysia (New dawn property sector re-rated, 2013). In other words, Malaysia
property sector has a good prospect. Hwang DBS Vickers Research (HDBSVR)
has re-rated the property sector from neutral gearing to positive gearing and this
would mean that the property investor will receive profits after considered all
costs (Malaysian property sector upgraded to Positive, 2013). Moreover, Malaysia
property market becomes a preferred place for foreign property investors after
Hong Kong and Singapore imposed 15 percent levies to “cool” their overheated
property market (Zurairi, 2013). With good corporate governance, the firm would
probably benefit from this situation. However, threatening of financial crisis as

The Impact of Ownership Concentration and Board Governance on Firm Performance
Undergraduate Research Project Page 12 of 134 Faculty of Business and Finance
well as the expected property bubble has raised the concern about whether good
corporate governance could prevent corporate collapse.
The evidences of the influence of corporate governance on firm performance
particular in developing countries are still relatively rare and scarce (Mashayekhi
& Bazaz, 2008). For example, Bauer, Frijns, Otten and Tourani-Rad (2008) and
Claessens, Djankov & Lang (2013) report that corporate governance is
significantly in explaining the firm performance, while Heracleous (2001) argue
that the relationship between corporate governance and financial performance to
be insignificant. Therefore, this paper attempts to examine and analyze the
relationship between corporate governance and firm performance particulate in
Malaysian public listed property (developing country).
Apart from that, in the assessment result of 2012 Corporate Governance Report on
Observance of Standards and Codes (ROSC) by World Bank, report that Malaysia
becomes a regional leader in corporate governance compare to the Indonesia,
India, Thailand, Philippines and Vietnam (World Bank calls Malaysia a regional
leader, 2013). Based on this report, the chairman of Securities Commission (SC),
Datuk Ranjit Ajit Singh, realize that it is the time for Malaysia to apply strong
corporate governance in order to maintain active investor interest and substantial
growth in the economic and financial system (M‟sia gets kudos from World Bank,
2013). However, until recently, the majority of researchers have focused on the
study of the impact of ownership concentration and board governance on firm
performance in particular countries, such as Chile (Lefort & Urzua, 2008), Hong
Kong (Jaggi, Leung & Gul, 2009) and so on, but yet still remain rare conducting
in Malaysian property industry. Therefore, there is a need to establish an overall
relationship between corporate governance and firm performance through
ownership concentration and board governance.
The Impact of Ownership Concentration and Board Governance on Firm Performance
Undergraduate Research Project Page 13 of 134 Faculty of Business and Finance
1.3 Research Objective
The research objectives of this study are based on the problems statement.
1.3.1 General Objectives
This study is conducted to examine ownership concentration and board
governance that will influence the company financial performance in listed
property industry in Malaysia
1.3.2 Specific objectives
a) To examine how the ownership concentration bring impact to the firm
performance.
b) To study how the board size bring impact to the firm performance.
c) To determine how board independence bring impact the firm
performance.
1.4 Research Question
a) Will ownership concentration bring impact to the firm performance?
b) Will board size bring impact to the firm performance?
c) Will board independence bring impact to the firm performance?
1.5 Hypothesis of the Study
This study main concern is to find how the ownership concentration and board
governance affect the firm financial performance in Malaysian public listed

The Impact of Ownership Concentration and Board Governance on Firm Performance
Undergraduate Research Project Page 14 of 134 Faculty of Business and Finance
property firms. The first hypothesis is to test whether the ownership concentration
will have impact on the firm performance. Among several elements in corporate
governance (e.g., board size, board independence, CEO duality), in which, board
size and board independence are chosen in this study. So, the second hypothesis
will be whether board size will affect the firm performance and the third
hypothesis is to test whether there is an effect of board independence on the firm
performance. In total, there will be three hypotheses in this research. Besides,
there is three other variables act as control variables (e.g., firm growth, firm size
and leverage) in the research which include firm growth, firm size and leverage.
Whenever the final result show the significant level is more than 0.10, 0.05 or
0.01 the null hypothesis will be accepted, while rejecting null hypothesis if the
significant level result less than 0.10, 0.05 or 0.01.
1.6 Significant of Study
Principles of Corporate Governance as published by the Organization for
Economic Cooperation and Developments (OECD) in 2004 has mentioned that a
good corporate governance has major contribution in stimulating economic
efficiency and enhancing investors‟ confidence (Organization for Economic
Cooperation and Developments, 2004). This research is designed to help the
policy makers, corporations, individual investors and academicians in raising their
awareness of the contribution of corporate governance.
This study is to help Malaysia policy makers to understand the importance of
good corporate governance in attracting investment and stabilizing market, which
in turn promoting economic growth. Besides, this study is also beneficial to the
policy makers in designing new policies that aid the Malaysia economy to achieve
highest sustainable growth and hence raising the living standard of Malaysian
(Bhagat & Bolton, 2008).
Moreover, this study will also help Malaysian public listed property firms to have
a better understanding on the types of corporate governance as well as the
The Impact of Ownership Concentration and Board Governance on Firm Performance
Undergraduate Research Project Page 15 of 134 Faculty of Business and Finance
variables that will enhance firm‟s financial performance. Thus, the firm could
apply proper corporate governance to enjoy the benefits that brought by good
corporate governance (Mulili & Wong, 2011). With an increment in the firm‟s
financial performance, the firm will continue to grow and may have the
opportunity to expand its business. Thus, unemployment rate in Malaysia may
decrease.
In addition, individual investors are also one of the beneficiaries of this study.
Since the firm‟s financial performance might improve if the firm adheres to proper
corporate governance, individual investors may take into consideration of the
corporate governance of that particular firm while making their investment
decision (Joel & Romuald, 2012). This study will give the individual investors
insight on the types of corporate governance that is beneficial to the firm‟s
financial performance and hence assist individual investors in making investment
decision.
Last but not least, this study also brings benefits to academia. Since there are very
few research regarding corporate governance has been done in Malaysia property
sector, this research can act as guidance for students on their future research.
1.7 Chapter Layout
Chapter One
Corporate governance and firm performance is the scope of this study. In this
chapter provides the overview and introduction regarding ownership concentration,
corporate governance, board size and board independence from the general view
narrow to the view of Malaysian public listed property firms. Besides that,
problem statement, research objectives, research question, hypothesis of study and
significant of the study are covered.
The Impact of Ownership Concentration and Board Governance on Firm Performance
Undergraduate Research Project Page 16 of 134 Faculty of Business and Finance
Chapter Two
This research consists of three independent variable and three control variables
which are ownership concentration, board size, board independence, firm growth,
firm size and leverage. The literature reviews are carried out based on previous
studies which cover the evidence of positive and negative relationship between all
independents variables and firm performance. Moreover, three relevant theoretical
models, proposed theoretical or conceptual framework, hypothesis developments
have been reviewed in this chapter.
Chapter Three
This chapter focuses on describing the designation of this research, data collection
method, data analysis method and sampling design. Based on the secondary data
collected proceed to data process through formulas suggested by previous
researchers.
Chapter Four
Based on the results produced by Electronic Views 6 (E- Views 6), this chapter
provides further analysis and explanation on Malaysian public listed property
firms.
Chapter Five
This chapter provides a table for summarizing the regression analysis in chapter
four. Besides that, it emphasizes on whether these findings are consistencies with
previous studies and provide the reason for supporting each variables‟ results.
Furthermore, the implications and limitations of the study and recommendations
for future research are all covered in this chapter.

The Impact of Ownership Concentration and Board Governance on Firm Performance
Undergraduate Research Project Page 17 of 134 Faculty of Business and Finance
1.8 Conclusion
This chapter had covered research background, problem statement, research
objectives with general and specific objectives, research questions, hypothesis of
study and significant of the study. However, the research questions will be
answered in literature review in chapter two. Besides, the further elaboration on
the relationship of independent variables (ownership concentration, board size and
board independent) and control variables (firm growth, firm size and leverage)
with dependent variable (firm performance) will also be discussed in chapter two.
The Impact of Ownership Concentration and Board Governance on Firm Performance
Undergraduate Research Project Page 18 of 134 Faculty of Business and Finance
CHAPTER 2: LITERATURE REVIEW
2.0 Introduction
In this chapter emphasizes on the literature reviews from past researchers. All of
the results concluded from all journals and articles will be clearly indicated in this
chapter. In order to investigate the linkage exits between dependent variable (firm
performance) and independent variables (ownership concentration, board size,
board independence) and control variables (firm growth, firm size and leverage),
the actual framework, theoretical framework and hypothesis are identified.
2.1 Review of Literature
Based on Gujarati and Porter (2009), dependent variable is defined as the variable
that being examined and it is depending on other factors, while independent
variable, which also known as explanatory variable, is defined as the variable that
used to explain the dependent variable. In a regression model, the dependent
variable is identified as a linear function of at least one independent variable.
Control variable is defined as the variable which of secondary interest but has
effect on the relationship between dependent variable and independent variables.
Dependent variable for this research is firm performance. While, ownership
concentration, board size and board independence are employed as independent
variables. Firm growth, firm size and leverage represent as control variables.
The Impact of Ownership Concentration and Board Governance on Firm Performance
Undergraduate Research Project Page 19 of 134 Faculty of Business and Finance
2.1.1 Independent Variables
2.1.1.1 Ownership Concentration and Firm Performance
The measurement of the ownership concentration is calculated by the
percentage of total shareholding by the firm‟s top five shareholders. A
blockholder is the people that own more than five percent of the firm‟s
equity or share (Javid & Iqbal, 2010).
In the research done by Barclay and Holderness (1989), they find a
positive correlation between ownership shareholding and company
performance by using a total of 394 sample selected randomly from
National Association of Securities Dealers Automated Quotations
(NASDAQ) listed, American Stock Exchange (AMEX) listed, or New
York Stock Exchange (NYSE) listed corporations which have at least one
shareholder with at least five percent of shareholdings in 1982 and it was
continuously traded in 1986. Holderness & Sheehan (1988) also find that
ownership shareholder have positive relation with firm performance by
analyzing total 114 sample of corporations from NYSE-listed or AMEX-
listed, with at least one investor owned more than ten percent (as cited in
Haniffa & Hudaib, 2006). In conjunction of this, McConnell and Servaes
(1990) find the positive result by using Tobin‟s Q method with
blockholders who own at least five percent outstanding stock based on a
sample of two years, 1976 and 1986 years, with 1173 and 1093 sample
firms respectively. After the ownership endogeneity has been controlled,
they indicate that concentrated ownership and firm performance has
positive relationship (Omran, 2009). Based on Omran (2009), there will be
positive relationship on firm performance when the board composition
following privatization being changed and the outside directors in higher
proportion occur. Javid and Iqbal (2010) reveal the result when 50 samples
of different manufacturing firms of Pakistan‟s economy during 2003 to
2008 are used, the foreign and family concentrated ownership has positive
and significant effect on firm performance. This is due to the control will
The Impact of Ownership Concentration and Board Governance on Firm Performance
Undergraduate Research Project Page 20 of 134 Faculty of Business and Finance
not be uncertain when acquire the major shareholdings and this will result
in the ownership concentration might extract the resources of the corporate
for self-benefits in a way that might bring the firm performance a negative
effect.
Based on Haniffa and Hudaib (2006), the „insider model‟ or the
„convergence-of-interest‟ of corporate governance claim that the existence
of the relationship between ownership shareholding and firm performance.
Shareholder that holding large share in the company has the right to
monitor the management. Besides, since they are eligible to bear the
proportion of managers‟ value-destroying actions, they have the essential
power in influencing the policies of the company. This is due to the higher
the financial risk, the higher the costs for unable to fulfill the shareholder
wealth maximization. Many researchers (e.g., Hermalin & Weisbach, 1991;
Javid & Iqbal, 2010; McConnell & Servaes, 1990; Nor, Shariff & Ibrahim,
2010; Omran, 2009) are using Tobin‟s Q to calculate the ownership
concentration. McConnell and Servaes (1990) find that during the
inflection point between forty and fifty percent of ownership, they find out
a relation with inverted U-shaped between Tobin‟s Q and managerial
ownership. Besides, Hermalin and Weisbach (1991) find that the Tobin‟s
Q is positive relation with the ownership blockholder up to one percent
and five to twenty percent, and negative relation between one to five
percent and more than twenty percent, by using the sample firm size of
142.
Based on Nor, Shariff and Ibrahim (2010), they show that the concentrated
ownership is positively related to the performance of the firm in the
institution sector. The consumer product firm is dominated by the
individual‟s equity holders, whereas, industrial product sector is dominated
by the institutional shareholders. ROA regression is used in their findings.
From the result, the effect is mainly concentrated from the government
shareholdings in plantation industry and the government act as the legal
institution monitors their performance. The director equity holding in their
finding act as important ownership determinant to ensure the best result as
The Impact of Ownership Concentration and Board Governance on Firm Performance
Undergraduate Research Project Page 21 of 134 Faculty of Business and Finance
measured by Market Value Added, Market Book Value Ratio, and Tobin‟s
Q. The regression of Tobin‟s Q shows that ownership concentration is
dictated by the institutional shareholders in construction, industrial product
and property industries, while dictated by the nominees, individuals, and
the directors holding in the consumer product industry.
However, Omran et al. (2008) using the two-stage least squares regression,
show that ownership concentration has insignificant effect on firms‟ profit
and performance. The merger of ownership and managerial interest
through the ownership concentration may enhance the firm performance.
This means the fact that the raising of the firm‟s capital has slightly
influence in public markets. However, through family ties or personal
relationships-legal protection of creditors must be stress rather than
improving other aspects of corporate governance since any significant
expansion in external finance will end up to become debt.
From the result of the literature review mentioned above, most of the
findings proved that the ownership concentration has positive influence on
the firm performance. So, this study expects that the ownership
concentration and the firm performance will be positive related. As the
concentration of the ownership increase in percentage, the firm
performance will also increase.
2.1.1.2 Board Size and Firm Performance
Board size refers to the efficiency of board members which normally
involve communication, coordination, control and decision making. Board
effectiveness is based on two perspectives which are larger or smaller
board size entitles to determine firm performance (Nicholson & Kiel,
2003).
Most empirical studies (e.g., Eisenberg, Sundgen & Wells, 1998; Mak &
Kusnadi, 2005; Yermack, 1996) show significant negative results between

The Impact of Ownership Concentration and Board Governance on Firm Performance
Undergraduate Research Project Page 22 of 134 Faculty of Business and Finance
board size and firm performance, thereby decreasing the potentiality of
agency problem. They also claims that agency problem is varies with
organizational structure. Yermack (1996) is the first author who reports a
negative relationship on 452 United States (US) public firms‟ board size
and firm performance in the period of 1984 to 1991 and applying Tobin‟s
Q as firm value measurement. He discusses that smaller board size (below
six members) is likely to generate higher returns and provide better CEO
performance. Conversely, Yermack (1996) argues that larger board size
(above 24 members) bring hassle to firm such as poor communications and
lower operating efficiency. This result also implies that the firm value
decrease as board size increase and it is highly correlated to certain
variables, such as firm size, inside stock ownership, board composition,
the presence of growth opportunities and different corporate governance
structures.
Along the similar line, Mak and Kusnadi (2005) prove that the relationship
between board size and firm performance on 550 Malaysia and Singapore
public listed firms are negative correlated, using Tobin‟s Q as firm
performance measurement. They also prove that five members of board is
consider small board size and can achieve the maximization value of firm,
while other variables (e.g., firm age, leverage) also affect firm value in
Malaysia and Singapore respectively. Eisenberg et al. (1998) also provide
the same empirical results. In which, ROA has been applied to examine
500 Finnish firms‟ board size and firm profitability. This implies that the
larger board size give the rise to cumbersome in communication and
coordination, also, decreases ability of the board in term of management,
manipulation and control, thereby trigger the agency problem.
In contrast to these studies, some papers (e.g., Abidin, Kamal & Jusoff,
2009; Kajola, 2008; Nicholson & Kiel, 2003) produce a significant
positive impact between board size and firm performance. Nicholson and
Kiel (2003), for example, examine that the size of board positively
affecting firm value in a sample of 348 Australia public listed firms,
measured by Tobin‟s Q and ROA. This result can be explained by the
The Impact of Ownership Concentration and Board Governance on Firm Performance
Undergraduate Research Project Page 23 of 134 Faculty of Business and Finance
intellectual capital theory of corporate governance. In which, correct skills
and knowledge have to be combined with the numbers of board in order to
deliver sufficient needs at particular point of time. Finally, larger board
size allows greater capabilities and qualities to corporate governance.
Similarly, Kajola (2008) apply Return on Equity (ROE) to demonstrate a
positive relationship between board size and firm performance among 20
Nigerian Stock Exchange (NSE) listed firm in the period of 2000 and 2006.
On average, 9 members are the preferable size for a firm. Abidin et al.
(2009) prove that board size has a positive impact on 75 Malaysian listed
firms‟ performance. This is because larger board size allows more
capabilities such as ideas, experiences and skills to be shared within
corporate management. This result also implies that there are on average
eight boards of directors on board are performing more effectively in a
large group.
As for whole, this study therefore expects that Malaysian public listed
firms has a significant positive effect on firm performance. This implies
that the higher the board size brings higher value to firm.
2.1.1.3 Board Independence and Firm Performance
Fama and Jensen (1983) and Rusmin, Scully, Tower and Taplin (2009)
state that the agency problem is the conflict of interest between
shareholder and manager which the theory suggests that manager tend to
act in maximizing their own welfare instead of the shareholder wealth.
Fama and Jensen (1983) define agency cost as the cost of monitoring and
controlling the agency conflict. They further argue that independent
directors able to monitor or reduce agency cost. In which independent
directors are argued to have effect on the board effectiveness, bringing
independence to the board and ensure decision making in the interest of
shareholder, particularly minority shareholders (Abdullah, 2004). Fama
and Jensen (1983) also state that independent directors could provide

The Impact of Ownership Concentration and Board Governance on Firm Performance
Undergraduate Research Project Page 24 of 134 Faculty of Business and Finance
relevant knowledge or expertise that is beneficial to the company, thus
improving the company performance.
However, according to Ponnu and Karthigeyan (2010) this view is doubted
that the independent director could benefit the company performance as
most of the empirical results show the conflict outcomes. Such as the firms
with more independent directors experiencing worse stock return during
the financial crisis in the studies on 296 financial firms from 30 countries
(Erkens, Hung & Matos, 2012). They suggest that more independent
directors on board during crisis may raise more equity capital causing the
wealth transfer from existing shareholder to debt holders. There is negative
relationship between board independence and market value of Brazilian
firms (Black, Carvalho, & George 2012). It is found that larger board
independence lower the Tobin‟s Q. Agrawal and Knoeber (1996) examine
the methods to control agency problems on firm performance and they find
that negative effect of independent director on board as well as on the firm
performance in their result is due to political reason (e.g., politicians,
environmental activists and consumer representatives). As these
independent directors act in underlying political constraints that reduce
firm performance.
Adversely, Beasley (1996) conducts regression analysis study on 150
listed companies from 1980 to 1991. The empirical result shows evidence
on importance of existence of independent director. The result shows that
independent director on the board reduce firm from financial statement
fraud. Suggesting that independent director increases the effectiveness of
management in avoiding financial fraud. Furthermore, Omran (2009)
studies on the 52 Egyptian firms from 1995 to 2005 and find that higher
proportion of independent director has positive effect on firm performance.
The finding consistent with the studies in Chilean companies (Lefort &
Urzua, 2008).
In Malaysia context, empirical result shows that no significant relationship
between board independence and firm performance is found (Chaghadari,
The Impact of Ownership Concentration and Board Governance on Firm Performance
Undergraduate Research Project Page 25 of 134 Faculty of Business and Finance
2011; Ghazali, 2010; Ponnu & Karthigeyan, 2010). Abdullah (2004) uses
369 samples of Malaysia listed companies from 1994 to 1996 to study the
internal corporate governance of Malaysia listed companies before the
financial crisis. The author finds that board independence, CEO duality or
both jointly is not related to firm performance. He argues that the use of
financial ratios may be unable to measure the board role in improving the
firm performance. Ghazali (2010) studies using data from 87 listed
companies in year 2001, the study results show that none of the corporate
governance variables estimate by board size and board independence was
statistically significant with firm performance. He explains that the
findings may due to the period of examination (in year 2001) where the
regulation on corporate governance may need a few years to show positive
result or the code is not appropriate to use in Malaysia context due to
political, cultural and legal environment in Malaysia is differ. Ponnu and
Karthigeyan (2010) study on 116 Malaysia public listed companies in the
year 2006 find that the number of independent director does not improve
firm performance.
This study expects that there is negative relationship between the
proportion of independent director and firm performance. The higher the
proportion of board independence, the lower the firm performance will be.
2.1.2 Control Variables
2.1.2.1 Firm Growth and Firm Performance
Firm growth is one of the important factors that need to be considered by
the investors before they made any investment decision. This is because
firm growth is one of the firm success measurements which show the firm
ability to expand their business.

The Impact of Ownership Concentration and Board Governance on Firm Performance
Undergraduate Research Project Page 26 of 134 Faculty of Business and Finance
Serrasquiro (2009) proves that the firm growth significantly and positively
affect the firm‟s profitability by estimating 162 largest Portuguese
companies between 1999 and 2003. The researcher measures the firm
growth by using the percentage change in total revenues while the
profitability is measured by ratio between operational results and total
assets. The author explains the result by using the Greiner (1998)
statement that is if the positive effect of employee motivation has greater
level than negative effect, thus firm growth can increase the firm
profitability.
Mak and Kusdani (2005) reveal that sales growth has significant positive
impact on the firm value. Researchers collect data from the 1999/2000
annual reports of 271 firms listed on the Singapore and 279 firms listed on
the Kuala Lumpur. Mak and Kusdani (2005) not only test sales growth to
Tobin‟s Q but they also include return on asset (ROA), return on sales
(ROS) and asset turnover as the elements of the firm performance and all
the results show that the sales growth has positive significant effect on the
firm performance.
Based on the research by Goddard, Molyneux and Wilson (2004), state
that the growth rate insignificantly affect profitability on banking sector.
This result is based on 625 banks data sets located in European countries
for the period of year 1992 to 1998. Researchers find that the banks‟
current profitability does not affected by the last year banks‟ growth rate.
On the other side, Coad (2007) has different view with previous result. He
examines a total of 8405 French manufacturing firms from year 1996 to
2004 by using two year lagged of growth rate to test on the current
profitability and his research shows that there is positive and significant
effect of firm growth on the profitability. The reason why these two
researches have different results is because of the different time lags they
included causing relationship between these two variables becomes more
complex (Goddard et al., 2004).
The Impact of Ownership Concentration and Board Governance on Firm Performance
Undergraduate Research Project Page 27 of 134 Faculty of Business and Finance
Besides, Loi and Khan (2012) also find that there is no significant
relationship between firm performance and firm growth. The authors use
turnover growth as independent variable and ROE as dependent variable to
test the determinants of firm growth based on the Belgian companies‟ data
from year 2002 to 2006. The authors also use ROA to replace ROE to test
the robustness of their finding, but the result still remains same with the
previous, hypothesis of profitability impact on the firm growth is rejected.
According to Jang and Park (2011), the firm growth has a negative impact
on the firm profitability. They study the inter-relationship between firm
growth and profitability by using the United State (US) restaurant firms‟
data from year 1978 to 2007 and prove that the extreme growth impedes
the profitability. They argue that restaurant firms are not suitable to use the
growth-focused strategies because firms will suffer from low profit and
then affect their long term performance. But the research made by
Chathoth and Olsen (2007) argue that there is insignificant positive
relationship between sales growth and return on equity. The researchers
also focus only on the restaurant industry and they find that the sales
growth does not necessary will affect the firm performance and ceteris
paribus.
Since there are many research come out with different results and all of
these results are proven, credible and support with academic proof but it
still ambiguous. Thus, this study will examine the relationship between
firm growth and firm performance again and expect that there is positive
relationship.
2.1.2.2 Firm Size and Firm Performance
According to Pervan and Visic (2012), they find that firm size has
significant positive yet weak impact on firm performance. This means that
the firm‟s profitability will rise if the size of firm grows. They further
discuss the theoretical basis that underlies their argument. The concept of
The Impact of Ownership Concentration and Board Governance on Firm Performance
Undergraduate Research Project Page 28 of 134 Faculty of Business and Finance
economies of scale stated that the larger firms can benefit from lower
production costs and higher returns which in turn explained the positive
size-profitability relationship. This result is consistent with the findings of
Serrasqueiro (2009) which based on five hundred largest Portuguese
companies for the period of 1999 to 2003. This author finds that firm size
is positively correlated with firm profitability because larger firms able to
enjoy the benefit of economies of scale as well as the diversification of
products and activities. By the way, the author employs dynamic
estimators as estimation method. Based on the 200 active companies in
Istanbul Stock Exchange (ISE) from the period of 2008 to 2011, Dogan
(2013) finds that firm size is positively related to firm performance. Firms
that listed in ISE will experience higher profitability when their firm size
grows.
Babalola (2013) reveals that firm performance is positively influenced by
firm size. The result might be attributed to the fact that the firm has more
impact on its stakeholders when it is larger in size. To gain a greater
influence on the firm‟s stakeholders, it must be greater in size. This
research is based on manufacturing companies which are listed in Nigerian
Stock Exchange (NSE) and has used panel data to study the impact of firm
size towards firm performance over the period of 2000-2009. Moreover,
Majumdar (1997) conducts analysis on a sample of 1020 Indian firms and
the result of this analysis shows that larger firms are less productive but
more profitable. The reason for greater profitability of larger firms can be
sourced from the rent-seeking perspective in which the larger firms gain
the monopoly power and hence making greater profit. According to
Asimakopoulos, Samitas and Papadogonas (2009), their findings states
that firm size has positive correlation with firm profitability by estimating
Athens Stock Exchange listed Greek non-financial firms from 1995 to
2003. By the way, this period is essential for the Greek economy as it is
moving to European monetary union (EMU) and the authors employ panel
data techniques to capture the potential effect of the macroeconomic
environment during that period.
The Impact of Ownership Concentration and Board Governance on Firm Performance
Undergraduate Research Project Page 29 of 134 Faculty of Business and Finance
However, Ramasamy, Ong and Yeung (2005) argue that firm size is
negatively correlated to firm performance. This result is based on a sample
of 30 Bursa Malaysia (BM) public listed plantation companies between
2000 and 2003. Ramasamy et al. (2005) explain that the result is due to the
organizational problems that inherent in larger plantation firms which
result in X-inefficiencies. These organizational problems will cause larger
firms to suffer from higher production cost and hence depress overall
profitability. This result is consistent with the findings of Forbes (2002),
the author suggests that smaller firms normally have better performance
compare to larger firms. By using panel data techniques to evaluate a
sample of 70 Karachi Stock Exchange listed Pakistan non-financial
companies from 2001 to 2010. Kouse, Bano, Azeem and Hassan (2012)
find that firm size has negative impact on firm profitability.
As an integration of the above-mentioned literature (e.g., Babalola, 2013;
Forbes, 2002; Kouse et al., 2012; Majumdar, 1997; Pervan & Visic, 2012),
these studies find that the effect of firm size on firm performance remain
unclear as it can be positive or negative. However, a positive size-
profitability relationship is expected in this study. This is also supported by
the result which obtains from the research done by Ammar, Hanna,
Nordheim and Russell (2003). The research is based on financial data
obtained from Federated Electrical Contractors (FEC) over the period of
1985 to 1996 and the result shows that the firms become more profitable
as the size of firms grow bigger.
2.1.2.3 Leverage and Firm Performance
Soon and Idris (2012) finds that leverage negatively related to firm
performance as higher leverage shows that the insurance companies are
assuming higher risks. The firm performance could be negatively affected
when the exposure of the firm in certain risky product segment becomes
immoderate. This research is based on a sample of 94 Malaysia authorized
general insurance companies from 2006 to 2009. The result is consistent
The Impact of Ownership Concentration and Board Governance on Firm Performance
Undergraduate Research Project Page 30 of 134 Faculty of Business and Finance
with the findings of Gonzalez (2013) which based on 10,375 firms in 39
developing and developed countries from 1995 to 2004. During the
industry economic distress, higher leveraged firms‟ operating profits will
decline as the benefits of controlling the debt is smaller than the indirect
costs of financial distress. Based on 336 information technology firms
which are listed on the Taiwan Economic Journal (TEJ) from the period of
2006 to 2009, Hsueh (2013) finds that firm performance is negatively
affected by leverage. Since debt is essential for the completion of a firm‟s
innovation, a firm will increase its debts in Research and Development
(R&D) investments. However, this kind of action might cause firm
performance to be negatively affected as it will increase the debt holder‟s
influence and therefore obstruct the choices of management.
However, Chen (2013) finds that leverage has positive impact on firm
performance. Banks with higher leverage ratio prior to the financial crisis
are more resistant to the bad news related to the notice of systemic failures.
The author conducts the research based on 97 Tokyo Stock Exchange
(TSE) listed banks in 1997 and 1998 which is the period of Japanese
financial crisis. In addition, the findings of Akhtar, Javed, Maryam and
Sadia (2012) states that firms with high levels of financial leverage able to
improve their financial performance as leverage in the long term may
convert into firms‟ profitability in Pakistan fuel and energy sector. This
research is based on 20 Karachi Stock Exchange (KSE) public listed
limited fuel and energy companies in Pakistan during the period of 2000 to
2005.
According to Khatab, Masood, Zaman, Saleem and Saeed (2011), they
reveal that leverage has significant positive impact on firm performance.
Khatab et al. (2011) has applied multiple regression models to estimate a
sample of 20 Karachi Stock Exchange listed firms from 2005 to 2009.
Moreover, Safieddine and Titman (1999) conduct an analysis based on 573
target firms that successfully revolt takeover attempts for the period 1982
to 1991. The result shows that firm that increases its leverage has lower
possibility of being taken over. This is because firms with extensive
The Impact of Ownership Concentration and Board Governance on Firm Performance
Undergraduate Research Project Page 31 of 134 Faculty of Business and Finance
increase in leverage reduce their capital expenditures levels, sell off assets,
lay off employees, increase focus and therefore enhance their firm
performance.
In a nutshell, a positive relationship is expected between leverage and firm
performance in this study. Firms with higher levels of leverage have more
probability to improve its performance than those with lower levels of
leverage.
2.2 Review of Relevant Theoretical Models
2.2.1 Theory of Intellectual Capital of Corporate
Governance
In today‟s economic, knowledge of people is gaining important to achieve
the success of the organization. Intellectual capital seems to be a crucial
tool for firm to sustain, expand, and maintain market position. It concerns
with how member of organization employ the ideas that he or she possess
to take an effective actions and capabilities in order to accomplish
organization‟s goal in the long term.
In Malaysia, government has promoted on a mission to develop a
knowledge-based economic for rapid economic growth by launching a
Knowledge-Based Economy Master Plan in 2002 (Economic Planning
Unit, 2001). This is because it provides the platform for firm‟s capability,
adaption, creation, as well as development and innovation in order to
sustain in global market.
In particular, the concept of intellectual capital has been utilized and
applied in many researches of corporate governance (e.g., Baron, 2003;
Petty & Guthrie, 2000; Roos & Roos, 1997; Taliyang & Jusop, 2011).
Petty and Guthrie (2000) define intellectual capital (e.g., information,
The Impact of Ownership Concentration and Board Governance on Firm Performance
Undergraduate Research Project Page 32 of 134 Faculty of Business and Finance
knowledge, network and innovation) is one of the instruments to determine
the firm value and a country‟s economic development. They also describe
a full knowledge worker as a “premium commodity and technologies” that
adding wealth to a firm. Similarly, Roos and Roos (1997) describe
intellectual capital as a “hidden assets” in the firms‟ balance sheet. It
seems to be intangible resources such as knowledge and experiences that
members of organization can use to create and enhance firm value. As
individuals employs their own knowledge to control and govern the firm
and it is hard to imitate by others. So, intellectual capital consider as the
most important source for sustainable competitive (Baron, 2003; as cited
in Abidin & Kamal, 2009). These increase the importance for firm to
nurture their workforce become knowledgeable which in turn smoothing
the internal and external process, as well as, communicating with workers
and investors.
Intellectual capital is divided but not limited into two categories, which are
structural capital and human capital (e.g., Organization for Economic Co-
operation and Development, 1999; Petty & Guthrie, 2000; Roos & Roos,
1997; Taliyang & Jusop, 2011). In term of board attributes, intellectual
capital describe in three classifications which are structural capital, human
capital and social capital (Nicholson & Kiel, 2004). More precisely,
structural capital refers to the organizational competence to meet market
requirements such as proprietary software systems, distribution networks,
and supply chains. Human capital includes the internal human resources
(e.g., knowledge, skills, capability and experience present on the board)
and externally to stakeholders. Social capital represents as intangible
resources that assists member of organization to achieve firm‟s goal by all
relevant social and organizational relationship (e.g., intra-board
relationship, board management relationship and extra-organizational
relationship).
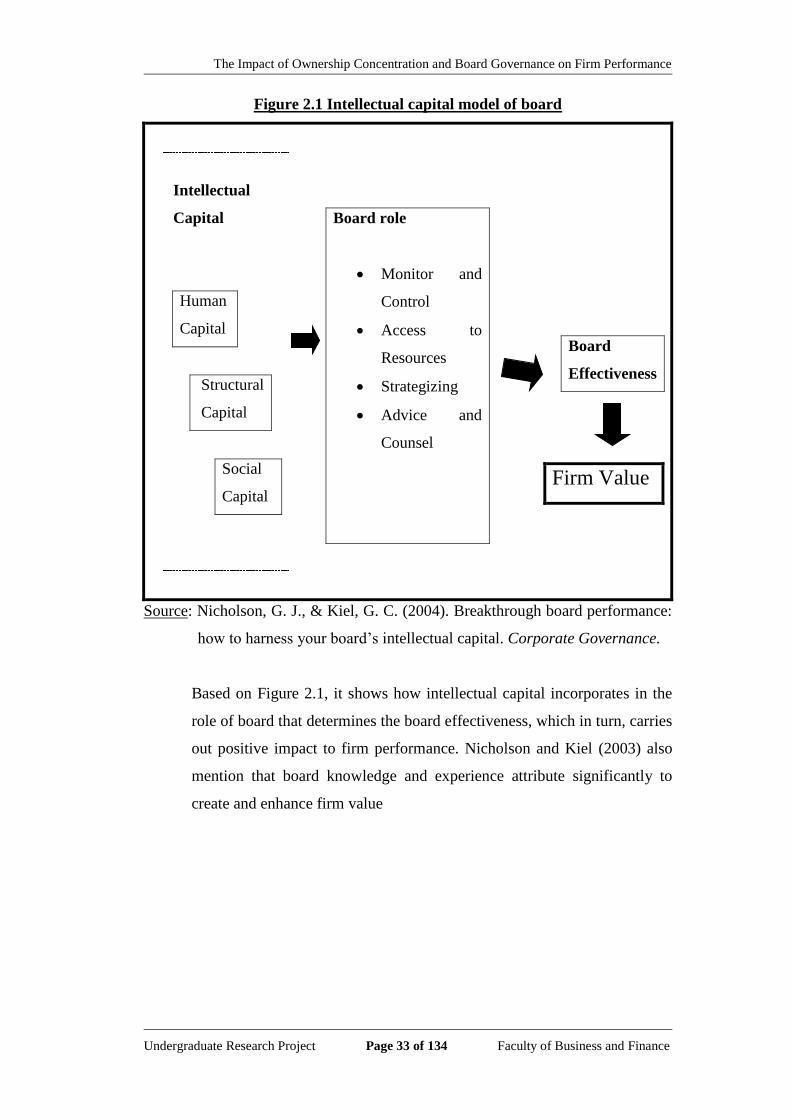
The Impact of Ownership Concentration and Board Governance on Firm Performance
Undergraduate Research Project Page 33 of 134 Faculty of Business and Finance
Figure 2.1 Intellectual capital model of board
Intellectual
Capital
Human
Capital
Structural
Capital
Social
Capital
Board role
Monitor and
Control
Access to
Resources
Strategizing
Advice and
Counsel
Board
Effectiveness
Firm Value
Source: Nicholson, G. J., & Kiel, G. C. (2004). Breakthrough board performance:
how to harness your board‟s intellectual capital. Corporate Governance.
Based on Figure 2.1, it shows how intellectual capital incorporates in the
role of board that determines the board effectiveness, which in turn, carries
out positive impact to firm performance. Nicholson and Kiel (2003) also
mention that board knowledge and experience attribute significantly to
create and enhance firm value
The Impact of Ownership Concentration and Board Governance on Firm Performance
Undergraduate Research Project Page 34 of 134 Faculty of Business and Finance
2.2.2 Agency Cost
Agency theory is mainly the theoretical view in corporate governance
issues. Based on Shakir (2008), the theory thesis developed from Berle and
Means (1932), named “The Modern Corporation and Private Property”.
This thesis shows when large firm separate their ownership and control in
modern firms will cause the agency problem to happen. Large corporations
have many owner or shareholders, thus they enter into contract with the
managers. Managers are hired to act on shareholders behalf to run the
business. Shareholders‟ intention is to maximize their return from the
investment that they make. However, the power provided to the manager
may be advantageous for the manager to act in the way that benefits
themselves instead of the shareholders‟ wealth.
Jensen and Meckling (1976) define agency cost by the cost involving in
the agency problem inclusive of the monitoring cost by the owner, the
bonding cost by the manager and the residual losses. There will be agency
cost in all companies all around the world because this problem cannot be
eliminated since there are scarcities between the principal and the
management. Insignificant company monitoring may lead to increase in
agency cost. Based on Goergen and Renneboog (2001), agency costs will
occur when there is the insufficient monitoring mechanism.
There are two types of agency problem: (1) problem between shareholder
and manager, and (2) problem between minority and majority shareholder.
The first type of agency problem concern about the manager would more
likely to act in the way that stray from what shareholders want (Fama &
Jensen, 1983). When the principals seldom monitor their managements,
they might not expose to the risk for making decision on high return
projects. This includes the risk of being taken over if the projects fail, but
compensation will be given when the projects succeed. However, the
company‟s turnover will reduce when the management does not take the
The Impact of Ownership Concentration and Board Governance on Firm Performance
Undergraduate Research Project Page 35 of 134 Faculty of Business and Finance
risk and the company growth slowly since the cost continues to increase
with inflation. This will lead to the opportunity cost of company wealth.
While, the second type of agency problem emphasizes on the conflict
between minor and major shareholder. Bozec and Bozec (2007) argue that
dominant shareholder may have more power and incentive to protect their
wealth and lead to better monitoring of corporate control than the minor
shareholder. Minority shareholder requires getting support from other
shareholders to have control in voting system, the process is more
complicated than large shareholder more easy to exercise their voting right,
thus large minority shareholder might be less effective (Shleifer & Vishny,
2012). Based on Omran et al. (2008), when large shareholders are acquired,
control cannot be uncertain and this lead the ownership concentration
become lower, or totally eliminate agency costs. In contrast, ownership
blockholder would have a negative related to firm performance if grant an
opportunity to extract corporate resources for private benefits. So, Q-ratios
may be positively related to ownership concentration, presence of
blockholders, and conflation of CEO and chairperson positions. However,
this result seems to have a lower agency costs and dependence on
reputational effects than on market fundamentals pertaining to firms‟
concrete performance. Hence, effects of performance measures are better
gauged to the future improvements in corporate governance practices
rather than market measures.
Besides, agency costs causes consumers systematically overpay for blocks
when the block consumer is a diffusely held corporation (Barclay &
Holderness, 1989). On the other hands, debt is valuable in calculating the
agency cost of free cash flow (Jensen, 1986). If the shareholders can
increase the power of control by forming voting consolidation, the agency
costs between management and shareholders may be lower than expected
(Goergen & Renneboog, 2001).
Particularly, ownership structure is very important in reducing the agency
costs linked with the separation of management and shareholder, which to
The Impact of Ownership Concentration and Board Governance on Firm Performance
Undergraduate Research Project Page 36 of 134 Faculty of Business and Finance
use as the property rights protection of the firm (Barbosa & Louri, 2002).
This statement is supported by Omran (2009) which stated that corporate
governance can act as the agency, both institutional and market-based, that
encourage the management to make decisions to ensure the value
maximization of the firm to its shareholders. This would consequently
reduce the principle-agent problem that brings the agency costs to happen.
Furthermore, corporate governance which includes board size and
independence of director is also the incentive to reduce agency problem.
Larger board size is expected to be able to limit the agency problem due to
the availability of more knowledge, experience and expertise exists in the
firm (Ghazali, 2010). While, independent directors are expected to monitor
the board and have some control on the management. Independent
directors will concern on the interest of the shareholders. Thus, agency
problem in the firm is expected to reduce with appointment of independent
director to the board. Independent director will act as monitoring role in
the board and ensure the interest of the shareholders is considered in
making decision.
2.2.3 Stewardship Theory
In recent decades, the strategic management and business policy of many
organizations have been highly affected by the two contrasting approaches
to the corporate boards‟ structure, which are agency theory and
stewardship theory. In contrast to agency theory, stewardship theorists
have proposed an alternative model of governance which is rooted in
psychology and sociology. According to Hernandez (2012), stewardship
behaviors are developed by two psychological mechanisms. First,
individuals personally value the behavior that will be advantageous to
others in the long term and place higher utility on satisfying the ongoing
needs of others. Second, individuals are forced to behave in the way that is
The Impact of Ownership Concentration and Board Governance on Firm Performance
Undergraduate Research Project Page 37 of 134 Faculty of Business and Finance
beneficial to the long term welfare of others and it is due to the affective
sense of connection that individuals have with others.
Stewardship theory promotes principal-steward relationship instead of
principal-agent relationship as in the agency theory. The directors and
management normally act as the stewards with the shareholders as
principals. Stewardship theorists posit that the directors and management
have interests that are aligned with those of the shareholders. Besides, they
also assume that the principal‟s satisfaction is bound to the success of the
organization (Christopher, 2010).
Under stewardship theory, behavior of stewards is essentially pro-
organizational because they are motivated to act in the way that benefits
their principals the most. Stewards emphasize more on collective rather
than on individual goals. They believe that their interests are aligned with
the interests of the organization or their principals and their personal needs
will be met when they work toward organizational objectives (Davis,
Schoorman & Donaldson, 1997). According to Donaldson and Davis
(1991), the executive manager wants to be a good steward of the
organization assets instead of being an opportunistic shirker. Even though
the executives might not have any shareholding with that organization,
they perceive that their future fortunes are highly affected by their current
employers. Thus, the individual executive may think that his interests are
consistent with the interests of his principals.
According to Van Slyke (2006), the transaction costs involved in a
principal-steward relationship will diminish over the time. The transaction
costs will be higher at initial stage because the principal need to invest
more time in formulating the problem, making the decision jointly,
exchanging the information and understanding the needs or wants of
stewards. However, the transaction costs will decline later as the principal
and stewards understand the motives, actions and signals of each other
better over time. Moreover, the requirement for monitoring the
organizational and programmatic activities of stewards and frequent

The Impact of Ownership Concentration and Board Governance on Firm Performance
Undergraduate Research Project Page 38 of 134 Faculty of Business and Finance
rebidding of the contract will decrease over time since the stewardship
theory promotes collective goals rather than the individual goals.
Donaldson and Davis (1991) propose that the structural situation in which
the executive is located determines the performance of a steward as it
might affect the effectiveness of action done by the steward (as cited in
Donaldson, 1985). The benefits of a steward will be maximized if the
motivation of steward suits the model of man that underlies stewardship
theory and the governance structures as well as mechanisms that empower
the steward are appropriate (Davis et al., 1997).
2.3 Proposed Theoretical Framework
Figure 2.2: Proposed Theoretical Framework
Firm
Performance Firm
Performance
Firm
Performance
Independent variable:
𝐇𝟏: Ownership
Concentration (OC)
𝐇𝟐: Board Size (BS)
𝐇𝟑: Board
Independence (BI)
Control variables:
Firm Growth (FG)
Firm Size (FS)
Leverage (LE)
Dependent variable:
Firm Performance

The Impact of Ownership Concentration and Board Governance on Firm Performance
Undergraduate Research Project Page 39 of 134 Faculty of Business and Finance
According to figure 2.2, In this study consists of three independent variables and
three control variables which are ownership concentration (OC), board size (BS),
board independence (BI), firm size (FS) and firm growth (FG) and leverage (LE).
2.4 Hypotheses Development
2.4.1 Ownership concentration influence the firm
performance in property industry
There are a lot of past researchers had found the positive relationship
between ownership concentration and firm performance (e.g., Barclay &
Horderness, 1989; Javid & Iqbal, 2010; McConnell & Servaes, 1990; Nor
et al., 2010; Omran, 2009). Based on Haniffa and Hudaib (2006), the
greater the financial stake, the greater the costs for not maximizing
shareholder wealth.
Ownership concentration will bring impact to the firm performance
in property industry.
2.4.2 Board size influence the firm performance in property
industry
Most of the results show a majority result of significantly negative
correlation between board size and firm performance in public firms,
medium sized firms and small firms (Eisenberg et al., 1998; Loderer &
Peyer, 2001; Mak & Kusnadi, 2005; Yermack, 1996). According to
Loderer and Peyer (2001), they claim that larger board size decreases the
firm effectiveness.
Board size will bring impact to the firm performance in property
industry.
The Impact of Ownership Concentration and Board Governance on Firm Performance
Undergraduate Research Project Page 40 of 134 Faculty of Business and Finance
2.4.3 Board independence influence the firm performance
in property industry
According to Agrawal and Knoeber (1996), they find that negative effect
on independence on board on the firm performance. The same result goes
to the research done by Black et al. (2012), which indicate that large board
independence will lower the Tobin‟s Q.
Board independence will bring impact to the firm performance in
property industry.
2.5 Conclusion
Chapter two reviews the literatures from past researchers on the variables
employed in this study. Three hypotheses are then developed based on the result
from past researchers. This chapter also include the review of relevant theoretical
models which include intellectual capital of corporate governance theory, agency
cost theory and stewardship theory.
The Impact of Ownership Concentration and Board Governance on Firm Performance
Undergraduate Research Project Page 41 of 134 Faculty of Business and Finance
CHAPTER 3: METHODOLOGY
3.0 Introduction
In Chapter three will briefly explain how the methodology of this research applied.
Research design, data collection method, data processing and data analysis are
included in this chapter.
3.1 Research Design
After completing the research purpose and hypothesis, a quantitative research will
be conducted in this paper. Furthermore, these quantitative data will be used for
the running of tests and determine whether each independent variables are
significant to the dependent variables (Creswell, 2003). The stipulated action of
methods and procedures for acquiring the information needed are the action
needed which is the general operational pattern or framework of the project that
states what information is to be collected from which source by what procedures.
3.2 Data Collection Method
Basically, there are two ways to collect data for a research which are primary data
and secondary data (Nicholson & Bennet, 2008). Primary data means the first
hand information which collected by researches such as questionnaire. While,
secondary data refers to the existing information such as stock price movement for
a certain period, annual report. In this research paper, secondary data are being
employed.
The Impact of Ownership Concentration and Board Governance on Firm Performance
Undergraduate Research Project Page 42 of 134 Faculty of Business and Finance
3.2.1 Secondary Data
Secondary data are data that can be collected and analyzed by government,
organization or individual in order to provide for various research purpose
(Church, 2001). The main advantage of using secondary data is because of
its availability for future research and so cost and time saving (Sorensen,
Sabroe & Olsen, 1998). In this research paper, the sources of secondary
data including companies‟ 2005 to 2010 annual reports from Bursa
Malaysia, Data stream, articles, journals, newspapers, webpage and books
which are related to the variables that affect firm‟s performance. In which,
Chapter one to five were applied. Besides that, this study consists of three
independent variables and three control variables which are ownership
concentration (OC), board size (BS), board independence (BI), firm size
(FS) and firm growth (FG) and leverage (LE). The sources of dependent
variable, three independent variables and three control variables are stated
individually as follows:
Table 3.1 Sources of Variables
Dependent Variable Sources
Firm Performance
Companies‟ annual reports from
Bursa Malaysia (2005-2010) and
Data stream
Independent Variables Sources
Ownership concentration (OC)
Board independence (BI)
Board size (BS)
Companies‟ annual reports from
Bursa Malaysia
(2005-2010)
Control Variables Sources
Firm size (FS)
Firm growth (FG)
Leverage (LE)
Data stream
Notes: By using the data collected from each source, this study applies
these data set and fit into individual variable formula‟s
components that discuss in 3.4 Data Processing later on.

The Impact of Ownership Concentration and Board Governance on Firm Performance
Undergraduate Research Project Page 43 of 134 Faculty of Business and Finance
3.3 Sampling Design
3.3.1 Target Population
Target population for a study is a set of units that a researcher interested
and focused to (Glenncoe, 2004). This study intends to understand the
development of Malaysian property industry by focusing the public listed
firms‟ performance from the year of 2005 to 2010. There are several
reasons inspire researchers to conduct this study in order to provide related
parties important information.
First of all, Malaysian government embarks the Iskandar project, namely
Iskandar Malaysia, which involves large scale activities that lead but not
limited to property industry a good prospect (Musa, 2013). Iskandar
Malaysia started from 2006 (Musa, 2013). It brings the developers and
builders have an opportunity to make new properties more affordable to
both local and foreign investors. Also, foreign investors have embarked
upon a frenzy of property investment in order to get more out of their
existing properties or to their value even further. In order to understand the
whole development of property sector, therefore this paper seeks to study
this sector from 2005 to 2010.
The second reason is the Malaysian government endeavors to persuade
foreigners to invest properties in Malaysia as their second home after
retirement and this program namely Malaysia My Second Home (MM2H)
which re-launched at 2006 (Malaysia My Second Home Programme,
2013). For example, Japanese investors develop a "Little Japan" in Johor
Bahru (“Japanese investors to develop”, 2012). The government
successfully gained the foreign property investors‟ confidence which leads
Malaysia‟s property market becomes a preferred place among investors
(Zurairi, 2013).
The Impact of Ownership Concentration and Board Governance on Firm Performance
Undergraduate Research Project Page 44 of 134 Faculty of Business and Finance
However, Malaysia property prices keep increasing and create an
oversupply crisis (Mahalingam, 2013). This would threaten the
organization of a firm and therefore this creates a need to identify and
justify about whether good corporate governance could prevent corporate
collapse.
Therefore, Malaysia property industry is the targeted population for this
study and sample is use to examine how ownership concentration (OC),
board size (BS), board independence (BI), firm size (FS), firm growth (FG)
and Leverage (LE) to explain the firm performance.
3.3.2 Sampling Companies
There are three models included in this research which are Model 1, 2 and
3. Model 1 includes 94 Malaysian public listed firms during 2005 to 2010
with 564 observations. The list of companies during 2005 to 2010 is
attached in Appendix 1. Model 2 consists of high ownership concentration
companies with 32 observations. The list of high ownership concentration
companies which stated year by year attached in Appendix 2. Model 3
comprises of low ownership concentration companies with 532
observations. The list of low ownership concentration companies which
stated year by year is attached in Appendix 3.
3.3.3 Sampling Technique
3.3.3.1 E- Views 6
According to Gujarati (2003), there are three types of data in researches
which are time series data, cross sectional date and panel data. These data
sets can be analyzed by using E- Views 6 (Bossche, 2011). This statistical
software consists of user friendly and builds in functions which including
The Impact of Ownership Concentration and Board Governance on Firm Performance
Undergraduate Research Project Page 45 of 134 Faculty of Business and Finance
producing data analysis (e.g., mean, median, maximum, minimum),
regression analysis (e.g., F Test Statistic, T Test Statistic) and forecasting.
First of all, E- Views 6 can be used to generate simple and multiple
regression models to kick start for the analysis and estimation. Generally,
they are used to predict and estimate on the changes of each variable, as
determined by the individual variable‟s estimated coefficient, followed by
diagnostic checking and econometric analysis.
By using the data collected, this paper uses E-Views 6 to generate the
econometric analysis which including data analysis (e.g., Descriptive
Analysis), diagnostic checking (e.g., Normality Test, Multicollinerity,
Autocorrelation, Heteroscedasticity), panel regression analysis (e.g.,
Poolibility Test, Hausman Test), empirical results (e.g., R, R2, Adjusted R
2,
F Test Statistic, T Test Statistic).
3.3.3.2 Panel Data
Based on econometric terms, panel data is defined as the data from an
amount of observations over times on a number of cross-sectional units
such as governments, forms, households and individuals. Hsiao and Wang
(2006), they define the panel data as the data that including time series and
cross-sectional observations of a number of individuals. Panel data, also
known as longitudinal data, is one that provides various observations on
every individual from the sample, and the given sample of individual is
multiple over time (Hsiao, 2003). For example of this study, there are 94
(N) sample companies for the period of 2005 to 2010 (t), then the total
observation is 564 (N × t = 94 × 6).
Hsiao and Tahmiscioglu (2008) propose the moment estimator of the panel
data model with time-specific and individual-specific effect by using the
generalised least square and the generalised method. Based on their
finding, generalised least squares estimator has fewest bias and root mean
square error, and has nominal size close to empirical size.
The Impact of Ownership Concentration and Board Governance on Firm Performance
Undergraduate Research Project Page 46 of 134 Faculty of Business and Finance
There are a lot of advantages from using panel data instead of cross-
sectional or time-series data sets. Based on research done by Hsiao (2003),
panel data can provide the data points with a large amount, the degree of
freedom increase and the collinearity reduced among independent
variables. Besides, it also can help the researcher to evaluate the main
economic questions that cannot be addressed when using the data sets
from cross-sectional or time-series. Other than that, panel data can
construct and analyse more complicated models. Panel data can used to
identify key econometric problem that frequently arises in empirical
studies.
3.3.4 Sampling Size
There are 112 companies listed in Bursa Malaysia main market of property
sector from 2005 to 2010. However, there are only 94 companies in this
period has been included as the sample size of this study. As discuss in
3.3.1 Target Population, this research includes from the year 2005 as it is
the starting year of property sector booming. Besides that, the year of 2011
to 2013 is excluded as to the unavailability of completed data.
Based on this sample firms and period to examine the relationship on how
ownership concentration, board size, board independence, firm growth,
firm size and leverage influence the 94 Malaysian public listed property
firms‟ performance. In addition, ownership concentration is a major factor
in explaining Malaysia corporate governance as compared to other
countries (e.g., Claessens et al., 2000; Tam & Tan, 2007; Zhuang et al.,
2001). Hence, these create the motivation to further study for ownership
concentration (OC). Ownership concentration (OC) has separated into two
levels which are high and low ownership concentration, by using 40% as a
benchmark in this further research (Claessens, Djankov, Fan & Lang,
2002).
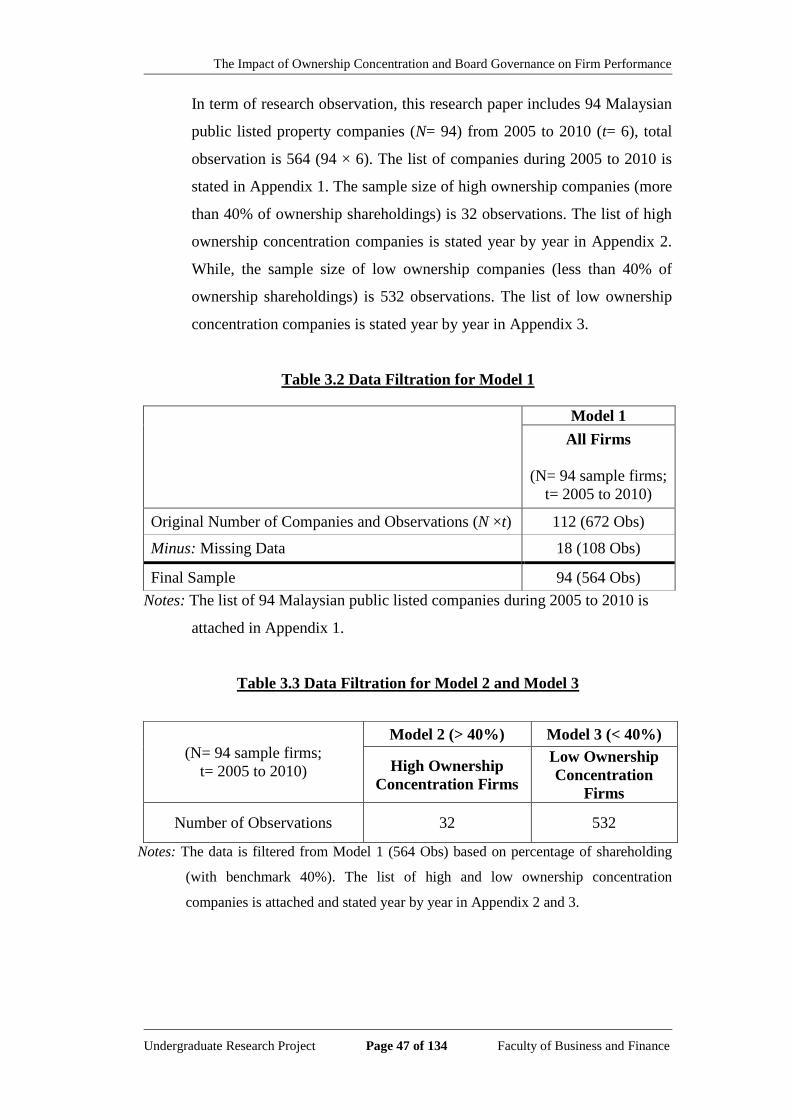
The Impact of Ownership Concentration and Board Governance on Firm Performance
Undergraduate Research Project Page 47 of 134 Faculty of Business and Finance
In term of research observation, this research paper includes 94 Malaysian
public listed property companies (N= 94) from 2005 to 2010 (t= 6), total
observation is 564 (94 × 6). The list of companies during 2005 to 2010 is
stated in Appendix 1. The sample size of high ownership companies (more
than 40% of ownership shareholdings) is 32 observations. The list of high
ownership concentration companies is stated year by year in Appendix 2.
While, the sample size of low ownership companies (less than 40% of
ownership shareholdings) is 532 observations. The list of low ownership
concentration companies is stated year by year in Appendix 3.
Table 3.2 Data Filtration for Model 1
Notes: The list of 94 Malaysian public listed companies during 2005 to 2010 is
attached in Appendix 1.
Table 3.3 Data Filtration for Model 2 and Model 3
Notes: The data is filtered from Model 1 (564 Obs) based on percentage of shareholding
(with benchmark 40%). The list of high and low ownership concentration
companies is attached and stated year by year in Appendix 2 and 3.
Model 1
All Firms
(N= 94 sample firms;
t= 2005 to 2010)
Original Number of Companies and Observations (N ×t) 112 (672 Obs)
Minus: Missing Data 18 (108 Obs)
Final Sample 94 (564 Obs)
(N= 94 sample firms;
t= 2005 to 2010)
Model 2 (> 40%) Model 3 (< 40%)
High Ownership
Concentration Firms
Low Ownership
Concentration
Firms
Number of Observations 32 532
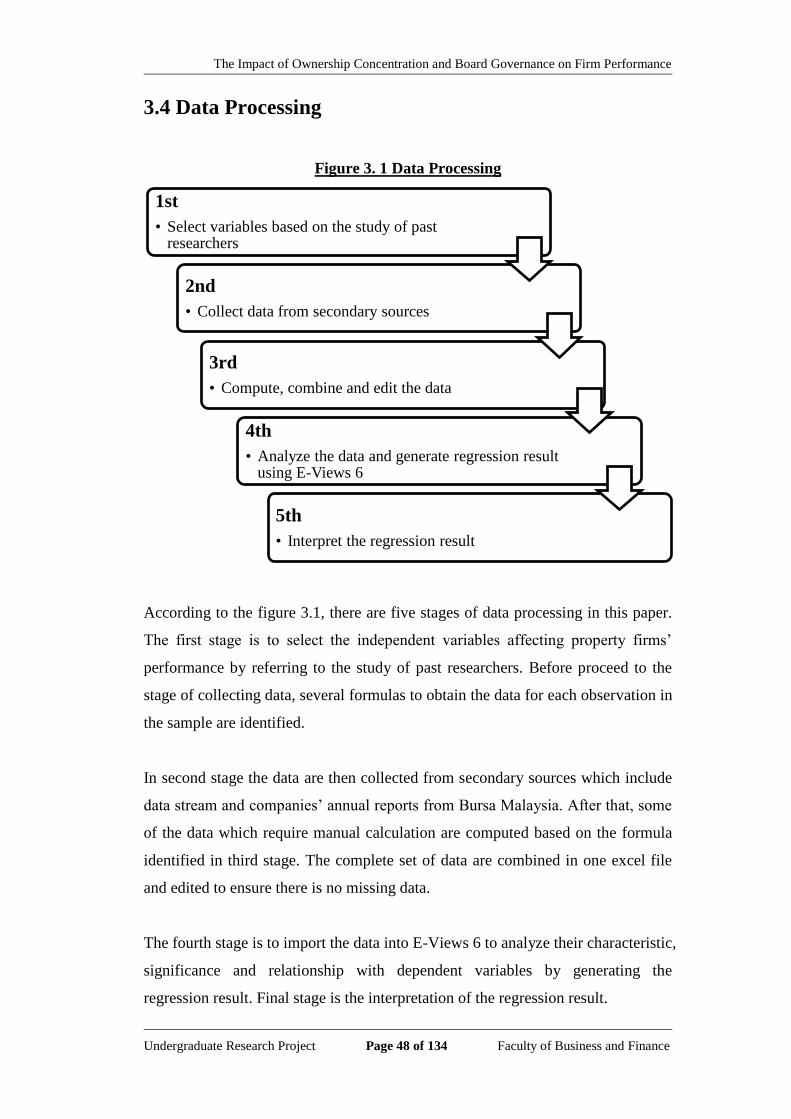
The Impact of Ownership Concentration and Board Governance on Firm Performance
Undergraduate Research Project Page 48 of 134 Faculty of Business and Finance
3.4 Data Processing
Figure 3. 1 Data Processing
According to the figure 3.1, there are five stages of data processing in this paper.
The first stage is to select the independent variables affecting property firms‟
performance by referring to the study of past researchers. Before proceed to the
stage of collecting data, several formulas to obtain the data for each observation in
the sample are identified.
In second stage the data are then collected from secondary sources which include
data stream and companies‟ annual reports from Bursa Malaysia. After that, some
of the data which require manual calculation are computed based on the formula
identified in third stage. The complete set of data are combined in one excel file
and edited to ensure there is no missing data.
The fourth stage is to import the data into E-Views 6 to analyze their characteristic,
significance and relationship with dependent variables by generating the
regression result. Final stage is the interpretation of the regression result.
1st
• Select variables based on the study of past researchers
2nd
• Collect data from secondary sources
3rd
• Compute, combine and edit the data
4th
• Analyze the data and generate regression result using E-Views 6
5th
• Interpret the regression result
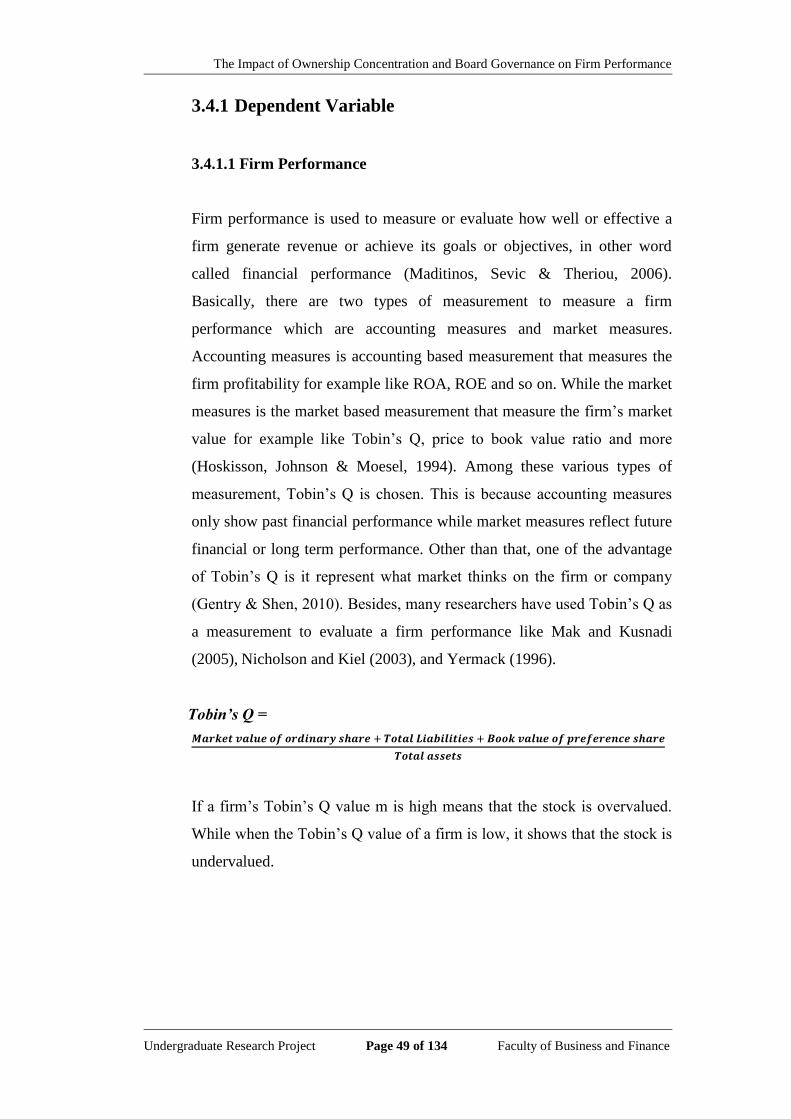
The Impact of Ownership Concentration and Board Governance on Firm Performance
Undergraduate Research Project Page 49 of 134 Faculty of Business and Finance
3.4.1 Dependent Variable
3.4.1.1 Firm Performance
Firm performance is used to measure or evaluate how well or effective a
firm generate revenue or achieve its goals or objectives, in other word
called financial performance (Maditinos, Sevic & Theriou, 2006).
Basically, there are two types of measurement to measure a firm
performance which are accounting measures and market measures.
Accounting measures is accounting based measurement that measures the
firm profitability for example like ROA, ROE and so on. While the market
measures is the market based measurement that measure the firm‟s market
value for example like Tobin‟s Q, price to book value ratio and more
(Hoskisson, Johnson & Moesel, 1994). Among these various types of
measurement, Tobin‟s Q is chosen. This is because accounting measures
only show past financial performance while market measures reflect future
financial or long term performance. Other than that, one of the advantage
of Tobin‟s Q is it represent what market thinks on the firm or company
(Gentry & Shen, 2010). Besides, many researchers have used Tobin‟s Q as
a measurement to evaluate a firm performance like Mak and Kusnadi
(2005), Nicholson and Kiel (2003), and Yermack (1996).
Tobin’s Q =
If a firm‟s Tobin‟s Q value m is high means that the stock is overvalued.
While when the Tobin‟s Q value of a firm is low, it shows that the stock is
undervalued.
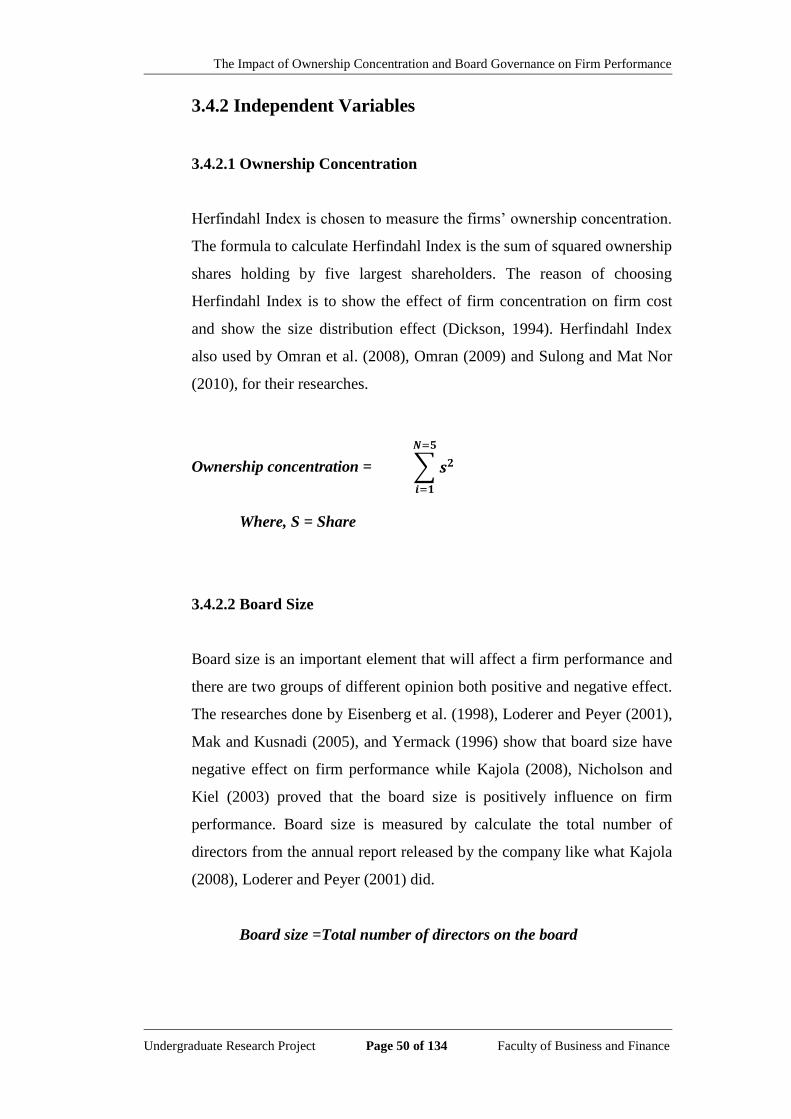
The Impact of Ownership Concentration and Board Governance on Firm Performance
Undergraduate Research Project Page 50 of 134 Faculty of Business and Finance
3.4.2 Independent Variables
3.4.2.1 Ownership Concentration
Herfindahl Index is chosen to measure the firms‟ ownership concentration.
The formula to calculate Herfindahl Index is the sum of squared ownership
shares holding by five largest shareholders. The reason of choosing
Herfindahl Index is to show the effect of firm concentration on firm cost
and show the size distribution effect (Dickson, 1994). Herfindahl Index
also used by Omran et al. (2008), Omran (2009) and Sulong and Mat Nor
(2010), for their researches.
Ownership concentration =
Where, S = Share
3.4.2.2 Board Size
Board size is an important element that will affect a firm performance and
there are two groups of different opinion both positive and negative effect.
The researches done by Eisenberg et al. (1998), Loderer and Peyer (2001),
Mak and Kusnadi (2005), and Yermack (1996) show that board size have
negative effect on firm performance while Kajola (2008), Nicholson and
Kiel (2003) proved that the board size is positively influence on firm
performance. Board size is measured by calculate the total number of
directors from the annual report released by the company like what Kajola
(2008), Loderer and Peyer (2001) did.
Board size =Total number of directors on the board
𝒔𝟐𝑵=𝟓
𝒊=𝟏
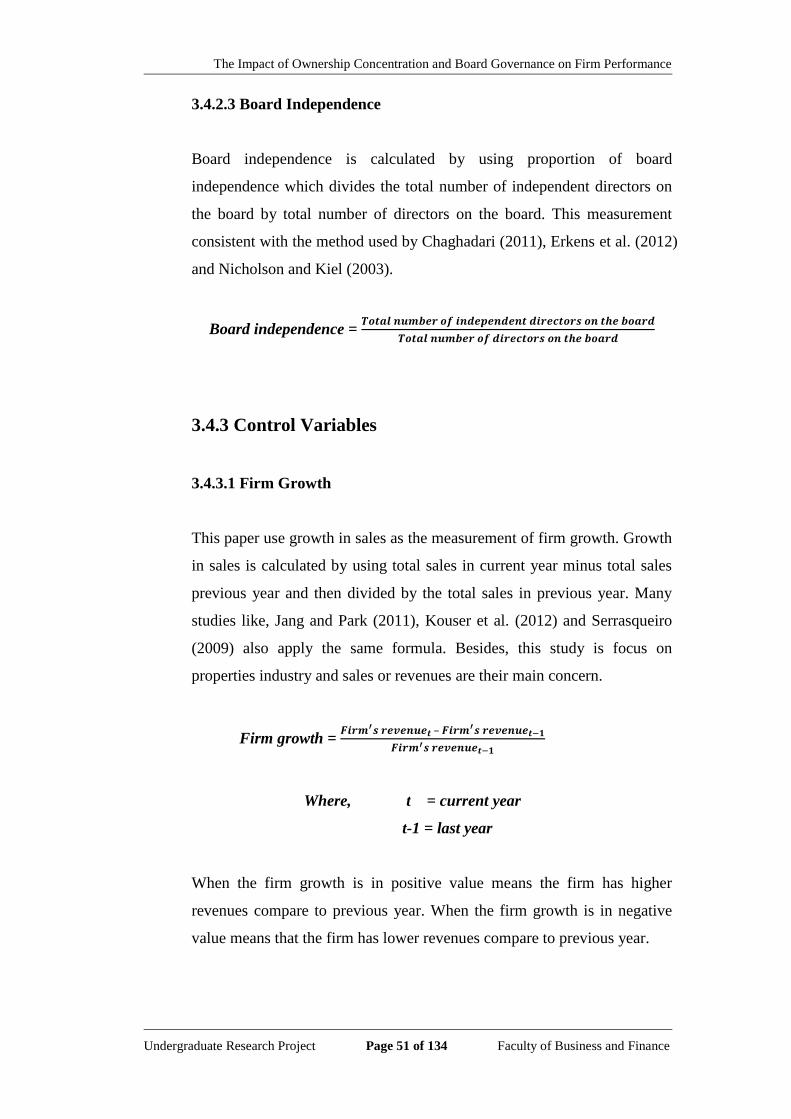
The Impact of Ownership Concentration and Board Governance on Firm Performance
Undergraduate Research Project Page 51 of 134 Faculty of Business and Finance
3.4.2.3 Board Independence
Board independence is calculated by using proportion of board
independence which divides the total number of independent directors on
the board by total number of directors on the board. This measurement
consistent with the method used by Chaghadari (2011), Erkens et al. (2012)
and Nicholson and Kiel (2003).
Board independence =
3.4.3 Control Variables
3.4.3.1 Firm Growth
This paper use growth in sales as the measurement of firm growth. Growth
in sales is calculated by using total sales in current year minus total sales
previous year and then divided by the total sales in previous year. Many
studies like, Jang and Park (2011), Kouser et al. (2012) and Serrasqueiro
(2009) also apply the same formula. Besides, this study is focus on
properties industry and sales or revenues are their main concern.
Firm growth = –
Where, t = current year
t-1 = last year
When the firm growth is in positive value means the firm has higher
revenues compare to previous year. When the firm growth is in negative
value means that the firm has lower revenues compare to previous year.

The Impact of Ownership Concentration and Board Governance on Firm Performance
Undergraduate Research Project Page 52 of 134 Faculty of Business and Finance
3.4.3.2 Firm Size
Pervan and Visic (2012) mentions that a big firm has lower production
cost that may increase the profitability. But some researchers like Forbes
(2002), Kouse et al. (2012) suggests that small firm will increase the firm
profitability. This thesis choose to calculate firm size is natural logarithm
of total assets of a company which similar with the method used by Dogan
(2013), Kouse et al. (2012), Pervan and Visic (2012), Ramasamy et al.
(2005).
Firm size = Log (Total assets)
3.4.3.3 Leverage
The method to calculate the leverage in this research is debt to capital ratio.
Debt to capital ratio is divides the total debt by total capital. The method to
calculate the leverage is same with the method used by Deesomsak,
Paudyal and Pescetto (2004) and Orhangazi (2007).
Leverage =
The reason debt to capital ratio is chosen in this research is to measure the
company‟s ability in borrowing from creditors. So, if the leverage increase
means that the company has the high level of debt.
3.5 Data Analysis
This paper examine the relationship of ownership concentration, board size, board
independence, firm growth, firm size and leverage with firm performance in
Malaysia properties firm. The regression model for this research is regressed as
below:
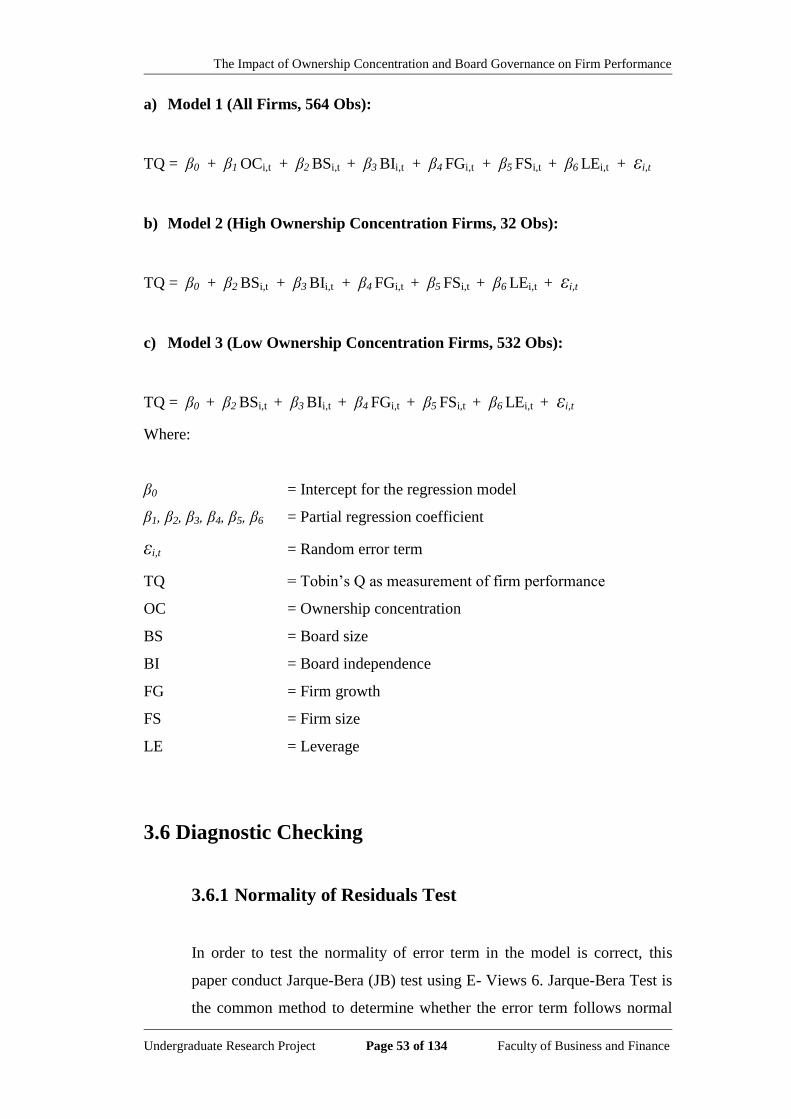
The Impact of Ownership Concentration and Board Governance on Firm Performance
Undergraduate Research Project Page 53 of 134 Faculty of Business and Finance
a) Model 1 (All Firms, 564 Obs):
TQ = β0 + β1 OCi,t + β2 BSi,t + β3 BIi,t + β4 FGi,t + β5 FSi,t + β6 LEi,t + εi,t
b) Model 2 (High Ownership Concentration Firms, 32 Obs):
TQ = β0 + β2 BSi,t + β3 BIi,t + β4 FGi,t + β5 FSi,t + β6 LEi,t + εi,t
c) Model 3 (Low Ownership Concentration Firms, 532 Obs):
TQ = β0 + β2 BSi,t + β3 BIi,t + β4 FGi,t + β5 FSi,t + β6 LEi,t + εi,t
Where:
β0 = Intercept for the regression model
β1, β2, β3, β4, β5, β6 = Partial regression coefficient
εi,t = Random error term
TQ = Tobin‟s Q as measurement of firm performance
OC = Ownership concentration
BS = Board size
BI = Board independence
FG = Firm growth
FS = Firm size
LE = Leverage
3.6 Diagnostic Checking
3.6.1 Normality of Residuals Test
In order to test the normality of error term in the model is correct, this
paper conduct Jarque-Bera (JB) test using E- Views 6. Jarque-Bera Test is
the common method to determine whether the error term follows normal
The Impact of Ownership Concentration and Board Governance on Firm Performance
Undergraduate Research Project Page 54 of 134 Faculty of Business and Finance
distribution. It indicates that if the error term is normally distributed, the
model specification is correct. The hypotheses to be tested are:
: The error term is normally distributed
: The error term is not normally distributed.
The decision rule would be reject null hypothesis if P-value of Jarque-Bera
statistics is lower than the 10% significance level. Otherwise, the result
will not be rejected. The p-value must be higher than 10% significance
level, then null hypotheses will not be rejected and conclude that the error
term does follow the normality distribution.
3.6.2 Multicollinearity
Multicollinearity exists as some or all the independent variables are highly
correlated to each other. It normally happens in time series data. Pearson
correlation test is use to obtain pairwise correlation coefficient to test the
degree of multicollinearity between independent variables. The rule of
thumb of correlation coefficient is below than 0.8, otherwise the model is
considered to have serious multicollinearity problem (Gujarati, 2003).
3.6.3 Heteroscedasticity
Heteroscedasticity is a problem that the disturbance term has unequal
variance. It can arise as a result of the presence of outlier (Gujarati, 2003).
The existence of heteroscedasticity problem may result in overestimation
of the model, T Statistic become smaller thus cause the incorrect
conclusion. Besides, the existence of the heteroscedasticity problem will
cause the variance become standard error, indirectly influence the T
Statistic and F Statistic to become incorrect. From the E- Views 6 result,
this paper assume the heteroscedasticity problem exist in the models. This

The Impact of Ownership Concentration and Board Governance on Firm Performance
Undergraduate Research Project Page 55 of 134 Faculty of Business and Finance
thesis use White Cross-Section test to control the heteroscedasticity
problem.
3.6.4 Autocorrelation
The Durbin-Watson test is tested to detect the presence of autocorrelation
in the model. Autocorrelation means that the independent variable is
correlated with the error term. The hypotheses to be tested are:
: There is no autocorrelation problem.
: There is autocorrelation problem.
Durbin Watson statistic is ranging from 0 to 4. As a general rule of thumb,
the error term are considered not correlated if the Durbin-Watson test
statistic is 2. However, based on Tabachnick and Fidell (2000), if the
Durbin Watson statistic fall in between 1.5 to 2.5, it is consider as no
serious autocorrelation problem (as cited in Hunsinger & Smith, 2008).
3.7 Panel Regression Model
Panel data regression models consist of three types namely Pooled Ordinary Least
Square (OLS) or Constant Coefficient Model, Fixed Effects Model (FEM) and
Random Effects Model (REM).
3.7.1 Pooled OLS or Constant Coefficient Model
Pooled OLS or Constant Coefficient Model is known as the time invariant
and the intercepts and slopes are constant. This is because this model states
that the characteristics for given observation are constant over time. Since
it is constant, it will be the simplest and easy to interpret when compare
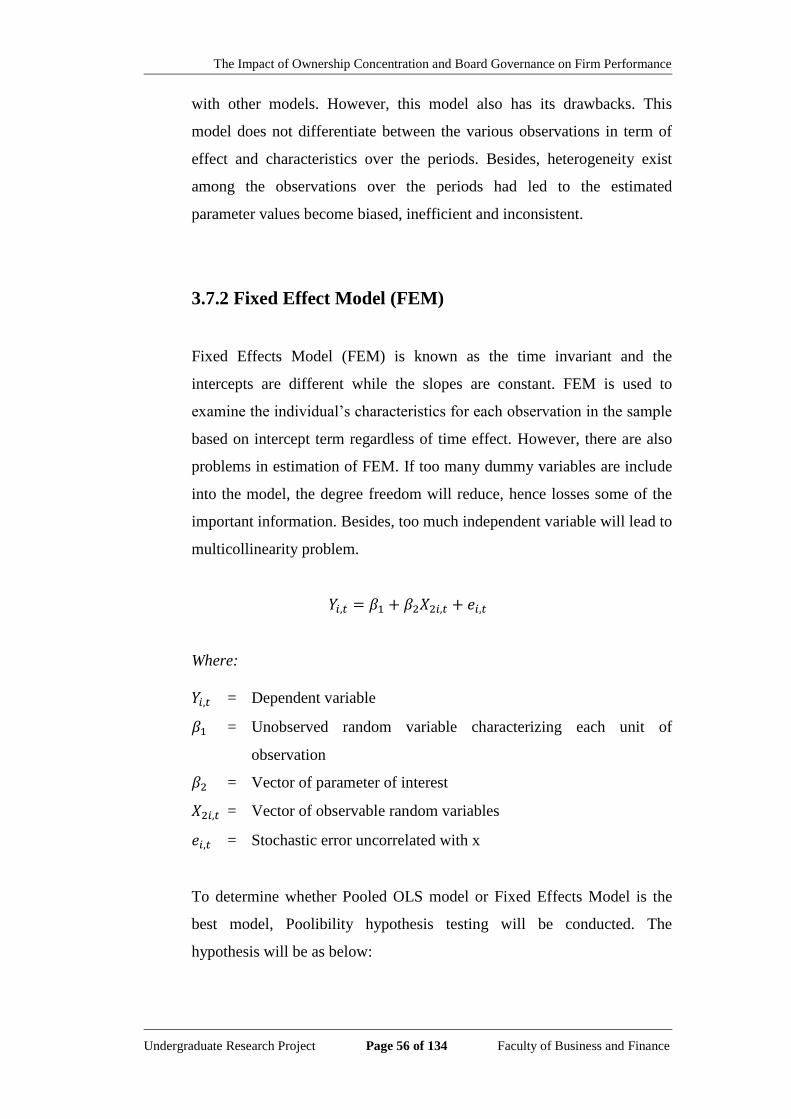
The Impact of Ownership Concentration and Board Governance on Firm Performance
Undergraduate Research Project Page 56 of 134 Faculty of Business and Finance
with other models. However, this model also has its drawbacks. This
model does not differentiate between the various observations in term of
effect and characteristics over the periods. Besides, heterogeneity exist
among the observations over the periods had led to the estimated
parameter values become biased, inefficient and inconsistent.
3.7.2 Fixed Effect Model (FEM)
Fixed Effects Model (FEM) is known as the time invariant and the
intercepts are different while the slopes are constant. FEM is used to
examine the individual‟s characteristics for each observation in the sample
based on intercept term regardless of time effect. However, there are also
problems in estimation of FEM. If too many dummy variables are include
into the model, the degree freedom will reduce, hence losses some of the
important information. Besides, too much independent variable will lead to
multicollinearity problem.
Where:
= Dependent variable
= Unobserved random variable characterizing each unit of
observation
= Vector of parameter of interest
= Vector of observable random variables
= Stochastic error uncorrelated with x
To determine whether Pooled OLS model or Fixed Effects Model is the
best model, Poolibility hypothesis testing will be conducted. The
hypothesis will be as below:
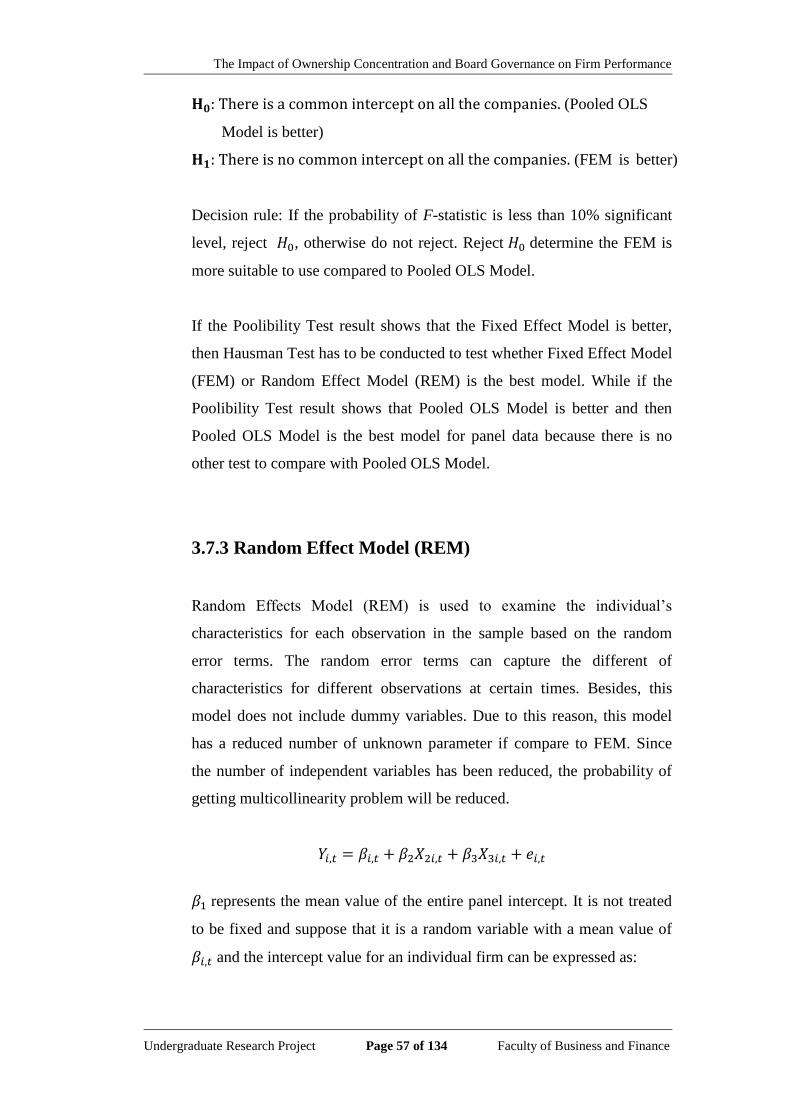
The Impact of Ownership Concentration and Board Governance on Firm Performance
Undergraduate Research Project Page 57 of 134 Faculty of Business and Finance
(Pooled OLS
Model is better)
(FEM is better)
Decision rule: If the probability of F-statistic is less than 10% significant
level, reject , otherwise do not reject. Reject determine the FEM is
more suitable to use compared to Pooled OLS Model.
If the Poolibility Test result shows that the Fixed Effect Model is better,
then Hausman Test has to be conducted to test whether Fixed Effect Model
(FEM) or Random Effect Model (REM) is the best model. While if the
Poolibility Test result shows that Pooled OLS Model is better and then
Pooled OLS Model is the best model for panel data because there is no
other test to compare with Pooled OLS Model.
3.7.3 Random Effect Model (REM)
Random Effects Model (REM) is used to examine the individual‟s
characteristics for each observation in the sample based on the random
error terms. The random error terms can capture the different of
characteristics for different observations at certain times. Besides, this
model does not include dummy variables. Due to this reason, this model
has a reduced number of unknown parameter if compare to FEM. Since
the number of independent variables has been reduced, the probability of
getting multicollinearity problem will be reduced.
represents the mean value of the entire panel intercept. It is not treated
to be fixed and suppose that it is a random variable with a mean value of
and the intercept value for an individual firm can be expressed as:

The Impact of Ownership Concentration and Board Governance on Firm Performance
Undergraduate Research Project Page 58 of 134 Faculty of Business and Finance
= + i = 1,2,3,……
Where:
= A random error term with a mean value of zero and variance of
= Composite error term (consist of two components, and )
= The individual-specific or cross section error component is
random or not constant
= Combination between time series and cross sectional error
component
If the result from Poolibility Test shows that Fixed Effect Model is better
than Pooled OLS Model then the Hausman Test will be conducted to
determine whether Random Effect Model or Fixed Effect Model is the best
model. The hypothesis will be as below:
(REM is better)
(FEM is better)
Decision rule: If the probability of H-statistic is less than 10% significant
level, reject , otherwise do not reject. Reject implies that the FEM
will be consistent and efficient, so FEM is more appropriate if compared to
REM.
3.8 Regression Analysis
3.8.1 F Test
According to Gujarati (2003) claims that in multiple regression analysis, F
test is conduct to determine the overall significance of the regression

The Impact of Ownership Concentration and Board Governance on Firm Performance
Undergraduate Research Project Page 59 of 134 Faculty of Business and Finance
model. In other word, it is a test that examine whether at least one of the
independent variables is important in explaining the dependent variable.
By the way, if one or few of the independent variables is statistically
insignificant, it does not mean that the overall regression coefficient also to
be insignificant. In particular, F test is having multifunction as it can test
for several kinds of hypotheses, such as whether an independent variable is
statistically significant, some or all coefficients are statistically equal and
so on.
This research conducts F test to examine the overall significance of
regression models (e.g., Model 1, 2 and 3). Using 10%, 5% and 1%
significant level as a benchmark. As holding a decision rule that if the P-
value is less than 0.10, 0.05 and 0.01 (10%, 5% and 1% significant level),
null hypothesis will be rejected. This implies that there is at least one of
the independent variables is important in explaining the dependent variable,
ceteris paribus. There are three hypotheses for Model 1, 2 and 3 as stated
follows:
For Model 1 (All firms, 564 Obs):
: = = = = = =0
: At least one of the independent variables is important in explaining
the dependent variable.
For Model 2 and 3 (High and Low Ownership Concentration Firms, 32
and 532 Obs respectively):
: = = = = =0
: At least one of the independent variables is important in explaining
the dependent variable.
The Impact of Ownership Concentration and Board Governance on Firm Performance
Undergraduate Research Project Page 60 of 134 Faculty of Business and Finance
3.8.2 T Test
T test is to determine the relationship and significance of independent
variable towards the dependent variable (Gujarati, 2003). In this research,
T test is conducted for Model 1, 2 and 3 respectively. Similar to the usage
of F test, it also applies 10%, 5% and 1% significant level as a benchmark.
As holding a decision rule that if the P-value is less than 0.10, 0.05 and
0.01 (10%, 5% and 1% significant level), null hypothesis will be rejected.
This indicates that there is a significance relationship between dependent
variable and independent variables, ceteris paribus. There are total 16
hypotheses are carried out for dependent variables and each independent
variables in Model 1, 2 and 3 as stated in general as follows:
For Model 1, 2 and 3 (All firms, high and low ownership concentration
firms, 564 Obs, 32 Obs and 532 Obs respectively):
: There is no significant relationship between independent variable and
dependent variable.
: There is a significant relationship between independent variable and
dependent variable.
3.9 Conclusion
After obtaining the data from DataStream and Annual Report, these data are then
used to run the test to determine whether there are significance between
independent variables (ownership concentration, board size and board
independence), control variables (firm growth, firm size and leverage) and
dependent variable (firm performance) by using the E- Views 6. The results and
analysis of each test will be further discussed in Chapter four.
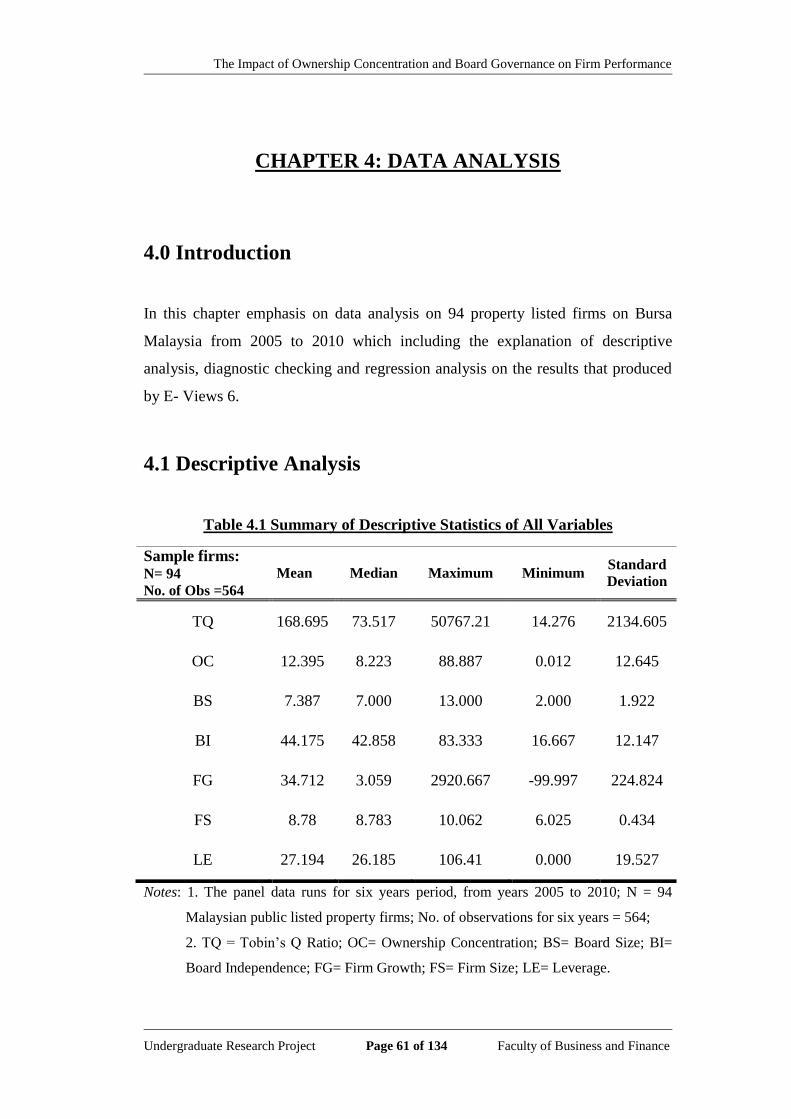
The Impact of Ownership Concentration and Board Governance on Firm Performance
Undergraduate Research Project Page 61 of 134 Faculty of Business and Finance
CHAPTER 4: DATA ANALYSIS
4.0 Introduction
In this chapter emphasis on data analysis on 94 property listed firms on Bursa
Malaysia from 2005 to 2010 which including the explanation of descriptive
analysis, diagnostic checking and regression analysis on the results that produced
by E- Views 6.
4.1 Descriptive Analysis
Table 4.1 Summary of Descriptive Statistics of All Variables
Notes: 1. The panel data runs for six years period, from years 2005 to 2010; N = 94
Malaysian public listed property firms; No. of observations for six years = 564;
2. TQ = Tobin‟s Q Ratio; OC= Ownership Concentration; BS= Board Size; BI=
Board Independence; FG= Firm Growth; FS= Firm Size; LE= Leverage.
Sample firms: N= 94
No. of Obs =564
Mean Median Maximum Minimum Standard
Deviation
TQ 168.695 73.517 50767.21 14.276 2134.605
OC 12.395 8.223 88.887 0.012 12.645
BS 7.387 7.000 13.000 2.000 1.922
BI 44.175 42.858 83.333 16.667 12.147
FG 34.712 3.059 2920.667 -99.997 224.824
FS 8.78 8.783 10.062 6.025 0.434
LE 27.194 26.185 106.41 0.000 19.527
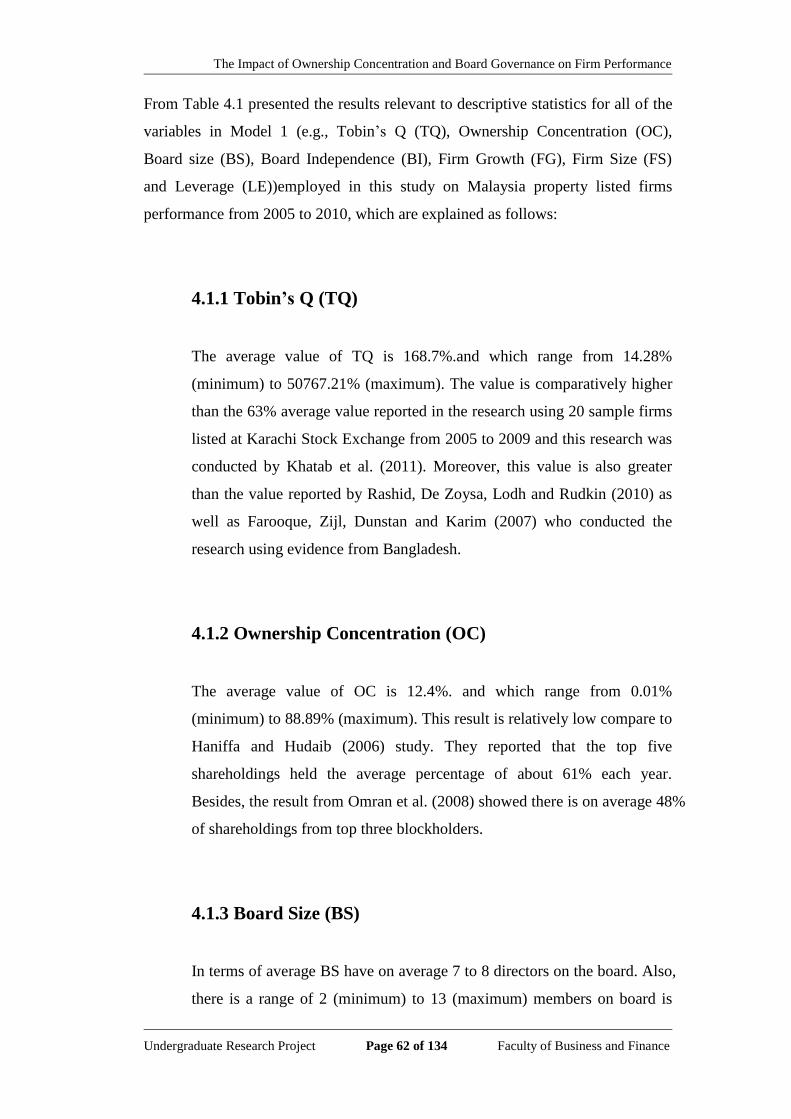
The Impact of Ownership Concentration and Board Governance on Firm Performance
Undergraduate Research Project Page 62 of 134 Faculty of Business and Finance
From Table 4.1 presented the results relevant to descriptive statistics for all of the
variables in Model 1 (e.g., Tobin‟s Q (TQ), Ownership Concentration (OC),
Board size (BS), Board Independence (BI), Firm Growth (FG), Firm Size (FS)
and Leverage (LE))employed in this study on Malaysia property listed firms
performance from 2005 to 2010, which are explained as follows:
4.1.1 Tobin’s Q (TQ)
The average value of TQ is 168.7%.and which range from 14.28%
(minimum) to 50767.21% (maximum). The value is comparatively higher
than the 63% average value reported in the research using 20 sample firms
listed at Karachi Stock Exchange from 2005 to 2009 and this research was
conducted by Khatab et al. (2011). Moreover, this value is also greater
than the value reported by Rashid, De Zoysa, Lodh and Rudkin (2010) as
well as Farooque, Zijl, Dunstan and Karim (2007) who conducted the
research using evidence from Bangladesh.
4.1.2 Ownership Concentration (OC)
The average value of OC is 12.4%. and which range from 0.01%
(minimum) to 88.89% (maximum). This result is relatively low compare to
Haniffa and Hudaib (2006) study. They reported that the top five
shareholdings held the average percentage of about 61% each year.
Besides, the result from Omran et al. (2008) showed there is on average 48%
of shareholdings from top three blockholders.
4.1.3 Board Size (BS)
In terms of average BS have on average 7 to 8 directors on the board. Also,
there is a range of 2 (minimum) to 13 (maximum) members on board is
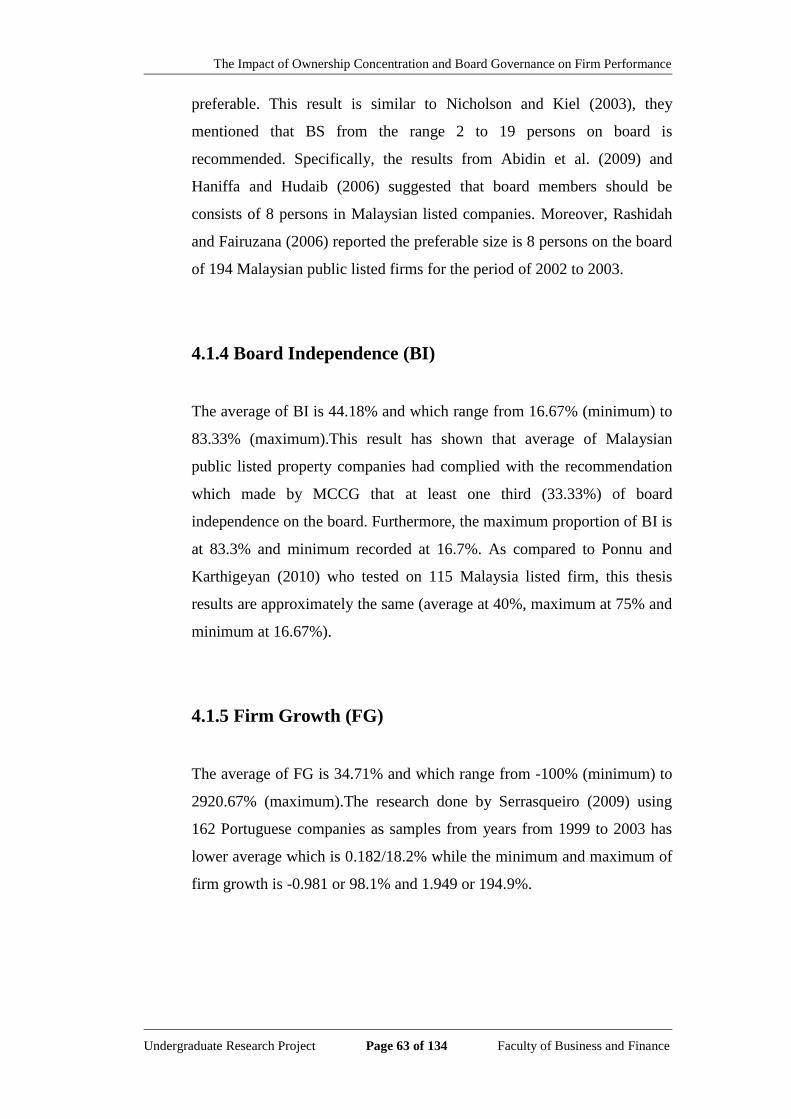
The Impact of Ownership Concentration and Board Governance on Firm Performance
Undergraduate Research Project Page 63 of 134 Faculty of Business and Finance
preferable. This result is similar to Nicholson and Kiel (2003), they
mentioned that BS from the range 2 to 19 persons on board is
recommended. Specifically, the results from Abidin et al. (2009) and
Haniffa and Hudaib (2006) suggested that board members should be
consists of 8 persons in Malaysian listed companies. Moreover, Rashidah
and Fairuzana (2006) reported the preferable size is 8 persons on the board
of 194 Malaysian public listed firms for the period of 2002 to 2003.
4.1.4 Board Independence (BI)
The average of BI is 44.18% and which range from 16.67% (minimum) to
83.33% (maximum).This result has shown that average of Malaysian
public listed property companies had complied with the recommendation
which made by MCCG that at least one third (33.33%) of board
independence on the board. Furthermore, the maximum proportion of BI is
at 83.3% and minimum recorded at 16.7%. As compared to Ponnu and
Karthigeyan (2010) who tested on 115 Malaysia listed firm, this thesis
results are approximately the same (average at 40%, maximum at 75% and
minimum at 16.67%).
4.1.5 Firm Growth (FG)
The average of FG is 34.71% and which range from -100% (minimum) to
2920.67% (maximum).The research done by Serrasqueiro (2009) using
162 Portuguese companies as samples from years from 1999 to 2003 has
lower average which is 0.182/18.2% while the minimum and maximum of
firm growth is -0.981 or 98.1% and 1.949 or 194.9%.
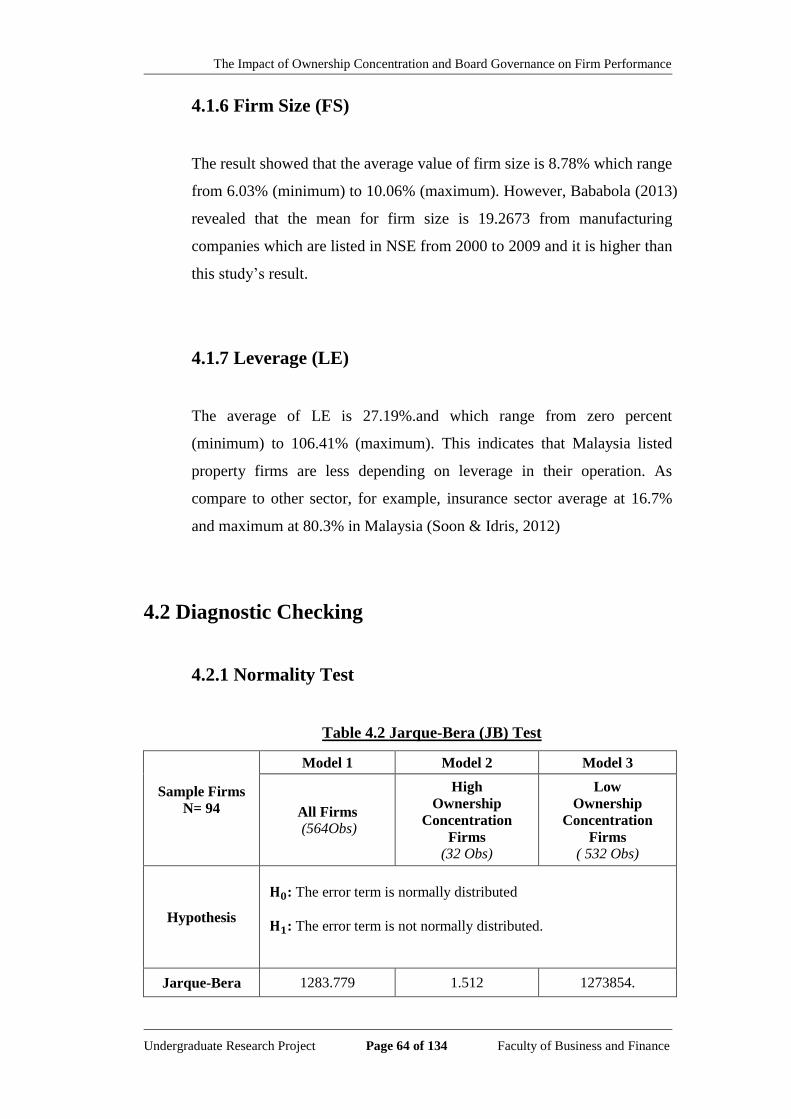
The Impact of Ownership Concentration and Board Governance on Firm Performance
Undergraduate Research Project Page 64 of 134 Faculty of Business and Finance
4.1.6 Firm Size (FS)
The result showed that the average value of firm size is 8.78% which range
from 6.03% (minimum) to 10.06% (maximum). However, Bababola (2013)
revealed that the mean for firm size is 19.2673 from manufacturing
companies which are listed in NSE from 2000 to 2009 and it is higher than
this study‟s result.
4.1.7 Leverage (LE)
The average of LE is 27.19%.and which range from zero percent
(minimum) to 106.41% (maximum). This indicates that Malaysia listed
property firms are less depending on leverage in their operation. As
compare to other sector, for example, insurance sector average at 16.7%
and maximum at 80.3% in Malaysia (Soon & Idris, 2012)
4.2 Diagnostic Checking
4.2.1 Normality Test
Table 4.2 Jarque-Bera (JB) Test
Sample Firms
N= 94
Model 1 Model 2 Model 3
All Firms
(564Obs)
High
Ownership
Concentration
Firms
(32 Obs)
Low
Ownership
Concentration
Firms
( 532 Obs)
Hypothesis
: The error term is normally distributed
: The error term is not normally distributed.
Jarque-Bera 1283.779 1.512 1273854.
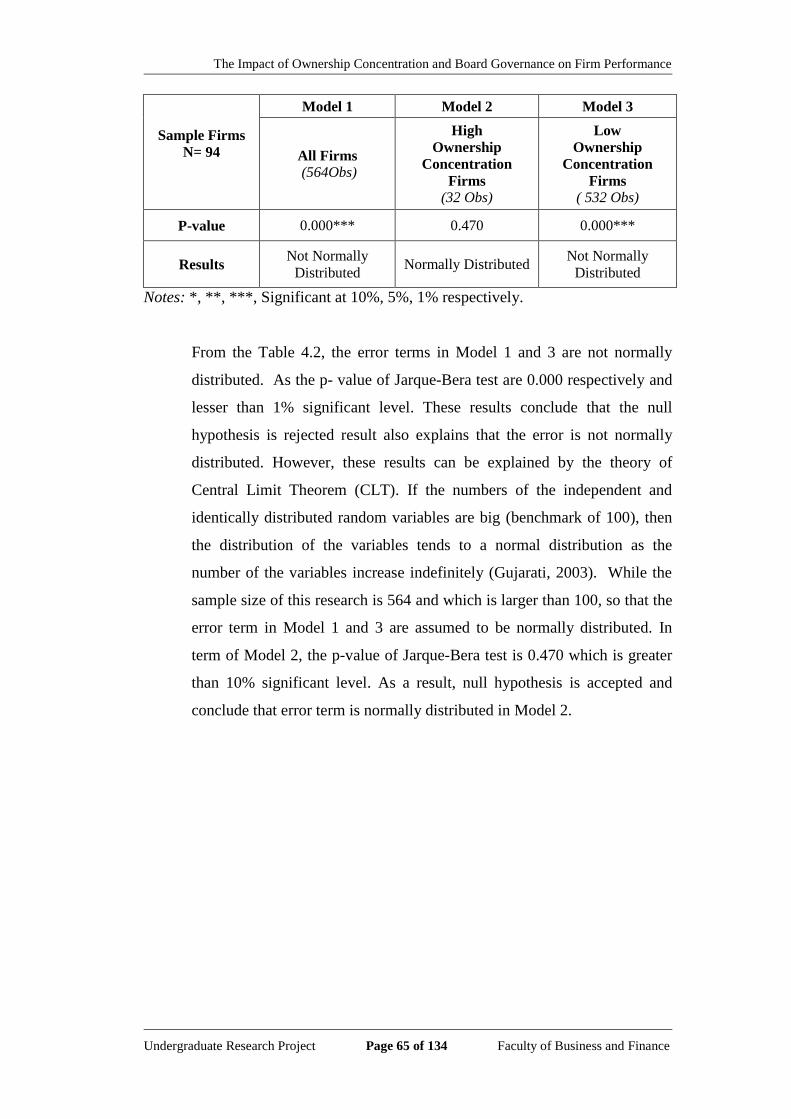
The Impact of Ownership Concentration and Board Governance on Firm Performance
Undergraduate Research Project Page 65 of 134 Faculty of Business and Finance
Sample Firms
N= 94
Model 1 Model 2 Model 3
All Firms
(564Obs)
High
Ownership
Concentration
Firms
(32 Obs)
Low
Ownership
Concentration
Firms
( 532 Obs)
P-value 0.000*** 0.470 0.000***
Results Not Normally
Distributed Normally Distributed
Not Normally
Distributed
Notes: *, **, ***, Significant at 10%, 5%, 1% respectively.
From the Table 4.2, the error terms in Model 1 and 3 are not normally
distributed. As the p- value of Jarque-Bera test are 0.000 respectively and
lesser than 1% significant level. These results conclude that the null
hypothesis is rejected result also explains that the error is not normally
distributed. However, these results can be explained by the theory of
Central Limit Theorem (CLT). If the numbers of the independent and
identically distributed random variables are big (benchmark of 100), then
the distribution of the variables tends to a normal distribution as the
number of the variables increase indefinitely (Gujarati, 2003). While the
sample size of this research is 564 and which is larger than 100, so that the
error term in Model 1 and 3 are assumed to be normally distributed. In
term of Model 2, the p-value of Jarque-Bera test is 0.470 which is greater
than 10% significant level. As a result, null hypothesis is accepted and
conclude that error term is normally distributed in Model 2.
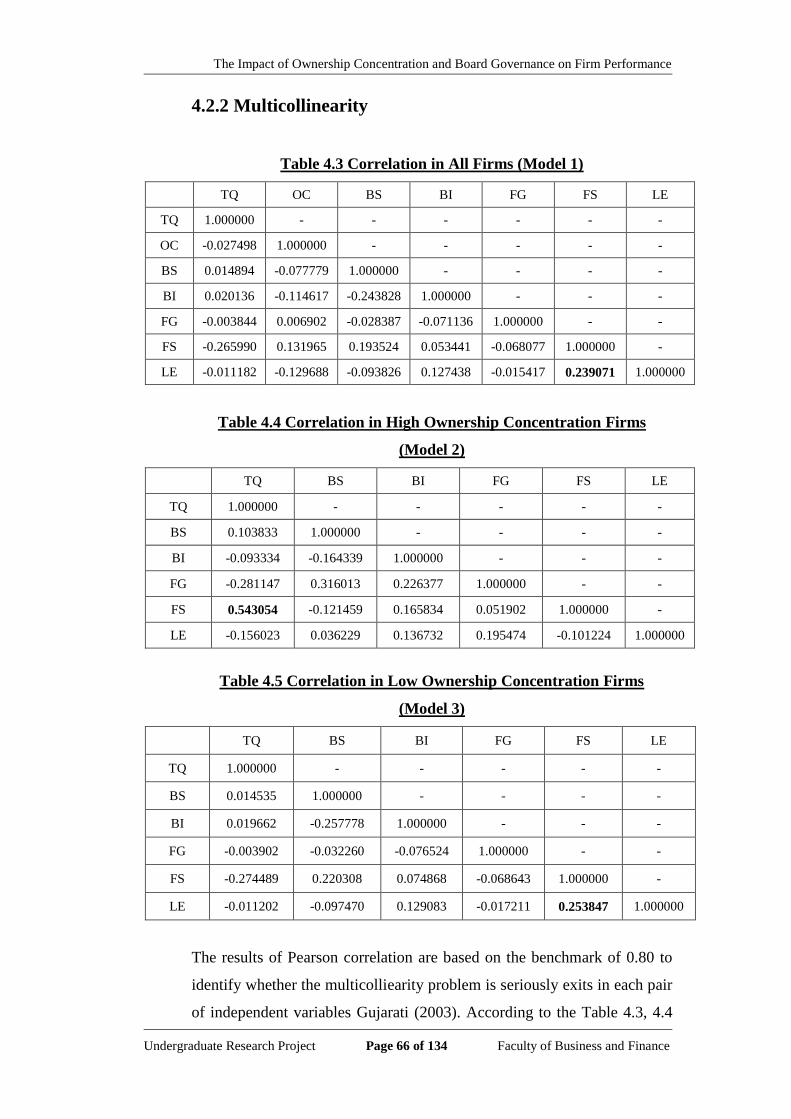
The Impact of Ownership Concentration and Board Governance on Firm Performance
Undergraduate Research Project Page 66 of 134 Faculty of Business and Finance
4.2.2 Multicollinearity
Table 4.3 Correlation in All Firms (Model 1)
TQ OC BS BI FG FS LE
TQ 1.000000 - - - - - -
OC -0.027498 1.000000 - - - - -
BS 0.014894 -0.077779 1.000000 - - - -
BI 0.020136 -0.114617 -0.243828 1.000000 - - -
FG -0.003844 0.006902 -0.028387 -0.071136 1.000000 - -
FS -0.265990 0.131965 0.193524 0.053441 -0.068077 1.000000 -
LE -0.011182 -0.129688 -0.093826 0.127438 -0.015417 0.239071 1.000000
Table 4.4 Correlation in High Ownership Concentration Firms
(Model 2)
TQ BS BI FG FS LE
TQ 1.000000 - - - - -
BS 0.103833 1.000000 - - - -
BI -0.093334 -0.164339 1.000000 - - -
FG -0.281147 0.316013 0.226377 1.000000 - -
FS 0.543054 -0.121459 0.165834 0.051902 1.000000 -
LE -0.156023 0.036229 0.136732 0.195474 -0.101224 1.000000
Table 4.5 Correlation in Low Ownership Concentration Firms
(Model 3)
TQ BS BI FG FS LE
TQ 1.000000 - - - - -
BS 0.014535 1.000000 - - - -
BI 0.019662 -0.257778 1.000000 - - -
FG -0.003902 -0.032260 -0.076524 1.000000 - -
FS -0.274489 0.220308 0.074868 -0.068643 1.000000 -
LE -0.011202 -0.097470 0.129083 -0.017211 0.253847 1.000000
The results of Pearson correlation are based on the benchmark of 0.80 to
identify whether the multicolliearity problem is seriously exits in each pair
of independent variables Gujarati (2003). According to the Table 4.3, 4.4
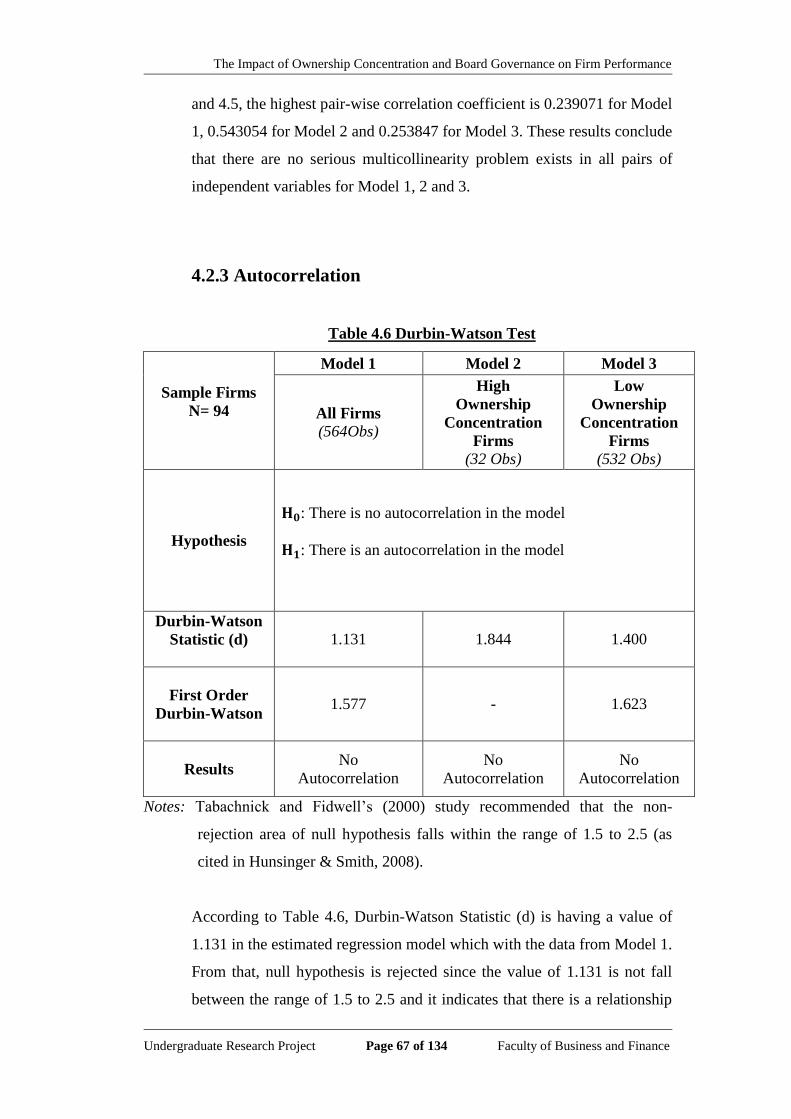
The Impact of Ownership Concentration and Board Governance on Firm Performance
Undergraduate Research Project Page 67 of 134 Faculty of Business and Finance
and 4.5, the highest pair-wise correlation coefficient is 0.239071 for Model
1, 0.543054 for Model 2 and 0.253847 for Model 3. These results conclude
that there are no serious multicollinearity problem exists in all pairs of
independent variables for Model 1, 2 and 3.
4.2.3 Autocorrelation
Table 4.6 Durbin-Watson Test
Sample Firms
N= 94
Model 1 Model 2 Model 3
All Firms
(564Obs)
High
Ownership
Concentration
Firms
(32 Obs)
Low
Ownership
Concentration
Firms
(532 Obs)
Hypothesis
: There is no autocorrelation in the model
: There is an autocorrelation in the model
Durbin-Watson
Statistic (d)
1.131 1.844 1.400
First Order
Durbin-Watson
1.577 - 1.623
Results
No
Autocorrelation
No
Autocorrelation
No
Autocorrelation
Notes: Tabachnick and Fidwell‟s (2000) study recommended that the non-
rejection area of null hypothesis falls within the range of 1.5 to 2.5 (as
cited in Hunsinger & Smith, 2008).
According to Table 4.6, Durbin-Watson Statistic (d) is having a value of
1.131 in the estimated regression model which with the data from Model 1.
From that, null hypothesis is rejected since the value of 1.131 is not fall
between the range of 1.5 to 2.5 and it indicates that there is a relationship
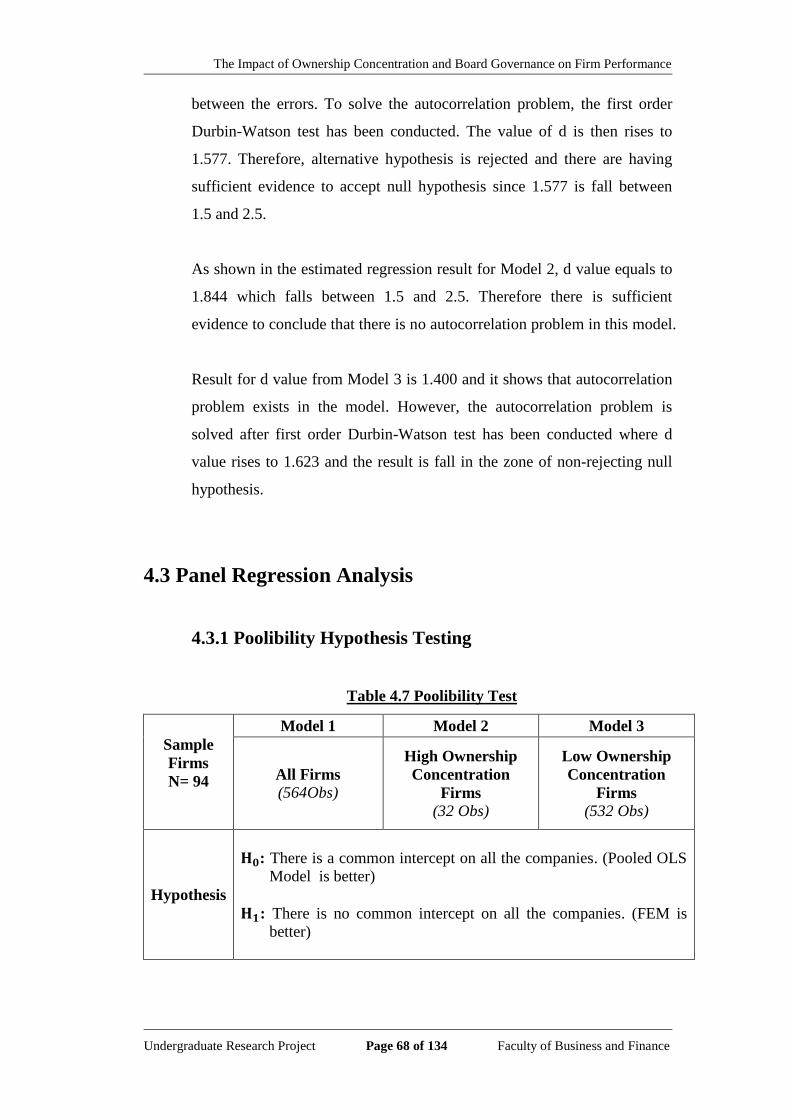
The Impact of Ownership Concentration and Board Governance on Firm Performance
Undergraduate Research Project Page 68 of 134 Faculty of Business and Finance
between the errors. To solve the autocorrelation problem, the first order
Durbin-Watson test has been conducted. The value of d is then rises to
1.577. Therefore, alternative hypothesis is rejected and there are having
sufficient evidence to accept null hypothesis since 1.577 is fall between
1.5 and 2.5.
As shown in the estimated regression result for Model 2, d value equals to
1.844 which falls between 1.5 and 2.5. Therefore there is sufficient
evidence to conclude that there is no autocorrelation problem in this model.
Result for d value from Model 3 is 1.400 and it shows that autocorrelation
problem exists in the model. However, the autocorrelation problem is
solved after first order Durbin-Watson test has been conducted where d
value rises to 1.623 and the result is fall in the zone of non-rejecting null
hypothesis.
4.3 Panel Regression Analysis
4.3.1 Poolibility Hypothesis Testing
Table 4.7 Poolibility Test
Sample
Firms
N= 94
Model 1 Model 2 Model 3
All Firms
(564Obs)
High Ownership
Concentration
Firms
(32 Obs)
Low Ownership
Concentration
Firms
(532 Obs)
Hypothesis
: There is a common intercept on all the companies. (Pooled OLS
Model is better)
: There is no common intercept on all the companies. (FEM is
better)
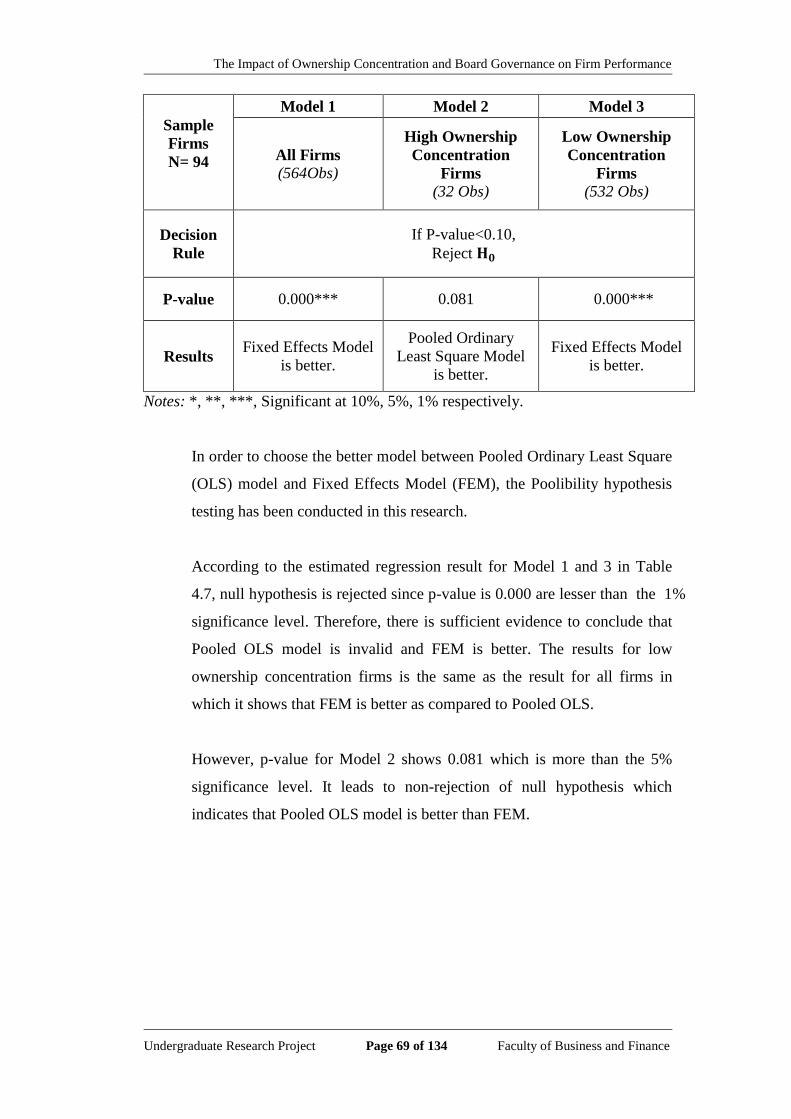
The Impact of Ownership Concentration and Board Governance on Firm Performance
Undergraduate Research Project Page 69 of 134 Faculty of Business and Finance
Sample
Firms
N= 94
Model 1 Model 2 Model 3
All Firms
(564Obs)
High Ownership
Concentration
Firms
(32 Obs)
Low Ownership
Concentration
Firms
(532 Obs)
Decision
Rule
If P-value<0.10,
Reject
P-value 0.000*** 0.081 0.000***
Results Fixed Effects Model
is better.
Pooled Ordinary
Least Square Model
is better.
Fixed Effects Model
is better.
Notes: *, **, ***, Significant at 10%, 5%, 1% respectively.
In order to choose the better model between Pooled Ordinary Least Square
(OLS) model and Fixed Effects Model (FEM), the Poolibility hypothesis
testing has been conducted in this research.
According to the estimated regression result for Model 1 and 3 in Table
4.7, null hypothesis is rejected since p-value is 0.000 are lesser than the 1%
significance level. Therefore, there is sufficient evidence to conclude that
Pooled OLS model is invalid and FEM is better. The results for low
ownership concentration firms is the same as the result for all firms in
which it shows that FEM is better as compared to Pooled OLS.
However, p-value for Model 2 shows 0.081 which is more than the 5%
significance level. It leads to non-rejection of null hypothesis which
indicates that Pooled OLS model is better than FEM.
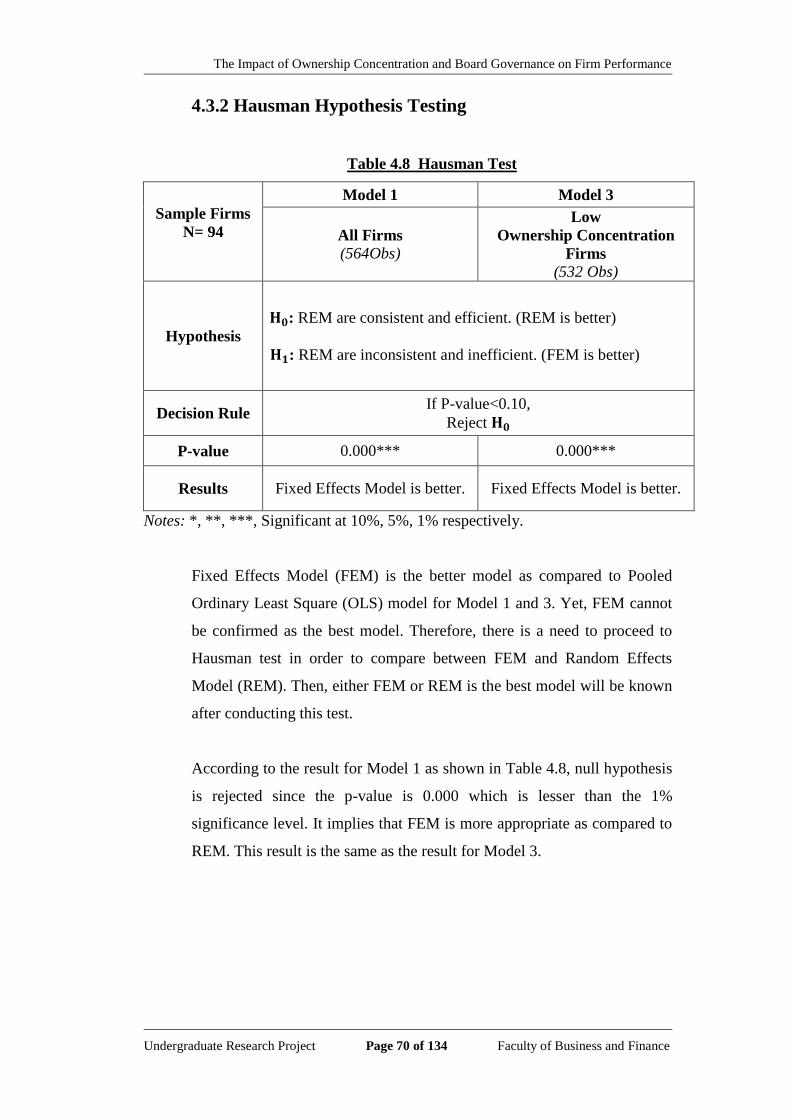
The Impact of Ownership Concentration and Board Governance on Firm Performance
Undergraduate Research Project Page 70 of 134 Faculty of Business and Finance
4.3.2 Hausman Hypothesis Testing
Table 4.8 Hausman Test
Sample Firms
N= 94
Model 1 Model 3
All Firms
(564Obs)
Low
Ownership Concentration
Firms
(532 Obs)
Hypothesis
: REM are consistent and efficient. (REM is better)
: REM are inconsistent and inefficient. (FEM is better)
Decision Rule If P-value<0.10,
Reject
P-value 0.000*** 0.000***
Results Fixed Effects Model is better. Fixed Effects Model is better.
Notes: *, **, ***, Significant at 10%, 5%, 1% respectively.
Fixed Effects Model (FEM) is the better model as compared to Pooled
Ordinary Least Square (OLS) model for Model 1 and 3. Yet, FEM cannot
be confirmed as the best model. Therefore, there is a need to proceed to
Hausman test in order to compare between FEM and Random Effects
Model (REM). Then, either FEM or REM is the best model will be known
after conducting this test.
According to the result for Model 1 as shown in Table 4.8, null hypothesis
is rejected since the p-value is 0.000 which is lesser than the 1%
significance level. It implies that FEM is more appropriate as compared to
REM. This result is the same as the result for Model 3.
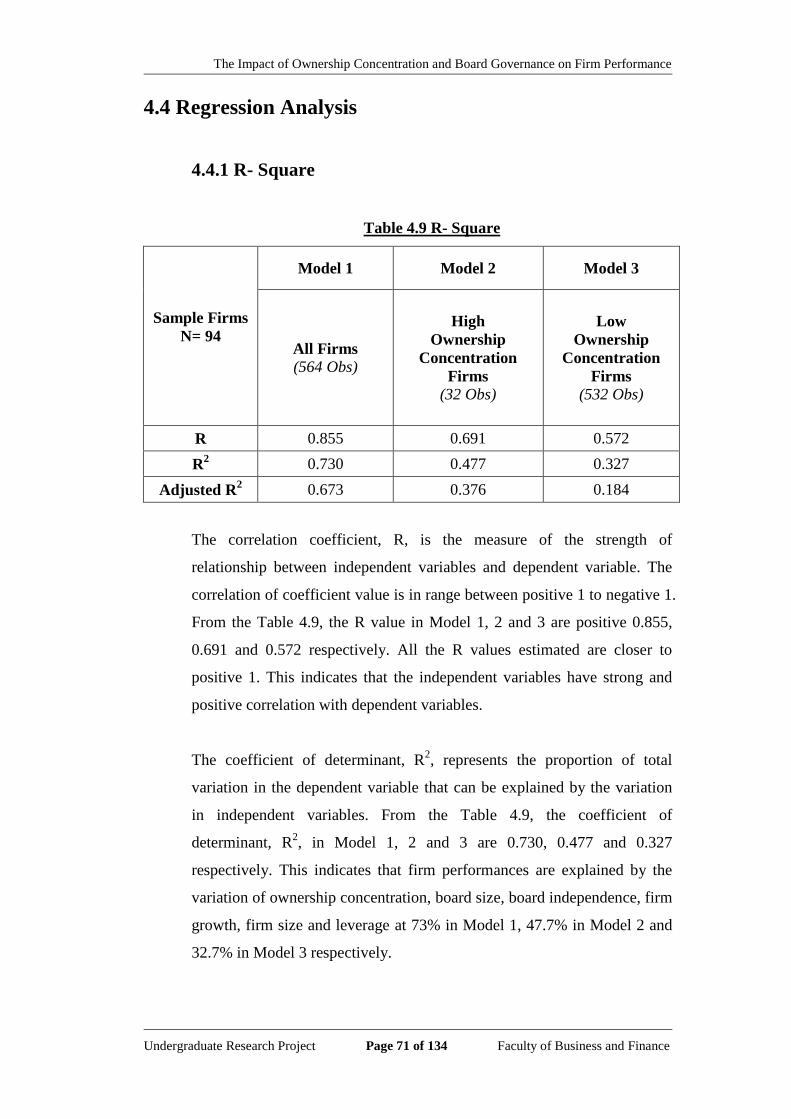
The Impact of Ownership Concentration and Board Governance on Firm Performance
Undergraduate Research Project Page 71 of 134 Faculty of Business and Finance
4.4 Regression Analysis
4.4.1 R- Square
Table 4.9 R- Square
Sample Firms
N= 94
Model 1 Model 2 Model 3
All Firms
(564 Obs)
High
Ownership
Concentration
Firms
(32 Obs)
Low
Ownership
Concentration
Firms
(532 Obs)
R 0.855 0.691 0.572
R2 0.730 0.477 0.327
Adjusted R2 0.673 0.376 0.184
The correlation coefficient, R, is the measure of the strength of
relationship between independent variables and dependent variable. The
correlation of coefficient value is in range between positive 1 to negative 1.
From the Table 4.9, the R value in Model 1, 2 and 3 are positive 0.855,
0.691 and 0.572 respectively. All the R values estimated are closer to
positive 1. This indicates that the independent variables have strong and
positive correlation with dependent variables.
The coefficient of determinant, R2, represents the proportion of total
variation in the dependent variable that can be explained by the variation
in independent variables. From the Table 4.9, the coefficient of
determinant, R2, in Model 1, 2 and 3 are 0.730, 0.477 and 0.327
respectively. This indicates that firm performances are explained by the
variation of ownership concentration, board size, board independence, firm
growth, firm size and leverage at 73% in Model 1, 47.7% in Model 2 and
32.7% in Model 3 respectively.

The Impact of Ownership Concentration and Board Governance on Firm Performance
Undergraduate Research Project Page 72 of 134 Faculty of Business and Finance
In term of adjusted R2, it refers to the modification of R
2 that adjusted for
the number of variable in the model. From the Table 4.9, the adjusted R2
of Model 1, 2 and 3 are at 67.3%, 37.6% and 18.4% respectively.
4.4.2 F Statistics
Table 4.10 F Statistics
Sample firms:
N= 94
Model 1 Model 2 Model 3
All Firms
(564 Obs)
High
Ownership
Concentration
Firms
(32 Obs)
Low
Ownership
Concentration
Firms
(532 Obs)
Hypothesis
:
= = = = = =0
: At least one of the
independent variables is
important in explaining the
dependent variable.
:
= = = = =0
: At least one of the
independent variables is important
in explaining the dependent
variable.
Decision Rule If P-value < 0.10, Reject
P-value 0.000*** 0.003*** 0.000***
Results Reject Reject Reject
Notes: 1. Where: =Ownership Concentration (OC); = Board Size (BS); =
Board Independence (BI); =Firm Growth (FG); =Firm Size (FS);
=Leverage (LE).
2. *, **, ***, Significant at 10%, 5%, 1% respectively.
According to Table 4.10, F Statistics is to examine whether any of the
explanatory variables influence the dependent variable. The result of
Model 1, 2 and 3 showed a significant relationship that at least one of the
independent variables is important in explaining the dependent variable at
1% significant level. At which p-value are 0.000, 0.003 and 0.000
respectively. They are less than 0.01, so null hypothesis is rejected. This
result can conclude that at least one of the independent variables (e.g., OC,

The Impact of Ownership Concentration and Board Governance on Firm Performance
Undergraduate Research Project Page 73 of 134 Faculty of Business and Finance
BI, BS, FG, FS, LE) in Model 1, 2 and 3 is important in explaining the
estimated Malaysian public listed property firms‟ performance from 2005
to 2010, ceteris paribus.
4.4.3 T Statistics
Table 4.11 Historical Hypothesis for Independent Variable
Table 4.11 shows the relationship between dependent variable (e.g.,
Tobin‟s Q Ratio) and independent variables (e.g., ownership concentration
(OC), board size (BS) and board independence (BI)) from the previous
researchers. As according to previous studies they conclude that the three
main independent variables in this study are significantly influence firm
performances respectively. If applies particular in Malaysian public listed
property firms, how will be the results and whether consistent with
Hypothesis Decision Conclusion
: Ownership concentration (OC)
will bring impact to the firm‟s
performance.
: Ownership concentration (OC)
will bring impact to the firm‟s
performance.
Reject
OC will contribute to
determine the firm‟s
performance.
: Board size (BS) will not bring
impact to the firm‟s performance.
: Board size (BS) will bring impact
to the firm‟s performance.
Reject BS will bring impact to the
firm‟s performance.
: Board independence (BI) will not
bring impact to the firm‟s
performance.
Board independence (BI) will
bring impact to the firm‟s
performance.
Reject BI will bring impact to the
firm‟s performance.
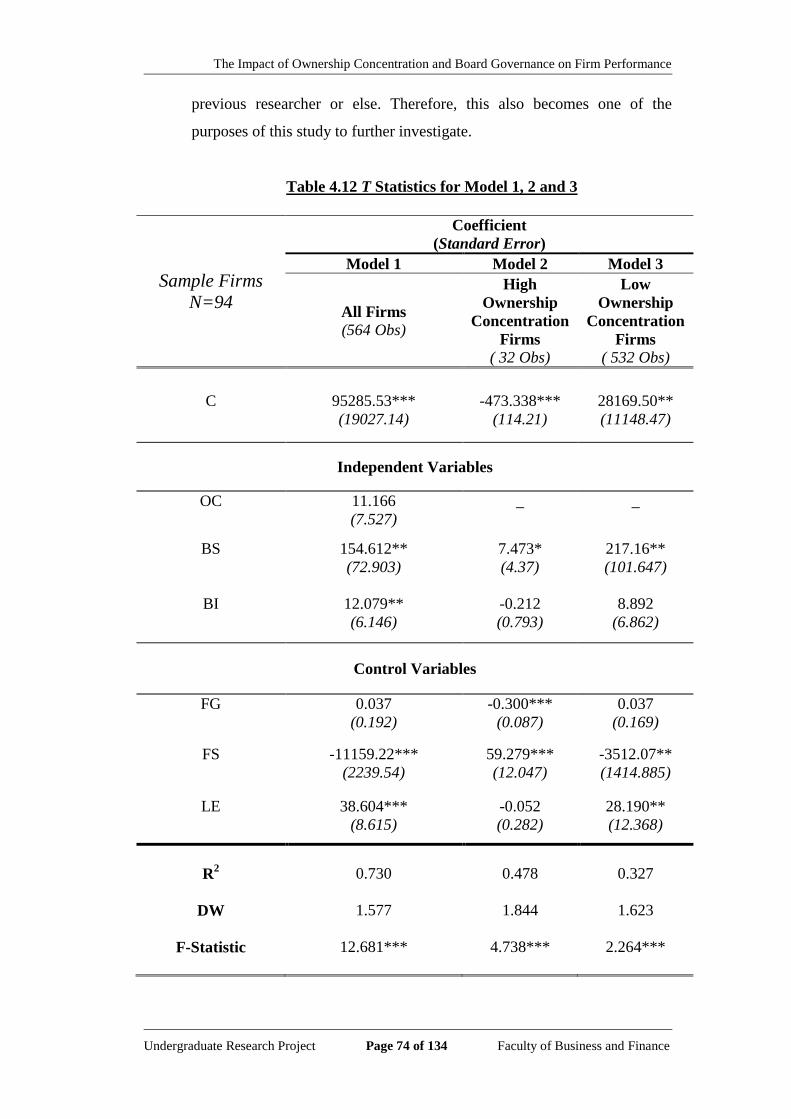
The Impact of Ownership Concentration and Board Governance on Firm Performance
Undergraduate Research Project Page 74 of 134 Faculty of Business and Finance
previous researcher or else. Therefore, this also becomes one of the
purposes of this study to further investigate.
Table 4.12 T Statistics for Model 1, 2 and 3
Sample Firms
N=94
Coefficient
(Standard Error)
Model 1 Model 2 Model 3
All Firms
(564 Obs)
High
Ownership
Concentration
Firms
( 32 Obs)
Low
Ownership
Concentration
Firms
( 532 Obs)
C 95285.53***
(19027.14)
-473.338***
(114.21)
28169.50**
(11148.47)
Independent Variables
OC 11.166
(7.527)
_ _
BS 154.612**
(72.903)
7.473*
(4.37)
217.16**
(101.647)
BI 12.079**
(6.146)
-0.212
(0.793)
8.892
(6.862)
Control Variables
FG 0.037
(0.192)
-0.300***
(0.087)
0.037
(0.169)
FS -11159.22***
(2239.54)
59.279***
(12.047)
-3512.07**
(1414.885)
LE 38.604***
(8.615)
-0.052
(0.282)
28.190**
(12.368)
R2
DW
F-Statistic
0.730
1.577
12.681***
0.478
1.844
4.738***
0.327
1.623
2.264***
The Impact of Ownership Concentration and Board Governance on Firm Performance
Undergraduate Research Project Page 75 of 134 Faculty of Business and Finance
Notes: 1. *, **, *** Significant at 10%, 5% and 1% levels, respectively.
2. C = Constant, OC= Ownership Concentration, BI= Board Independence,
BS= Board Size, FG= Firm Growth, FS= Firm Size, LE= Leverage.
According to Table 4.12, by using T Statistic to collect the regression
results of each independent variable (e.g., OC, BS, BI, FG, FS, LE) to
dependent variable (e.g., TQ) in Model 1, 2 and 3 that are all explained
individually as follows:
4.4.3.1 Ownership Concentration (OC)
In Model 1, ownership concentration (OC) and firm performance (TQ) is
statistically insignificant positive relationship at 10%, 5% and 1%
significant level. The coefficient of OC is 11.166. This implied that the
higher ownership concentration is, the better the property firm
performance, vice versa. Given that the OC of the property firm increase
by 1%, the estimated Malaysian public listed property firms‟ performance
from 2005 to 2010 will increase by 11.17%, ceteris paribus.
4.4.3.2 Board size (BS)
In Model 1 and 3, board size (BS) and firm performance (TQ) are
significantly positive at 5% significant level, Model 2 significant at 10%.
The coefficients of BS are 154.612, 7.473 and 217.16 respectively. It
shows that the increase in board member will result increase in property
firm‟s performance, vice versa. It seen that larger board size contribute to
firm performance as it allows more ideas, experiences and skills to be
combined within a firm (Abidin et al., 2009; Kajola , 2008; Nicholson and
Kiel, 2003).
The Impact of Ownership Concentration and Board Governance on Firm Performance
Undergraduate Research Project Page 76 of 134 Faculty of Business and Finance
4.4.3.3 Board Independence (BI)
In Model 1, board independence (BI) and firm performance (TQ) are
significantly positive correlated at 5% significant level. The coefficient
values of BI are 12.079. This implies that as board independence increase
within a firm, property firm performance will be better, vice versa. Given
that board independence increased by 1% will lead to the estimated
Malaysian public listed property firms‟ performance of from 2005 to 2010
will increase by 12.08%, ceteris paribus. In term of Model 3, it has
produced the same positive sign between BI and TQ with coefficient 8.892,
but insignificant at 10 % significant level to explained TQ.
While, in Model 2, BI and TQ showed an insignificantly negative
relationship at 10% significant level. The coefficient of BI is -0.212. This
implies that as board independence increase within a firm, property firm
performance will be lower, vice versa. Indicate that, 1% increase in board
independence, the estimated Malaysian public listed property firms‟
performance from 2005 to 2010 will decrease by 0.21%, ceteris paribus.
4.4.3.4 Firm Growth (FG)
In Model 1 and 3, firm growth (FG) and firm performance (TQ) is
statistically insignificant positive correlated at 10% significant level. The
coefficients of FG are 0.037 and 0.037 respectively. This implies that as
firm grow up for a certain level, the better the firm performance, but this
situation is unlikely to happen in this sample. Given that if the property
firm grows up for 1%, the estimated firm performance of property listed
firms on Bursa Malaysia from 2005 to 2010 will increase by 0.04% in
both Model 1 and Model 3, ceteris paribus.
While, in Model 2, the firm growth and firm performance is significantly
negative relationship at 1% significant level. The coefficient of FG is -0.30.
This implies that as firm grow up for a certain level, the lower the firm
The Impact of Ownership Concentration and Board Governance on Firm Performance
Undergraduate Research Project Page 77 of 134 Faculty of Business and Finance
performance. If the property firm grows up for 1% will lead to the
estimated Malaysian public listed property firms‟ performance from 2005
to 2010 will decrease by 0.30%.
4.4.3.5 Firm Size (FS)
In Model 1 and 3, firm size (FS) and firm performance (TQ) are
significantly negative at 1% and 5% significant level respectively. The
coefficients of FS are -11159.22 and -3512.07 respectively. It shows that
the increase in firm size will result decrease in property firm‟s
performance, vice versa. Given that total assets of a firm increased by 1%,
the estimated Malaysian public listed property firms‟ performance from
2005 to 2010 will decrease by 11159.22% and 3512.07% respectively,
ceteris paribus.
While, in Model 2, FS and TQ is significantly positive related at 1%
significant level. The coefficient value is 59.279.It shows that the increase
in firm size will result increase in property firm‟s performance, vice versa.
Given that if total assets of a firm by 1%, the estimated Malaysian public
listed property firms‟ performance from 2005 to 2010 will increase by
59.28%, ceteris paribus.
4.4.3.6 Leverage (LE)
In Model 1 and 3, leverage (LE) and firm performance (TQ) are
significantly positive at 1% and 5% significant level respectively. The
coefficients of LE for Model 1 and 3 are 38.604 and 28.190. It shows that
the increase in leverage will result increase in property firm‟s performance,
vice versa. Given that leverage increased by 1%, the estimated Malaysian
public listed property firms‟ performance from 2005 to 2010 will increased
by 38.6% and 27.19% respectively, ceteris paribus.

The Impact of Ownership Concentration and Board Governance on Firm Performance
Undergraduate Research Project Page 78 of 134 Faculty of Business and Finance
While, in Model 2, LE and TQ is insignificantly negative correlated at 10%
significant level. The coefficient of BS is -0.052. It shows that the increase
in leverage will result decrease in property firm‟s performance, vice versa.
It shows that as leverage of a firm increased by 1%, the estimated
Malaysian public listed property firms‟ performance from 2005 to 2010
will decrease by 0.002%, ceteris paribus.
As for whole regression results, according to Table 4.13, is to make
comparison and summary between this thesis expectations (Chapter two)
and regression results by using a sample of 94 property listed firms on
Bursa Malaysia from 2005 to 2010 (Chapter four). It shows that board size
(BS), board independence (BI), firm size (FS) and leverage (LE) are
significant, while ownership concentration (OC) and firm growth (FG) are
insignificant.
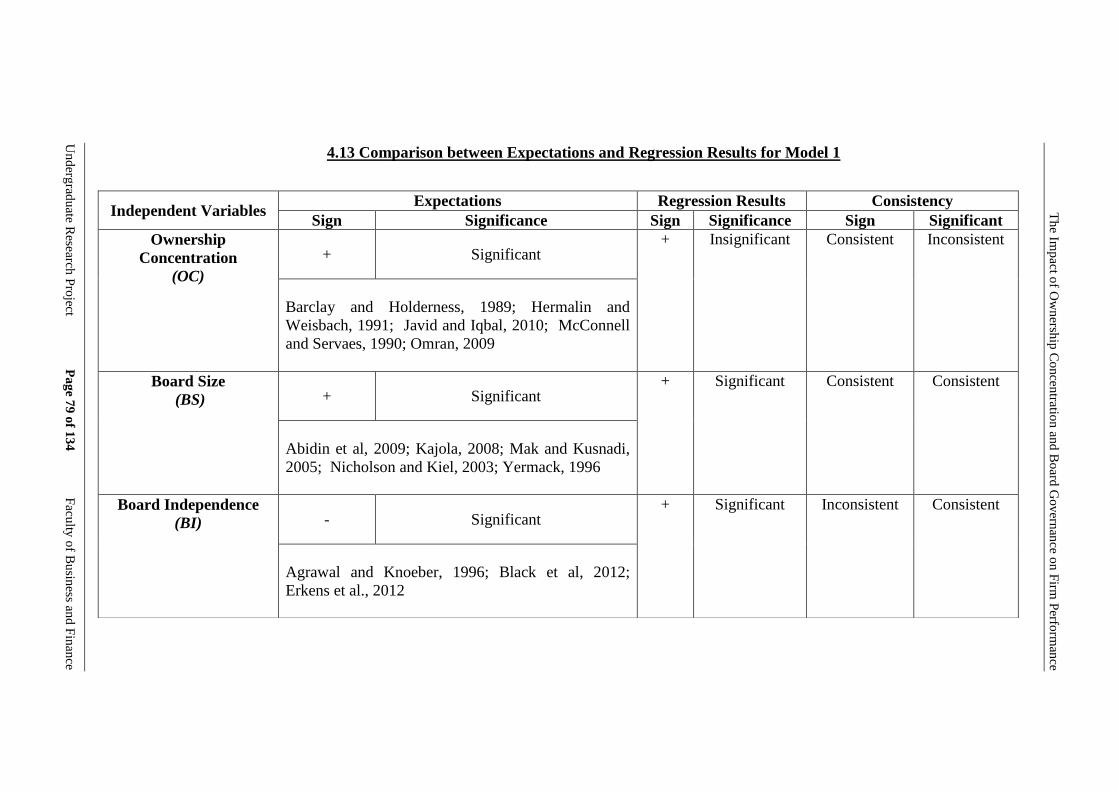
Un
derg
radu
ate Research
Pro
ject Pa
ge 7
9 o
f 13
4 F
aculty
of B
usin
ess and
Fin
ance
Th
e Imp
act of O
wn
ership
Co
ncen
tration
and
Bo
ard G
ov
ernan
ce on
Firm
Perfo
rman
ce
4.13 Comparison between Expectations and Regression Results for Model 1
Independent Variables Expectations Regression Results Consistency
Sign Significance Sign Significance Sign Significant
Ownership
Concentration
(OC)
+ Significant + Insignificant Consistent Inconsistent
Barclay and Holderness, 1989; Hermalin and
Weisbach, 1991; Javid and Iqbal, 2010; McConnell
and Servaes, 1990; Omran, 2009
Board Size
(BS)
+ Significant + Significant Consistent Consistent
Abidin et al, 2009; Kajola, 2008; Mak and Kusnadi,
2005; Nicholson and Kiel, 2003; Yermack, 1996
Board Independence
(BI)
- Significant + Significant Inconsistent Consistent
Agrawal and Knoeber, 1996; Black et al, 2012;
Erkens et al., 2012
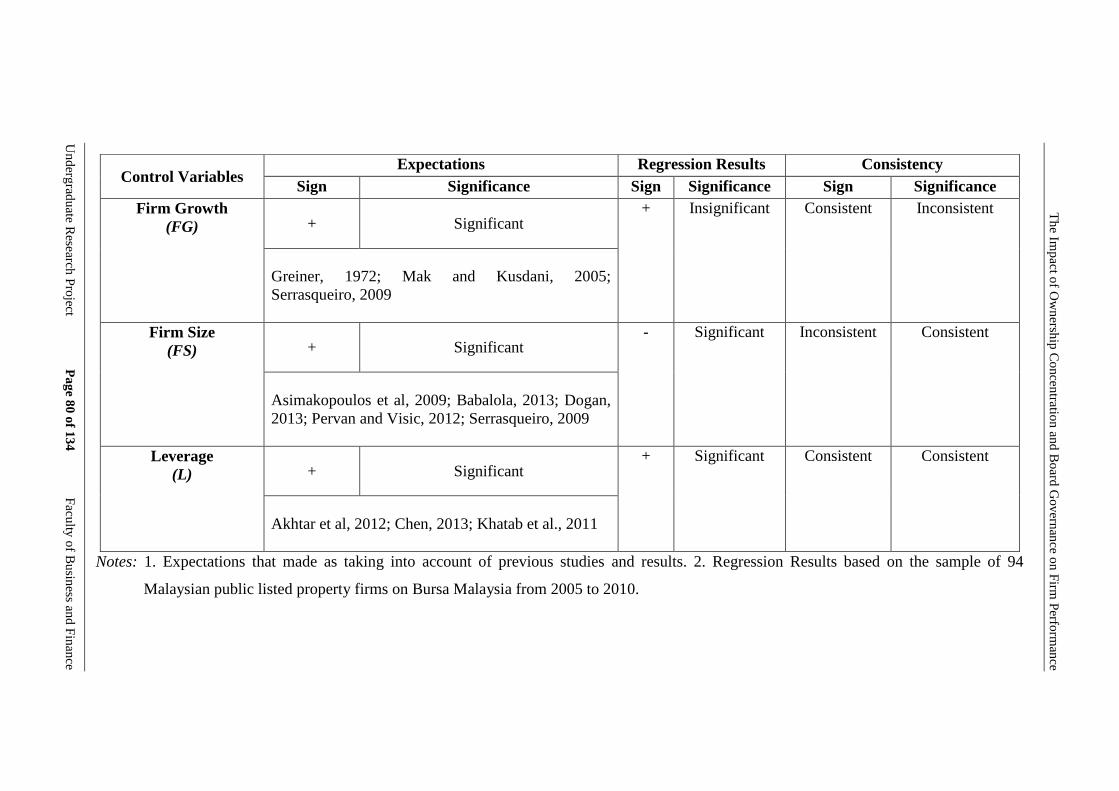
Un
derg
radu
ate Research
Pro
ject Pa
ge 8
0 o
f 13
4 F
aculty
of B
usin
ess and
Fin
ance
Th
e Imp
act of O
wn
ership
Co
ncen
tration
and
Bo
ard G
ov
ernan
ce on
Firm
Perfo
rman
ce
Notes: 1. Expectations that made as taking into account of previous studies and results. 2. Regression Results based on the sample of 94
Malaysian public listed property firms on Bursa Malaysia from 2005 to 2010.
Control Variables Expectations Regression Results Consistency
Sign Significance Sign Significance Sign Significance
Firm Growth
(FG)
+ Significant + Insignificant Consistent Inconsistent
Greiner, 1972; Mak and Kusdani, 2005;
Serrasqueiro, 2009
Firm Size
(FS)
+ Significant - Significant Inconsistent Consistent
Asimakopoulos et al, 2009; Babalola, 2013; Dogan,
2013; Pervan and Visic, 2012; Serrasqueiro, 2009
Leverage
(L)
+ Significant + Significant Consistent Consistent
Akhtar et al, 2012; Chen, 2013; Khatab et al., 2011

The Impact of Ownership Concentration and Board Governance on Firm Performance
Undergraduate Research Project Page 81 of 134 Faculty of Business and Finance
4.5 Conclusion
As a conclusion, with the total of 564 sample size, which is 94 property listed
firms in Malaysia from year 2005 to 2010, the regression results showed that
board size (BS), board independence (BI), firm size (FS) and leverage (LE) are
significantly related to the firm performance (TQ), while which indicate that
ownership concentration (OC) and firm growth (FG) are insignificantly related to
the firm performance (TQ).
Besides, when there is high ownership concentration firm (more than 40%, 32
Obs), board size (BS), firm growth (FG) and firm size (FS) are significantly
related to the firm performance (TQ), while only the board independence (BI) and
leverage (LE) are insignificantly related to firm performance (TQ).
When there is low ownership concentration firm (less than 40%, 532 Obs), board
size (BS), firm size (FS) and leverage (LE) are significant, while board
independence (BI) and firm growth (FG) are insignificant to the firm performance
(TQ).
The Impact of Ownership Concentration and Board Governance on Firm Performance
Undergraduate Research Project Page 82 of 134 Faculty of Business and Finance
CHAPTER 5: DISCUSSION, CONCLUSION AND
IMPLICATIONS
5.0 Introduction
Chapter five discusses the findings and results concluded from chapter four. It
summarizes the regression statistic and the major findings resulted in chapter four
is comprised. Furthermore, this chapter also comprises of the implication,
limitations, recommendation and a conclusion for the overall research.
5.1 Summary of Regression Statistics
The main concern of this research is to observe how ownership concentration and
board governance (e.g., board size (BS), board independence (BI)) influence
Malaysia 94 public listed property firms‟ performance from 2005 to 2010 (564
Obs). In this research consists of three independent variables which are ownership
concentration (OC), board size (BS), board independence (BI), and three control
variables which include firm growth (FG), firm size (FS) and leverage (LE). In
which, OC, BS and BI are the main concern variable. Besides that, FG, FS and LE
are treated as control variables.
BS and BI are proved to be the key factors to influence Malaysia property firms
and consistent with previous studies (e.g., Abidin, Kamal & Jusoff, 2009; Beasley,
1996; Kajola, 2008; Nicholson & Kiel, 2003; Omran, 2009). However, ownership
concentration does not influence all firm performance. It is a fact that most of the
past studies supported that ownership concentration is highly influence all firm
performance. Therefore inspired this thesis to further examine and explain OC to

The Impact of Ownership Concentration and Board Governance on Firm Performance
Undergraduate Research Project Page 83 of 134 Faculty of Business and Finance
firm performance, by dividing OC into two level which are high OC (more than
40%, 32 Obs) and low OC (less than 40%, 532 Obs).
In order to check whether each independent variable is significant, this paper
applies T Statistic individually. The summarized the regression results of 6
variables of this paper are as follows:
Table 5.1 Summary of T Statistic Results (Model 1)
Independent Variables Sign Significance
Ownership Concentration
(OC) + Insignificant
Board Size
(BS) + Significant
Board Independence
(BI) + Significant
Control Variables
Firm Growth
(FG) + Insignificant
Firm Size
(FS) - Significant
Leverage
(LE) + Significant
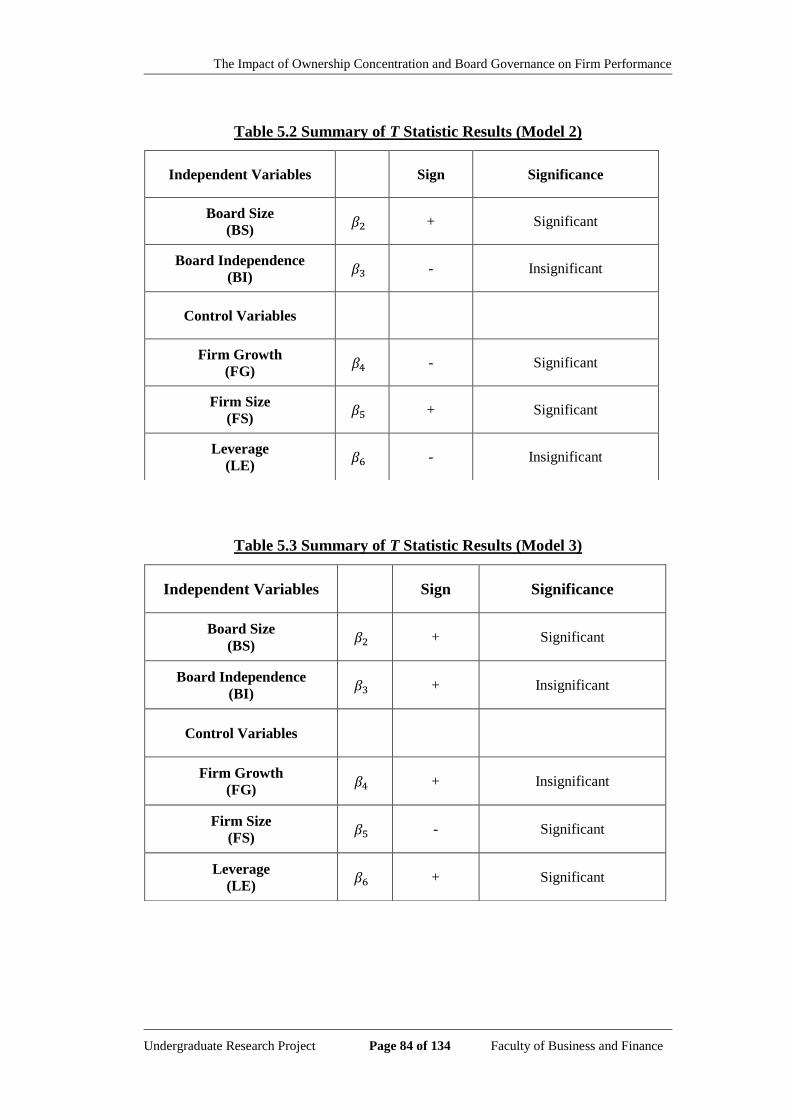
The Impact of Ownership Concentration and Board Governance on Firm Performance
Undergraduate Research Project Page 84 of 134 Faculty of Business and Finance
Table 5.2 Summary of T Statistic Results (Model 2)
Table 5.3 Summary of T Statistic Results (Model 3)
Independent Variables Sign Significance
Board Size
(BS) + Significant
Board Independence
(BI) - Insignificant
Control Variables
Firm Growth
(FG) - Significant
Firm Size
(FS) + Significant
Leverage
(LE) - Insignificant
Independent Variables Sign Significance
Board Size
(BS) + Significant
Board Independence
(BI) + Insignificant
Control Variables
Firm Growth
(FG) + Insignificant
Firm Size
(FS) - Significant
Leverage
(LE) + Significant

The Impact of Ownership Concentration and Board Governance on Firm Performance
Undergraduate Research Project Page 85 of 134 Faculty of Business and Finance
Table 5.4 The Relationships between Firm Performance and Its Expected
Theories for Model 1
From the Table 5.1 and Table 5.3 above show that the results for Model 1 and
Model 3 are quite similar, the only different is the BI is positively insignificant in
Model 3 but positively significant to firm performance in Model 1. For the result
of the other variables in Model 1 and 3 are the same with BS positively significant,
FG positively insignificant, FS negatively significant and LE positively significant
to the firm performance.
From Table 5.2, the result for Model 2 is totally different with Model 1 and Model
3, except for the BS show the same result with positively significant to firm
performance in all model. The results for Model 2 are as follow: BI negatively
insignificant, FG negatively significant, FS positively significant and LE
negatively insignificant to the firm performance.
Independent
Variables
Coefficients
for
All Firms
(564 Obs)
Expected Sign
Based on
Theory of
Intellectual
Capital of
Corporate
Governance
Expected
Sign Based
on Agency
Cost
Expected
Sign
Based on
Stewardship
Theory
Ownership
Concentration
(OC)
+
N/A Consistent N/A
Board Size
(BS)
+
Consistent Consistent Consistent
Board
Independence
(BI)
+
Consistent Consistent Consistent
The Impact of Ownership Concentration and Board Governance on Firm Performance
Undergraduate Research Project Page 86 of 134 Faculty of Business and Finance
Table 5.4 shows the relationship between the firm performance and the expected
theories. From the table 5.4, the firm performance results from all independent
variables are consistent with all the theories which including theory of intellectual
capital of corporate governance, agency cost and stewardship theory. While OC
does not relate to theory of intellectual capital of corporate governance and
stewardship theory.
5.2 Discussion of Major Finding
5.2.1 Ownership Concentration (OC)
The result of this research shows that the ownership concentration and
firm performance are positively related. However, the positive relationship
is insignificant. The positive result is consistent with the finding of Barclay
and Holderness (1989). Besides, there are also a lot of previous researchers
have the similar result, such as Haniffa and Hudaib, 2006; Javid and Iqbal,
2010; McConnell and Servaes, 1990; Nor et al, 2010; Omran, 2009.
However, the result from Omran et al. (2008) showed that ownership
concentration insignificantly related to firm performance. They argue that
ownership concentration is only affective when combining of both
ownership concentration and managerial interests. Fazlzadeh, Hendi and
Mahboubi (2011) also concluded that ownership concentration is
insignificant to firm performance. The result is similar with the result of
Omran et al. (2008).
This paper shows that the ownership concentration is insignificant in
affecting the property firms‟ performance in Malaysia. This might indicate
that the property companies have a good corporate governance practice.
Even though the companies consist of block shareholders, but the decision
making is due to the approval of the board of director. In this situation,
block shareholders do not have the power to make the decision by
themselves. Since one of the agency problems is between majority

The Impact of Ownership Concentration and Board Governance on Firm Performance
Undergraduate Research Project Page 87 of 134 Faculty of Business and Finance
shareholders and minority shareholders, the agency problem will be at
minimum when both of them do not have the power to make decision.
When the agency costs reduce, firm performance will increase. Therefore,
the result is consistent with agency cost theory.
5.2.2 Board Size (BS)
Result for board size is significantly positive correlated to Model 1 firm
performance. For Model 2 and 3, there are also significant positive
correlations with firm performance. This indicates that firms with larger
boards are associated with highly effectiveness and increasing firm value.
In other word, smaller boards believed to be less efficiency and decreasing
firm value. This result is consistent with the result of Abidin et al. (2009),
Kajola (2008) and Nicholson and Kiel (2003). They explained that the
larger board size allows more capabilities such as ideas, experiences and
skills to be combined within corporate management and deliver sufficient
needs at particular point of time. Therefore, this result is consistent with
agency theory as the larger board size increase the availability of
knowledge, experience and expertise which subsequently limit agency
problem. Moreover, the result shows consistency with stewardship theory
as the manager who work towards organizational objectives, which take
the interest of both manager and shareholders into consideration, tend to
improve firm performance (Davis, Schoorman & Donaldson, 1997;
Donaldson & Davis, 1991; Hernandez, 2012).
However, some of the researchers‟ studies provided a different result
which is significant negative relationship (e.g., Eisenberg et al., 1998;
Loderer & Peyer, 2002; Mak & Kusnadi, 2005; Yermack, 1996). They
claimed that the firm value decrease as board size decreases the firm
effectiveness. This is because of larger board size bring hassle to firm such
as poor communications and lower operating efficiency.
The Impact of Ownership Concentration and Board Governance on Firm Performance
Undergraduate Research Project Page 88 of 134 Faculty of Business and Finance
Furthermore, the concept of intellectual capital of corporate governance
showed evidence that the important assets and resources (e.g., personal
abilities, expertise and skills) increase as the number of boards of director
increase within the firm, given a more complex and interconnected
working environment. This not only benefit the firm by contributing a
wealth of expertise and experience into the firm as well as to provide a
diversification in helping firms to secure vital resources. Therefore, the
linkage between the board size and firm performance of Malaysian public
listed property firms on Bursa Malaysia has proved to be a significantly
positive correlated.
5.2.3 Board Independence (BI)
This paper result illustrates that board independence is statistically
significant in influencing the firm performance. The board independence
has positive impact on firm performance in Model 1. This indicates that
the higher the board independence will lead to higher firm performance.
The result is consistent with the research findings of Lefort and Urzua
(2008) in Chilean companies and Omran (2009) in Egyptian firms.
However, this finding is inconsistent with the previous researchers
(Ghazali, 2010; Ponnu & Karthigeyan, 2010; Chaghadari, 2011) who
studies on Malaysia companies. In which, they found that board
independence is insignificant in influencing Malaysia firms‟ performance.
However, this paper might have proven the explanation of Ghazali (2010)
studies. He stated that the insignificance of his finding may due to the
period of examination in 2001 because the regulation on corporate
governance may need a few years to show positive result. Furthermore, the
finding of this research also supported by Fama and Jensen (1983) who
stated independent director will lead to firm performance improvement.
Besides, independent boards of director help in management and reduce
financial fraud (Beasley, 1996).

The Impact of Ownership Concentration and Board Governance on Firm Performance
Undergraduate Research Project Page 89 of 134 Faculty of Business and Finance
The result have illustrated that independence of board able to improve
management of agency problem by acting as monitoring role, thus
reducing agency cost and lead to an increment in firm performance and
can be concluded that the result is consistent with theory of agency cost.
Besides, the result shows consistency with the theory of intellectual capital
of corporate governance since independent director posses some relevant
knowledge and skills which are helpful for company management.
Furthermore, the result is also consistent with stewardship theory since the
independent directors are employed mainly to protect shareholders‟
interest.
In contrast, the result from Model 2 and 3 shows that board independence
is insignificant in affecting the firm value. The result is in line with the
findings of Abdullah (2004), Chaghadari (2011) and Ghazali (2010). This
might due to the independent board director has limited incentives to
manage the firm as they hold only small interest in the firm. In other words,
the management incentive has been exchanged for board independency
(Bhagat & Black, 2001). Further, Fosberg (1989) claimed that in order to
perform, an outside director need to have awareness of their position in
improving the firm corporate governance and also understanding of how
the firm operate. Interestingly, board independence is found to have
negative impact on firm performance when the firm in high ownership
concentration. It may have confirm the recent literature that argue
corporate governance is not practical in all but depend on the market and
firm condition (Black et al, 2012; Koerniadi & Tourani-Rad, 2012).
Furthermore, Koerniadi and Tourani-Rad (2012) found that independent
board has negative effect to the firm performance when they are in
majority on a board. This might indicate that too many outside directors on
board may have inverse result.
The Impact of Ownership Concentration and Board Governance on Firm Performance
Undergraduate Research Project Page 90 of 134 Faculty of Business and Finance
5.2.4 Firm Growth (FG)
There are several researchers like Jang and Park (2011), Mak and Kusdani
(2005) and Serrasqueiro (2009) found that firm growth is significant to
firm performance. But the result in this research for firm growth estimated
on firm performance is insignificant and positive relationship in Model 1
and 3. This result is out of expectation as proposed that the firm growth is
positively and significantly affect the firm performance. Even so, this
result is constant with the result of Chathoth and Olsen (2007), Loi and
Khan (2012) and Markman and Gartner (2002) which are also insignificant.
This result shows that increase in firm growth do not necessary will
increase the firm performance in all property firms and low ownership
concentration firms. This finding can be explained by growth strategies
may not are value adding strategies. The firms required to use more fund
to expand the business so there will be a high capital expenditures and a
low free cash flow. Although the sales are increasing but on the other side
like the costs are increasing so the result of growth strategy will not appear
clearly in short term.
While in Model 2, firm growth is negatively and significantly affect the
firm performance. This result same with the result found by Jang and Park
(2011) which the research only focused on the restaurant firms. The
researches described the result with the reason of restaurant firms are not
suitable to expand their business by using the profit earned but should
make sure the firms are maintaining the profit level. From the result in
Model 2 indicates that firm growth in high ownership concentration firm‟s
increase will lead to low firm performance. It might be because of agency
problem occurred. When ownership concentration is high, the decision
making will fall on few people hands and when wrong decision will lead
to low firm performance like decreasing of net present value (NPV). As
only the money outflow, firm growth will contribute nothing to firm
performance.
The Impact of Ownership Concentration and Board Governance on Firm Performance
Undergraduate Research Project Page 91 of 134 Faculty of Business and Finance
5.2.5 Firm Size (FS)
Firm size is positively significant related to performance proven by
previous researchers, such as Dogan (2013), Pervan and Visic (2012) and
Serrasqueiro (2009) and their findings mainly explained that the rising
profitability of larger firms is contributed by the benefit from economies of
scale. Large firms can enjoy lower production cost and hence lead to
higher firm performance. However, these results contradict with the results
for Model 1 and Model 3. In Model 1 and Model 3, firm size is found to
have significant negative impact on firm performance. In the case of
Malaysian firms, this could probably be attributed to X-inefficiencies
(Ramasamy et al., 2005). Larger firms are more likely to have high levels
of bureaucratization and thereby inhibiting efficient decision making in
management. According to Ammar et al. (2003), the inverse impact of
firm size on firm performance could be caused by management inability to
manage the firm that grows in size and to control the capital constraints.
In Model 2, firm size has significant positive impact on firm performance.
According to Arosa, Iturradle and Maseda (2010), the large firms able to
make sure that a suitable management team and a controlling board exist
for monitoring the firm performance. Due to the close relation between the
large equity blockholders‟ wealth and the company‟s value, they have
strong incentives to monitor the firm performance (Anderson & Reeb,
2003). Therefore, the firm performance might increase with the close
monitoring of large equity blockholders.
5.2.6 Leverage (LE)
As shown in the result, leverage has significant positive correlation with
firm performance in Model 1 and 3. It indicates that the higher leveraged
firms are more profitable and this result is supported by the findings of
Akhtar et al. (2012) and Safieddine and Titman (1999). Safieddine and
The Impact of Ownership Concentration and Board Governance on Firm Performance
Undergraduate Research Project Page 92 of 134 Faculty of Business and Finance
Titman (1999) found that firms with large increase in leverage commit the
manager to take necessary action that would lead to firm‟s improvements
which subsequently raises the firm performance. Moreover, Akhtar et al.
(2012) revealed that the employment of leverage may lead to rising firm
performance as leverage would turn into firm‟s profitability in the long
term and it enables the firm to reach at a sustainable future growth.
However, Hsueh (2013) and Soon and Idris (2012) found the result which
is different from the results for Model 1 and 3. Yet their results are the
same as the result for Model 2, in which, leverage is negatively correlated
with firm performance. According to Soon and Idris (2012), higher
leverage means high risk and it will cause the firm performance to drop
when the firm has excessive exposure in risky product segment. In the
Research and Development (R&D) investments of a firm, debt is an
indispensable element for its completion (Hsueh, 2013). Increasing level
of firm‟s leverage would probably increase the influence of debt holders
and hence inhibit efficient management decision which consequently leads
to decreasing firm performance. Moreover, the impact of leverage on firm
performance was found to be insignificant in Model 2. This is because the
blockholders in high ownership concentration firms have strong preference
over internal financing to retain the ownership and control (Zhang, Venus
& Wang, 2012). Therefore, it might be due to the reliance of high
ownership concentration firms on internal financing to cause leverage
insignificant to firm performance.
5.3 Implications of the Study
5.3.1 Property Industry
This thesis helps Malaysia listed companies, but not limited to property
industry to have a better understanding on how a listed company on Bursa
Malaysia to sustain and maintain good corporate governance in today‟s
The Impact of Ownership Concentration and Board Governance on Firm Performance
Undergraduate Research Project Page 93 of 134 Faculty of Business and Finance
economic world. This study has employed three independent variables and
three control variables to discuss a good corporate governance to be in
Malaysia which are ownership concentration, board size, board
independence, firm growth, firm size and leverage. This paper provided
that how each independent variable should be applied at certain level. For
example, board size should be on average 7 to 8 members. It is the suitable
number of members on board to be applied in Malaysia property industry.
Therefore this might provide the direction for a property firm to maintain
good governance when they would like to increase their firm performance
as well as a reference for annual general meeting (AGM). Thus, the firm
could apply proper corporate governance to enjoy the benefits that brought
by good corporate governance practices (Mulili & Wong, 2011). With an
increment in the firm‟s financial performance, the firm will continue to
grow and may have the opportunity to expand its business. As a result,
unemployment rate in Malaysia may decrease indirectly.
5.3.2 Policy Maker
From the result of this study, ownership concentration is not contributing
to Malaysian public listed property firms‟ performance. Policy makers
should concern on this matter as to figure out the actual reason why is that
ownership concentration is not affecting the firm performance and take
action accordingly. Next, board size and board independence are found to
be significant in influencing property listed firms‟ performance. This
means that board governance had been proved to have effect on firm
performance of Malaysian public listed companies. This paper had also
included the literatures of board governance which explain the
effectiveness of board size and board independence in controlling agency
conflict and thus adding firm‟s value. Board size and board independence
have positive impact on firm performance which indicates that the higher
the independence and size of board will improve the performance of
Malaysian public listed property companies. It has proven that good
The Impact of Ownership Concentration and Board Governance on Firm Performance
Undergraduate Research Project Page 94 of 134 Faculty of Business and Finance
corporate governance will result in a firm performance, thus policy makers
should take this into account and emphasizing on developing corporate
governance policies in future (Bhagat & Bolton, 2008). Therefore, the
correct and suitable policies implementation will succeed to reduce agency
cost and promote not only property sector but also other sectors, as well as
support in Malaysia economic growth.
5.3.3 Investor
Individual investors can take the result of this research as a reference when
they involve in any investment decision (Joel & Romuald, 2012). This
research shows that board size and board independence are both significant
to the firm performance, so individual investors should take board
governance into consideration when making investment decision because
both the board size and board independence may affect the firm
performance especially in property industry. Besides, individual investors
can use this result to compare with other industry. With the result of
ownership concentration is insignificant show that ownership
concentration does not have affect the firm performance radically.
5.3.4 Academic
This research paper provides the academicians with some useful
educational knowledge. They would be able to understand the factors
affecting firm performance in property industry both theoretically and
empirically. Since there are very few researches who had conducted
research in corporate governance of Malaysia listed property firms, this
research paper would inevitably be a helpful guidance for their future
research.

The Impact of Ownership Concentration and Board Governance on Firm Performance
Undergraduate Research Project Page 95 of 134 Faculty of Business and Finance
5.4 Limitations of the Research Study
There are a few limitations in this study. First and foremost, there are three
independent variables used in this research, which are ownership concentration,
board size and board independence while firm growth, firm size and leverage act
as control variable. There might be some other independent variables can be used
for this research. Different independent variables used might give different result.
Besides that, the measurement of dependent variable in this research is Tobin‟s Q.
There are plenty of different formulas proposed by others researcher in measuring
the Tobin‟s Q (Hermalin & Weisbach, 1991; Nicholson & Kiel, 2003; Mak &
Kusnadi, 2005; McConnell & Servaes, 1990; Yermack, 1996). This paper tested
one of the formulas to get a result. This might result in inappropriate and bias in
the data since different formula will have different result.
Last but not least, there is also limitation of insufficient of journals support that
specifically study on Malaysia firm and property industry. Due to this reason, this
paper has referred to the journals that are focus on other different sectors and
countries instead of properties sector and Malaysia firms. This might result in
improper comparison between the expected result and outcome of this paper.
5.5 Recommendations for Future Study
Based on the limitations of study, there are several recommendations for future
study. Firstly, this paper had examine the relationship of independent variables
(ownership concentration, board size and board independence), control variables
(firm growth, firm size and leverage) with dependent variable (firm performance).
Therefore, future research should consider testing on others valid independent
variables in affecting firm performance such as dividend yield, CEO duality and
director‟s ownership .

The Impact of Ownership Concentration and Board Governance on Firm Performance
Undergraduate Research Project Page 96 of 134 Faculty of Business and Finance
Since there are a lot of different formula for Tobin‟s Q used by past researcher,
future researcher can try on other formula instead of the formula that using for this
research. Rather, other measurement of firm performance like return on asset
(ROA) and return on equity (ROE) also can be used as it may result in different
findings.
Moreover, there is insufficient number of the journals support. Due to this reason,
future research should not restrict to a single sector. They should focus on wider
sectors so that the result might be match to their main objective. Besides, this will
also help in ensure more appropriate journals with useful data and information
available as reference.
5.6 Conclusion
As the summary, the main concern of this research is to study the impact of
ownership concentration and board governance on the firm performance of 94
Malaysian public listed property companies from year 2005 to 2010. The result
has rejected null hypothesis testing of board size, board independence, firm size
and leverage. This shows that the board size, board independence, firm size and
leverage are significant to influence the firm performance. Further, this paper does
not reject the null hypothesis testing of ownership concentration and firm growth.
It shows that ownership concentration and firm growth are insignificant to
influence the firm performance. Besides, when the ownership concentration is
high (more than 40%), the board independence, firm growth, firm size and
leverage have significant impact on firm performance, while only the board
independence showed insignificant impact on firm performance; When the
ownership concentration is low (less than 40%), the board size, form size and
leverage is significant, while board independence and firm growth are
insignificant to the firm performance.
Generally, the findings showed that only two out of three key variables in this
study are found significance. This has demonstrated that in corporate governance
The Impact of Ownership Concentration and Board Governance on Firm Performance
Undergraduate Research Project Page 97 of 134 Faculty of Business and Finance
practices, board independence and board size should be emphasize instead of
ownership concentration that is found to be insignificant in influence the firm
performance.
Apart from that, this paper finds that some restrictions that may affect the research
findings, which includes insufficient data collection, manual calculation and
insufficient or inappropriate journal support. Last but not least, there are some
recommendations provided for future research includes study for more than one
sectors (indirectly can increase sample size), data collection from other resources,
sector specification and increase or exchange of independent variables.
The Impact of Ownership Concentration and Board Governance on Firm Performance
Undergraduate Research Project Page 98 of 134 Faculty of Business and Finance
REFERENCES
Abdullah, S. N. (2004). Board composition, CEO duality and performance among
Malaysian listed companies. Corporate Governance, 4(4), 47-62.
Abidin, Z. Z., Kamal, N. M., &Jusoff, K. (2009).Board structure and corporate
performance in Malaysia. International Journal of Economics and
Finance, 1(1), 150-164.
Aggarwal, R. K., & Samwick, A. A. (2006). Empire- builder and shirker:
investment, firm performance, and managerial incentives. Journal of
Corporate Finance, 12, 489-515.
Agrawal, A., & Knoeber, C. R. (1996). Firm performance and mechanisms to
control agency problems between managers and shareholders. Journal of
Financial and Quantitative Analysis, 31(3), 377-397.
Akhtar, S., Javed, B., Maryam, A., & Sadia, H. (2012). Relationship between
financial leverage and financial performance: Evidence from fuel &
energy sector of Pakistan. European Journal of Business and
Management, 4(11), 7-17.
Ammar, A., Hanna, A. S., Nordheim, E. V., & Russell, J. S. (2003). Indicator
variables model of firm‟s size-profitability relationship of electrical
contractors using financial and economic data. Journal of Construction
Engineering and Management, 192-197.
Anderson, R. C., & Reeb, D. M. (2003). Founding-family ownership and firm
performance: Evidence from the S&P 500. The Journal of Finance, 58(3),
1301-1327.
Ariff, A. M., Ibrahim, M. K., & Othman, R. (2007). Determinants of firm level
governance: Malaysia evidence. Corporate Governance, 7(5), 562-573.

The Impact of Ownership Concentration and Board Governance on Firm Performance
Undergraduate Research Project Page 99 of 134 Faculty of Business and Finance
Arosa, B., Iturradle, T., & Maseda, A. (2010). Ownership structure and firm
performance in non-listed firms: Evidence from Spain. Journal of Family
Business Strategy, 1, 88-96.
Asian Corporate Governance Association. (2010). Hong Kong. Retrieved from
http://www.acgaasia.org/content.cfm?SITE_CONTENT_TYPE_ID=19
Asimakopoulos, I., Samitas, A., & Papadogonas, T. (2009). Firm-specific and
economy wide determinants of firm profitability Greek: Evidence using
panel data. Managerial Finance, 35(11), 930-939.
Babalola, Y. A. (2013). The effect of firm size on firms profitability in
Nigeria. Journal of Economics and Sustainable Development, 4(5), 90-94.
Banerjee, A. & Chaudhury, S. (2010). Statistics without tears: Populations and
samples. Industrial Psychiatry Journal, 19(1), 60-65. doi: 10.4103/0972-
6748.77642
Barbosa, N., & Louri, H. (2002). The determinants of multinationals‟ ownership
preferences: evidence from Greece and Portugal. International. Journal of
Industrial Organization, 20(4), 493-515.
Barclay, M. J., & Holderness, C. G. (1989). Private benefits from control of public
corporations. Journal of Financial Economics, 25, 371-395.
Barclay, M. J., Holderness, C. G., & Sheehan, D. P. (2008). Dividends and
corporate shareholders. The Review of Financial Studies, 22(6).
Bauer, R., Frijns, B., Otten, R. & Tourani-Rad, A. (2008).The impact of corporate
governance on corporate performance: Evidence from Japan. Pacific-Basin
Finance Journal, 16. 236- 251.
Beasley, M. (1996). An empirical analysis of the relation between the board of
director composition and financial statement fraud. The Accounting
Review, 71(4), 443-465.
The Impact of Ownership Concentration and Board Governance on Firm Performance
Undergraduate Research Project Page 100 of 134 Faculty of Business and Finance
Beekes, W., Pope, P., & Young, S. (2004). The link between earnings timeliness,
earnings conservatism and board composition: evidence from the UK.
12(1).
Bennedsen, M., Kongsted, H. C. & Nielsen, K. N. (2007).The causal effect of
board size in the performance of small and medium-sized firms. Journal
of Banking and Finance, 32, 1098-1109.
Bhagat, S., & Black, B. (2001). The non-correlation between board independence
and long term firm performance. Journal of Corporation Law, 27, 231-
274.
Bhagat, S., & Bolton, B. (2008). Corporate governance and firm
performance. Journal of Corporate Finance, 14, 257-273.
Black, B. S., Carvalho, A. G., & Gorga, E. (2012). What matters and for which
firms for corporate governance in emerging markets? Evidence from
Brazil (and other BRIK countries). Journal of Corporate Finance, 18,
934-952.
Bossche, F. A. M. V. (2011). Fitting state space models with EViews. Journal of
Statistical Software, 41(8).
Bozec, Y., & Bozec, R. (2007). Ownership concentration and corporate
governance practices: substitution or expropriation effects? Canadian
Journal of Administrative Science, 24(3), 182-195.
Broni, G., & Velentzas, J. (2012). Corporate governance, control and
Individualism as a definition of business success. The idea of a “post-
heroic” leadership. Procedia Economics and Finance, 1, 61-70.
Camey, R. W., & Child, T. B. (2013). Changes to the ownership and control of
East Asian corporations between 1996 and 2008: The primary of politics.
Journal of Financial Economics, 107, 494-513.
Chaghadari, M. F. (2011). Corporate governance and firm performance.
International Proceedings of Economics Development and Reasearch
(IPEDR), 10, 484-489.
The Impact of Ownership Concentration and Board Governance on Firm Performance
Undergraduate Research Project Page 101 of 134 Faculty of Business and Finance
Chathoth, P. K., & Olsen, M. D., (2007). Does corporate growth really matter in
the restaurant industry? International Journal of Hospitality Management,
26, 66-80.
Chen, S. (2013). How do leverage ratios affect bank share performance during
financial crises: The Japanese experience of the late 1990s. Journal of
The Japanese and International Economies, 30, 1-18.
Church, R. M. (2001). The effective use of secondary data. Learning and
Motivation, 33, 32-45. doi:10.1006/lmot.2001.1098
Christopher, J. (2010). Corporate governance- A multi-theoretical approach to
recognizing the wider influencing forces impacting on
organizations. Critical Perspectives on Accounting, 21, 683-695.
Claessens, S., Djankov, S., & Lang, L. H. P. (2000). The separation of ownership
and control in East Asian corporations. Journal of Financial Economics,
58, 81-112.
Claessens, S., Djankov, S., Fan, J. P. H & Lang, L. H.P (2002). Disentangling the
incentive and entrenchment effects of large shareholding. The Journal of
Finance, 17 (6). 2741- 2772.
Coad, A. (2007). Testing the principle „growth of the fitter‟: the relationship
between profits and firm growth. Structural Change and Economic
Dynamics, 18(3), 370-386.
Conger, J., & Lawler, E. E. (2009). Sharing leadership on corporate boards: A
critical requirement for teamwork at the top. Retrieved August 18, 2013
from http://ssrn.com/abstract=1313353
Corporate Governance Blue Print. (2011). Securities Commission, Malaysia.
Corporate Governance. (n.d.). Retrieved August 12, 2013, from
http://go.worldbank.org/FN42HE8CJ0
The Impact of Ownership Concentration and Board Governance on Firm Performance
Undergraduate Research Project Page 102 of 134 Faculty of Business and Finance
Creswell, J. W. (2003). Research design: Qualitative, quantitative and mixed
methods approaches (2nd ed.). London: Sage Publications, Inc.
Davis, J. H., Schoorman, D., & Donaldson, L. (1997). Toward a stewardship
theory of management. Academy of Management Review, 22(1), 20-47.
Deesomsak, R., Paudyal, K. & Pescetto, G. (2004). The determinants of capital
structure: evidence from the Asia Pacific region. Journal of multinational
financial management, 14(4-5), 387-405.
Dickson, V. (1994). Aggregate industry cost functions and the Herfindahl index.
Southern Economic Journal, 61(2), 445-452.
Doğan, M. (2013). Does firm size affect the firm profitability? Evidence from
Turkey. Research Journal of Finance and Accounting, 4, 53-59.
Donaldson, L., & Davis, J. H. (1991). Stewardship theory or agency theory: CEO
governance and shareholder returns. Australian Journal of
Management, 16(1), 49-65.
Eisenberg, T., Sundgen, S. & Wells, M.T. (1998). Larger board size and
decreasing firm value in small firms. Journal of Financial Economics, 48,
35-54.
Erkens, D. H., Hung, M. Y., & Matos, P. (2012). Corporate governance in the
2007-2008 financial crisis: evidence from financial institutions
worldwide. Journal of Corporate Finance, 18, 389-411.
Fama, E. F., & Jensen, M. C. (1983). Separation of ownership and control.
Journal of Law and Economics, 26(2), 301-325.
Fan, J. P. H., & Wong, T. J. (2002). Corporate ownership structure and the
informativeness of accounting earnings in East Asia. Journal of
Accounting and Economics, 33, 401-425.
The Impact of Ownership Concentration and Board Governance on Firm Performance
Undergraduate Research Project Page 103 of 134 Faculty of Business and Finance
Farooque, O. A., Zijl, T. V., Dunstan, K., & Karim, A. W. (2007). Ownership
structure and corporate performance: Evidence from Bangladesh. Asia-
Pacific Journal of Accounting & Economics, 14, 127-150.
Fazlzadeh, A., Hendi, A. T., & Mahboubi, K. (2011). The examination of the
effect of ownership structure on firm performance in listed firms of
Tehran stock exchange based on the type of the industry. International
Journal of Business and Management, 6(3), 249-266.
Forbes, K. J. (2002). How do large depreciations affect firm performance? IMF
Staff Papers, 49, 214-238.
Fosberg, R. H. (1989). Effective outside directors. Journal of Applied Business
and Economics, 20, 24-32.
Gentry, R. J., & Shen, .W. (2010). The relationship between accounting and
market measures of firm financial performance: How strong is it?
Journal of Managerial Issues, 12(4), 514-530.
Georgen, M., & Renneboog, L. (2001). Investment policy, internal financing and
ownership concentration in the UK. Journal of Corporate Finance, 7(3),
257-284.
Ghazali, N. A. M. (2010). Ownership structure, corporate governance and
corporate performance in Malaysia. International Journal of Commerce
and Management, 20(2), 109-119.
Goddard, J., Molyneux, P., & Wilson, J. O. S., (2004). Dynamics of growth and
profitability in Banking. Journal of Money, Credit and Banking, 36(6),
1069-1090.
Goergen, M., & Renneboog, L. (2001). Investment policy, internal financing and
ownership concentration in the UK. Journal of Corporate Finance, 7,
257-284.
González, V. M. (2013). Leverage and corporate performance: International
evidence. International Review of Economics and Finance, 25, 169-184.
The Impact of Ownership Concentration and Board Governance on Firm Performance
Undergraduate Research Project Page 104 of 134 Faculty of Business and Finance
Greiner, L. E. (1998). Evolution and revolution as organization grow. Harvard
Business Review, 1-11.
Guest, P. M. (2009). The impact of board size on firm performance: evidence
from the UK. The European Journal of Finance, 15(4), 385-404.
Gujarati, D. N. (2003). Basic Econometrics (4th ed.). New York: McGraw-Hill
Higher Education
Gujarati, D. N., & Porter, D. C. (2009). Basic Econometrics (5th ed.). New York:
McGraw-Hill Higher Education
Haniffa, R., & Hudaib, M. (2006). Corporate governance structure and
performance of Malaysian listed companies. Journal of Business Finance
& Accounting, 33(7&8), 1034-1062.
Hart, O. and Moore, J. (1995). Debt and seniority: an analysis of the role of hard
claims in constraining management. American Economic Review, 85,
567-585.
Heaney, A. R. (2007). South East Asian corporate board size. Paper presented at
the 20th
Australasian Finance & Banking Conference 2007. Retrieved
August 17, 2013, from http://ssrn.com/abstract=1009760
Heracleous, L. (2001). What is the impact of corporate governance on
organizational performance? Conference Papers, 9 (3). 165-173.
Hermalin, B. E., & Welsbach, M. S. (2003). Boards of directors as an
endogenously determined institution: a survey of the economic literature.
FRBNY Economic Policy Review.
Hernandez, M. (2012). Toward an Understanding of The Psychology of
Stewardship. Academy of Management Review, 37(2), 172-193.
Holderness, C. G., & Sheehan, D. P. (1988). The role of majority shareholders in
publicly held corporations: An exploratory analysis. Journal of Financial
Economics, 20, 317-346.
The Impact of Ownership Concentration and Board Governance on Firm Performance
Undergraduate Research Project Page 105 of 134 Faculty of Business and Finance
Holderness, C. G., & Sheehan, D. P. (2000). Constraints on large-block
shareholders. Concentrated corporate ownership, 139-176.
Horderness, C. G. (2003). A survey of blockholders and corporate control.
Economic Policy Review.
Hoskisson, R. E., Johnson, R. A., & Moesel, D. D. (1994). Corporate divestiture
intensity in restructuring firms: Effect of governance, strategy, and
performance. The Academy of Management Journal, 37(5), 1207-1251.
Hsiao, C. (2003). Analysis of Panel Data (2nd ed.). United Kingdom: Cambridge
University Press.
Hsiao, C., & Tahmiscioglu, A. K. (2008). Estimation of dynamic panel data
analysis with both individual and time-specific effects. Journal of
Statistical Planning and Inference, 138(9), 2698-2721.
Hsiao, C., & Wang, Y. (2006). Panel data analysis- advantages and challenges.
Institute of Economic Policy Research- University of Southern California.
Hsueh, E. (2013). The moderating effects of leverage and ownership structure on
firm performance. South East Asia Journal of Contemporary Business,
2(1), 73-76.
Hunsinger, D. S., & Smith, M. A. (2008). Factors that influence information
systems undergraduates to pursue IT certification. Journal of Information
Technology Education, 7, 255-273.
Ibrahimy, A. I., & Ahmad, R. (2012). Blockholders, corporate governance and the
value of the firm: a panel data analysis of Malaysian non-financial
companies.
Jaggi, B., Leung, S., & Gul, F. (2009). Family control, board independence and
earnings management: Evidence based on Hong Kong firms. J. Account.
Public Policy, 28, 281-300.
The Impact of Ownership Concentration and Board Governance on Firm Performance
Undergraduate Research Project Page 106 of 134 Faculty of Business and Finance
Jang, S. C., & Park, K. (2011). Inter-relationship between firm growth and
profitability. International Journal of Hospitality Management, 30(4),
1027-1035.
Japanese investors to develop RM500mil "Little Japan" in Johor Bahru. (2013,
May 25). The Star. Retrieved August 30, 2013, from
http://www.thestar.com.my/News/Nation/2012/03/18/Japanese-investors-
to-develop-RM500mil-Little-Japan-in-Johor-Baru.aspx
Javid, A. Y., & Iqbal, R. (2010). Ownership concentration, corporate governance
and firm performance: evidence from Pakistan. The Pakistan
Development Review, 47(4), 643-659.
Jensen, M. C. (1986). Agency cost of free cash flow, corporate finance, and
takeover. American Economic Review, 76(2), 323-329.
Jensen, M. C., & Meckling, W. H. (1976). Theory of the firm: managerial
behaviour, agency cost and ownership structure. Journal of Financial
Economics, 3(4), 305-360.
Joel, T. K. M., & Romuald, D. F. (2012). The impact of corporate governance
mechanism and corporate performance- a study of listed companies in
Malaysia. Journal for the Advancement of Science & Arts, 3(1), 31-45.
Kajola, S. O. (2008). Corporate governance and firm performance: The case of
Nigerian listed firms. European Journal of Economics, Finance and
Administrative Sciences
Keorniadi, H., & Tourani-Rad, A. (2012). Does board independence matter?
Evidence from New Zealand. Australasian Accounting Business and
Finance Journal, 6(2), 3-18.
Khatab, H., Masood, M., Zaman, K., Saleem, S., & Saeed, B. (2011). Corporate
governance and firm performance: A case study of Karachi stock market.
International Journal of Trade, 2(1), 39-43.
The Impact of Ownership Concentration and Board Governance on Firm Performance
Undergraduate Research Project Page 107 of 134 Faculty of Business and Finance
Kouser, R., Bano, T., Azeem, M., & Hassan, M. (2012). Inter-relationship
between profitability, growth and size: A case of non-financial
companies from Pakistan. Pak. J. Commer. Soc. Sci., 6(2), 405-419.
La-Porta, R., Lopez-de-Silanes, F., Shleifer, A., & Vishny, R. W. (1998). Law and
finance. Journal of Political Economy, 106(6), 1113-1155.
Lefort, F., & Urzua, F. (2008). Board independence, firm performance and
ownership concentration: evidence from Chile. Journal of Business
Research, 61, 615-622.
Liew, P. K. (2008). The (perceived) roles of corporate governance reforms in
Malaysia: the views of corporate practitioners. Corporate Governance in
Less Developed and Emerging Economies (Research in Accounting in
Emerging Economies), 8, 455-482.
Linck, J. S., Netter, J. M., & Yang, T. (2008). The determinants of board structure.
Journal of Financial Economics, 87, 308-328.
Loderer, C. & Peyer, U. (2002).Board overlap, seat accumulation, and share prices.
European Financial Management, 8(2), 165-192.
Loi, T. H., & Khan, A. A. (2012). Determinants of firm growth: evidence form
Belgian companies. Unpublished master„s thesis, Ghent
University, Belgium.
M‟sia gets kudos from World Bank. (2013, February 27). The Star. Retrieved
from July 20, 2013,
http://biz.thestar.com.my/news/story.asp?file=/2013/2/27/business/12765
568&sec=business
Maditinos, D., Sevic, Z., & Theriou, N. (2006). A review of the empirical
literature on earning and earning and economic value (EVA) in
explaining stock market returns. Which performance measure is more
value relevant in the Athens Stock Exchange (ASE)? 5th
Annual
Conference of the Hellenic Finance & Accounting Association,
University of Macedonia, Thessalomiki, Greece.
The Impact of Ownership Concentration and Board Governance on Firm Performance
Undergraduate Research Project Page 108 of 134 Faculty of Business and Finance
Mahalingam, E. (2013, August 2013). No immediate bubble risk for Malaysia's
property sector. The Star. Retrieved January 15, 2014, from
http://www.thestar.com.my/Business/Business-News/2013/08/28/No-
immediate-bubble-risk-for-property-sector-Prices-not-as-volatile-as-in-
Hong-Kong-and- Singapore.aspx
Majumdar, S. K. (1997). The Impact of Size and Age on Firm-Level Performance:
Some Evidence from India. Review of Industrial Organization, 12, 231-
241.
Mak, Y. T. & Kusnadi, Y. (2005).Size really matters: Further evidence on the
negative relationship between board size and firm value. Pacific-Basin
Finance Journal, 13(3), 301-318.
Malaysia Code on Corporate Governance. (2012).
Malaysia My Second Home Programme. (2013). Retrieved from
http://www.mm2h.gov.my/
Malaysian property sector upgraded to Positive. (2013, May 10). The Star.
Retrieved June 21, 2013, from
http://biz.thestar.com.my/news/story.asp?file=/2013/5/10/business/20130
510145554&sec=business
Markman, G. D. & Gartner, W. B. (2002). Is extraordinary growth profitable? A
study of Inc 500 high-growth companies. Entrepreneurship Theory and
Practice, 27, 65-76.
Mashayekhi, B. & Bazaz, M. (2008). Corporate governance and firm performance
in Iran. Journal of Contemporary Accounting & Economics, l4 (2), 156-1
72.
McConnell, J. J., & Servaes, H. (1990). Additional evidence on equity ownership
and corporate value. Journal of Financial Economics, 27, 595-612.
The Impact of Ownership Concentration and Board Governance on Firm Performance
Undergraduate Research Project Page 109 of 134 Faculty of Business and Finance
Mulili, B. M., & Wong, P. (2011). Corporate governance practices in developing
countries: the case for Kenya. International Journal of Business
Administration, 2(1), 14-27.
Musa, Z. (2013, April 30). Iskandar Malaysia driving property market in Johor.
The Star. Retrived July 20, 2013, from
http://www.thestar.com.my/News/Community/2013/02/23/Iskandar-
Malaysia-driving-property-market-in-Johor.aspx
New dawn property sector re-rated. (2013, May 11). The Star. Retrieved June 21,
2013, from
http://biz.thestar.com.my/news/story.asp?file=/2013/5/11/business/130964
62&sec=business
Nicholson, S. W., & Bennet, T. B. (2008). Transparent practices: Primary and data
in business ethics dissertations. Journal of Business Ethics. doi:
10.1007/s10551-008-9717-0
Nicholson, G. J. & Kiel, G. C. (2003). Board composition and corporate
performance: How the Australian experience informs contrasting theories
of corporate governance. Corporate Governance: An International Review,
11(3), 189-205.
Nicholson, G. J., & Kiel, G. C. (2004). Breakthrough board performance: how to
harness your board‟s intellectual capital. Corporate Governance, 4(1), 5-
23.
Nor, F. M., Shariff, F. M., & Ibrahim, I. (2010). The effect of concentrated
ownership on the performance of the firm: do external shareholding and
board structure matter? Journal of Management, 30, 93-102.
Omran, M. (2009). Post-privatization corporate governance and firm performance:
the role of private ownership concentration, identity and board
composition. Journal of Comparative Economics, 37, 658-673.

The Impact of Ownership Concentration and Board Governance on Firm Performance
Undergraduate Research Project Page 110 of 134 Faculty of Business and Finance
Omran, M. M., Bolbol, A., & Fatheldin, A. (2008). Corporate governance and
firm performance in Arab equity markets: does ownership concentration
matter? International Review of Law and Economics, 28, 32-45.
Organisation for Economic Co-operation and Development (OECD). (1999).
Guidelines and instructions for OECD Symposium'', International
Symposium Measuring Reporting Intellectual Capital: Experiences, Issues,
and Prospects, June, Amsterdam, OECD, Paris. Retrieved from
http://www.oecd.org/sti/ind/2750309.pdf
Organisation for Economic Co-operation and Development (OECD). (2004).
Guidelines and instructions for OECD symposium'', International
symposium measuring reporting intellectual capital: Experiences, issues,
and prospects. June, Amsterdam, OECD, Paris.
Orhangazi, O. (2007). Financialization and capital accumulation in the non-
financial corporate sector: a theoretical and empirical investigation of the
U.S. economy: 1973-2003. Political Economy Research Institute,
University of Massachusetts Amherst.
Pervan, M., & Visic, J. (2012). Influence of firm size on its business
success. Croatian Operational Research Review (CRORR), 3, 213-223.
Petty, R. & Guthrie, J. (2000). Intellectual capital literature review: Measurement,
reporting and management. Journal of Intellectual Capital, 1(2), 155-176.
Retrieved from http://www.emerald-library.com
Ponnu, C. H., & Karthigeyan, R. M. (2010). Board independence and corporate
performance: evidence from Malaysia. African Journal of Business
Management, 4(6), 858-868.
Ramasamy, B., Ong, D., & Matthew Yeung, C. H. (2005). Firm Size, Ownership
and Performance in The Malaysia Palm Oil Industry. ASIAN Academy of
Management Journal of Accounting and Finance, 1, 81-104.
The Impact of Ownership Concentration and Board Governance on Firm Performance
Undergraduate Research Project Page 111 of 134 Faculty of Business and Finance
Rashid, A., De Zoysa, A., Lodh, S., & Rudkin, K. (2010). Board composition and
firm performance: Evidence from Bangladesh. Australasian Accounting
Business and Finance Journal, 4(1), 76-95.
Richter, A., & Wei, C. (2013). Determinants of ownership concentration in public
firms: importance of firm-, industry- and country-level factors.
International Review of Law and Economics, 33, 1-14.
Roos, G. & Roos, J. (1997).Measuring your Company‟s Intellectual
Performance.Long Range Planning, 30(3), 413-426.
Rusmin, R., Scully, G., Tower, G., & Taplin, R. (2009). The impact of corporate
governance and ownership concentration on audit quality in three asia
pacific stock markets. The Asia Pacific Journal of Economics and
Business, 13(2), 58-74.
Safieddine, A., & Titman, S. (1999). Leverage and Corporate Performance:
Evidence from Unsuccessful Takeovers. The Journal of Finance, 54(2),
547-580.
Serrasqueiro, Z. (2009). Growth and profitability in Portuguese companies: A
dynamic panel data approach. Economic Interferences, 11(26), 565-573.
Severin, E. (2001). Ownership structure and the performance of firm: evidence
from France. European Journal of Economic and Social Systems, 2, 85-
107.
Shakir, R. (2008). Board size, board composition and property firm performance.
Federal reserve Bank of New York Staff Reports.
Shleifer, A., & Vishny, R. W. (1986). Large shareholders and corporate control.
Journal of Political Economy, 94(3), 461-488.
Shleifer, A., & Vishny, R. W. (1997). A survey of corporate governance. The
Journal of Finance, 52(2), 737-783.
Soon, Y., & Idris, R. (2012). Leverage, product diversity and performance of
general insurers in Malaysia. The Journal of Risk Finance, 13(4), 347-361.
The Impact of Ownership Concentration and Board Governance on Firm Performance
Undergraduate Research Project Page 112 of 134 Faculty of Business and Finance
Sorensen, H.T., Sabroe, S., & Olsen, J. (1998). A framework for evaluation of
secondary data sources for epidemiological research. International Journal
of Epidemiology, 25(2), 435-442.
Spencer Stuart Board Index. (2011).
Sulong, Z., & Mat Nor, F. (2010). Corporate governance mechanisms and firm
valuation in Malaysia Listed Firms: A panel data analysis. Journal of
Modern Accounting And Auditing, 6(1).
Taliyang, S. T. & Jusop, M. ( 2011). Intellectual capital disclosure and corporate
governance structure: evidence in Malaysia. International Journal of
Business and Management, 6 (12). 109-117.
Tam, O. K., & Tan, M. G. S. (2007). Ownership, governance and firm
performance in Malaysia. Corporate Governance: An International
Review, 15(2), 208-222.
The third outline perspective plan 2001-2010. Economic Planning Unit. Retrieved
from http://www.epu.gov.my/en/the-third-outline-perspective-plan-2001-
2010
Van Slyke, D. M. (2006). Agents or stewards: Using theory to understand the
government-nonprofit social service contracting relationship. Journal of
Public Administration Research and Theory, 17, 157-187.
World Bank calls Malaysia a regional leader in corporate governance, but there‟s
more to be done. (2013, March 2). The Star. Retrieved June 30, 2013,
from
http://biz.thestar.com.my/news/story.asp?file=/2013/3/2/business/127801
23
Yermack, D. (1996). Higher market valuation of companies with a small board of
directors. Journal of Financial Economics, 40, 185-211.
The Impact of Ownership Concentration and Board Governance on Firm Performance
Undergraduate Research Project Page 113 of 134 Faculty of Business and Finance
Yunos, R. M., Smith, M., & Ismail, Z. (2010). Accounting conservatism and
ownership concentration: evidence from Malaysia. Journal of Business
and Policy Recearch, 5(2), 1-15.
Zhang, X., Venus, J., & Wang, Y. (2012). Family ownership and business
expansion of small- and medium-Sized Chinese family businesses- The
mediating role of financing preference. Journal of Family Business
Strategy, 3, 97-105.
Zhuang, Z. J., Edwards, D., & Capulong, V. (2001). Corporate governance and
finance in East Asia: A S. In Manila: Asian Development Bank, 2.
Zurairi. (2013, April 12). Fears over bubble as Malaysia, ASEAN economies
churn. The Malaysian Insider. Retrieved June 21, 2013, from
http://www.themalaysianinsider.com/malaysia/article/fears-over-bubble-
as-malaysia-asean-economies-churn

The Impact of Ownership Concentration and Board Governance on Firm Performance
Undergraduate Research Project Page 114 of 134 Faculty of Business and Finance
APPENDICES
Appendix 1: List of 94 Malaysian Public Listed Property Companies during
2005 to 2010 (Model 1, 564 Obs)
1. A & M REALTY BHD
2. AMCORP PROPERTIES BHD
3. ASAS DUNIA BHD
4. ASIAN PAC HOLDINGS BHD
5. BANDAR RAYA DEVELOPMENTS BHD
6. BCB BHD
7. BERJAYA ASSETS BHD
8. BERTAM ALLIANCE BHD
9. BINAIK EQUITY BHD
10. BOLTON BHD
11. COUNTRY HEIGHTS HOLDING BHD
12. COUNTRY VIEW BERHAD
13. CRESENDO CORPORATION
14. DAIMAN DEVELOPMENT BHD
15. DAMANSARA REALITY BHD
16. DNP @ WING TAI MALAYSIA BHD
17. EASTERN & ORIENTAL BHD
18. EKRAN BHD
19. ENCORP BHD
20. EUPE CORPORATION BHD
21. FARLIM GROUP (MALAYSIA) BHD
22. FOCAL AIMS HOLDINGS BHD
23. FOUNTAIN VIEW DEVELOPMENT BHD
24. GLOBAL ORIENTAL BHD
25. GLOMAC BHD
26. GOLD BRIDGE ENGINEERING & CONSTRUCTION BHD
27. GOLDEN PLUS HOLDINGS BHD
28. GRAND HOOVER BHD

The Impact of Ownership Concentration and Board Governance on Firm Performance
Undergraduate Research Project Page 115 of 134 Faculty of Business and Finance
29. GROMUTUAL BHD
30. GUOCOLAND (MALAYSIA) BHD
31. HUA YANG BHD
32. HUNZA PROPERTIES BHD
33. I-BERHAD
34. IBRACO BHD
35. IGB CORPORATION BHD
36. IJM LAND BHD
37. IOI PROPERTIES BHD
38. JOHOR LAND BHD
39. KARAMBUNAI CORPORATION BHD
40. KELADI MAJU BHD
41. KEN HOLDINGS BHD
42. KLCC PROPERTIES HOLDINGS BHD
43. KRISSASSET HOLDINGS BHD
44. KSL HOLDINGS BHD
45. KUMPULAN HARTANAH SELANGOR BHD
46. LAND & GENERAL BHD
47. LBI CAPITAL BHD
48. LBS BINA GROUP BHD
49. LIEN HOE CORPORATION BHD
50. MAGNA PRIMA BHD
51. MAHAJAYA BHD
52. MAH SING GROUP BHD
53. MAJU PERAK HOLDINGS BHD
54. MALAYSIA PACIFIC CORPORATION BHD
55. MALTON BHD
56. MEDA INCORPORATION BHD
57. MENANG CORPORATION (M) BHD
58. MERGE HOUSING BHD
59. MK LAND HOLDINGS BHD
60. MKH BHD
61. MUI PROPERTIES BHD
62. MULPHA INTERNATIONAL BHD
The Impact of Ownership Concentration and Board Governance on Firm Performance
Undergraduate Research Project Page 116 of 134 Faculty of Business and Finance
63. MUTIARA BHD
64. NIAM HOLDINGS BHD
65. NILAI RESOURCES GROUP BHD
66. ORIENTAL INTEREST BHD
67. OSK PROPERTY HOLDINGS BHD
68. PAN MALAYSIAN INDUSTRIES BHD
69. PARAMOUNT CORPORATION BHD
70. PASDEC HOLDINGS BHD
71. PERDUREN (M) BHD
72. PETALING TIN BHD
73. PJ DEVELOPMENT HOLDINS BHD
74. PLENITUDE BHD
75. PRIME UTILITIES BHD
76. SP SETIA BHD
77. SAPURA RESOURCES BHD
78. SBC CORPORATION BHD
79. SELANGOR DREDGING BHD
80. SELANGOR PROPERTIES BHD
81. SHL CONSOLIDATED BHD
82. SOUTH MALAYSIA INDUSTRIES BHD
83. SUNRISE BHD
84. SUNWAY CITY BHD
85. TAHPS GROUP BHD
86. TANCO HOLDINGS BHD
87. TEBRAU TEGUH BHD
88. TIGER SYNERGY BHD
89. TRINITY CORPORATION
90. TROPICANA CORPORATION BHD
91. UNITED MALAYAN LAND BHD
92. Y&G CORPORATION BHD
93. YNH PROPERTY BHD
94. YTL BHD
The Impact of Ownership Concentration and Board Governance on Firm Performance
Undergraduate Research Project Page 117 of 134 Faculty of Business and Finance
Appendix 2: List of Malaysia High Ownership Concentration Public Listed
Property Companies (Model 2, 32 Obs)
1. CRESENDO CORPORATION-2005
2. CRESENDO CORPORATION-2006
3. CRESENDO CORPORATION-2008
4. CRESENDO CORPORATION-2009
5. CRESENDO CORPORATION-2010
6. GUOCOLAND (MALAYSIA) BHD-2009
7. GUOCOLAND (MALAYSIA) BHD-2010
8. IJM LAND BHD-2005
9. IJM LAND BHD-2006
10. IJM LAND BHD-2007
11. IJM LAND BHD-2008
12. IJM LAND BHD-2009
13. IJM LAND BHD-2010
14. IOI PROPERTIES BHD-2005
15. IOI PROPERTIES BHD-2006
16. IOI PROPERTIES BHD-2007
17. IOI PROPERTIES BHD-2008
18. IOI PROPERTIES BHD-2009
19. IOI PROPERTIES BHD-2010
20. JOHOR LAND BHD-2008
21. KRISSASSET HOLDINGS BHD-2005
22. KRISSASSET HOLDINGS BHD-2006
23. KRISSASSET HOLDINGS BHD-2007
24. KRISSASSET HOLDINGS BHD-2008
25. KRISSASSET HOLDINGS BHD-2009
26. KRISSASSET HOLDINGS BHD-2010
27. LIEN HOE CORPORATION BHD-2005
28. MAH SING GROUP BHD-2007
29. MULPHA INTERNATIONAL BHD-2010
30. OSK PROPERTY HOLDINGS BHD-2005
The Impact of Ownership Concentration and Board Governance on Firm Performance
Undergraduate Research Project Page 118 of 134 Faculty of Business and Finance
31. OSK PROPERTY HOLDINGS BHD-2006
32. SELANGOR PROPERTIES BHD-2010
The Impact of Ownership Concentration and Board Governance on Firm Performance
Undergraduate Research Project Page 119 of 134 Faculty of Business and Finance
Appendix 3: List of Malaysia Low Ownership Concentration Public Listed
Property Companies (Model 3, 532 Obs)
1. A&M REALTY BHD-2005
2. A&M REALTY BHD-2006
3. A&M REALTY BHD-2007
4. A&M REALTY BHD-2008
5. A&M REALTY BHD-2009
6. A&M REALTY BHD-2010
7. AMCORP PROPERTIES BHD-2005
8. AMCORP PROPERTIES BHD-2006
9. AMCORP PROPERTIES BHD-2007
10. AMCORP PROPERTIES BHD-2008
11. AMCORP PROPERTIES BHD-2009
12. AMCORP PROPERTIES BHD-2010
13. ASAS DUNIA BHD-2005
14. ASAS DUNIA BHD-2006
15. ASAS DUNIA BHD-2007
16. ASAS DUNIA BHD-2008
17. ASAS DUNIA BHD-2009
18. ASAS DUNIA BHD-2010
19. ASIAN PAC HOLDINGS BHD-2005
20. ASIAN PAC HOLDINGS BHD-2006
21. ASIAN PAC HOLDINGS BHD-2007
22. ASIAN PAC HOLDINGS BHD-2008
23. ASIAN PAC HOLDINGS BHD-2009
24. ASIAN PAC HOLDINGS BHD-2010
25. BANDAR RAYA DEVELOPMENTS BHD-2005
26. BANDAR RAYA DEVELOPMENTS BHD-2006
27. BANDAR RAYA DEVELOPMENTS BHD-2007
28. BANDAR RAYA DEVELOPMENTS BHD-2008
29. BANDAR RAYA DEVELOPMENTS BHD-2009
30. BANDAR RAYA DEVELOPMENTS BHD-2010
The Impact of Ownership Concentration and Board Governance on Firm Performance
Undergraduate Research Project Page 120 of 134 Faculty of Business and Finance
31. BCB BHD-2005
32. BCB BHD-2006
33. BCB BHD-2007
34. BCB BHD-2008
35. BCB BHD-2009
36. BCB BHD-2010
37. BERJAYA ASSETS BHD-2005
38. BERJAYA ASSETS BHD-2006
39. BERJAYA ASSETS BHD-2007
40. BERJAYA ASSETS BHD-2008
41. BERJAYA ASSETS BHD-2009
42. BERJAYA ASSETS BHD-2010
43. BERTAM ALLIANCE BHD-2005
44. BERTAM ALLIANCE BHD-2006
45. BERTAM ALLIANCE BHD-2007
46. BERTAM ALLIANCE BHD-2008
47. BERTAM ALLIANCE BHD-2009
48. BERTAM ALLIANCE BHD-2010
49. BINAIK EQUITY BHD-2005
50. BINAIK EQUITY BHD-2006
51. BINAIK EQUITY BHD-2007
52. BINAIK EQUITY BHD-2008
53. BINAIK EQUITY BHD-2009
54. BINAIK EQUITY BHD-2010
55. BOLTON BHD-2005
56. BOLTON BHD-2006
57. BOLTON BHD-2007
58. BOLTON BHD-2008
59. BOLTON BHD-2009
60. BOLTON BHD-2010
61. COUNTRY HEIGHTS HOLDING BHD-2005
62. COUNTRY HEIGHTS HOLDING BHD-2006
63. COUNTRY HEIGHTS HOLDING BHD-2007
64. COUNTRY HEIGHTS HOLDING BHD-2008
The Impact of Ownership Concentration and Board Governance on Firm Performance
Undergraduate Research Project Page 121 of 134 Faculty of Business and Finance
65. COUNTRY HEIGHTS HOLDING BHD-2009
66. COUNTRY HEIGHTS HOLDING BHD-2010
67. COUNTRY VIEW BERHAD-2005
68. COUNTRY VIEW BERHAD-2006
69. COUNTRY VIEW BERHAD-2007
70. COUNTRY VIEW BERHAD-2008
71. COUNTRY VIEW BERHAD-2009
72. COUNTRY VIEW BERHAD-2010
73. CRESENDO CORPORATION-2007
74. DAIMAN DEVELOPMENT BHD -2005
75. DAIMAN DEVELOPMENT BHD-2006
76. DAIMAN DEVELOPMENT BHD-2007
77. DAIMAN DEVELOPMENT BHD-2008
78. DAIMAN DEVELOPMENT BHD-2009
79. DAIMAN DEVELOPMENT BHD-2010
80. DAMANSARA REALITY BHD-2005
81. DAMANSARA REALITY BHD-2006
82. DAMANSARA REALITY BHD-2007
83. DAMANSARA REALITY BHD-2008
84. DAMANSARA REALITY BHD-2009
85. DAMANSARA REALITY BHD-2010
86. DNP @ WING TAI MALAYSIA BHD-2005
87. DNP @ WING TAI MALAYSIA BHD-2006
88. DNP @ WING TAI MALAYSIA BHD-2007
89. DNP @ WING TAI MALAYSIA BHD-2008
90. DNP @ WING TAI MALAYSIA BHD-2009
91. DNP @ WING TAI MALAYSIA BHD-2010
92. EASTERN & ORIENTAL BHD-2005
93. EASTERN & ORIENTAL BHD-2006
94. EASTERN & ORIENTAL BHD-2007
95. EASTERN & ORIENTAL BHD-2008
96. EASTERN & ORIENTAL BHD-2009
97. EASTERN & ORIENTAL BHD-2010
98. EKRAN BHD-2005

The Impact of Ownership Concentration and Board Governance on Firm Performance
Undergraduate Research Project Page 122 of 134 Faculty of Business and Finance
99. EKRAN BHD-2006
100. EKRAN BHD-2007
101. EKRAN BHD-2008
102. EKRAN BHD-2009
103. EKRAN BHD-2010
104. ENCORP BHD-2005
105. ENCORP BHD-2006
106. ENCORP BHD-2007
107. ENCORP BHD-2008
108. ENCORP BHD-2009
109. ENCORP BHD-2010
110. EUPE CORPORATION BHD-2005
111. EUPE CORPORATION BHD-2006
112. EUPE CORPORATION BHD-2007
113. EUPE CORPORATION BHD-2008
114. EUPE CORPORATION BHD-2009
115. EUPE CORPORATION BHD-2010
116. FARLIM GROUP (MALAYSIA) BHD-2005
117. FARLIM GROUP (MALAYSIA) BHD-2006
118. FARLIM GROUP (MALAYSIA) BHD-2007
119. FARLIM GROUP (MALAYSIA) BHD-2008
120. FARLIM GROUP (MALAYSIA) BHD-2009
121. FARLIM GROUP (MALAYSIA) BHD-2010
122. FOCAL AIMS HOLDINGS BHD-2005
123. FOCAL AIMS HOLDINGS BHD-2006
124. FOCAL AIMS HOLDINGS BHD-2007
125. FOCAL AIMS HOLDINGS BHD-2008
126. FOCAL AIMS HOLDINGS BHD-2009
127. FOCAL AIMS HOLDINGS BHD-2010
128. FOUNTAIN VIEW DEVELOPMENT BHD-2005
129. FOUNTAIN VIEW DEVELOPMENT BHD-2006
130. FOUNTAIN VIEW DEVELOPMENT BHD-2007
131. FOUNTAIN VIEW DEVELOPMENT BHD-2008
132. FOUNTAIN VIEW DEVELOPMENT BHD-2009

The Impact of Ownership Concentration and Board Governance on Firm Performance
Undergraduate Research Project Page 123 of 134 Faculty of Business and Finance
133. FOUNTAIN VIEW DEVELOPMENT BHD-2010
134. GLOBAL ORIENTAL BHD-2005
135. GLOBAL ORIENTAL BHD-2006
136. GLOBAL ORIENTAL BHD-2007
137. GLOBAL ORIENTAL BHD-2008
138. GLOBAL ORIENTAL BHD-2009
139. GLOBAL ORIENTAL BHD-2010
140. GLOMAC BHD-2005
141. GLOMAC BHD-2006
142. GLOMAC BHD-2007
143. GLOMAC BHD-2008
144. GLOMAC BHD-2009
145. GLOMAC BHD-2010
146. GOLD BRIDGE ENGINEERING & CONSTRUCTION BHD-2005
147. GOLD BRIDGE ENGINEERING & CONSTRUCTION BHD-2006
148. GOLD BRIDGE ENGINEERING & CONSTRUCTION BHD-2007
149. GOLD BRIDGE ENGINEERING & CONSTRUCTION BHD-2008
150. GOLD BRIDGE ENGINEERING & CONSTRUCTION BHD-2009
151. GOLD BRIDGE ENGINEERING & CONSTRUCTION BHD-2010
152. GOLDEN PLUS HOLDINGS BHD-2005
153. GOLDEN PLUS HOLDINGS BHD-2006
154. GOLDEN PLUS HOLDINGS BHD-2007
155. GOLDEN PLUS HOLDINGS BHD-2008
156. GOLDEN PLUS HOLDINGS BHD-2009
157. GOLDEN PLUS HOLDINGS BHD-2010
158. GRAND HOOVER BHD-2005
159. GRAND HOOVER BHD-2006
160. GRAND HOOVER BHD-2007
161. GRAND HOOVER BHD-2008
162. GRAND HOOVER BHD-2009
163. GRAND HOOVER BHD-2010
164. GROMUTUAL BHD-2005
165. GROMUTUAL BHD-2006
166. GROMUTUAL BHD-2007
The Impact of Ownership Concentration and Board Governance on Firm Performance
Undergraduate Research Project Page 124 of 134 Faculty of Business and Finance
167. GROMUTUAL BHD-2008
168. GROMUTUAL BHD-2009
169. GROMUTUAL BHD-2010
170. GUOCOLAND (MALAYSIA) BHD-2005
171. GUOCOLAND (MALAYSIA) BHD-2006
172. GUOCOLAND (MALAYSIA) BHD-2007
173. GUOCOLAND (MALAYSIA) BHD-2008
174. HUA YANG BHD-2005
175. HUA YANG BHd-2006
176. HUA YANG BHD-2007
177. HUA YANG BHD-2008
178. HUA YANG BHD-2009
179. HUA YANG BHD-2010
180. HUNZA PROPERTIES BHD-2005
181. HUNZA PROPERTIES BHD-2006
182. HUNZA PROPERTIES BHD-2007
183. HUNZA PROPERTIES BHD-2008
184. HUNZA PROPERTIES BHD-2009
185. HUNZA PROPERTIES BHD-2010
186. I-BERHAD-2005
187. I-BERHAD-2006
188. I-BERHAD-2007
189. I-BERHAD-2008
190. I-BERHAD-2009
191. I-BERHAD-2010
192. IBRACO BHD-2005
193. IBRACO BHD-2006
194. IBRACO BHD-2007
195. IBRACO BHD-2008
196. IBRACO BHD-2009
197. IBRACO BHD-2010
198. IGB CORPORATION BHD-2005
199. IGB CORPORATION BHD-2006
200. IGB CORPORATION BHD-2007

The Impact of Ownership Concentration and Board Governance on Firm Performance
Undergraduate Research Project Page 125 of 134 Faculty of Business and Finance
201. IGB CORPORATION BHD-2008
202. IGB CORPORATION BHD-2009
203. IGB CORPORATION BHD-2010
204. JOHOR LAND BHD-2005
205. JOHOR LAND BHD-2006
206. JOHOR LAND BHD-2007
207. JOHOR LAND BHD-2009
208. JOHOR LAND BHD-2010
209. KARAMBUNAI CORPORATION BHD-2005
210. KARAMBUNAI CORPORATION BHD-2006
211. KARAMBUNAI CORPORATION BHD-2007
212. KARAMBUNAI CORPORATION BHD-2008
213. KARAMBUNAI CORPORATION BHD-2009
214. KARAMBUNAI CORPORATION BHD-2010
215. KELADI MAJU BHD-2005
216. KELADI MAJU BHD-2006
217. KELADI MAJU BHD-2007
218. KELADI MAJU BHD-2008
219. KELADI MAJU BHD-2009
220. KELADI MAJU BHD-2010
221. KEN HOLDINGS BHD-2005
222. KEN HOLDINGS BHD-2006
223. KEN HOLDINGS BHD-2007
224. KEN HOLDINGS BHD-2008
225. KEN HOLDINGS BHD-2009
226. KEN HOLDINGS BHD-2010
227. KLCC PROPERTIES HOLDINGS BHD-2005
228. KLCC PROPERTIES HOLDINGS BHD-2006
229. KLCC PROPERTIES HOLDINGS BHD-2007
230. KLCC PROPERTIES HOLDINGS BHD-2008
231. KLCC PROPERTIES HOLDINGS BHD-2009
232. KLCC PROPERTIES HOLDINGS BHD-2010
233. KSL HOLDINGS BHD-2005
234. KSL HOLDINGS BHD-2006

The Impact of Ownership Concentration and Board Governance on Firm Performance
Undergraduate Research Project Page 126 of 134 Faculty of Business and Finance
235. KSL HOLDINGS BHD-2007
236. KSL HOLDINGS BHD-2008
237. KSL HOLDINGS BHD-2009
238. KSL HOLDINGS BHD-2010
239. KUMPULAN HARTANAH SELANGOR BHD-2005
240. KUMPULAN HARTANAH SELANGOR BHD-2006
241. KUMPULAN HARTANAH SELANGOR BHD-2007
242. KUMPULAN HARTANAH SELANGOR BHD-2008
243. KUMPULAN HARTANAH SELANGOR BHD-2009
244. KUMPULAN HARTANAH SELANGOR BHD-2010
245. LAND & GENERAL BHD-2005
246. LAND & GENERAL BHD-2006
247. LAND & GENERAL BHD-2007
248. LAND & GENERAL BHD-2008
249. LAND & GENERAL BHD-2009
250. LAND & GENERAL BHD-2010
251. LBI CAPITAL BHD-2005
252. LBI CAPITAL BHD-2006
253. LBI CAPITAL BHD-2007
254. LBI CAPITAL BHD-2008
255. LBI CAPITAL BHD-2009
256. LBI CAPITAL BHD-2010
257. LBS BINA GROUP BHD-2005
258. LBS BINA GROUP BHD-2006
259. LBS BINA GROUP BHD-2007
260. LBS BINA GROUP BHD-2008
261. LBS BINA GROUP BHD-2009
262. LBS BINA GROUP BHD-2010
263. LIEN HOE CORPORATION BHD-2006
264. LIEN HOE CORPORATION BHD-2007
265. LIEN HOE CORPORATION BHD-2008
266. LIEN HOE CORPORATION BHD-2009
267. LIEN HOE CORPORATION BHD-2010
268. MAGNA PRIMA BHD-2005

The Impact of Ownership Concentration and Board Governance on Firm Performance
Undergraduate Research Project Page 127 of 134 Faculty of Business and Finance
269. MAGNA PRIMA BHD-2006
270. MAGNA PRIMA BHD-2007
271. MAGNA PRIMA BHD-2008
272. MAGNA PRIMA BHD-2009
273. MAGNA PRIMA BHD-2010
274. MAH SING GROUP BHD-2005
275. MAH SING GROUP BHD-2006
276. MAH SING GROUP BHD-2008
277. MAH SING GROUP BHD-2009
278. MAH SING GROUP BHD-2010
279. MAHAJAYA BHD-2005
280. MAHAJAYA BHD-2006
281. MAHAJAYA BHD-2007
282. MAHAJAYA BHD-2008
283. MAHAJAYA BHD-2009
284. MAHAJAYA BHD-2010
285. MAJU PERAK HOLDINGS BHD-2005
286. MAJU PERAK HOLDINGS BHD-2006
287. MAJU PERAK HOLDINGS BHD-2007
288. MAJU PERAK HOLDINGS BHD-2008
289. MAJU PERAK HOLDINGS BHD-2009
290. MAJU PERAK HOLDINGS BHD-2010
291. MALAYSIA PACIFIC CORPORATION BHD-2005
292. MALAYSIA PACIFIC CORPORATION BHD-2006
293. MALAYSIA PACIFIC CORPORATION BHD-2007
294. MALAYSIA PACIFIC CORPORATION BHD-2008
295. MALAYSIA PACIFIC CORPORATION BHD-2009
296. MALAYSIA PACIFIC CORPORATION BHD-2010
297. MALTON BHD-2005
298. MALTON BHD-2006
299. MALTON BHD-2007
300. MALTON BHD-2008
301. MALTON BHD-2009
302. MALTON BHD-2010

The Impact of Ownership Concentration and Board Governance on Firm Performance
Undergraduate Research Project Page 128 of 134 Faculty of Business and Finance
303. MEDA INCORPORATION BHD-2005
304. MEDA INCORPORATION BHD-2006
305. MEDA INCORPORATION BHD-2007
306. MEDA INCORPORATION BHD-2008
307. MEDA INCORPORATION BHD-2009
308. MEDA INCORPORATION BHD-2010
309. MENANG CORPORATION (M) BHD-2005
310. MENANG CORPORATION (M) BHD-2006
311. MENANG CORPORATION (M) BHD-2007
312. MENANG CORPORATION (M) BHD-2008
313. MENANG CORPORATION (M) BHD-2009
314. MENANG CORPORATION (M) BHD-2010
315. MERGE HOUSING BHD-2005
316. MERGE HOUSING BHD-2006
317. MERGE HOUSING BHD-2007
318. MERGE HOUSING BHD-2008
319. MERGE HOUSING BHD-2009
320. MERGE HOUSING BHD-2010
321. MK LAND HOLDINGS BHD-2005
322. MK LAND HOLDINGS BHD-2006
323. MK LAND HOLDINGS BHD-2007
324. MK LAND HOLDINGS BHD-2008
325. MK LAND HOLDINGS BHD-2009
326. MK LAND HOLDINGS BHD-2010
327. MKH BHD-2005
328. MKH BHD-2006
329. MKH BHD-2007
330. MKH BHD-2008
331. MKH BHD-2009
332. MKH BHD-2010
333. MUI PROPERTIES BHD-2005
334. MUI PROPERTIES BHD-2006
335. MUI PROPERTIES BHD-2007
336. MUI PROPERTIES BHD-2008

The Impact of Ownership Concentration and Board Governance on Firm Performance
Undergraduate Research Project Page 129 of 134 Faculty of Business and Finance
337. MUI PROPERTIES BHD-2009
338. MUI PROPERTIES BHD-2010
339. MULPHA INTERNATIONAL BHD-2005
340. MULPHA INTERNATIONAL BHD-2006
341. MULPHA INTERNATIONAL BHD-2007
342. MULPHA INTERNATIONAL BHD-2008
343. MULPHA INTERNATIONAL BHD-2009
344. MUTIARA BHD-2005
345. MUTIARA BHD-2006
346. MUTIARA BHD-2007
347. MUTIARA BHD-2008
348. MUTIARA BHD-2009
349. MUTIARA BHD-2010
350. NIAM HOLDINGS BHD-2005
351. NIAM HOLDINGS BHD-2006
352. NIAM HOLDINGS BHD-2007
353. NIAM HOLDINGS BHD-2008
354. NIAM HOLDINGS BHD-2009
355. NIAM HOLDINGS BHD-2010
356. NILAI RESOURCES GROUP BHD-2005
357. NILAI RESOURCES GROUP BHD-2006
358. NILAI RESOURCES GROUP BHD-2007
359. NILAI RESOURCES GROUP BHD-2008
360. NILAI RESOURCES GROUP BHD-2009
361. NILAI RESOURCES GROUP BHD-2010
362. ORIENTAL INTEREST BHD-2005
363. ORIENTAL INTEREST BHD-2006
364. ORIENTAL INTEREST BHD-2007
365. ORIENTAL INTEREST BHD-2008
366. ORIENTAL INTEREST BHD-2009
367. ORIENTAL INTEREST BHD-2010
368. OSK PROPERTY HOLDINGS BHD-2007
369. OSK PROPERTY HOLDINGS BHD-2008
370. OSK PROPERTY HOLDINGS BHD-2009
The Impact of Ownership Concentration and Board Governance on Firm Performance
Undergraduate Research Project Page 130 of 134 Faculty of Business and Finance
371. OSK PROPERTY HOLDINGS BHD-2010
372. PAN MALAYSIAN INDUSTRIES BHD-2005
373. PAN MALAYSIAN INDUSTRIES BHD-2006
374. PAN MALAYSIAN INDUSTRIES BHD-2007
375. PAN MALAYSIAN INDUSTRIES BHD-2008
376. PAN MALAYSIAN INDUSTRIES BHD-2009
377. PAN MALAYSIAN INDUSTRIES BHD-2010
378. PARAMOUNT CORPORATION BHD-2005
379. PARAMOUNT CORPORATION BHD-2006
380. PARAMOUNT CORPORATION BHD-2007
381. PARAMOUNT CORPORATION BHD-2008
382. PARAMOUNT CORPORATION BHD-2009
383. PARAMOUNT CORPORATION BHD-2010
384. PASDEC HOLDINGS BHD-2005
385. PASDEC HOLDINGS BHD-2006
386. PASDEC HOLDINGS BHD-2007
387. PASDEC HOLDINGS BHD-2008
388. PASDEC HOLDINGS BHD-2009
389. PASDEC HOLDINGS BHD-2010
390. PERDUREN (M) BHD-2005
391. PERDUREN (M) BHD-2006
392. PERDUREN (M) BHD-2007
393. PERDUREN (M) BHD-2008
394. PERDUREN (M) BHD-2009
395. PERDUREN (M) BHD-2010
396. PETALING TIN BHD-2005
397. PETALING TIN BHD-2006
398. PETALING TIN BHD-2007
399. PETALING TIN BHD-2008
400. PETALING TIN BHD-2009
401. PETALING TIN BHD-2010
402. PJ DEVELOPMENT HOLDINS BHD-2005
403. PJ DEVELOPMENT HOLDINS BHD-2006
404. PJ DEVELOPMENT HOLDINS BHD-2007
The Impact of Ownership Concentration and Board Governance on Firm Performance
Undergraduate Research Project Page 131 of 134 Faculty of Business and Finance
405. PJ DEVELOPMENT HOLDINS BHD-2008
406. PJ DEVELOPMENT HOLDINS BHD-2009
407. PJ DEVELOPMENT HOLDINS BHD-2010
408. PLENITUDE BHD-2005
409. PLENITUDE BHD-2006
410. PLENITUDE BHD-2007
411. PLENITUDE BHD-2008
412. PLENITUDE BHD-2009
413. PLENITUDE BHD-2010
414. PRIME UTILITIES BHD-2005
415. PRIME UTILITIES BHD-2006
416. PRIME UTILITIES BHD-2007
417. PRIME UTILITIES BHD-2008
418. PRIME UTILITIES BHD-2009
419. PRIME UTILITIES BHD-2010
420. SAPURA RESOURCES BHD-2005
421. SAPURA RESOURCES BHD-2006
422. SAPURA RESOURCES BHD-2007
423. SAPURA RESOURCES BHD-2008
424. SAPURA RESOURCES BHD-2009
425. SAPURA RESOURCES BHD-2010
426. SBC CORPORATION BHD-2005
427. SBC CORPORATION BHD-2006
428. SBC CORPORATION BHD-2007
429. SBC CORPORATION BHD-2008
430. SBC CORPORATION BHD-2009
431. SBC CORPORATION BHD-2010
432. SELANGOR DREDGING BHD-2005
433. SELANGOR DREDGING BHD-2006
434. SELANGOR DREDGING BHD-2007
435. SELANGOR DREDGING BHD-2008
436. SELANGOR DREDGING BHD-2009
437. SELANGOR DREDGING BHD-2010
438. SELANGOR PROPERTIES BHD-2005
The Impact of Ownership Concentration and Board Governance on Firm Performance
Undergraduate Research Project Page 132 of 134 Faculty of Business and Finance
439. SELANGOR PROPERTIES BHD-2006
440. SELANGOR PROPERTIES BHD-2007
441. SELANGOR PROPERTIES BHD-2008
442. SELANGOR PROPERTIES BHD-2009
443. SHL CONSOLIDATED BHD-2005
444. SHL CONSOLIDATED BHD-2006
445. SHL CONSOLIDATED BHD-2007
446. SHL CONSOLIDATED BHD-2008
447. SHL CONSOLIDATED BHD-2009
448. SHL CONSOLIDATED BHD-2010
449. SOUTH MALAYSIA INDUSTRIES BHD-2005
450. SOUTH MALAYSIA INDUSTRIES BHD-2006
451. SOUTH MALAYSIA INDUSTRIES BHD-2007
452. SOUTH MALAYSIA INDUSTRIES BHD-2008
453. SOUTH MALAYSIA INDUSTRIES BHD-2009
454. SOUTH MALAYSIA INDUSTRIES BHD-2010
455. SP SETIA BHD-2005
456. SP SETIA BHD-2006
457. SP SETIA BHD-2007
458. SP SETIA BHD-2008
459. SP SETIA BHD-2009
460. SP SETIA BHD-2010
461. SUNRISE BHD-2005
462. SUNRISE BHD-2006
463. SUNRISE BHD-2007
464. SUNRISE BHD-2008
465. SUNRISE BHD-2009
466. SUNRISE BHD-2010
467. SUNWAY CITY BHD-2005
468. SUNWAY CITY BHD-2006
469. SUNWAY CITY BHD-2007
470. SUNWAY CITY BHD-2008
471. SUNWAY CITY BHD-2009
472. SUNWAY CITY BHD-2010

The Impact of Ownership Concentration and Board Governance on Firm Performance
Undergraduate Research Project Page 133 of 134 Faculty of Business and Finance
473. TAHPS GROUP BHD-2005
474. TAHPS GROUP BHD-2006
475. TAHPS GROUP BHD-2007
476. TAHPS GROUP BHD-2008
477. TAHPS GROUP BHD-2009
478. TAHPS GROUP BHD-2010
479. TANCO HOLDINGS BHD-2005
480. TANCO HOLDINGS BHD-2006
481. TANCO HOLDINGS BHD-2007
482. TANCO HOLDINGS BHD-2008
483. TANCO HOLDINGS BHD-2009
484. TANCO HOLDINGS BHD-2010
485. TEBRAU TEGUH BHD-2005
486. TEBRAU TEGUH BHD-2006
487. TEBRAU TEGUH BHD-2007
488. TEBRAU TEGUH BHD-2008
489. TEBRAU TEGUH BHD-2009
490. TEBRAU TEGUH BHD-2010
491. TIGER SYNERGY BHD-2005
492. TIGER SYNERGY BHD-2006
493. TIGER SYNERGY BHD-2007
494. TIGER SYNERGY BHD-2008
495. TIGER SYNERGY BHD-2009
496. TIGER SYNERGY BHD-2010
497. TRINITY CORPORATION-2005
498. TRINITY CORPORATION-2006
499. TRINITY CORPORATION-2007
500. TRINITY CORPORATION-2008
501. TRINITY CORPORATION-2009
502. TRINITY CORPORATION-2010
503. TROPICANA CORPORATION BHD-2005
504. TROPICANA CORPORATION BHD-2006
505. TROPICANA CORPORATION BHD-2007
506. TROPICANA CORPORATION BHD-2008
The Impact of Ownership Concentration and Board Governance on Firm Performance
Undergraduate Research Project Page 134 of 134 Faculty of Business and Finance
507. TROPICANA CORPORATION BHD-2009
508. TROPICANA CORPORATION BHD-2010
509. UNITED MALAYAN LAND BHD-2005
510. UNITED MALAYAN LAND BHD-2006
511. UNITED MALAYAN LAND BHD-2007
512. UNITED MALAYAN LAND BHD-2008
513. UNITED MALAYAN LAND BHD-2009
514. UNITED MALAYAN LAND BHD-2010
515. Y&G CORPORATION BHD-2005
516. Y&G CORPORATION BHD-2006
517. Y&G CORPORATION BHD-2007
518. Y&G CORPORATION BHD-2008
519. Y&G CORPORATION BHD-2009
520. Y&G CORPORATION BHD-2010
521. YNH PROPERTY BHD-2005
522. YNH PROPERTY BHD-2006
523. YNH PROPERTY BHD-2007
524. YNH PROPERTY BHD-2008
525. YNH PROPERTY BHD-2009
526. YNH PROPERTY BHD-2010
527. YTL BHD-2005
528. YTL BHD-2006
529. YTL BHD-2007
530. YTL BHD-2008
531. YTL BHD-2009
532. YTL BHD-2010