Overview Small Product Tankers
31
Sector Overview Teddy H Tsai – Head of Research, Pacific Transport August 7, 2008 Opportunities in the small product tanker market
-
date post
18-Oct-2014 -
Category
Business
-
view
2.029 -
download
8
description
Transcript of Overview Small Product Tankers

Sector Overview
Teddy H Tsai – Head of Research, Pacific Transport
August 7, 2008
Opportunities in the small product tanker market

2
Investment View
Investment drivers Fundamental change in regulations – double-hull / double-bottom requirements
Demand fundamentals remains strong – oil majors requires high quality vessels that local owners are not able to provide, many newbuilding are sub-standard and the fleet is aging (23% of the existing fleet is already over 25 years of age).
Favorable supply side dynamics – orderbook is 29% of the current tanker fleet for the targeted size range
In-House Commercial Management Team We will hire 2 commercial managers from top-tier shipping companies such as Stolt-
Nielsen or Eitzen. We are actively looking for personnel and believe there are appropriate candidates available in the market.
We will partner with a technical manager, such as Anglo-Eastern Ship Management, than already actively works will all oil majors. The high quality of such external technical managers will assure vessels are of the quality required by oil majors.
3
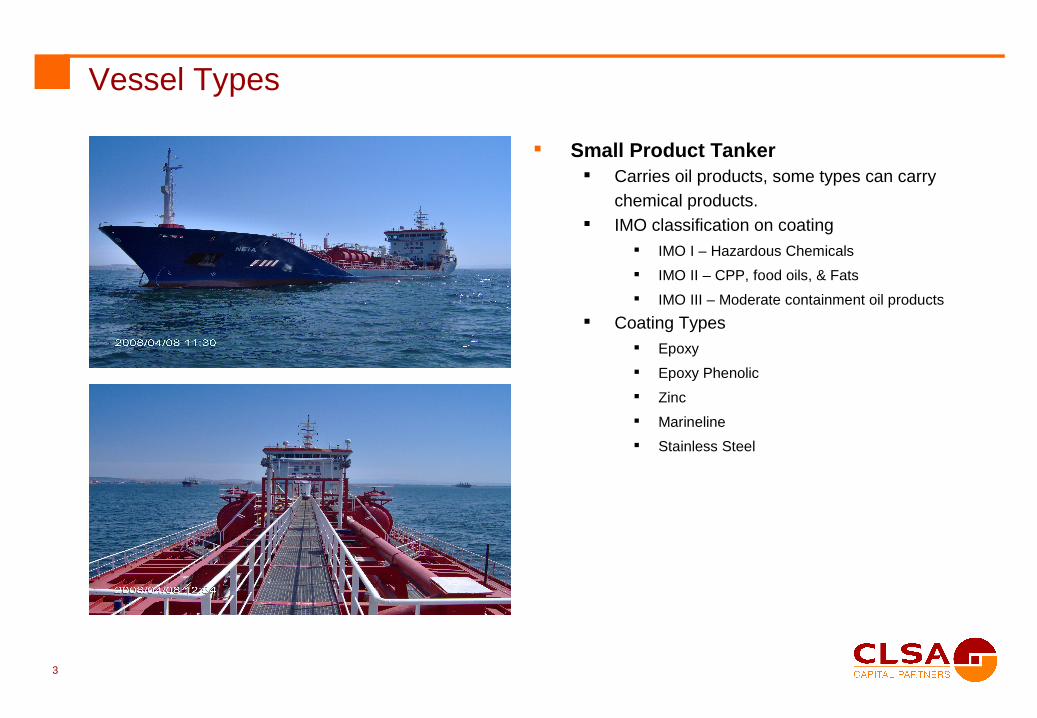
Vessel Types
Small Product Tanker Carries oil products, some types can carry
chemical products. IMO classification on coating
IMO I – Hazardous Chemicals
IMO II – CPP, food oils, & Fats
IMO III – Moderate containment oil products
Coating Types Epoxy
Epoxy Phenolic
Zinc
Marineline
Stainless Steel
4
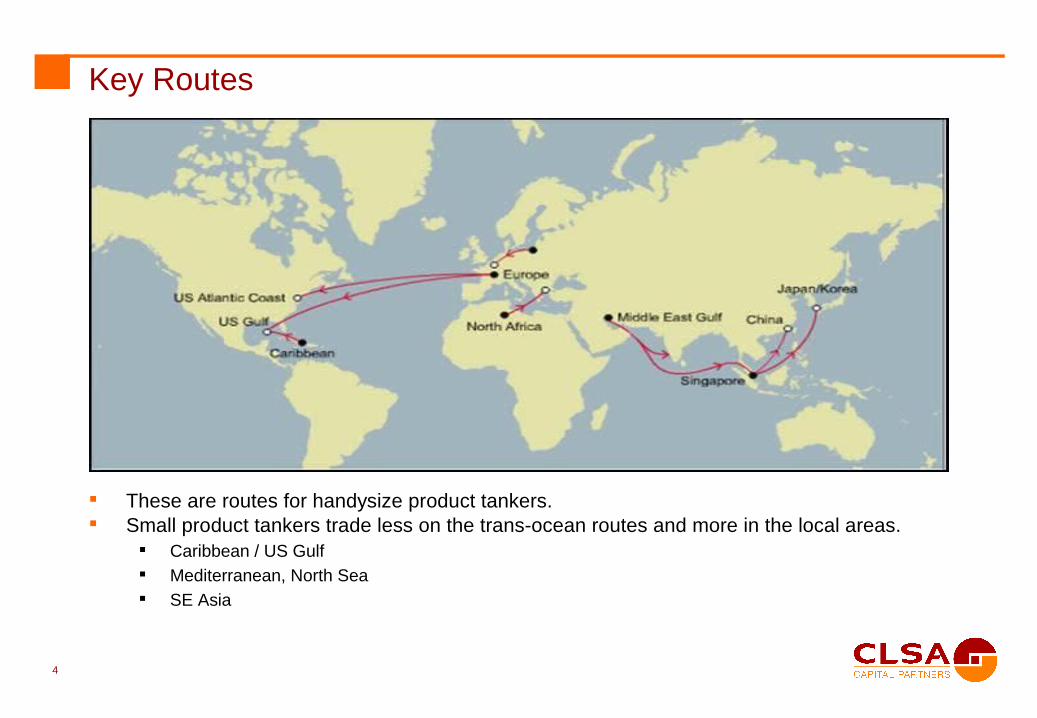
Key Routes
These are routes for handysize product tankers. Small product tankers trade less on the trans-ocean routes and more in the local areas.
Caribbean / US Gulf Mediterranean, North Sea SE Asia

5
Key Specifications
Market Opportunity by Region We envision areas of opportunity includes regional trade in the Caribbean,
Mediterranean, and most importantly, the Asia Pacific.
Technical Specifications This project will target the oil products shipping demand for oil majors, globally. To service this market, we would require IMO II type vessels, with Epoxy coating or
better, but not to the extent of stainless steel coating (which is mostly used for the chemical trades).
We are looking for assets that are at the higher-end of the quality spectrum, mostly built in Turkey and Japan.
Major Products Carried We expect many types of oil products to be carried, ranging from bunker, gasoline,
diesel, kerosene, fuel oils, lubricating oils, asphalt, bitumen, etc. Also fats and vegetable oils such as palm oil, tallow, etc. For selected vessels with higher specification coating, we may be able to carry naphtha
and other chemical products.

Market Indicators

7
Benchmark Freight Rates
Time charter contracts in excess of US$10,000 / day in 2007 Most recent transactions are 1-2 year time charter contracts Current market rates are approximately US$1.2-1.3/dwt/day in Asia for 1-2 year time charters. We aim to achieve acquisitions of ~US$15-25million per vessel, and day rates of
~US$8000/day.

8
Recent Sale TransactionsDate Name dwt Yr Built Hull Country Engine IMO Type US$mn Owner CountryJan-08 Nepline I 7000 07 Zhejiang Yanmar 17.5Jan-08 Vemaoil VIII 4999 83 Hakata MaK 5Jan-08 Belogorsk 3086 88 Finland Risskiy 3.4Jan-08 Nittan Maru No 4999 89 Naikai B&W 4.2 Indonesian Jan-08 Svodobnyy 3086 89 Finland Risskiy 3.4Jan-08 Sky Ace 8765 97 Usuki Mitsubishi 17 Korean Feb-08 Fair Astro 5100 78 Minami Makita IMO II/III Feb-08 Jikor 6704 84 Taihei Mitsubishi IMO III 2.6 Nigerian Feb-08 Vinga Helena 6400 85 W Germany MaK IMO II/III TurkishFeb-08 Arabian Sun 4574 90 Atlantis Mir+G282rlees Feb-08 Marianne Theresa 3232 91 Denmark MaK IMO II German Mar-08 Oana 6400 08 Zhenjiang Sopo . IMOMar-08 Astor 2542 81 W Germany MaK IMO II Mar-08 Katabami Maru 5698 88 Iwagi Akashi dbl btm 4.2 UAE Mar-08 Hafetzah 6500 91 Malaysia Mirrlees IMO II 3.1 Nigerian Mar-08 Jian She 32 9927 94 Daedong B&W dbl btm 8.9Mar-08 Jian She 31 9927 94 Daedong B&W dbl btm 8.9Apr-08 Samho Ibis 3423 05 Samho Hanshin 12Apr-08 Sol Lueshing 4040 81 W Germany MaK IMO IIIApr-08 Jian She 31 9927 94 S Korea B&W 8.9 Greek Apr-08 Jian She 32 9927 94 S Korea B&W 8.9 Greek Apr-08 Neptra Premier 6537 94 Atlantis . IMO III Nigerian Apr-08 Meridian Mira 5877 94 Malaysia Wartsila coated . 4.6 Nigerian Apr-08 FS Victoria 3740 99 S Korea Alpha IMO III Russian
May-08 Keilir 6019 02 Jiangnan Alpha dbl btm 14 SwedishMay-08 Maria Erika 5879 83 Higaki Akasaka dbl btm Nigerian May-08 Oram Bricks 7111 88 Kurinoura Mitsubishi IMO II/III 5May-08 Osco Tiger 5261 92 Japan Hanshin 10.6May-08 Carbon Tiger 5261 92 Kumanoto . dbl hull 10.6Jun-08 Trust Honor 7087 85 Higaki . IMO IIIJun-08 Woo Lim 8710 96 Usuki Mitsubishi 13.8 Vietnamese Jun-08 Bow Bahia 5846 96 Portugal B&W 15 NorwegianJun-08 Multitank Bolognia 5846 97 Portugal B&W 15 Norwegian

9
Recent Ships on OfferDate Nam e DWT Year Built
Country Built Class Draft LOA Beam Hull type IMO Spec Coating Engine Cargos
Seller's Price (m n USD)
5-Jun-08 Resale 8,500 dw t IMo 2 Chemical Tanker 8,500 Aug-08 Japan DH IMO II Epoxy/ ML Oil/Chem 22.026-Jun-08 8,700 dw t Oil / Chemical Tanker x 2 units Resale 8,700 Oct-08 Korea DH Epoxy Oil/Chem 21.526-Jun-08 8,700 dw t Oil / Chemical Tanker x 2 units Resale 8,700 Jul-09 Korea DH Epoxy Oil/Chem 21.58-Jul-08 MV SJ ACE 5,000 delv Oct 2008 China CCS 6.0 101.9 16.0 DH Heavy Oil 10.258-Jul-08 SMALL ASPHALT TANKER RESALE 3,500 Resale Japan Asphalt 23.58-Jul-08 MT. NING HUA 406 3,335 Aug-93 Korea CCS 5.8 81.9 14.0 DB PHENGUARD MAN Oil/Chem TBD8-Jul-08 MT. NING HUA 416 3,328 Aug-96 Korea CCS 5.3 85.3 14.0 DB PHENGUARD MAN Oil/Chem TBD9-Jul-08 MT FENG HAI YOU 3 6,412 2008 China CCS 6.9 113.1 15.7 DH Epoxy China CPP, Bunker high 9's9-Jul-08 Bitumen Tanker Resale 6,000 end of 2008 China CCS 6.5 106.8 17.6 Yanmar Bitumen, PP 19.59-Jul-08 2x Bitumen Tanker Resale 6,000 2H 2009 China CCS 6.5 106.8 17.6 Yanmar Bitumen, PP 18.59-Jul-08 NB RESALE 7,800 DWT OIL/CHEM TANKER IMO 2 7,800 delv Aug 2008 China BV 6.9 122.7 17.2 DB/DS IMO II Marineline MAK Oil/Chem TBD9-Jul-08 NB 10,600 DWT D/H OIL TANKER FOR SALE 10,600 delv Jul/Aug 2008 China 8.3 123.0 19.4 DH B&W Oil TBD9-Jul-08 PROD TANKER FR SALE 7,000 Delv Jun 2009 China BV 6.6 118.0 17.6 Yanmar Oil TBD9-Jul-08 PROD TANKER FR SALE 7,000 delv Sep/Oct 2008 China BV 6.6 118.0 17.6 DH Epoxy Yanmar Oil TBD10-Jul-08 MODERN 3.6K CHEM/CPP TANKERS 3,600 modern CPP, Bunker TBD10-Jul-08 M/T FALCON 2,076 MTDW BLT 94 DB HULL 2,076 Nov-94 Korea RINA 4.9 78.5 12.0 DH IMO II Phenolic Epoxy AKASAKA Oil/Chem TBD
10-Jul-082 X 14,000 DWT IMO II RESALES SHALLOW DRAFT 14,000
delv nov-2008, dec 2008 China 7.8 146.0 22.0 DH IMO II Phenolic Epoxy B&W Oil/Chem 27
10-Jul-08 20K STAINLESS STEEL TANKER 20,000 2004 Japan NK 9.6 144.0 24.2 DH IMO III Stainless Steel Oil/Chem 4111-Jul-08 5.5K CHEM TANKER SUNNY KITTY BLT 05 5,555 Nov-05 Korea NK 6.5 101.0 16.0 DH IMO II/III Pure epoxy T-800 Oil/Chem TBD14-Jul-08 MT Chem Rigel - st/st tanker for sale 4,065 1998 Japan NK 5.9 97.4 14.0 DH IMO II/III Stainless Steel B&W Oil/Chem 12.514-Jul-08 "Dumlupinar" - modern chemical tanker 11,258 delv 3Q08 Turkey BV 7.9 129.5 19.8 DH Marineline MAN Oil/Chem TBD14-Jul-08 6,400dw t Product/Chemical IMO II tanker 6,450 delv Aug 2008 China BV 6.5 103.0 16.0 DH IMO II Epoxy Yanmar Oil/Chem 1314-Jul-08 4999dw t New building asphalt Carrier for sale 4,999 delv Aug 2008 China CCS 8.0 101.9 16.0 Guangzhou Bitumen, PP TBD15-Jul-08 5.6K IMO II RESALE DELY SEPT 08 5,600 Delv Sept 2008 Korea KRS 6.0 98.1 16.6 DH IMO II Phenolic Epoxy MAK Oil/Chem 15.516-Jul-08 2X 5,600 DWT CHEMICAL IMO2 TANKER 5,600 end of 2008 Korea KRS 8.6 105.6 16.6 DH IMO II Phenolic Epoxy MAK Oil/Chem 17.516-Jul-08 NB 10,600 DWT D/H OIL TANKER FOR SALE 10,600 Jul/aug 2008 China 8.3 123.0 19.4 DH B&W Oil TBD16-Jul-08 REDUCED PRICE-7K CHEMICAL RESALE 7,000 Jun-09 China 6.6 118.0 17.6 Yanmar Oil/Chem 13.517-Jul-08 Chinese High Spec Product Tanker 6,200 Sep-08 China BV 6.5 102.7 17.8 DH Epoxy Himsen Oil 16.517-Jul-08 Chinese High Spec Product Tanker 6,200 Nov-08 China BV 6.5 102.7 17.8 DH Epoxy Himsen Oil 16.517-Jul-08 Chinese High Spec Product Tanker 6,200 Jan-09 China BV 6.5 102.7 17.8 DH Epoxy Himsen Oil 16.517-Jul-08 TBN STAINLESS STEEL SMALL TANKERS 4,065 1998 Japan NK 5.9 97.4 14.8 DH IMO II/III Stainless Steel B&W Oil/Chem TBD17-Jul-08 TBN STAINLESS STEEL SMALL TANKERS 4,994 1996 Singapore GL 6.4 97.0 16.0 DB IMO II/III Stainless Steel B&W Oil/Chem TBD17-Jul-08 5.6K Chemical/IMO II New building Resale 5,600 Delv Sept 2008 Korea KRS 6.6 105.6 16.6 DB/DS IMO II Phenolic Epoxy MAK Oil/Chem 17

Demand Environment

11
Demand Drivers
Fundamental change in regulations – double-hull / double-bottom requirements
Demand fundamentals remains strong – oil majors requires high quality vessels that local owners are not able to provide, many newbuilding are sub-standard and the fleet is aging (23% of the existing fleet is already over 25 years of age).
Refining capacity expansions in 2007-2012, with the focus being in Asia China’s capacity to grow by 550k-600k bpd in 2008, 3m bpd to be constructed by 2012, resulting
in a total capacity of 10.3 bpd Total Asia capacity addition to be 1.6mn in 2008, 1mn in 2009, 644k bpd in 2010, 970k bpd in
2011, 950k bpd in 2012.
Oil products likely to change as well. Cracking capacity should be 55% of the new crude-distillation capacity over 2007-2012, up from
30% now. This implies that residual fuel oil capacity will decrease in the refining system, while gasoline and diesel surpluses will continue over the next three years.

12
Global Refinery CapacitySummary Refining Capacity 2004 2005 2006 2007 2008 2009 2010 2011 2012
2007-2012 CAGR
Year end Refining Capacity (including Likely Expansions Only) China 6,139 6,437 7,029 7,347 8,131 8,837 9,107 9,897 10,297 7.0% Japan 4,567 4,529 4,542 4,598 4,598 4,629 4,648 4,648 4,648 0.2% India 2,513 2,558 2,992 3,052 3,662 3,722 4,012 4,192 4,492 8.0% Korea 2,598 2,598 2,633 2,633 2,633 2,633 2,633 2,633 2,633 0.0% Taiwan 1,159 1,159 1,140 1,185 1,230 1,230 1,230 1,230 1,230 0.7% Singapore 1,255 1,255 1,255 1,255 1,255 1,255 1,255 1,255 1,255 0.0% Australia/NZ 867 820 820 820 820 820 840 840 840 0.5% Thailand 1,062 1,062 1,082 1,082 1,197 1,197 1,197 1,197 1,197 2.0% Malaysia 545 545 545 558 558 558 603 603 603 1.6% Indonesia 1,056 1,056 1,126 1,126 1,126 1,176 1,176 1,176 1,176 0.9% Philippines 333 333 333 333 333 333 333 333 333 0.0% Pakistan 269 269 269 281 281 281 281 281 531 13.6% Others 127 178 179 179 179 347 347 347 347 14.2%Asia 22,490 22,798 23,944 24,448 26,002 27,018 27,661 28,631 29,581 3.9%OECD North America 20,580 20,802 20,963 21,208 21,322 21,960 22,460 22,560 22,779 1.4%Europe/Eurasia ex-FSU 16,907 16,911 16,968 16,968 16,978 17,178 17,258 17,368 17,368 0.5%Latin America 6,625 6,644 6,680 6,725 6,761 6,798 7,063 7,063 7,135 1.2%FSU 8,263 8,243 8,203 8,203 8,235 8,235 8,385 8,539 8,539 0.8%
Saudi Arabia 2,075 2,100 2,100 2,100 2,100 2,175 2,275 2,275 3,075 7.9% Iran 1,619 1,619 1,704 1,704 1,764 1,764 1,764 2,345 2,700 9.6% Kuwait 905 905 905 921 921 921 921 1,071 1,071 3.1% Iraq 644 644 644 644 654 654 794 794 794 4.3% UAE 620 620 620 620 620 620 620 620 620 0.0% Qatar 200 200 200 200 345 345 345 345 595 24.4% Yemen 100 100 100 100 100 100 190 190 190 13.7% Oman 85 85 85 222 222 222 222 222 222 0.0% Bahrain 249 249 249 249 249 249 249 249 249 0.0% Syria 240 240 240 240 240 240 240 240 240 0.0% Israel 220 220 220 220 220 220 220 220 220 0.0% Other 144 144 154 154 154 154 154 154 154 0.0%Middle East 7,101 7,126 7,221 7,374 7,589 7,664 7,994 8,725 10,130 6.6%Africa 3,311 3,332 3,336 3,336 3,391 3,491 3,516 3,516 3,516 1.1%World total 85,276 85,856 87,315 88,262 90,278 92,344 94,337 96,402 99,048 2.3%

13
Refinery Capacity Additions
Capacity expansion for refineries are focused in Asia, with close to 6 million bpd forecasted to be built from 2007-2012.
Total Asia capacity addition to be 1.6mn in 2008, 1mn in 2009, 644k bpd in 2010, 970k bpd in 2011, 950k bpd in 2012. By products, residual fuel oil capacity is expected to decrease while gasoline and diesel surpluses will continue over the next three years.

14
Asia Capacity Additions Lack of quality oversight
on ships built in China will result in a rapid demand for high quality small tankers.
The initial target base is the non-domestic oil majors which, with increasingly stringent international, local and indeed internal regulations, have a disproportionate risk profile to that of the incumbent, national oil company.

15
Shifts in Oil Products Demand
Cracking capacity should be equivalent to 55% of the new crude-distillation capacity over 2007-12. At present, global cracking capacity represents only 30% of crude-distillation capacity, which implies that there will be a very large destruction of residual fuel oil in the refining system. In our view, this will exacerbate the gasoline and diesel surpluses over the next three years.

16
Global Demand for Oil Products
Refineries and storage areas are also increasingly far from fast growing urban areas, leading to an increase in the need for smaller ports and distribution nodes in a larger distribution program
17
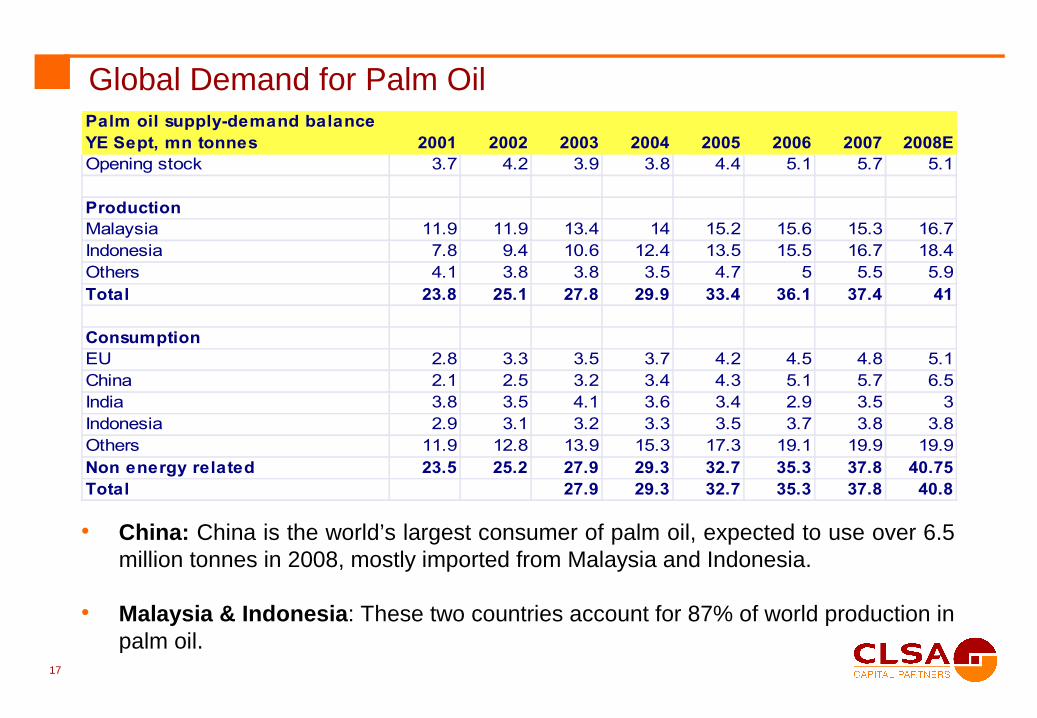
Global Demand for Palm Oil
• China: China is the world’s largest consumer of palm oil, expected to use over 6.5 million tonnes in 2008, mostly imported from Malaysia and Indonesia.
• Malaysia & Indonesia: These two countries account for 87% of world production in palm oil.
Palm oil supply-demand balanceYE Sept, mn tonnes 2001 2002 2003 2004 2005 2006 2007 2008EOpening stock 3.7 4.2 3.9 3.8 4.4 5.1 5.7 5.1
ProductionMalaysia 11.9 11.9 13.4 14 15.2 15.6 15.3 16.7Indonesia 7.8 9.4 10.6 12.4 13.5 15.5 16.7 18.4Others 4.1 3.8 3.8 3.5 4.7 5 5.5 5.9Total 23.8 25.1 27.8 29.9 33.4 36.1 37.4 41
ConsumptionEU 2.8 3.3 3.5 3.7 4.2 4.5 4.8 5.1China 2.1 2.5 3.2 3.4 4.3 5.1 5.7 6.5India 3.8 3.5 4.1 3.6 3.4 2.9 3.5 3Indonesia 2.9 3.1 3.2 3.3 3.5 3.7 3.8 3.8Others 11.9 12.8 13.9 15.3 17.3 19.1 19.9 19.9Non energy related 23.5 25.2 27.9 29.3 32.7 35.3 37.8 40.75Total 27.9 29.3 32.7 35.3 37.8 40.8

18
Other Demand Drivers for Small Product Tankers
• Asphalt: asphalt plants are increasingly far from areas of urban growth and infrastructure projects; high, sustained heating required
• Chemicals: a sharp increase in demand for consumer goods has increased demand for chemicals for manufacturing and other processes.
• Bio fuels: a hot topic, but of increasing importance, bio fuels are steadily increasing as bio fuel refineries take hold world wide
Distribution by road / rail often impossible: urban growth has been greatest in developing countries where infrastructure has not caught up with urban growth
• Regulations

Supply / Demand Outlook
20
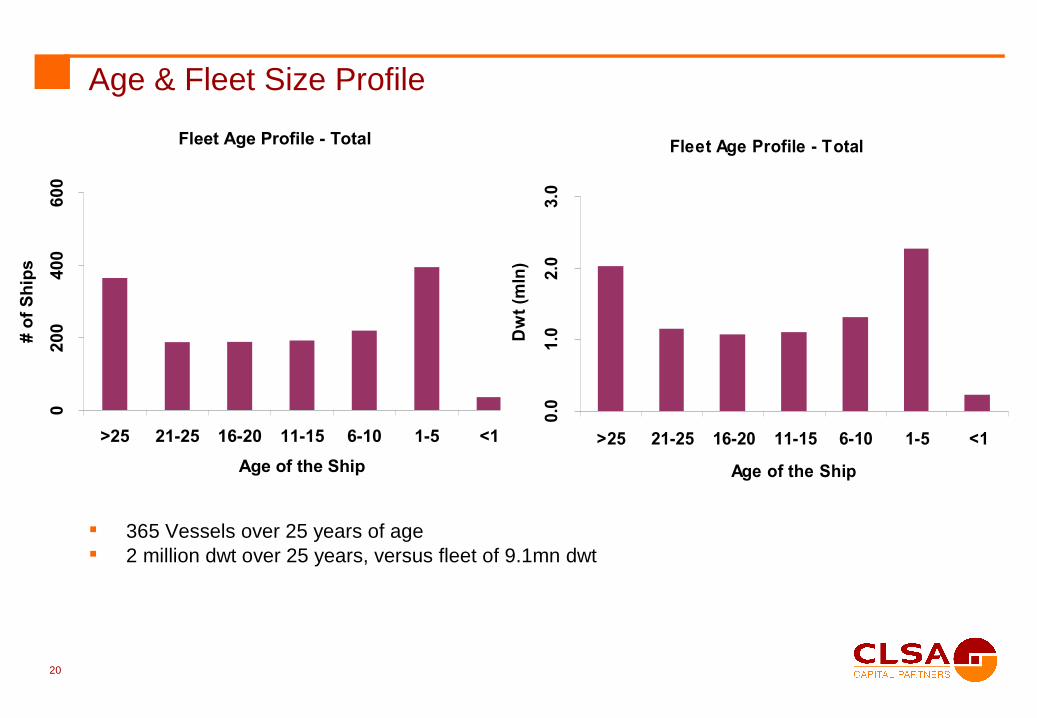
Age & Fleet Size Profile
365 Vessels over 25 years of age 2 million dwt over 25 years, versus fleet of 9.1mn dwt
Fleet Age Profile - Total
020
040
060
0
>25 21-25 16-20 11-15 6-10 1-5 <1
Age of the Ship
# of
Shi
ps
Fleet Age Profile - Total
0.0
1.0
2.0
3.0
>25 21-25 16-20 11-15 6-10 1-5 <1
Age of the Ship
Dw
t (m
ln)

21
Orderbook vs. % of existing fleet
Tanker (10K+DWT) # of Ships
01000200030004000500060007000
1996
1997
1998
1999
2000
2001
2002
2003
2004
2005
2006
2007
2008
2009
2010
2011
2012
# of
Shi
ps
-2.0%0.0%2.0%4.0%6.0%8.0%10.0%12.0%14.0%
% G
row
th
Fleet % Growth
Tanker (10K+DWT)
0100200300400500600
1996
1997
1998
1999
2000
2001
2002
2003
2004
2005
2006
2007
2008
2009
2010
2011
2012
DWT
(mln
)
-5.0%
0.0%
5.0%
10.0%
15.0%
% G
row
th
Fleet % Growth
Total Tanker fleet growth expected to peak in 2010.

22
Fleet Replacement Profile 3000 to 8999
0
200
400
600
800
1000
1200
1400
1600
1800
Existing Newbuildings >25
Vessels
# of
Shi
ps
Total
Demolitions Trend
365 Vessels are over 25 years old, versus existing fleet of 1587 vessels.

23
Supply Outlook – Fleet Replacement Profile (Table)
3000-6000 dwt range is most attractive, with oldest fleet NB vessels concentrated on larger sizes.
Fleet Replacem ent Profile (# of Ships)Tanker Tanker Tanker Tanker Tanker Tanker Total3000-3999 4000-4999 5000-5999 6000-6999 7000-7999 8000-8999
Existing 314 205 364 356 171 177 1587New buildings 53 34 75 133 66 71 432>25 79 39 110 84 27 26 365>25 as a % of existing 25.2% 19.0% 30.2% 23.6% 15.8% 14.7% 23.0%NB as a % of existing 16.9% 16.6% 20.6% 37.4% 38.6% 40.1% 27.2%
Fleet Replacem ent Profile (m ln Dw t)Tanker Tanker Tanker Tanker Tanker Tanker Total3000-3999 4000-4999 5000-5999 6000-6999 7000-7999 8000-8999
Existing 1.1 0.9 2.0 2.3 1.3 1.5 9.1New buildings 0.2 0.2 0.4 0.8 0.5 0.6 2.7>25 0.3 0.2 0.6 0.5 0.2 0.2 2.0>25 as a % of existing 24.6% 18.4% 30.6% 23.4% 15.6% 14.5% 22.1%NB as a % of existing 17.3% 16.9% 20.6% 36.6% 37.2% 39.5% 29.3%

24
Regulatory Changes
Regulations: International (IMO) and local regulations, and as well as oil company and terminal policies, are changing, and the phase out of single hulled ships is accelerating. IMO MARPOL Regulation 13 is a consequence of the Exxon Valdez oil spill. It is split into several parts the most relevant of which are 13F and 13G regarding the distribution of a protective void space around the cargo tanks of a ship, as well as the dates by which it is to be accomplished. The regulations were originally envisaged for tankers above 20,000 dwt, but in light of several recent oil spills and collisions, it is now relevant for all tanker sizes, including the 1,000 to 10,000 dwt range.
The timeline of regulatory changes indicates that ships delivered in (or before) 1986, would not meet requirements by 1 January, 2012.

25
Regulatory Changes
Regulation 13F states:– “(1) (a) This regulation shall apply to oil tankers of 600 tons deadweight and above ... (3) (a) wing tanks or spaces shall extend either for the full depth of the ship's side or from the top of the double bottom to the uppermost deck, disregarding a rounded gunwale where fitted. They shall be arranged such that the cargo tanks are located inboard of the moulded line of the side shell plating, nowhere less than the distance “w” which ...the minimum value is 1 meter ... (3) (b) [and] ... the distance “h” between the bottom of the cargo tanks and the moulded line of the bottom shell plating ... is not less than ... 1.0 meters. (7) Tankers of less than 5,000 tons deadweight shall: (a) at least be fitted with double bottom tanks or spaces having such depth ... of ... 0.76 m; ... and (b) be provided with cargo tanks so arranged that the capacity of each cargo tank does not exceed 700 m2 unless wing tanks or spaces are arranged ... with .. a minimum value of “w” = 0.76 meters.”
Regulation 13G states:“(4) An oil tanker not meeting the requirements of a new oil tanker ... shall comply with the requirements of regulation 13F ... not later than 25 years after its date of delivery .. [and] ... compliance with regulation 13F is required not later than 30 years after its date of delivery.”
• In other words: segregated ballast or double bottom or double sides until the 25th anniversary, and double hull by the ship's 30th anniversary.

26
Top Players
We see our main competition as being from a mixture of local ship owners and international players. The industry is fragmented although some consolidation is occurring. The main players are the Eitzen Group, James Fisher & Sons, Clipper Group, Brostrom, Erria, and Odfjell. However, these main players primarily focus in the European market, and do not have significant exposures in the Caribbean and Asia.
On the next page is a list of top owners in the small specialized tanker and small tanker segments from Clarkson Research Services. As indicated, with a fleet of 10-20 vessels, we would be able to be a top 5 player. In addition, the fleet is quite old for many second tier players, and with a modern fleet, we would be in a strong competitive position versus our peers

27
Top PlayersRank Current Owner Number Total Avg Size Unit Age Rank Current Owner Number Total Avg Size Unit Age
1 John T. Essberger 17 60623 3566 DWT 17 1 Palmali Shipping 24 160326 6680 DWT 62 Woolim Shipping 14 42612 3043 DWT 11 2 China Shipping Group 21 132874 6327 DWT 223 Clipper Group 13 43884 3375 DWT 6 3 Eitzen Group 18 134399 7466 DWT 144 Sinochem Shpg. 11 36684 3334 DWT 8 4 Caspian Shipping 16 109852 6865 DWT 195 Simonsen Tankers 11 33647 3058 DWT 16 5 Pertamina 15 96021 6401 DWT 216 Shokuyu Tanker Co. 11 25181 2289 DWT 16 6 Hong Lam Marine 15 124029 8268 DWT 37 Tank. Herning A/S 11 37828 3438 DWT 7 7 Stolt-Nielsen SA 14 93730 6695 DWT 138 Cosmos Shipping Co. 10 13316 1331 DWT 21 8 Berlian Laju Tanker 14 102806 7343 DWT 89 Berlian Laju Tanker 9 27746 3082 DWT 20 9 China Ocean (COSCO) 13 76195 5861 DWT 17
10 Marnavi S.P.A. 8 24916 3114 DWT 32 10 Koyo Kaiun Co. Ltd. 13 100556 7735 DWT 711 Samudera Shpg. Line 8 24492 3061 DWT 14 11 Mitsui O.S.K. Lines 13 87104 6700 DWT 1012 Jubilee Ships (UK) 8 20478 2559 DWT 3 12 Sansho Kaiun Co.Ltd. 12 99259 8271 DWT 1013 Svithoid Tankers 7 24258 3465 DWT 2 13 Titan (Holdings) Ltd 11 74513 6773 DWT 1114 Shanghai Dingheng 7 17481 2497 DWT 2 14 Govt. of Russia 10 60260 6026 DWT 2615 Samho Shipping Co. 7 24051 3435 DWT 2 15 John T. Essberger 10 59744 5974 DWT 1616 Daiichi Tanker Co. 7 21795 3113 DWT 10 16 Poseidon Schiff. OHG 10 82408 8240 DWT 317 Tarbit Shpg. AB 7 26487 3783 DWT 21 17 Woolim Shipping 9 67620 7513 DWT 718 Heung-A Shpg. Co.Ltd 7 16925 2417 DWT 16 18 Odfjell ASA 9 55722 6191 DWT 1119 KSS Line Ltd. 7 23407 3343 DWT 9 19 Nissho Shpg. Co. Ltd 9 60563 6729 DWT 920 Korea Line 7 21621 3088 DWT 17 20 Dorval Kaiun K.K. 9 78610 8734 DWT 1021 Sam Bu Shpg 7 20372 2910 DWT 14 21 Navigator JSC 9 49200 5466 DWT 422 Yamane Kaiun K.K. 6 11754 1959 DWT 10 22 Tradewind Tankers SA 8 64363 8045 DWT 1323 Gefo Gesellschaft 6 19000 3166 DWT 9 23 Erik Thun AB 8 58424 7303 DWT 624 Utkilens, Anders 6 22142 3690 DWT 22 24 Marnavi S.P.A. 8 60740 7592 DWT 825 China Ocean (COSCO) 6 20829 3471 DWT 18 25 Pritchard-Gordon Co. 8 57591 7198 DWT 926 Soysay Shipping 6 21728 3621 DWT 29 26 Volgotanker AMS 8 46354 5794 DWT 1727 Stolt-Nielsen SA 6 28397 4732 DWT 16 27 Schoeller Holdings 7 57514 8216 DWT 528 Amoretti Armatori 6 16125 2687 DWT 14 28 Fairdeal Group Mngt. 7 46904 6700 DWT 2329 Yangyang Shipping 5 19546 3909 DWT 5 29 Utkilens, Anders 7 58194 8313 DWT 1830 Clearwater Group 5 16211 3242 DWT 9 30 Tsurumi Sunmarine 7 38923 5560 DWT 10
Small Specialised Tanker (1,000 - 4,999 dwt) Top Owners Small Tanker (5,000 - 9,999 dwt) Top Owners

28
Fragmented Market
In our analysis, comparing different sub-
types of shipping sectors, the top 50
owners as a percent of total fleet is the
2nd and 3rd lowest for small tanker and
small specialized tankers.
Small uncategorized product tankers and
IMO II chemical tankers are relatively
fragmented at ~50% of top 50 owners as
a percent of total fleet.
The average of 60+ shipping sub-sectors
indicates that the top 50 owners
represent about 68% of total fleet.
Most Fragmented Markets in Shipping Top 50 Others Others (dwt) Total (dwt) Handysize Bulker 38.3% 61.7% 47,048,990 76,256,542 Small Tanker 39.3% 60.7% 4,916,593 8,099,196 Small Specialized Tanker 40.9% 59.1% 1,490,777 2,520,667 Log Fitted Bulker 42.2% 57.8% 12,353,206 21,375,878 Multipurpose 44.2% 55.8% 13,746,229 24,652,703 General Cargo Tramp 44.6% 55.4% 3,568,920 6,446,038 Panamax Bulker 45.3% 54.7% 60,048,110 109,848,456 Handysize Tanker 45.6% 54.4% 45,797,788 84,164,701 Other Chemical 45.7% 54.3% 1,168,708 2,151,156 Handymax Bulker 45.9% 54.1% 42,269,295 78,110,332 Small Product Tankers 47.8% 52.2% 2,021,864 3,875,257 IMO II Chemical 50.4% 49.6% 13,799,860 27,804,087 Lakes Fitted Bulker 50.8% 49.2% 5,829,358 11,857,681 Pass/Car Ferry 51.3% 48.7% 1,265,751 2,600,116 Unknown IMO Chemical 51.6% 48.4% 1,138,579 2,353,157 Ro-Ro Freight 53.6% 46.4% 3,917,513 8,444,590 Epoxy Coated Chemical 53.9% 46.1% 15,442,075 33,510,855 MR Product Tanker 56.5% 43.5% 20,215,971 46,519,081 Feeder Container 56.6% 43.4% 1,009,969 2,326,583 Feedermax Container 57.1% 42.9% 3,480,520 8,118,991 Source: Clarkson Research Services, CLSA Capital Partners

29
Conclusions / Next Steps
We have performed due diligence on our targeted segment. We have approached ship brokers to find appropriate tonnage. We are evaluating potential purchases of fleets or companies in this segment.
Next Steps Hire commercial expertise from top players such as Stolt-Nielsen, Eitzen
We would built out our commercial management team in-house, and at a faster pace, and focus on our Asian expertise.
Establish company name and legal entities
Purchase assets and execute business plan
Sign technical management contract with qualified technical manager such as Anglo-Eastern Ship Management Maintain our asset acquisition plan Apply best practices in operations.

30
Disclaimer
This is a not a marketing or offering document. Notwithstanding anything contained in this document, this document does not constitute, and no Recipient of this document may treat the same as, an offer, solicitation or invitation for the sale and purchase of any securities, instruments or any other properties AND the information contained in this document shall not form the basis of any offer or contract.
None of the CLSA group companies nor any of their respective directors, officers, employees, agents, contractors or advisers makes any representation or warranty as to the truth, accuracy or completeness of this document (including statements of opinion or expectation) or as to the achievement or reasonableness of any future projections, estimates, prospects or returns or any of the assumptions underlying them made nor shall any of them have any liability (whether arising from negligence or otherwise) for any representations (expressed or implied) contained in, or for any omissions from, this document or for any written or oral communications transmitted to the Recipient (or its advisers or representative). No person has been authorised to give any information or make any representations other than that contained herein, and any information or representations not contained herein are not authorised by any CLSA group companies or their affiliates and must not be relied upon. The delivery of this document at any time shall not, under any circumstances, imply that there has been no change in any matters described herein since the date hereof or that the information contained herein is correct as of any time subsequent to the date hereof. In furnishing this document, CLSA group companies do not undertake any obligation to provide the Recipients with access to any additional information or to correct any inaccuracies in or update this document.
This document and any information contained herein must be treated in a confidential manner and shall not be copied, disclosed or distributed in whole or in part in any medium to others at any time. This document has been delivered to the Recipients strictly for information purposes only and shall not be used for any other purposes. By accepting delivery of this document, each Recipient agrees to the foregoing and to return this document promptly upon request.