STIFEL Conference Presentation - Scorpio Tankers/media/Files/S/Scorpio-Tankers/...4 Product Tankers...
29
1 February 2017 STIFEL Conference Presentation
Transcript of STIFEL Conference Presentation - Scorpio Tankers/media/Files/S/Scorpio-Tankers/...4 Product Tankers...

1
February 2017
STIFEL Conference Presentation
2
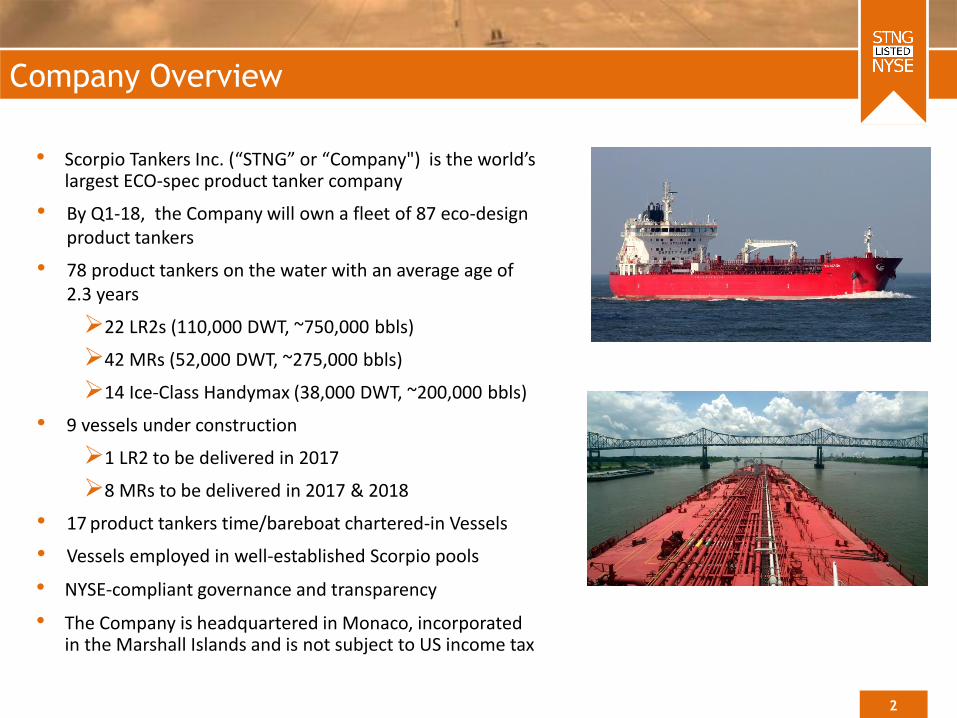
• Scorpio Tankers Inc. (“STNG” or “Company") is the world’s largest ECO-spec product tanker company
• By Q1-18, the Company will own a fleet of 87 eco-design product tankers
• 78 product tankers on the water with an average age of 2.3 years
22 LR2s (110,000 DWT, ~750,000 bbls)
42 MRs (52,000 DWT, ~275,000 bbls)
14 Ice-Class Handymax (38,000 DWT, ~200,000 bbls)
• 9 vessels under construction
1 LR2 to be delivered in 2017
8 MRs to be delivered in 2017 & 2018
• 17 product tankers time/bareboat chartered-in Vessels
• Vessels employed in well-established Scorpio pools
• NYSE-compliant governance and transparency
• The Company is headquartered in Monaco, incorporated in the Marshall Islands and is not subject to US income tax
Company Overview

3
Operating Leverage Continues to Grow
Class Existing To be Delivered Total Owned TC/BB-In Total
2017 2018
Handymax (35,000 DWT)
14 - - 14 7 21
MR (52,000 DWT)
42 7 1 50 8 58
LR1(75,000 DWT)
- - - - 1 1
LR2(110,000 DWT)
22 1 - 23 1 25
Total 78 8 1 87 17 105

4
Product Tankers in the Oil Supply Chain
Oil production includes drilling, extraction, and recovery of oil from underground.
Crude oil is transported to the refinery for processing by crude tankers, rail cars, and pipelines.
Refineries convert the crude oil into a wide range of consumable products.
Refined products are moved from the refinery to the end users via product tankers, railcars, pipelines and trucks.
Terminals are located closer to transportation hubs and are the final staging point for the refined fuel before the point of sale.
Products Transportation Terminalling & DistributionExploration & Production Crude Transportation Refining
• Crude Tankers provide the marine transportation of the crude oil to the refineries.
• Product Tankers provide the marine transportation of the refined products to areas of demand.
• Structural demand drivers in the product tanker industry:
• US has emerged as a refined products powerhouse, becoming the worlds largest product exporter
• Changes in refinery locations, expansion of refining capacity in Asia and Middle East as well as a reduction in OECD refining capacity (Europe & Australia).
• Changes in consumption demand growth in Latin America, Africa, and non-China/Japan Asia and lack of corresponding growth in refining capacity
• Balance of trade: needs of each particular region- gasoline/diesel trade between U.S./Europe is a prime example of this given significantly different diesel penetration rates for light vehicles
• Europe imports surplus diesel from the United States, and exports surplus gasoline to the United States.

5
Product and Crude Tankers
Vessel Size
Cargo Size
Naphtha
Clean Condensate
Jet Fuels
Kerosene
Gasoline
Vegoil
Gasoils
Diesels
Cycle Oils
Fuel Oils
Chemicals
Clean
Products
-
-
-
Dirty
Products
Crude Oil
VLCC(200,000 +
DWT)
Suezmax(120,000 -
200,00 DWT)
Aframax(80,000 -
120,00 DWT)
Panamax(60,000 -
80,00 DWT)
Handysize(< 60,000
DWT)
LR2(80,000-120,000
DWT)
LR1(60,000-
80,000 DWT)
Hmx/MR(25,000-
60,000 DWT)
Handysize(<25,000
DWT)
Crude Products
“Dirty” “Clean”Tankers
2,000,000bbls
1,000,000 bbls
500,000-800,000 bbls
350,000-500,000 bbls
<=350,000 bbls
615,000-800,000 bbls
345,000-615,000 bbls
200,000-345,000 bbls
<=200,000 bbls

6
Product Tanker Specifications
• Product tankers have coated tanks, typically epoxy, making them easy to clean and preventing cargo contamination and hull corrosion.
• IMO II & III tankers have at least 6 segregations and 12 tanks, i.e. 2 tanks can have a common line for discharge.
• Oil majors and traders have strict requirements for the transportation of chemicals, FOSFA cargoes (vegetable oils and chemicals), and refined products.
• Tanks must be completely cleaned before a new product is loaded to prevent contamination.
IMO Class I Chemical TankersIMO Class I refers to the transportation of the most hazardous, very acidic, chemicals. The tanks can be stainless steel, epoxy or marine-line coated.
IMO Class II Chemical & ProductTankers IMO Class II carries Veg & Palm Oils, Caustic Soda. These tanks tend to
be coated with Epoxy or Stainless steel.
IMO Class III Product TankersTypically carry refined either light, refined oil “clean” products or “dirty” heavy crude or refined oils.
IMO Classes I, II, & III

7
New Design Features on Scorpio Product Tankers
Lower Co2 Emissions at
Sea & In Port
Vapor Recovery
SystemDeepwell Pumps, Cleaning Capability for Rapid
Discharge & Cargo Flexibility
Mewis Duct
Larger PropellerG-Type
(Electronic Long Stroke Main
Engine)
Hydrodynamic Hull FormEnhanced Cargo Tank Coatings
Low Friction Hull Coating
Bulbous Bow

8
Ballast Water Treatment Systems
• The IMO’s Ballast Water Convention is due to enter force on September 8, 2017.
• After September 2017, ship operators will need to install type-approved ballast water treatment systems by the time the International Oil Pollution Prevention (IOPP) certificate falls due for renewal, typically at Special Survey.
• Ballast water is used to stabilize vessels and ensure structural integrity. It is typically pumped in while cargo is being unloaded, and discharged while cargo is being loaded.
• Water taken on in one ecological zone and released into another can result in the introduction and spread of aquatic invasive species, many of which can have serious ecological, economic and public health effects if transferred to regions where they are not native
• Ballast water treatment systems actively remove, kill and/or inactivate organisms in the ballast water prior to discharge.
• Ballast water treatment systems are expected to cost $500,000 to $1.5 million and depends on the type and size of vessel.
• Retrofits on older, existing ships, can be more challenging and expensive as they were designed without the space in the engine room.
BWTS Filtering Unit
BWTS Piping in Engine Room

9
New Sulfur Emission Regulations
Source: Ocean Connect, February 2017
MARPOL Annex VI SOx Emission Timeline
Historical FO & MGO Prices ($/MT)1
• On October 27, 2016 the International Maritime Organization's (IMO) announced the results from a vote to ratify and formalize regulations mandating a reduction in sulfur emissions from 3.5% currently to 0.5% as of the beginning of 2020.
• Ship owners will have to decide between:
1. Installing a scrubber so the vessel can continue to burn HFSO; or
2. Paying the premium to consume MGO with a sulfur content < 0.5%
• The cost of the scrubber depends on the size and type of ship but is estimated to cost $4-$10 million.
• Refineries that currently produce traditional fuel oil in areas such as Russia, Mexico, Venezuela, Iraq, and Iran are unlikely to have enough capital to upgrade refineries, resulting in the need to more blended fuel.
• Assuming 80% gasoil is blended with diesel, this would lead to an increase in global diesel demand, increasing the demand for product tankers.
• Increase in scrap rate as the cost to equip older tonnage with scrubbers can exceed the scrap value of the vessel.
• Modern fuel efficient ships have a competitive advantage over older tonnage through lower fuel consumption.
$0
$200
$400
$600
$800
$1,000
$1,200
Jan-13 Jan-14 Jan-15 Jan-16 Jan-17
Rotterdam Singapore Houston
10
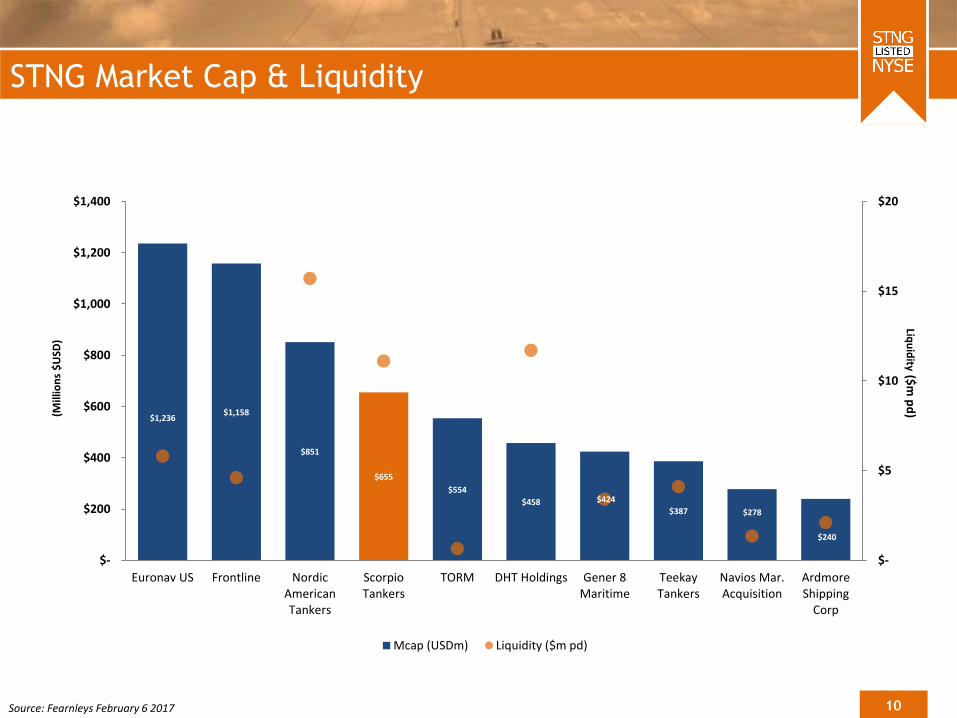
STNG Market Cap & Liquidity
Source: Fearnleys February 6 2017
$1,236$1,158
$851
$655
$554
$458 $424
$387 $278
$240
$-
$5
$10
$15
$20
$-
$200
$400
$600
$800
$1,000
$1,200
$1,400
Euronav US Frontline NordicAmericanTankers
ScorpioTankers
TORM DHT Holdings Gener 8Maritime
TeekayTankers
Navios Mar.Acquisition
ArdmoreShipping
Corp
(Mill
ion
s $
USD
)
Mcap (USDm) Liquidity ($m pd)
Liqu
idity
($m
pd
)
11
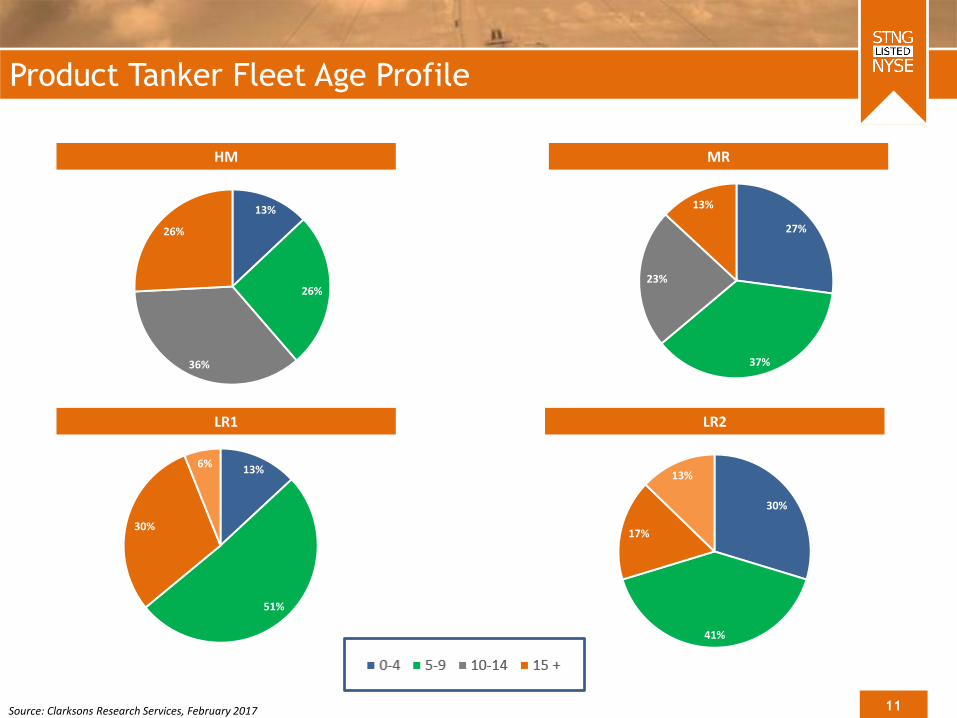
Product Tanker Fleet Age Profile
HM
Source: Clarksons Research Services, February 2017
MR
LR1 LR2
13%
51%
30%
6%
30%
41%
17%
13%
13%
26%
36%
26% 27%
37%
23%
13%
12
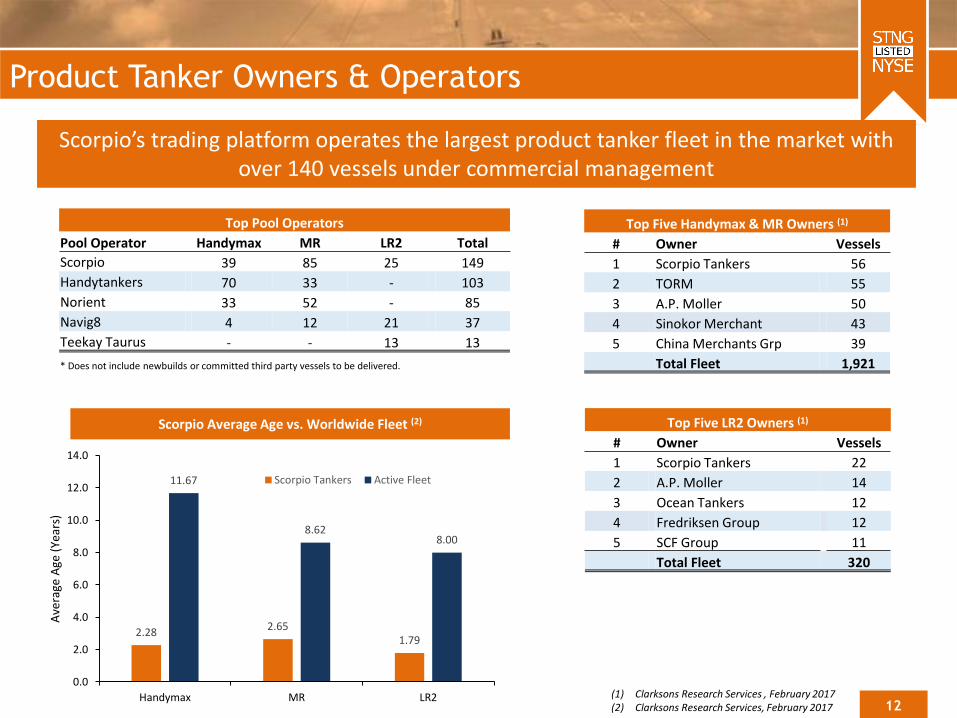
Product Tanker Owners & Operators
(1) Clarksons Research Services , February 2017(2) Clarksons Research Services, February 2017
Scorpio’s trading platform operates the largest product tanker fleet in the market with over 140 vessels under commercial management
Top Five Handymax & MR Owners (1)
# Owner Vessels
1 Scorpio Tankers 56
2 TORM 55
3 A.P. Moller 50
4 Sinokor Merchant 43
5 China Merchants Grp 39
Total Fleet 1,921
Top Five LR2 Owners (1)
# Owner Vessels
1 Scorpio Tankers 22
2 A.P. Moller 14
3 Ocean Tankers 12
4 Fredriksen Group 12
5 SCF Group 11
Total Fleet 320
Scorpio Average Age vs. Worldwide Fleet (2)
2.282.65
1.79
11.67
8.628.00
0.0
2.0
4.0
6.0
8.0
10.0
12.0
14.0
Handymax MR LR2
Ave
rage
Age
(Ye
ars)
Scorpio Tankers Active Fleet
Top Pool Operators
Pool Operator Handymax MR LR2 Total
Scorpio 39 85 25 149
Handytankers 70 33 - 103
Norient 33 52 - 85
Navig8 4 12 21 37
Teekay Taurus - - 13 13
* Does not include newbuilds or committed third party vessels to be delivered.

13
Pool Performance ($/day)
Scorpio Handymax Tanker Pool(SHTP)
Scorpio MR Pool (SMRP)
Scorpio LR2 Tanker Pool (SLR2P)
Scorpio Pools Have Consistently Outperformed The Market
$0
$10,000
$20,000
$30,000
Q1/14 Q2/14 Q3/14 Q4/14 Q1/15 Q2/15 Q3/15 Q4/15 Q1/16 Q2/16 Q3/16 Q4/16
Scorpio Handymax Pool Handymax Benchmark (TD16 - TD18 - TC6 - BALTIC/CONT)
$0
$10,000
$20,000
$30,000
Q1/14 Q2/14 Q3/14 Q4/14 Q1/15 Q2/15 Q3/15 Q4/15 Q1/16 Q2/16 Q3/16 Q4/16
Scorpio MR Clarksons MR
$0
$10,000
$20,000
$30,000
$40,000
$50,000
Q1/14 Q2/14 Q3/14 Q4/14 Q1/15 Q2/15 Q3/15 Q4/15 Q1/16 Q2/16 Q3/16 Q4/16
Scorpio LR2 LR2 Benchmark (AG / EAST - AG / WEST - UKC / EAST)

14
1414
Product Tanker Fundamentals
15
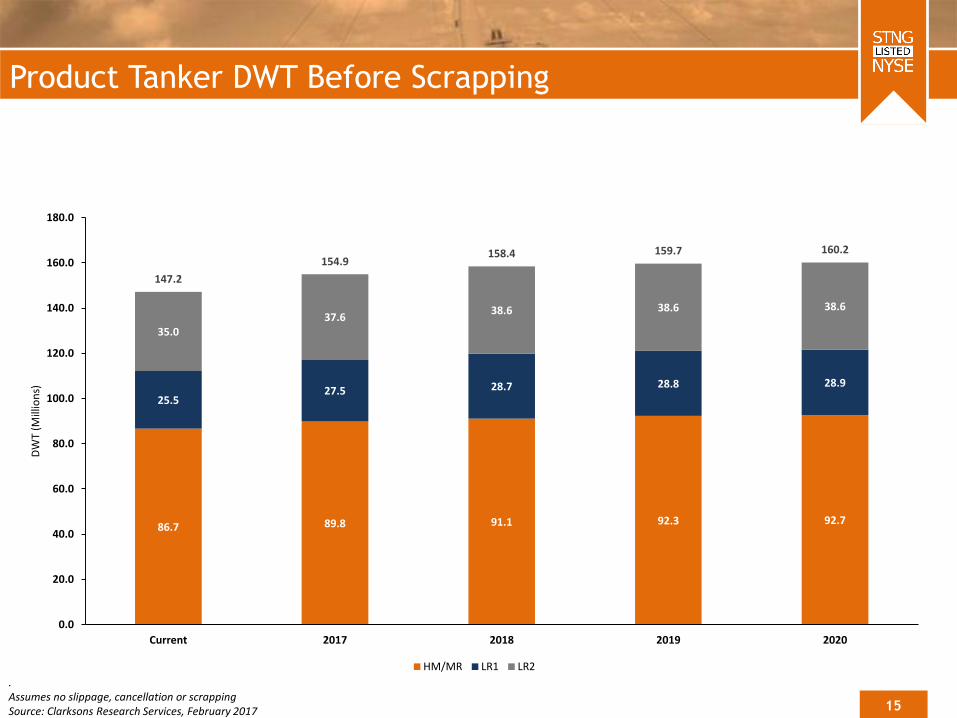
Product Tanker DWT Before Scrapping
.Assumes no slippage, cancellation or scrappingSource: Clarksons Research Services, February 2017
86.7 89.8 91.1 92.3 92.7
25.527.5 28.7 28.8 28.9
35.037.6
38.6 38.6 38.6
147.2
154.9158.4 159.7 160.2
0.0
20.0
40.0
60.0
80.0
100.0
120.0
140.0
160.0
180.0
Current 2017 2018 2019 2020
DW
T (M
illio
ns)
HM/MR LR1 LR2

16
Product Tanker Newbuilding Contracts at 20 Year Low
Source: Clarksons Research Services, February 2017
2017 Newbuilding Contracts YTD
Handymax MR LR1 LR2 Total
0 2 0 2 4
490
217
160
47
9880
108
299
126
192
174
0
100
200
300
400
500
600
2006 2007 2008 2009 2010 2011 2012 2013 2014 2015 2016 2017 YTD
(# o
f V
ess
els
)
HM & MR LR1 LR2 Total
17
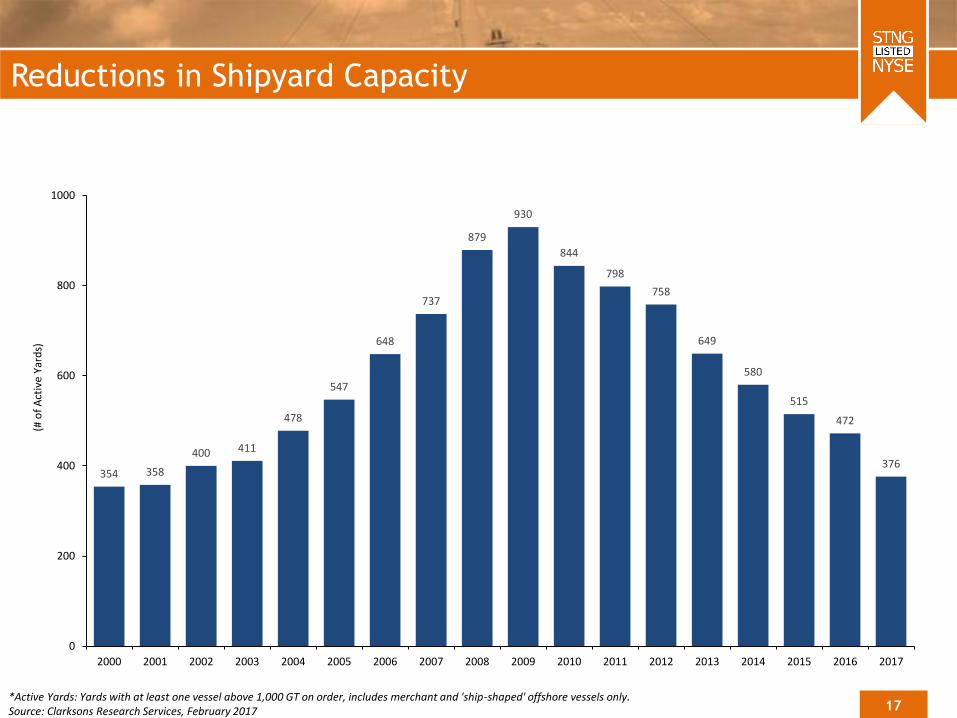
Reductions in Shipyard Capacity
*Active Yards: Yards with at least one vessel above 1,000 GT on order, includes merchant and 'ship-shaped' offshore vessels only.Source: Clarksons Research Services, February 2017
354 358
400 411
478
547
648
737
879
930
844
798
758
649
580
515
472
376
0
200
400
600
800
1000
2000 2001 2002 2003 2004 2005 2006 2007 2008 2009 2010 2011 2012 2013 2014 2015 2016 2017
(# o
f A
ctiv
e Ya
rds)

18Source: Clarksons Research Services, February 2017
Structural Drivers in Demand for Refined Products• Between 2000-2016, ton miles have increased an average of 4.4% per year.
• Reduction in oil prices has lead to an increase in the production of refined products, and consequently the quantity to be
transported.
• US has emerged as a refined products powerhouse, becoming the worlds largest product exporter.
• Changes in refinery locations, expansion of refining capacity in Asia and Middle East as well as a reduction in OECD refining
capacity (Europe & Australia).
• Growing consumption in Latin America, Africa, and non-China/Japan Asia and lack of corresponding refining capacity growth.
• Balance of trade needs of each particular region- gasoline/diesel trade between U.S./Europe is a prime example.
World Seaborne Refined Products Trade
0
500
1,000
1,500
2,000
2,500
3,000
3,500
2000 2001 2002 2003 2004 2005 2006 2007 2008 2009 2010 2011 2012 2013 2014 2015 2016* 2017*
(Bill
ion
To
n M
iles)

19
US Has Become the World’s Largest Products Exporter
Source: EIA, February 2017
U.S. Imports and Exports of Finished Oil Products
U.S. Finished Oil Product Exports U.S. Refined Product Exports By Type: Jan-Nov 2016
U.S. Crude Oil Production
2.0
4.0
6.0
8.0
10.0
(mb
/d)
0.5
1.0
1.5
2.0
2.5
3.0
3.5
(mb
/d)
Imports Exports
0.0
0.5
1.0
1.5
2.0
2.5
3.0
3.5
(mb
/d)
Gasoline Kerosene Distillate Fuel Oil Others
20%
6%
40%
10%
23%
Gasoline Kerosene Distillate Fuel Oil Others

20
Underlying Demand Growth Drives Imports
Average monthly imports from January to November in each year.Source: JODI, February 2017
Australia: Diesel
Mexico: Gasoline Singapore: Gasoline
United Kingdom: Diesel
219
264
291
318
100
150
200
250
300
350
2013 2014 2015 2016
kb/d
226243
292 295
100
150
200
250
300
350
2013 2014 2015 2016
kb/d
306
340
394
435
100
150
200
250
300
350
400
450
500
2013 2014 2015 2016
kb/d
306
327342
371
100
150
200
250
300
350
400
2013 2014 2015 2016
kb/d
21
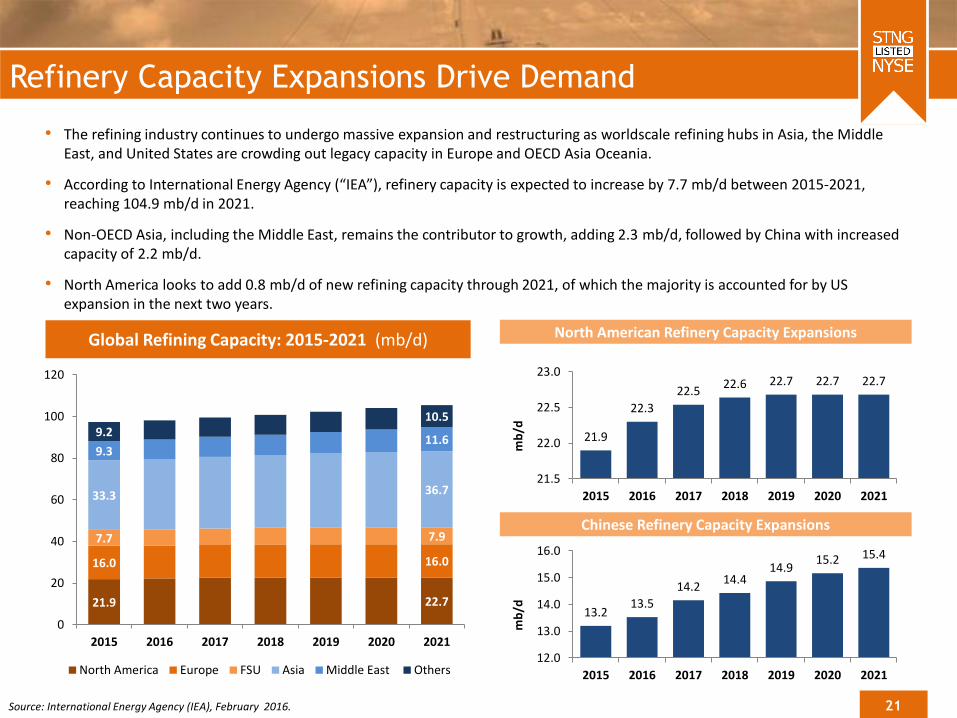
• The refining industry continues to undergo massive expansion and restructuring as worldscale refining hubs in Asia, the Middle East, and United States are crowding out legacy capacity in Europe and OECD Asia Oceania.
• According to International Energy Agency (“IEA”), refinery capacity is expected to increase by 7.7 mb/d between 2015-2021, reaching 104.9 mb/d in 2021.
• Non-OECD Asia, including the Middle East, remains the contributor to growth, adding 2.3 mb/d, followed by China with increased capacity of 2.2 mb/d.
• North America looks to add 0.8 mb/d of new refining capacity through 2021, of which the majority is accounted for by US expansion in the next two years.
Refinery Capacity Expansions Drive Demand
Source: International Energy Agency (IEA), February 2016.
Global Refining Capacity: 2015-2021 (mb/d)
21.9 22.7
16.0 16.0
7.7 7.9
33.3 36.7
9.311.6
9.210.5
0
20
40
60
80
100
120
2015 2016 2017 2018 2019 2020 2021
North America Europe FSU Asia Middle East Others
Chinese Refinery Capacity Expansions
North American Refinery Capacity Expansions
21.9
22.3
22.522.6 22.7 22.7 22.7
21.5
22.0
22.5
23.0
2015 2016 2017 2018 2019 2020 2021
mb
/d
13.213.5
14.214.4
14.915.2 15.4
12.0
13.0
14.0
15.0
16.0
2015 2016 2017 2018 2019 2020 2021
mb
/d

22
• New refinery projects coming on stream in the Middle East exceed regional demand growth, resulting in
increased product exports particularly middle distillates.
• Europe is the most likely destination for much of the new volumes, particularly diesel.
• The next major facility to begin operations is Sohar refinery in Oman, which shut down operations in December
as part of its testing phase. The 116,000 bpd refinery remains on schedule for 2017 and will increase capacity to
around 198,00 bpd.
Major Capacity Additions 2016-2019
Ras Laffan
Sohar
Persian Gulf Star
New Capacity
Source: International Energy Agency (IEA), STIFEL February 2017.
Rabigh
Jazan
Mina Abdulla Siraf
Closed Capacity
ShuaibaMina al-Ahmadi
Middle East Refinery Expansion Projects
Middle East Investing in New Refinery Capacity
Al Zour
Country Refinery Year Capacity (kb/d)
New Refineries
Qatar Ras Laffan 2 2017 145
Iran Persian Gulf Star 1 2017 120
Oman Sohar 2017 82
Saudi Arabia Rabigh 2 2017 50
Iraq Qaiwan-Baizan 2018 50
Saudi Arabia Jazan 2018 400
Kuwait Al Zour 2019 615
Kuwait Mina Abdulla 2019 184
Iran Siraf 2019 120
Iran Persian Gulf Star 2 2019 120
New Refinery Capacity 1,886
Closures
Kuwait Shuaiba 2017 -200
Kuwait Mina al-Ahmadi 2019 -119
Closure Capacity -319
Capacity Expansion 1,567

23
Far East
Product Tankers Needed to Meet Refining Capacity Growth
AG-Far East trade route
Arabian Gulf
Product Tankers Needed to Meet New Capacity Growth AG-FE Example
Incremental Refining Capacity Growth(bbl/d) 500,000
HM/MR Carrying Capacity (bbl) 250,000
LR1/LR2 Carrying Capacity (bbl) 600,000
Laden Speed (knots) 12.5
Ballast Speed (knots) 12.5
Voyage Days (Ras Tanura – Yokohama)
Sailing (Round Trip) 44
Loading 2
Discharging 2
Total Voyage Days (Per Trip) 48
Operating Days (Per Year) 360
AG-FE Round Trip Voyages Per Year 7.5
Product Tankers Needed Per Year
HM/MR Needed Per Year 96
LR1/LR2 Needed Per Year 40

24
Far East
Product Tanker Trade Map
LR2 main trade routes
LR1 main trade routes
MR/Handy main trade routes
Inter-Regional trade routes for various products
N. America
Arabian Gulf
South East Asia
Caribbean
Med
S. America
Naphtha
Gasoline
Gasoil/Diesel
Gasoline
Gasoline
Gasoil/Diesel
Gasoil/Diesel
Gasoil/Diesel
Gasoil/Diesel
Gasoil/Diesel
Jet Fuel
Gasoil/Diesel
Gasoline
GasolineGasoil/Diesel
25
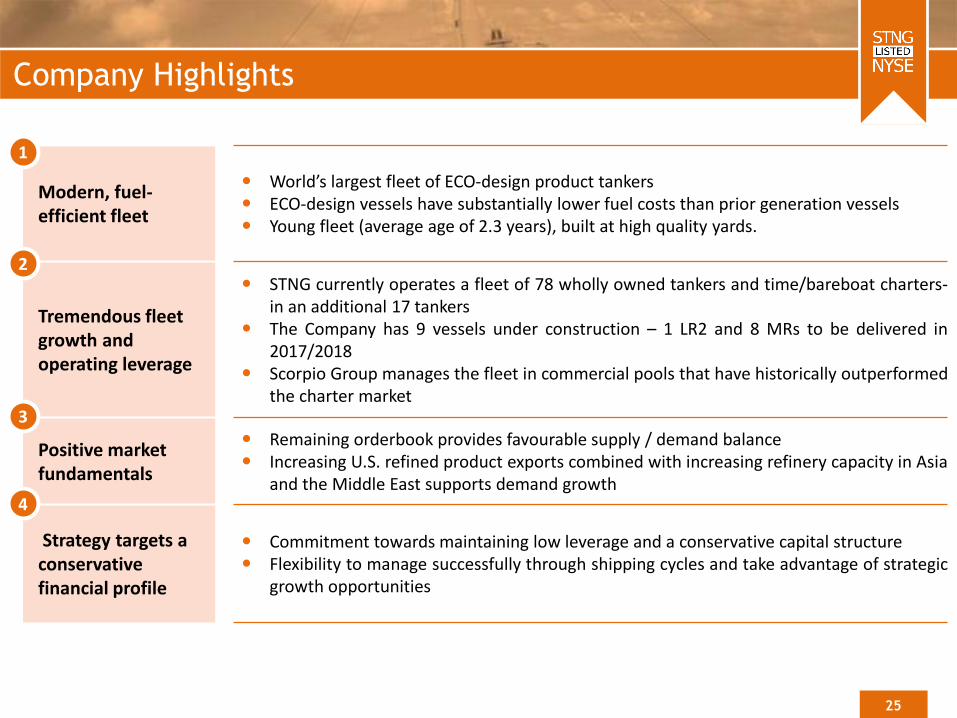
Company Highlights
Modern, fuel-efficient fleet
World’s largest fleet of ECO-design product tankers ECO-design vessels have substantially lower fuel costs than prior generation vessels Young fleet (average age of 2.3 years), built at high quality yards.
Tremendous fleetgrowth and operating leverage
STNG currently operates a fleet of 78 wholly owned tankers and time/bareboat charters-in an additional 17 tankers
The Company has 9 vessels under construction – 1 LR2 and 8 MRs to be delivered in2017/2018
Scorpio Group manages the fleet in commercial pools that have historically outperformedthe charter market
Positive market fundamentals
Remaining orderbook provides favourable supply / demand balance Increasing U.S. refined product exports combined with increasing refinery capacity in Asia
and the Middle East supports demand growth
Strategy targets a conservative financial profile
Commitment towards maintaining low leverage and a conservative capital structure Flexibility to manage successfully through shipping cycles and take advantage of strategic
growth opportunities
1
2
3
4

26
2626
Appendix
27
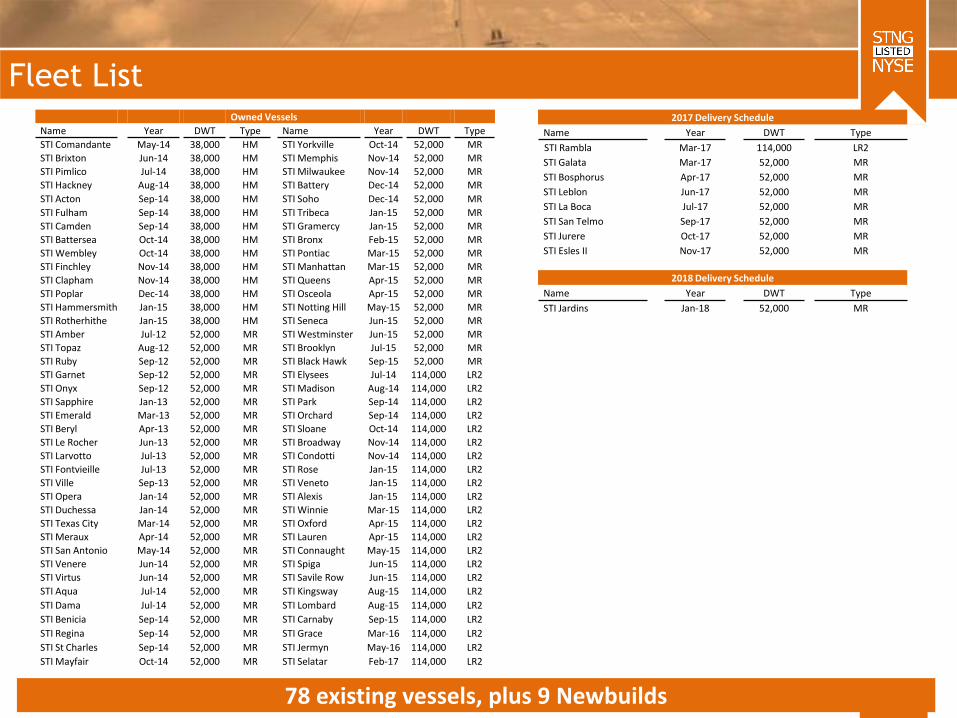
Fleet List
78 existing vessels, plus 9 Newbuilds
2017 Delivery Schedule
Name Year DWT Type
STI Rambla Mar-17 114,000 LR2
STI Galata Mar-17 52,000 MR
STI Bosphorus Apr-17 52,000 MR
STI Leblon Jun-17 52,000 MR
STI La Boca Jul-17 52,000 MR
STI San Telmo Sep-17 52,000 MR
STI Jurere Oct-17 52,000 MR
STI Esles II Nov-17 52,000 MR
Owned Vessels
Name Year DWT Type Name Year DWT Type
STI Comandante May-14 38,000 HM STI Yorkville Oct-14 52,000 MR
STI Brixton Jun-14 38,000 HM STI Memphis Nov-14 52,000 MR
STI Pimlico Jul-14 38,000 HM STI Milwaukee Nov-14 52,000 MR
STI Hackney Aug-14 38,000 HM STI Battery Dec-14 52,000 MR
STI Acton Sep-14 38,000 HM STI Soho Dec-14 52,000 MR
STI Fulham Sep-14 38,000 HM STI Tribeca Jan-15 52,000 MR
STI Camden Sep-14 38,000 HM STI Gramercy Jan-15 52,000 MR
STI Battersea Oct-14 38,000 HM STI Bronx Feb-15 52,000 MR
STI Wembley Oct-14 38,000 HM STI Pontiac Mar-15 52,000 MR
STI Finchley Nov-14 38,000 HM STI Manhattan Mar-15 52,000 MR
STI Clapham Nov-14 38,000 HM STI Queens Apr-15 52,000 MR
STI Poplar Dec-14 38,000 HM STI Osceola Apr-15 52,000 MR
STI Hammersmith Jan-15 38,000 HM STI Notting Hill May-15 52,000 MR
STI Rotherhithe Jan-15 38,000 HM STI Seneca Jun-15 52,000 MR
STI Amber Jul-12 52,000 MR STI Westminster Jun-15 52,000 MR
STI Topaz Aug-12 52,000 MR STI Brooklyn Jul-15 52,000 MR
STI Ruby Sep-12 52,000 MR STI Black Hawk Sep-15 52,000 MR
STI Garnet Sep-12 52,000 MR STI Elysees Jul-14 114,000 LR2
STI Onyx Sep-12 52,000 MR STI Madison Aug-14 114,000 LR2
STI Sapphire Jan-13 52,000 MR STI Park Sep-14 114,000 LR2
STI Emerald Mar-13 52,000 MR STI Orchard Sep-14 114,000 LR2
STI Beryl Apr-13 52,000 MR STI Sloane Oct-14 114,000 LR2
STI Le Rocher Jun-13 52,000 MR STI Broadway Nov-14 114,000 LR2
STI Larvotto Jul-13 52,000 MR STI Condotti Nov-14 114,000 LR2
STI Fontvieille Jul-13 52,000 MR STI Rose Jan-15 114,000 LR2
STI Ville Sep-13 52,000 MR STI Veneto Jan-15 114,000 LR2
STI Opera Jan-14 52,000 MR STI Alexis Jan-15 114,000 LR2
STI Duchessa Jan-14 52,000 MR STI Winnie Mar-15 114,000 LR2
STI Texas City Mar-14 52,000 MR STI Oxford Apr-15 114,000 LR2
STI Meraux Apr-14 52,000 MR STI Lauren Apr-15 114,000 LR2
STI San Antonio May-14 52,000 MR STI Connaught May-15 114,000 LR2
STI Venere Jun-14 52,000 MR STI Spiga Jun-15 114,000 LR2
STI Virtus Jun-14 52,000 MR STI Savile Row Jun-15 114,000 LR2
STI Aqua Jul-14 52,000 MR STI Kingsway Aug-15 114,000 LR2
STI Dama Jul-14 52,000 MR STI Lombard Aug-15 114,000 LR2
STI Benicia Sep-14 52,000 MR STI Carnaby Sep-15 114,000 LR2
STI Regina Sep-14 52,000 MR STI Grace Mar-16 114,000 LR2
STI St Charles Sep-14 52,000 MR STI Jermyn May-16 114,000 LR2
STI Mayfair Oct-14 52,000 MR STI Selatar Feb-17 114,000 LR2
2018 Delivery Schedule
Name Year DWT Type
STI Jardins Jan-18 52,000 MR

28
Largest Shareholders
Source: Nasdaq/Bloomberg, February 2017
# Holder %
1 Wellington Management Company 11.5%
2 Dimensional Fund Advisors 8.2%
3 Fidelity Management & Research Company 4.1%
4 Putnam Investment Management 4.0%
5 The Vanguard Group 3.5%
6 Daruma Capital Management 3.5%
7 BlackRock Fund Advisors 3.5%
8 Millennium Management 2.3%
9 Investec Asset Management 2.3%
10 Baron Capital Management 2.0%
11 Boston Partners Global Investor 1.9%
12 Comerica Bank (Asset Management) 1.8%
13 State Street Global Advisors 1.7%
14 Avenue Capital Management II 1.7%
15 Northern Trust Investments 1.5%
16 Tricadia Capital Management 1.2%
17 American Century Investment Management 1.1%
18 Bank of America Merrill Lynch 1.1%
19 Numeric Investors 1.1%
20 Hosking Partners 1.0%
29
Thank you!
www.scorpiotankers.com