Outline Brief Introduction to Fuel Cells, Hydrogen ... · Brief Introduction to Fuel Cells,...
12
1 Brief Introduction to Fuel Cells, Hydrogen Production and Storage Jens Oluf Jensen Summer School on Materials for the Hydrogen Society, University of Iceland in Reykjavik, Iceland , June 26. to June 30. 2006 Materials Science Group, Department of Chemistry, Technical University of Denmark, Kemitorvet, building 207, DK-2800 Lyngby, Denmark Outline Electrolysis Reforming Microbial Thermal Photolysis Production Transmission Storage Intermediate Conversion Fuel cells (electr.) IC engines (mech.) Burners (heat) Energy Energy Fuel Cells IRD Fuel Cells A/S Extraction of the energy H 2 +½O 2 → H 2 O H O e - H → H + O → O 2- e - Oxidation Reduction
Transcript of Outline Brief Introduction to Fuel Cells, Hydrogen ... · Brief Introduction to Fuel Cells,...

1
Brief Introduction to Fuel Cells,Hydrogen Production and Storage
Jens Oluf Jensen
Summer School on Materials for the Hydrogen Society,University of Iceland in Reykjavik, Iceland , June 26. to June 30. 2006
Materials Science Group, Department of Chemistry, Technical University of Denmark,Kemitorvet, building 207, DK-2800 Lyngby, Denmark
Outline
Electrolysis
Reforming
Microbial
Thermal
Photolysis
Production
Transmission
Storage
Intermediate Conversion
Fuel cells (electr.)
IC engines (mech.)
Burners (heat)
Energy Energy
Fuel Cells
IRD Fuel Cells A/S
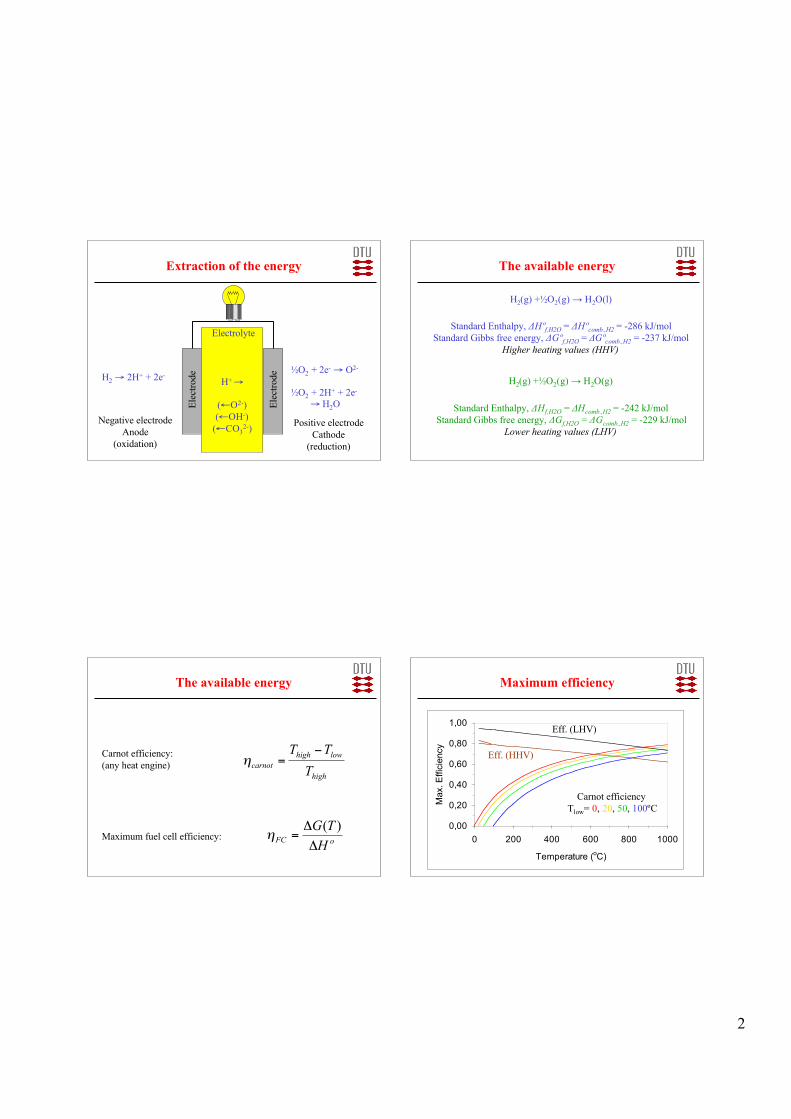
Extraction of the energy
H2 +½O2 → H2O
H Oe-
H → H+ O → O2-
e-
Oxidation Reduction
2
Extraction of the energy
H2 → 2H+ + 2e-½O2 + 2e- → O2-
½O2 + 2H+ + 2e- → H2O
H+ →
(←O2-)(←OH-)
(←CO32-)
Electrolyte
Elec
trode
Negative electrodeAnode
(oxidation)
Positive electrodeCathode
(reduction)
Elec
trode
The available energy
H2(g) +½O2(g) → H2O(l)
Standard Enthalpy, ΔHºf,H2O = ΔHºcomb.,H2 = -286 kJ/molStandard Gibbs free energy, ΔGºf,H2O = ΔGºcomb.,H2 = -237 kJ/mol
Higher heating values (HHV)
H2(g) +½O2(g) → H2O(g)
Standard Enthalpy, ΔHf,H2O = ΔHcomb.,H2 = -242 kJ/molStandard Gibbs free energy, ΔGf,H2O = ΔGcomb.,H2 = -229 kJ/mol
Lower heating values (LHV)
The available energy
Maximum fuel cell efficiency:
Carnot efficiency:(any heat engine)
high
lowhigh
carnotT
TT !="
oFC
H
TG
!
!=
)("
Maximum efficiency
0,00
0,20
0,40
0,60
0,80
1,00
0 200 400 600 800 1000
Temperature (oC)
Max. E
ffic
iency
Carnot efficiencyTlow= 0, 20, 50, 100ºC
Eff. (LHV)
Eff. (HHV)

3
The cell voltage
V23.1=!"
=nF
GEMax. cell voltage: at 25ºC, 1 bar
n = no. of electrons, F = 96485 C/mol (Faradays constant)ΔG, dim: energy/mol = potential·charge/mol
0
50
100
150
200
250
300
0 200 400 600 800 1000
Temperature (oC)
-_G
, -_
H (
kJ/m
ol)
0
0,2
0,4
0,6
0,8
1
1,2
1,4
Cell
voltage (
V)
The theoretical cell voltage
ΔH
ΔGVoltage
Voltage losses
Polarization of electrodes (kinetic or activation losses)At the catalysts
Ohmic losses (IR losses)Mainly in the electrolyte
Mass transport lossesIn the electrode pores
0
0,2
0,4
0,6
0,8
1
1,2
0 0,5 1 1,5 2
Current density (A/cm2)
Voltage (
V)
The polarization curve
Polarization curve
Ideal voltage (25°C)

4
0
0,2
0,4
0,6
0,8
1
1,2
0 0,5 1 1,5 2
Current density (A/cm2)
Voltage (
V)
The polarization curve
Ohmic part
Chargetransfer
part
Mass transportpart
Cross over
0
0.2
0.4
0.6
0.8
1
1.2
1.4
0 0.5 1 1.5 2
Current density (A/cm2)V
oltage (
V)
0
10
20
30
40
50
60
70
80
90
100
Co
nvers
ion
eff
icie
ncy (
%)
The heat evolved
ΔH(T) HHV (LHV could have been chosen )
Electricalenergy
Heat evolved
Types of fuel cells
Type Abrev. Temp. Electrolyte Low temperature systemsAlkaline FC AFC 60-80°C aq. KOHPolymer FC PEMFC 60- 80°C Polymer Direct methanol FC DMFC 60- 80°C PolymerPhosphoric acid FC PAFC 200°C H3PO4
High temperature systemsMolten carbonate FC MCFC 650°C Molten saltSolid oxide FC SOFC 700-1000°C Ceramic
Types of fuel cells
Larminie and Dicks. Fuel Cell Systems Explained 2. ed. Wiley 2003

5
Hydrogen Production
Electrolysis Reforming4% 96%
Reforming
Steam reforming (SR)
(methane)CH4 + H2O → CO + 3H2
Highly endothermic ⇒ Use high temperatureΔN(gas) = 2 ⇒ use low pressure
Water gas shift (WGS)
CO + H2O → CO2 + H2
Exothermic ⇒ use low temperature
Reforming techniques
Key issue: how to provide the heat for reforming
1. Burn some fuel1. Primary fuel (e.g.methane, methanol)2. Anode off gas from fuel cell
2. Waste heat from elsewhere1. From fuel cell2. From elsewhere
Reforming techniques
1. Steam reforming (SR) CH4 + H2O → 3H2 + COHeat from external burner
2. Partial oxidation (POX)CH4 + ½O2 → CO + 2H2 (exothermic)1200-1500°C without catalyst(sulphur tolerant)Alternatively catalytic POX (CPO) at lover temp.
3. Autothermal reforming (ATR)A combination of 1 and 2 (heat balanced)CH4 + aO2 + bH2O → cCO + dH2
6
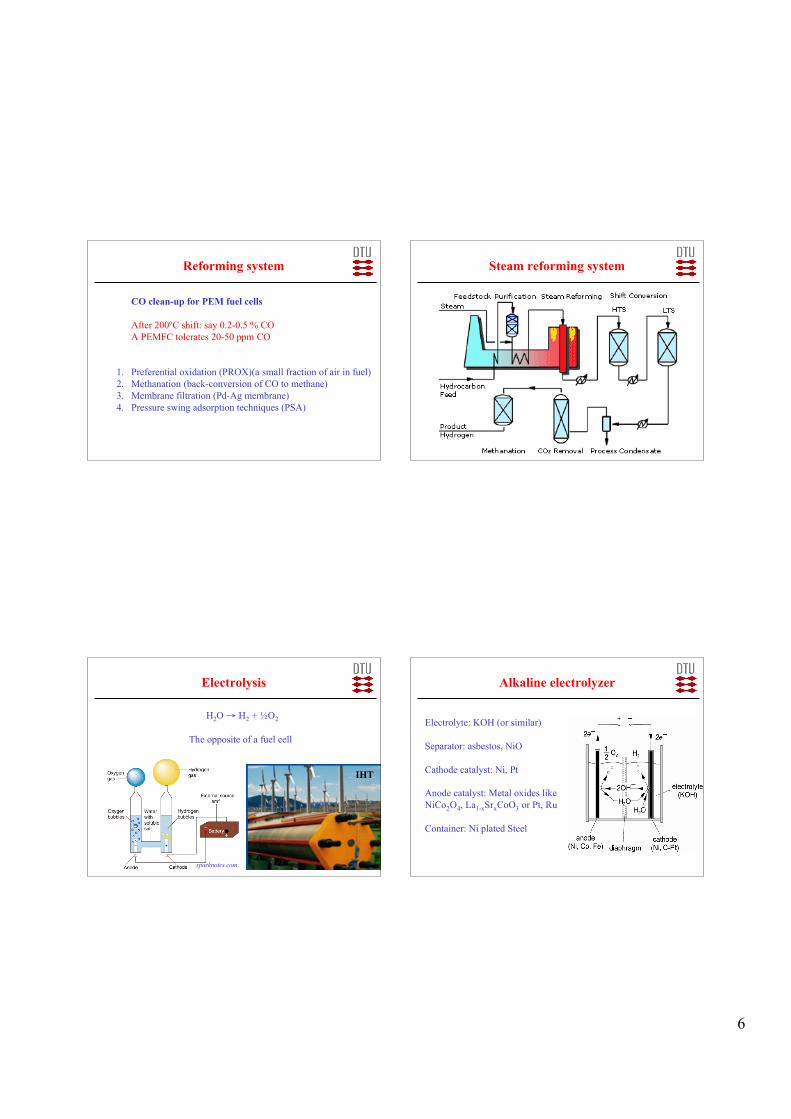
Reforming system
CO clean-up for PEM fuel cells
After 200ºC shift: say 0.2-0.5 % COA PEMFC tolerates 20-50 ppm CO
1. Preferential oxidation (PROX)(a small fraction of air in fuel)2. Methanation (back-conversion of CO to methane)3. Membrane filtration (Pd-Ag membrane)4. Pressure swing adsorption techniques (PSA)
Steam reforming system
Electrolysis
sparknotes.com
H2O → H2 + ½O2
The opposite of a fuel cell
IHT
Alkaline electrolyzer
Electrolyte: KOH (or similar)
Separator: asbestos, NiO
Cathode catalyst: Ni, Pt
Anode catalyst: Metal oxides like NiCo2O4, La1-xSrxCoO3 or Pt, Ru
Container: Ni plated Steel

7
0
50
100
150
200
250
300
0 200 400 600 800 1000
Temperature (oC)
_G
, _
H (
kJ/m
ol)
0
0,2
0,4
0,6
0,8
1
1,2
1,4
Cell
voltage (
V)
The theoretical cell voltage
ΔH
ΔGVoltage
El.
Heat
The thermo-neutral potential
H2O(l) → H2(g) + ½O2(g)
),(48.1 waterliquidHHVVnF
HEtn =
!=
),(25.1 vapourwaterLHVVnF
HEtn =
!=
Endothermic
Types of electrolyzers
SOEC (700-1000ºC)SOFCSolid Oxide
(MCEC)MCFCM. Carbonate
(PAEC)PAFCPhosph. acid
PEMEC (60-150ºC)PEMFCPolymer
AEC (60-150ºC)AFCAlkaline
Electrolyzer cellsFuel cells
Electrolysis

8
Electrolysis PEM and Solid oxide electrolyzers
PEMEC, Proton Energy Systems Inc HOGEN GC 600 (Lab gasses)
(Risø)
SOEC, Risø DTUUnder development
Hydrogen Storage Ways of storing hydrogen
Physical storage
Easy access
Chemical storage
DecompositionReforming
Liquid20 K
Chemicalcompounds,
Organics,NH3
Metalhydrides
Adsorbedlarge surface
AbsorbedMetal
hydrides
Compressed200-700 bar

9
Compression
Advantages200-300 bar well-known technology
700-800 bar possible in composite tanks
DisadvantagesBulky
Energy to compression (~10%)Safety
Compression, density
0
10
20
30
40
50
60
70
80
0 200 400 600 800 1000
Pressure (bar)
De
ns
ity
(k
g/m
3) Liquid H2
Idealgas
Real gas
Composite tanks
From Dynetek

10
Composite tanks
Wrapping a composite tank
From Quantum Technologies
Liquid H2
AdvantagesDenser that compressed gasKeeps cold by evaporation
DisadvantagesExpensive
Energy to cooling andcondensation (30-40%)
Self dischargeSafety
AdvantagesPossibly denser than compressed H2
DisadvantagesEnergy to cooling and condensation
Capacity not as high as liquid H2Safety
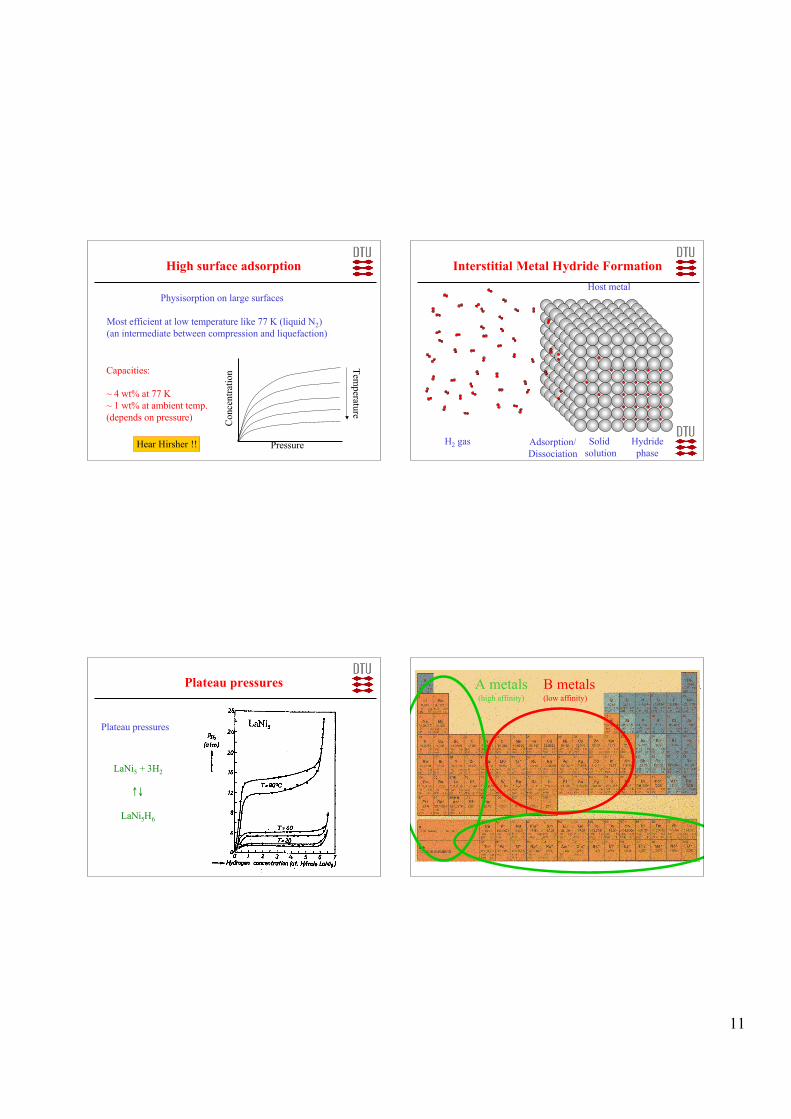
High surface adsorption High surface adsorption
Carbon materials: Active carbon (2000 m2/g)NanotubesGraphite ??
Zeolites:
Other high surface: Metal organics
H:C 1:1 ⇒ 8.3 wt%
11
High surface adsorption
Physisorption on large surfaces
Most efficient at low temperature like 77 K (liquid N2)(an intermediate between compression and liquefaction)
Con
cent
ratio
n
PressureTem
perature
Capacities:
~ 4 wt% at 77 K~ 1 wt% at ambient temp.(depends on pressure)
Hear Hirsher !!
Interstitial Metal Hydride Formation
H2 gas
Host metal
Hydridephase
Solid solution
Adsorption/Dissociation
Plateau pressures
Plateau pressures
LaNi5 + 3H2
↑↓
LaNi5H6
periodic table, AB5
Magnesium
A metals(high affinity)
B metals(low affinity)

12
Well known hydrides
Room temperature
LaNi5H6 1.4 w% 2 bar (AB5)
MmNi3.6Co0.7Mn0.4Al0.3Hx 1.0 w% <1 bar (AB5)
CaNi5H6 1.8 w% 0.5 bar (AB5)
TiFeH2 1.9 w% 3 bar (AB)
300°C
Mg2NiH4 3.6 w% 1 bar (A2B)
MgH2 7.6 w% 1 bar
periodic table, AB5
Magnesium
Complex hydrides
Center ionMHx
–yCounter ion
M+z
Formula w%NaAlH4 6.9LiAlH4 9.5NaBH4 9.6LiBH4 15.5Mg2NiH4 3.6
periodic table, AB5
Magnesium
Potential elements(no interstitial hydrides)
Higher capacity, lighter hosts
Li3N + 2H2 ⇒ Li2NH + LiH + H2 ⇔ LiNH2 + 2LiH
Total 11.5 wt% stored (2. step rev.: 7%)
Chen et al. Nature 420: 302-304 (2002)