
OSA UK: Retailer - Supplier Team Work, Results & Learning · OSA UK: Retailer - Supplier Team Work,...
24
© IGD © All rights reserved. No part of this presentation may be reproduced or transmitted without the prior permission of IGD. 1 OSA UK: Retailer - Supplier Team Work, Results & Learning James Tupper, ECR Learning & Change Manager, IGD 10.10 – 10.35, 24 th September 2008, ECR Italy OSA DAY, IBM Forum Milano – Circonvallazione Idroscalo - Segrate
-
Upload
truongkhanh -
Category
Documents
-
view
216 -
download
0
Transcript of OSA UK: Retailer - Supplier Team Work, Results & Learning · OSA UK: Retailer - Supplier Team Work,...

© IGD© All rights reserved. No part of this presentation may be reproduced or transmitted without the prior permission of IGD. 1
OSA UK: Retailer - Supplier Team Work, Results & Learning
James Tupper, ECR Learning & Change Manager, IGD
10.10 – 10.35, 24th September 2008, ECR Italy OSA DAY, IBM Forum Milano – Circonvallazione Idroscalo - Segrate

© IGD© All rights reserved. No part of this presentation may be reproduced or transmitted without the prior permission of IGD. 2
On-Shelf Availability Credentials
• Supply Chain Analysis Hot Topic– Supplier Service Levels
• Established Research – Annual Retail Logistics Survey
• ECR Availability Workgroups– Superstore and Convenience Surveys
• IGD Collaborative Programmes– In UK, Ireland and Sweden

© IGD© All rights reserved. No part of this presentation may be reproduced or transmitted without the prior permission of IGD. 3
ECR UK Availability Surveys
• Physical audit every two months
– Is it on sale?
– If not, is there a Self Edge Label (SEL)?
• Convenience
– 50 Stock Keeping Units (SKUs)
– 100 stores including Tesco Express, Sainsbury’s Local, Coop, Somerfield, Mace, Premier
• Superstore
– 200 SKUs across 11 categories
– 200 stores across Asda, Tesco, Sainsbury’s, Morrisons, Waitrose, Somerfield, Coop
• Results published within a fortnight
– Drill-downs according to company access rights

© IGD© All rights reserved. No part of this presentation may be reproduced or transmitted without the prior permission of IGD. 4
ECR UK Availability Survey

© IGD© All rights reserved. No part of this presentation may be reproduced or transmitted without the prior permission of IGD. 5
Is the product on shelf? NoYes
Root Cause 1: De-listed by store staff
Is the product ranged? NoYes
?Is there a Shelf Edge Label? NoYes
Root Cause 4:Phantom
stock
Is stock fit for sale? NoYes
Is there stock at back of store? NoYes
Root Cause 3:In-store
damages or out-of-date
stock
Root Cause 2:Replenishment
discipline
Source: ECR UK Availability Survey, Convenience with Root Cause Analysis, 2006
Root Cause 5: Spike in demand
Root Cause 6: Error in order
placement
Root Cause 7: Delivery
issues (miss-picks,
transit damages)
Root Cause 8: Unable to discuss
with staff in-store
Ask Store Staff for reasons for shortage
Measure & Understand
Do systems say there should be stock in-store? NoYes

© IGD© All rights reserved. No part of this presentation may be reproduced or transmitted without the prior permission of IGD. 6
ECR Europe OSA Initiative
Source: ECR Europe blue book Optimal Shelf Availability - Increasing shopper satisfaction at the moment of truth

© IGD© All rights reserved. No part of this presentation may be reproduced or transmitted without the prior permission of IGD. 7
Top Root Causes of Out-Of-Stocks
12%Other11%Inventory inaccuracy
12%Shelf replenishment
30%Delisting by store staff35%Store ordering1st
2nd
3rd
4th
Inventory inaccuracy• Inaccurate book stock• Damages• Stolen goods
Self replenishment• No time for staff
to refill shelves• Poor back store
operations• Lack of
shelf edge label• No Out-Of-Stock checks
Store ordering• Last order
generation too late• Incorrect
order placement• Inaccurate forecast• Incorrect process of
order generation
Source: ECR Europe blue book Optimal Shelf Availability - Increasing shopper satisfaction at the moment of truth

© IGD© All rights reserved. No part of this presentation may be reproduced or transmitted without the prior permission of IGD. 8
• Off sales
• Substitutions
• Increased sales on similar products
• Bigger orders
• Forecast errors
Shorts drive big disturbances up- and down-stream

© IGD© All rights reserved. No part of this presentation may be reproduced or transmitted without the prior permission of IGD. 9
Possible to improve performance levels by
Senior ManagementSenior Management
A / PA / P R & DR & D
FinanceFinance MISMIS
Manufacturing& DistributionsManufacturing& Distributions
CustomerService
CustomerService
MarketingMarketing
SalesRep
SalesRep
Senior ManagementSenior Management
PlanningPlanning
FinanceFinance
A / PA / P
MISMIS
Supply ChainSupply Chain
Store OperationsStore Operations
MerchandisingMerchandising
BuyerBuyer
• Working together with colleagues and trading partners
• Building and asserting understanding
• Challenge the status quo
• Cut through confusion
• Making small changes in – the timing of –behaviour

© IGD© All rights reserved. No part of this presentation may be reproduced or transmitted without the prior permission of IGD. 10
Collaborate and
• deliver results and apply learnings to other areas of the business
• win short-term gains and to motivate others to join in the change process
• ensure actions are based on evidence; not myth & legend or gut-feel alone
IGD Programme
Phase 1
Measure &Understand
Phase 2 Phase 3
Redesign& Pilot
Roll-out& Sustain
Access to reference material
Set-up
On-Board
MeetingWeek 1
Progress Progress Evaluate
Meeting Week 8
Meeting Week 16
Meeting Week 24

© IGD© All rights reserved. No part of this presentation may be reproduced or transmitted without the prior permission of IGD. 11
Collaborative Programmes
Improve shopper service levels, lose less and sell moreSave on crisis-driven time and technology solutionsUse simple tools created and proven by retailers with suppliers
Hard business benefits
Strengthen cross-functional and trading partner relationshipsCapture and share learningsExperience success and develop the habit of making it happen
You will
Phase 1
Measure &Understand
Phase 2 Phase 3
Redesign& Pilot
Roll-out& Sustain
Access to reference material
Set-up
On-Board
MeetingWeek 1
Progress Progress Evaluate
Meeting Week 8
Meeting Week 16
Meeting Week 24

© IGD© All rights reserved. No part of this presentation may be reproduced or transmitted without the prior permission of IGD. 12
What Sponsors and Participants Say
"This is amazing. We have been trying to collaborate on this for years. Fantastic
progress has now been made in just two months"
"Working with suppliers in a way that we have not
been able to achieve before"
"I see all the people taking part have grown in themselves and their knowledge and
understanding is significantly better as a result of the programme"
"No one is dominating: IGD is facilitating a
‘neutral ground’"
"IGD’s facilitation fee is dwarfed by
the benefits gained from the
programme"
"It hadn’t been on the radar screen. Now we
have made 110% progress and we have
lots of momentum"

© IGD© All rights reserved. No part of this presentation may be reproduced or transmitted without the prior permission of IGD. 13
ToFrom
March2008
June2007
Sept2007
Nov2006
Jan2007
July2006
May 2006
Sept2005
July 2005
Feb 2005
April 2005
Sept 2004
Sept 2004
Nov 2003
Extra, quicker, easier and more sustainable and scalable results achievedby retailer-supplier cross-functional teams working and learning together
June 2008
Jan 2008

© IGD© All rights reserved. No part of this presentation may be reproduced or transmitted without the prior permission of IGD. 14
No rocket science
Without the programme– Events loaded late with little time for
planning – No time for suppliers to manage stock
build – Latest forecast information not always
shared with suppliers – Incorrect uplift % used – No first day sales information used – High inventory needed at start of event – No contingency plans for higher than
expected demand – No review process – No history – Potential availability issues – No store confidence – Peak & trough demand pattern
With the programme– New joint seasonal events
management routines – Improved agenda for seasonal events
management meeting – New routine for buyers to load event
and accurate uplift % – Use of first day sales predictor – New volume tracking and review tool
© IGD© All rights reserved. No part of this presentation may be reproduced or transmitted without the prior permission of IGD. 15
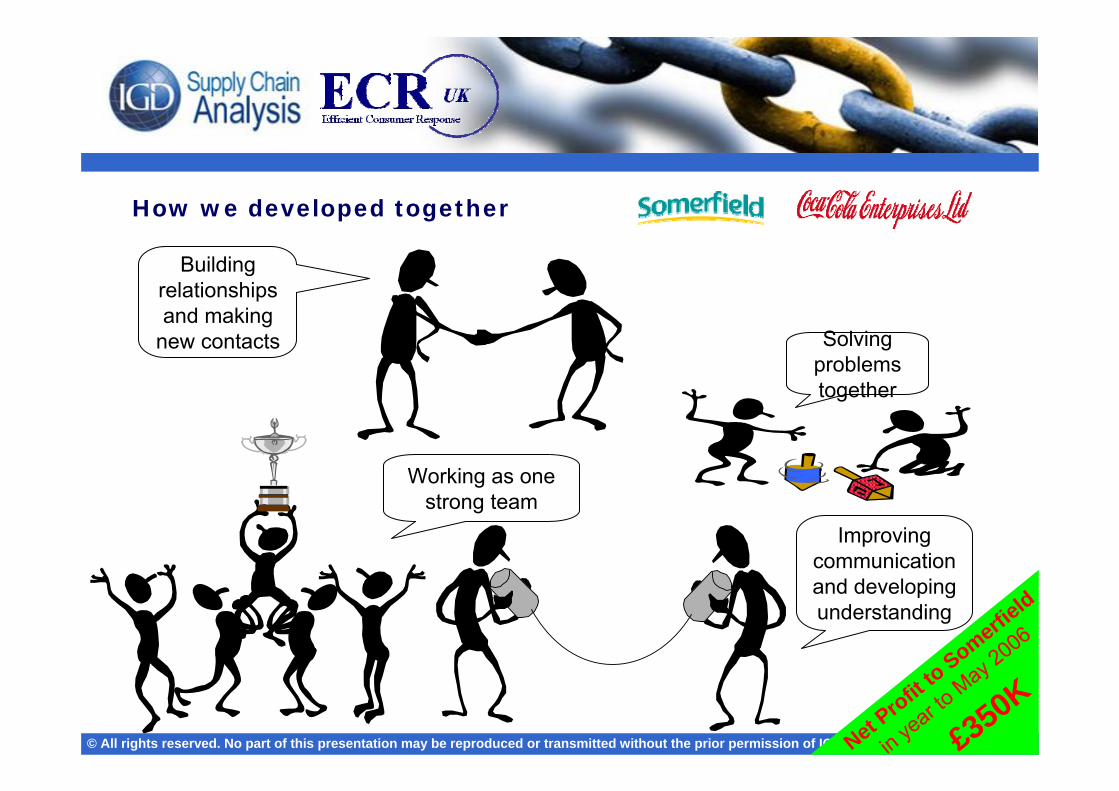
How we developed together
Building relationships and making
new contacts Solving problems together
Improving communication and developing understanding
Working as one strong team
Net Profit
to Somerfield
in year to
May 2
006
£350K

© IGD© All rights reserved. No part of this presentation may be reproduced or transmitted without the prior permission of IGD. 16
Cut through
“Within the time frame of the programme designs had to be based on assets availability from the total industry rather than waiting until 2006 for optimum [Coca-Cola] solutions tailored to Superquinn”
“Regular reporting back to other teams, IGD facilitators and sponsor directors on progress, measures and results maintained the ambitious pace”
“As a result of this ECR Initiative, the category is growing 30% in Superquinn. This is 50% faster than Impulse across Supermarkets”
“On first cut we found it hard to find any issues - Availability looked good”
“If it were not for having to report to others on the initiative we might have walked away after the 1st audits”
“Challenging information and digging deeper leads to real insight”
Measurements in Phase 1 OSA
1st Internal audits 3 times a day in 4 stores over 2 weeks 98%
2nd Lost sales analysis of EPOS data by SKU by day over 2 weeks
Take Home 94%
Multipacks 94%
Impulse 80%
New Items 71%
3rd Independent audit in 13 stores and top 20 Impulse SKU’s 77%

© IGD© All rights reserved. No part of this presentation may be reproduced or transmitted without the prior permission of IGD. 17
Phase 1
Measure &Understand
Phase 2 Phase 3
Redesign& Pilot
Access to reference material
Set-upMeeting25 June
Progress
Meeting 19 Sept
Meeting 28 Nov
Roll-out& Sustain
On-Board
Trading partners helping each other get real (2006/7)
In-Store Availability (retailer order system) On-Shelf Availability (supplier physical count)
90%
92%
94%
96%
98%
100%
Wk 32 Wk 36 Wk 40
Measure & Understand• Forecasts often too high / too low• Stock-on-hand often too much / too littleBefore promotion• Forecasts often blanket across a range• Limited use of historical or lost sales data• Unplanned adjustment for end rankingDuring promotion• Lack of formal communication with store
ordering or supplier re forecast volumes • Intervention rareAfter promotion• infrequent reviews

© IGD© All rights reserved. No part of this presentation may be reproduced or transmitted without the prior permission of IGD. 18
Phase 1
Measure &Understand
Phase 2 Phase 3
Redesign& Pilot
Access to reference material
Set-upMeeting25 June
Progress
Meeting 19 Sept
Meeting 28 Nov
Roll-out& Sustain
On-Board
Redesign & Pilot and Roll-out & Sustain
• use a jointly developed Position Sheet to track sales, stocks & SL by line by week
• regular communicate to compare actual vs. forecast and agree corrective action
• use first and fifth day sales results and a simple promotional forecasting tool
• build up database that captures promotional history including
– accurate base sales
– impact of competing offers
– implementation in store
– level of support received
Trading partners helping each other get real (2006/7)
In-Store Availability (retailer order system) On-Shelf Availability (supplier physical count)
90%
92%
94%
96%
98%
100%
Wk 32 Wk 36 Wk 40

© IGD© All rights reserved. No part of this presentation may be reproduced or transmitted without the prior permission of IGD. 19
Measure & Understand
• EPOS analysis of 88 SKUs over 6 months identified a Core Range of 32
• An independent agency did On-Shelf Availability audit over a 6 week period
• Results– Average OSA 88%
– Core range OSA 78%
• Key reasons for off sales– spike in demand 84%
– de-listed by store staff 8.5%
– replenishment discipline 7.5%
Redesign & Pilot
• New Planogram implemented and monitored by Eurospar & Allied Foods
• Self audits were carried out once a day in each of four pilot stores
• Results– Average OSA 92%
– Core range OSA 100%
• Key reasons for off sales– delivery issues 55%
– error in order placement 39%
– unable to talk to staff 4%
– spike in demand 2%

© IGD© All rights reserved. No part of this presentation may be reproduced or transmitted without the prior permission of IGD. 20
Roll Out & Sustain – Store Buy-in
• The new frozen pizza planogram was extended to remaining 37 Eurospars
• Category management insert in wholesaler’s Eurospar Success Magazines
• Eurospar Xtranet site was used to communicate to retailers
• Pilot Store Testimonials were used to help get retailer “Buy-In” to the whole process
• Both wholesaler and supplier resources were used to audit Eurospars

© IGD© All rights reserved. No part of this presentation may be reproduced or transmitted without the prior permission of IGD. 21
Promotions Management
What changed in Store?• Set up day now Tuesday• Visible segregation of promo stock• Set-up process ‘checklist’ in every WAGJLL booklet• Crucial data fields correctly maintained
What changed in Stock Flow?• Fixed delivery days• Changes to the initial allocation rules• Promotional stock ‘protected’
What changed in Asda House?• Decision criteria • Use data to inform decision• 12 week critical path• Clarified Accountability
Average first day in-stock
improved from 98.3%
to 99.2%
50% reduction ofinitial allocations for large Stores

© IGD© All rights reserved. No part of this presentation may be reproduced or transmitted without the prior permission of IGD. 22
96%
97%
98%
99%
100%
Wk 15 Wk 19 Wk 23 Wk 27 Wk 31 Wk 35 Wk 39 Wk 43 Wk 47 Wk 51
Inbound Service Level from Chilled Supplier
Trading partners helping each other get real (2007/8)
• SL ↑ 1+% points
• OSA ↑3% points
• Waste ↓90%
• Dispatch £ ↓ 70%
Phase 1
Measure &Understand
Phase 2 Phase 3
Redesign& Pilot
Roll-out& Sustain
Access to reference material
Set-up
On-Board
Meeting27 June
Progress Progress Evaluate
Meeting 4 Sept
Meeting 17 Oct
Meeting 7 March

© IGD© All rights reserved. No part of this presentation may be reproduced or transmitted without the prior permission of IGD. 23
The trading partners have 1. harmonised process design2. installed the improved
processes across functions
• Get things right first time
• Reduce fire fighting
• Reduce escalation
• Reduce issue resolution costs

© IGD© All rights reserved. No part of this presentation may be reproduced or transmitted without the prior permission of IGD. 24
OSA UK: Retailer - Supplier Team Work, Results & Learning
James Tupper, ECR Learning & Change Manager, IGD
10.10 – 10.35, 24th September 2008, ECR Italy OSA DAY, IBM Forum Milano – Circonvallazione Idroscalo - Segrate