Orphan and gene related CpG Islands follow power-law-like distributions in several genomes: Evidence...
13
Orphan and gene related CpG Islands follow power-law-like distributions in several genomes: Evidence of function-related and taxonomy-related modes of distribution Giannis Tsiagkas a , Christoforos Nikolaou b , Yannis Almirantis a, * a Institute of Biosciences and Applications, National Center for Scientific Research “Demokritos”, 15310 Athens, Greece b Computational Genomics Group, Department of Biology, University of Crete, 71409 Heraklion, Greece ARTICLE INFO Article history: Available online 16 September 2014 Keywords: CpG-Islands CGIs Orphan CpG-Islands CpG dinucleotide Power-law-like distribution Genome evolution ABSTRACT CpG Islands (CGIs) are compositionally defined short genomic stretches, which have been studied in the human, mouse, chicken and later in several other genomes. Initially, they were assigned the role of transcriptional regulation of protein-coding genes, especially the house-keeping ones, while more recently there is found evidence that they are involved in several other functions as well, which might include regulation of the expression of RNA genes, DNA replication etc. Here, an investigation of their distributional characteristics in a variety of genomes is undertaken for both whole CGI populations as well as for CGI subsets that lie away from known genes (gene-unrelated or “orphan” CGIs). In both cases power-law-like linearity in double logarithmic scale is found. An evolutionary model, initially put forward for the explanation of a similar pattern found in gene populations is implemented. It includes segmental duplication events and eliminations of most of the duplicated CGIs, while a moderate rate of non-duplicated CGI eliminations is also applied in some cases. Simulations reproduce all the main features of the observed inter-CGI chromosomal size distributions. Our results on power-law-like linearity found in orphan CGI populations suggest that the observed distributional pattern is independent of the analogous pattern that protein coding segments were reported to follow. The power-law-like patterns in the genomic distributions of CGIs described herein are found to be compatible with several other features of the composition, abundance or functional role of CGIs reported in the current literature across several genomes, on the basis of the proposed evolutionary model. ã 2014 Elsevier Ltd. All rights reserved. 1. Introduction Genomic CpG islands, in which CpG dinucleotides are abundant and non-methylated, have been initially detected experimentally and defined as short (hundreds of nucleotides-long) stretches in vertebrate genomes, thus offered as cleavable sites for mCpG- sensitive restriction enzymes (HTF islands, see e.g. Bird, 1986). As lengthy DNA sequences and whole genomes became progressively available, sequence-based definitions of CpG Islands (CGIs) and computational algorithms using a sliding window combined with threshold values for key quantities were put forward. Thresholds for sequence-based search of CGIs are considered for: (i) the minimal island length (L min ); (ii) the percentage of cytosine and guanine content (C + G, abbreviated in the following as CG%); and (iii) the observed over expected frequency of occurrence of the CpG dinucleotide (CpGo/e). Gardiner-Garden and Frommer (1987) introduced the first widely used set of thresholds (L min = 200 bp, CG > 50%, CpGo/e > 0.6; to which we will hereafter refer as “relaxed criteria”; bp stands for ‘base pairs’), while later, Takai and Jones (2002) used more conservative threshold values, named hereafter “stringent criteria” (L min = 500 bp, CG > 55%, CpGo/e > 0.65). In the following, these threshold choices will be abridged as G-G&F and T&J respectively. Alternatively, methods based on the degree of CpG dinucleotide clustering (Hackenberg et al., 2006; Glass et al., 2007) and on entropic edge detection (Luque-Escamilla et al., 2005) have also been introduced. In order to avoid false positives (e.g. due to high C + G Alu sequences in the human genome), especially when relaxed criteria are used, repeat-masking is usually applied before searching for CGIs. CGIs are widely accepted as markers for the existence of protein-coding genes, the promoter regions of which are usually proximal to or overlapping with the islands. Consequently, the search for CGIs was motivated by the need of detection of yet unannotated protein coding genes. Therefore, most of the * Corresponding author. Tel.: +30 2106503619; fax: +30 2106511767. E-mail address: [email protected] (Y. Almirantis). http://dx.doi.org/10.1016/j.compbiolchem.2014.08.013 1476-9271/ ã 2014 Elsevier Ltd. All rights reserved. Computational Biology and Chemistry 53 (2014) 84–96 Contents lists available at ScienceDirect Computational Biology and Chemistry journal homepage: www.elsevier.com/locate/compbiolchem
description
CpG Islands (CGIs) are compositionally defined short genomic stretches, which have been studied in thehuman, mouse, chicken and later in several other genomes. Initially, they were assigned the role oftranscriptional regulation of protein-coding genes, especially the house-keeping ones, while morerecently there is found evidence that they are involved in several other functions as well, which mightinclude regulation of the expression of RNA genes, DNA replication etc. Here, an investigation of theirdistributional characteristics in a variety of genomes is undertaken for both whole CGI populations aswell as for CGI subsets that lie away from known genes (gene-unrelated or “orphan” CGIs). In both casespower-law-like linearity in double logarithmic scale is found. An evolutionary model, initially putforward for the explanation of a similar pattern found in gene populations is implemented. It includessegmental duplication events and eliminations of most of the duplicated CGIs, while a moderate rate ofnon-duplicated CGI eliminations is also applied in some cases. Simulations reproduce all the mainfeatures of the observed inter-CGI chromosomal size distributions. Our results on power-law-likelinearity found in orphan CGI populations suggest that the observed distributional pattern isindependent of the analogous pattern that protein coding segments were reported to follow. Thepower-law-like patterns in the genomic distributions of CGIs described herein are found to be compatiblewith several other features of the composition, abundance or functional role of CGIs reported in thecurrent literature across several genomes, on the basis of the proposed evolutionary model.
Transcript of Orphan and gene related CpG Islands follow power-law-like distributions in several genomes: Evidence...

Computational Biology and Chemistry 53 (2014) 84–96
Contents lists available at ScienceDirect
Computational Biology and Chemistry
journal homepage: www.elsev ier .com/ locate /compbiolchem
Orphan and gene related CpG Islands follow power-law-likedistributions in several genomes: Evidence of function-related andtaxonomy-related modes of distribution
Giannis Tsiagkas a, Christoforos Nikolaou b, Yannis Almirantis a,*a Institute of Biosciences and Applications, National Center for Scientific Research “Demokritos”, 15310 Athens, GreecebComputational Genomics Group, Department of Biology, University of Crete, 71409 Heraklion, Greece
A R T I C L E I N F O
Article history:
Available online 16 September 2014Keywords:CpG-IslandsCGIsOrphan CpG-IslandsCpG dinucleotidePower-law-like distributionGenome evolution
* Corresponding author. Tel.: +30 210650E-mail address: [email protected]
http://dx.doi.org/10.1016/j.compbiolchem.21476-9271/ã 2014 Elsevier Ltd. All rights r
3619; fax:.gr (Y. Almi
014.08.013eserved.
A B S T R A C T
CpG Islands (CGIs) are compositionally defined short genomic stretches, which have been studied in thehuman, mouse, chicken and later in several other genomes. Initially, they were assigned the role oftranscriptional regulation of protein-coding genes, especially the house-keeping ones, while morerecently there is found evidence that they are involved in several other functions as well, which mightinclude regulation of the expression of RNA genes, DNA replication etc. Here, an investigation of theirdistributional characteristics in a variety of genomes is undertaken for both whole CGI populations aswell as for CGI subsets that lie away from known genes (gene-unrelated or “orphan” CGIs). In both casespower-law-like linearity in double logarithmic scale is found. An evolutionary model, initially putforward for the explanation of a similar pattern found in gene populations is implemented. It includessegmental duplication events and eliminations of most of the duplicated CGIs, while a moderate rate ofnon-duplicated CGI eliminations is also applied in some cases. Simulations reproduce all the mainfeatures of the observed inter-CGI chromosomal size distributions. Our results on power-law-likelinearity found in orphan CGI populations suggest that the observed distributional pattern isindependent of the analogous pattern that protein coding segments were reported to follow. Thepower-law-like patterns in the genomic distributions of CGIs described herein are found to be compatiblewith several other features of the composition, abundance or functional role of CGIs reported in thecurrent literature across several genomes, on the basis of the proposed evolutionary model.
ã 2014 Elsevier Ltd. All rights reserved.
1. Introduction
Genomic CpG islands, inwhich CpG dinucleotides are abundantand non-methylated, have been initially detected experimentallyand defined as short (hundreds of nucleotides-long) stretches invertebrate genomes, thus offered as cleavable sites for mCpG-sensitive restriction enzymes (HTF islands, see e.g. Bird, 1986). Aslengthy DNA sequences and whole genomes became progressivelyavailable, sequence-based definitions of CpG Islands (CGIs) andcomputational algorithms using a sliding window combined withthreshold values for key quantities were put forward. Thresholdsfor sequence-based search of CGIs are considered for: (i) theminimal island length (Lmin); (ii) the percentage of cytosine andguanine content (C +G, abbreviated in the following as CG%); and(iii) the observed over expected frequency of occurrence of the CpG
+30 2106511767.rantis).
dinucleotide (CpGo/e). Gardiner-Garden and Frommer (1987)introduced the first widely used set of thresholds (Lmin = 200bp,CG>50%, CpGo/e > 0.6; to which wewill hereafter refer as “relaxedcriteria”; bp stands for ‘base pairs’), while later, Takai and Jones(2002) used more conservative threshold values, named hereafter“stringent criteria” (Lmin =500bp, CG>55%, CpGo/e > 0.65). In thefollowing, these threshold choices will be abridged as G-G&F andT&J respectively. Alternatively, methods based on the degree ofCpG dinucleotide clustering (Hackenberg et al., 2006; Glass et al.,2007) and on entropic edge detection (Luque-Escamilla et al.,2005) have also been introduced. In order to avoid false positives(e.g. due to high C +G Alu sequences in the human genome),especially when relaxed criteria are used, repeat-masking isusually applied before searching for CGIs.
CGIs are widely accepted as markers for the existence ofprotein-coding genes, the promoter regions of which are usuallyproximal to or overlapping with the islands. Consequently, thesearch for CGIs was motivated by the need of detection of yetunannotated protein coding genes. Therefore, most of the

G. Tsiagkas et al. / Computational Biology and Chemistry 53 (2014) 84–96 85
introduced CGI finding algorithms were judged upon their abilityto find CGIs in the proximity of known genes (see e.g. Bird, 1987;Han and Zhao, 2008, 2009).
The functional character of a CGI is related to the condition thatits CpG dinucleotides are predominantly unmethylated. Genome-wide methylation data were not available until recently. The CpGdepletion of the vertebrate genome is explained on the basis ofheavy methylation and the consequent mutation of 5-methyl-cytosine to thymine, verified by the observed increase in TpG andCpA abundances and is extensively discussed in relation to CGIsevolution and function. See Bird (1986), Antequera (2003) andJabbari and Bernardi (2004), where however the opposite position(i.e. the independence of CpG deficiency and TpG, CpA excesson the level of DNA methylation) is held. The propensity of5-methylcytosine to quickly mutate to thymine has driven to theconjecture that the methylation is hindered in genomic sequenceswhere CpG frequency is close to the expected one, at least in thegerm line. This lack of methylation on specific locations may beseen as the result either of protection from point-mutations(mutational “cold spots”) or of purifying selection due to functionalroles which are fulfilled only if specific compositional traits arepreserved in the underlying sequences. CGIs cannot be generallyseen as mutational cold spots, as there are converging data thatmany CGIs in several lineages have been lost when they ceased tobe under purifying selection. These are retained for longevolutionary time in other species where they remain functional,e.g. in human andmouse genome comparisons; see Antequera andBird (1993), Matsuo et al. (1993).
After the systematic search for CGIs in the human and othergenomes using the simple sequence criteria described above,researchers attempted to introduce several forms of epigenomicinformation. Bock et al. (2007) used a method combining astandard slidingwindowalgorithmwith available epigenomic datafor human chromosomes 21 and 22. Tanay et al. (2007), based onhuman and chimpanzee genomes’ comparison, found regions withreduced CpG mutability, while the same domains largely coincidewith Polycomb-binding sites. Later on, Illingworth et al. (2010)provided a comprehensive list of CGIs in the human and mousegenomes based principally on methylation data. The mostimportant of this work’s observations was that there existnumerous “orphan” CpG Islands (i.e. not connected to a knownprotein-coding gene), independently of the method used for theirdetection. Illingworth and co-workers formulated a hypothesisaccording to which most of orphan CGIs are related to functionalpromoters of unknown genes, many of which could be functionalRNA genes. More recently, CGIs were shown to often coincide withOrigins of Replication (ORIs) thus suggesting their functional rolesmay extend beyond transcriptional regulation (Cayrou et al., 2011).Towhat extent the colocalization of CGI and origins of replication isdue to a direct causal link or an indirect effect mediated bypositional preferences of gene transcription start sites remains,nonetheless, unclear.
In previousworks (Sellis et al., 2007; Sellis and Almirantis, 2009;Klimopoulos et al., 2012) we have observed that distances betweentransposable elements (TE) belonging to the same family, as well as,distances between protein-coding segments (PCS) often follow“power-law-like” size distributions in entire chromosomes. Suchdistributions present extended linear regions in log–log scale (seeMethods).Ourprincipal resultherein is thatCGIs also, either studiedas entire populations or when only orphan islands are considered,follow power-law-like size distributions. We have put forward anevolutionary model, including biologically plausible steps, for thetemporal evolution of genomic components that are subjected topurifyingselection.Thismodel,whentestednumerically, isshowntosystematically generate power-law-like size distributions, like theones found in the CGI chromosomal distributions.
Here we investigate the large-scale genomic distribution of CpGIslands in several genomes, after masking for known repeatedsequences (for all organisms apart from S. cerevisiae). Power-law-like distributions are extensively observed and through theproposed model we attempt to extend our understanding of theevolution and function of CGIs. In the cases of human and mousegenomes, thedataof Illingworthetal. (2010) arealsousedalongsidewith CGI coordinates derived from the implementation ofcompositional thresholds. For all studied organisms, besides the“standard”G-G&FandT&J threshold sets, several additional choicesof sequence composition are also tested and the resulting inter-CGIdistances’ distributions are critically presented. A separate study ofpopulations of orphan CGIs is performed, principally in order toexclude that the observed power-law-like distributions in wholeCGI populations are a mere consequence of similar distributionsalready known to exist for the inter-genic distances (Sellis andAlmirantis, 2009). The persistence of orphan CGIs’ chromosomaldistributions to form power-laws, when taken alone, apart from anindication of their functional role and conservation throughpurifying selection, can provide valuable insight into the overallorganization of genome architecture and the mechanisms underwhich sequences are attributed with functionality.
2. Methods
2.1. Origin of the genomic and epigenomic data
The genomes of the following organisms are used in this study:Apis melifera, Bos taurus, Caenorhabditis elegans, Canis familiaris,Danio rerio, Drosophila melanogaster, Gallus gallus, Homo sapiens,Monodelphis domestica, Mus musculus, Saccharomyces cerevisiae.Several or all chromosomes of each genome are studied. Onlyentire chromosomes are considered. Information about the originof the genomic sequences usedmay be found in the supplementaryfile “genome data”. These data are used for the sequence-baseddetermination of CGIs, by means of the algorithm described in thefollowing sub-Section 2.2.
There is not an unambiguous consensus about what an orphanCpG-Island really is. The term has been widely used to denote allCGIs which are not directly involved in the regulation of nearbygenes, but the exact proximity relationships between CGI and genebodies vary according to the study. In the following, depending ongenome sizes, we use different distance thresholds from thenearest gene in order to characterize a CGI as orphan. Morespecifically, in large genomes, we have considered, in some cases,full-length gene masking, with flanks of 5 kbp and 2kbp(thousands of base pairs) at 50 and 30 ends respectively; for moreinformation see later on (sub-Section 2.5) and the supplementaryfile “Supplementary Table”.
Data for coordinates of CGIs derived from the methylation stateof the sequence, as determined by Illingworth et al. (2010) weredownloaded from the additional material of this article.
Information about the origin of the genomic coordinates usedfor masking of transcription start sites (TSS) and of genes may alsobe found in “genome data”. Additional data for gene or CDS (i.e.protein-coding exon) coordinates were downloaded from the FTPsite of NIH [ftp.ncbi.nih.gov/genomes/MapView] for each of theorganisms we have studied. We used the annotation of these filesin order to define the subset of CGIs which may be considered asorphan.
2.2. Algorithm for the extraction of CGIs coordinates in genomicsequences
The algorithm we have used for the localization of CGIs isan implementation of the method described by Takai and Jones

86 G. Tsiagkas et al. / Computational Biology and Chemistry 53 (2014) 84–96
(2002), with free to be adjusted thresholds on Lmin, CG% andCpGo/e. In all applications the window is sliding per onenucleotide. Neighbor CGIs are merged together and then consid-ered as a unique island, if they are separated by less than 100 basepairs and if the extended island they formmeets the requirementsput by the considered thresholds.
2.3. Power-laws in size distributions
2.3.1. The equations in terms of probabilitiesSuppose there is a large collection of n objects (in our case
spacers between CGIs), each characterized by its length S. In suchrandom collections of objects we can approximate the distributionof their sizes with an exponential distribution (like the runs ofheads in a coin-tossing experiment). Let p(S) be the probability of aspacer having length between S� s/2 and S + s/2, (where s is thesize of the bin width) and N*(S) the number of spacers:
N�ðSÞ ¼ npðSÞ / e�aS; a > 0
When scale-free clustering appears, long-range correlationsextend to several length scales (ideally, in our case for the wholeexamined genomic region) and the spacers’ size distributionsfollow a power-law, which corresponds to a linear graph in adouble logarithmic scale:
N�ðSÞ ¼ npðSÞ / S�z ¼ S�1�m;m > 0
2.3.2. Original vs. cumulative size distributionIn the present work we use the “complementary cumulative
distribution function” (Clauset et al., 2007) for the sizes of spacers(distances) between CpG Islands, defined as follows:
PðSÞ ¼Z1
S
pðrÞdr;
where, p(r) is the original spacers’ size distribution. The cumulativedistribution forms smoother “tails”, less affected by statisticalfluctuations. Although the cumulative form of the distributionmaybe seen as presenting more “inertia” thus overshadowing localfeatures, the inclusion of ten surrogate data distribution curves,along with every genomic one (see below for details), allows for anobjective estimation of the linearity trend in each case. As it ispointed out by Sims et al. (2007) the use (in double-logarithmicplots) of the slope of the cumulative form of the distribution for theestimation of the exponent of the power-law gives much moreprecise results than the use of the slope of the original one. It isalso, by definition, independent of any binning choice: in acumulative curve the value of P(S) for length S is not associatedwith the subset of spacers whose length falls in the same bin, as inthe original distribution, but it corresponds to the number of allspacers longer than S. For reviews on power-law size distributions,their properties and alternative forms see Adamic and Huberman(2002), Li (2002), Newman (2005), Clauset et al. (2007) andStumpf and Porter (2012).
The cumulative form of a power-law size distribution is again apower-law characterized by an exponent (slope) equal to that ofthe original distribution plus 1 (i.e. minus one in absolute value):
if p(r)/ r�1�m, then
NðSÞ ¼ nPðSÞ /Z1
S
ðr�1�mÞdr / S�m;
where N(S) is the number of spacers longer or equal to S.In finite size collections taken fromphysical systems, we cannot
speak about “power-laws” but rather about “power-law-like”distributions. This is particularly important for our study (see
Section 4 for further details, where the proposed model isexplained) as there appears to be no particular tendency for aunique (universal) exponentm. The intensity of the power-law-likepattern is quantified through the value of the extent (E) of thelinear region in double logarithmic scale.
Additionally to CGIs genomic distributions, all figures alsoinclude a bundle of ten simulated size distributions (continuouslines) where an equal number of markers, corresponding to theCGIs of the original natural sequence, are randomly positioned in asequence of equal length. The inclusion of these random(surrogate) data sets in the figures allows for a direct visualizationof the difference between observed and random distributionpatterns.
2.4. Methodology for the search of threshold values for CGIslocalization in several genomes
As discussed in the introduction, the threshold values for CGIsdetection in the cited literature are mostly determined for thepurpose of the localization of new protein-coding genes, which areknown to have promoters often intersectingwith CGIs. Most of thiswork concerns the human and a few other, warm-blooded, animalgenomes. Here, in order to further elaborate on alternative modesof CGI detection, we form a two-dimensional “parameter grid” ofthreshold values for CG% and CpGo/e (around the G-G&F and T&Jthreshold choices) for either L >200bp or L >500bp, for somechromosomes of themostwidely studied genomes. These grids aregiven in the supplementary file “grid”, tabulating the usedthresholds alongside with the extent (E) of the complementarycumulative inter-CGI distances size distributions. This is done in anattempt to determine the threshold values corresponding tofunctional islands, which are thus preserved in evolutionary time,(see in the Discussion). The criterion adopted for choosingchromosomes for the creation of their parameter grids is toinclude the chromosome with the most extended linearity for thestandard threshold choices G-G&F or T&J, and one or morechromosomes (taken at random) with a medium E value. In thecase of C. elegans we derived a grid only for one chromosome,because power-laws for the others are found to be rudimentary, i.e.with a linear extent below unity. The grid-driven search is doneonly for a limited number of chromosomes, for 8 organisms out ofthe 11 overall studied.
Also provided in the Supplementary Table (see also in theResults and Table 1) are values of E given for the standard G-G&Fand T&J threshold sets and for alternative sets for the same valuesof CG% and CpGo/e, interchanging the minimal length thresholds,denoted by altG-G&F (for L>500bp) and altT&J (for L >200bp).
2.5. Details of the masking procedure
In order to define the “orphan” CGI subsets, for large genomes(actually, all the vertebrates included in our list): (i) either wemasked the total length of genes by additionally masking 5 kbpupstream of the start-of-gene (TSS) and 2kbp downstream of theend-of-gene (TES), or (ii) wemasked only around the TSS byaddingflanks of 500bp upstreamof the TSS and 100bp downstreamof theTSS. For small genomes (insects, worm, and S. cerevisiae): (iii) weeither followed the TSSmasking (narrowing the upstreammaskingto 100bp) as in (ii); or (iv) we followed the TSS masking again, butwith the additional masking of each protein coding segment, withsymmetric flanks 50bp upstream and downstream. The criterionadopted for choosing chromosomes for the study of the distribu-tion of orphan CGIs is to include the chromosome with the mostextended linearity for the standard threshold choices G-G&F or T&J,and several other chromosomes, with a medium E value, taken atrandom.

G. Tsiagkas et al. / Computational Biology and Chemistry 53 (2014) 84–96 87
We have also checked the existence of power-law-like distribu-tions for the set of epigenetically determinedCGIs (Illingworth et al.,2010) not intersecting with TSSs and having a minimal distance of100bp from a TSS of the RefSeq annotation. We name these Islands“non-TSS”. Alternatively, we have formed the subset of Illingworthand co-workers original CGIs, which have a minimal distance of5 kbpupstreamor2kbpdownstreamofanyRefSeqTSSandwenamethem “TSS-unrelated” in thepresent text. This is done inorder to testthe distribution of CGIs that are unlikely to have any role in thetranscriptional regulation of protein coding genes at medium-distances (and probably spatially linked). This filtering is analogousto the case (i) of the previous paragraph, dealing with the study ofmasking of threshold-based CGIs. In the framework of the presentstudy, the two classes of epigenetically determined CGIs definedabove are considered as orphan.
2.6. Simulations using the segmental duplication – CGI loss model
Examples of simulations are given in Fig. 5(a–c). Initially,1000 markers (representing CGIs) are randomly inserted in asequence 2Mbp long. In (a), 173 segmental duplication eventsoccurred, with lengths sampled from a uniform distribution notexceeding in size the 5% of the actual length of the simulatedsequence. After each such event a number of markers (CGIs) equalto 90% of the number of the duplicated ones are eliminated. Thelength reached by the simulated chromosome was �195Mbp(steps i and ii of the model, see in the Section 4. In (b) thesegmental duplications were 87 (�50% of those in (a)) and the finalsequence length �22Mbp. In (c) the number of segmentalduplications is as in (a) and the finally reached length �119Mbp.Here, 256 additional events of non-duplicated CGIs eliminationsare also allowed (step iii of the model). These eliminationsrepresent cases of loss of function of ancestral CGIs with asubsequent progressive decomposition. For genomic and formodel-generated size distributions, circles and diamonds are usedrespectively, throughout. Simulations presented in Fig. 5 arerepresentative of a large number of numerical experimentsconducted.
Scripts in Perl and programs in FORTRAN used for parsinggenomic data files, computing the presented size distributions andsimulating the evolutionary model are available upon request.
3. Results
3.1. Chromosomal distributions of CpG-Islands in various genomes
In Fig.1 we present examples of the complementary cumulativeinter-CGI distances’ size distributions, in double logarithmic scale,
Table 1(i) Mean values of linearity extent E (M.V.) for all studied chromosomes from each orgaincidences (M.V.-5). Standard and alternative threshold values are considered, see sub-
G-G&F altG-G&F altT&J
Large genomes M.V. M.V.-5 M.V. M.V.-5 M.V. M.V.-5Bos taurus 1.29 1.59 1.32 1.70 1.29 1.67Canis familiaris 1.61 2.24 1.47 1.93 1.58 2.15Danio rerio 0.90 – 0.89 – 0.87 –
Gallus gallus 1.18 1.82 1.03 1.52 1.19 1.66Homo sapiens 1.51 2.01 1.37 1.79 1.42 1.78Monodelphis domestica 1.02 1.49 1.02 1.44 0.86 1.37Mus musculus 1.70 2.09 1.38 1.70 1.56 1.89
Small genomes M.V. M.V.-5 M.V. M.V.-5 M.V. M.V.-5Apis melifera 1.66 2.08 1.50 1.67 1.68 1.87Caenorhabditis elegans – – – – – –
Drosophila melanogaster 1.39 – 1.04 – 1.13 –
Saccharomyces cerevisiae 1.15 – – – – –
for whole chromosomes from the 11 considered genomes. TheG-G&F or T&J thresholds values have been used here. More plotsare included in “Supplementary Plots”. In Table 1 the followinginformation is included: (i) mean values of linearity extent E (M.V.)for all studied chromosomes from each organism; (ii) mean valuesof linearity Extent E for the five more extended power-lawincidences (M.V.-5), serving as an additional estimator of theintensity of the appearance of the power-law-like pattern perorganism. In Supplementary Table all chromosomes are presented.In these Tables we have included along with the standardparameter sets, the ones we called “alternative” in sub-Section 2.4.
The principal result of this study is that power-law-likedistributions of inter-CGIs distances are observed in several caseswith linearity extent E >2,which in two instances surpass the threeorders of magnitude (in dog chr. 31 and human chr. 21, see theSupplementary Table).
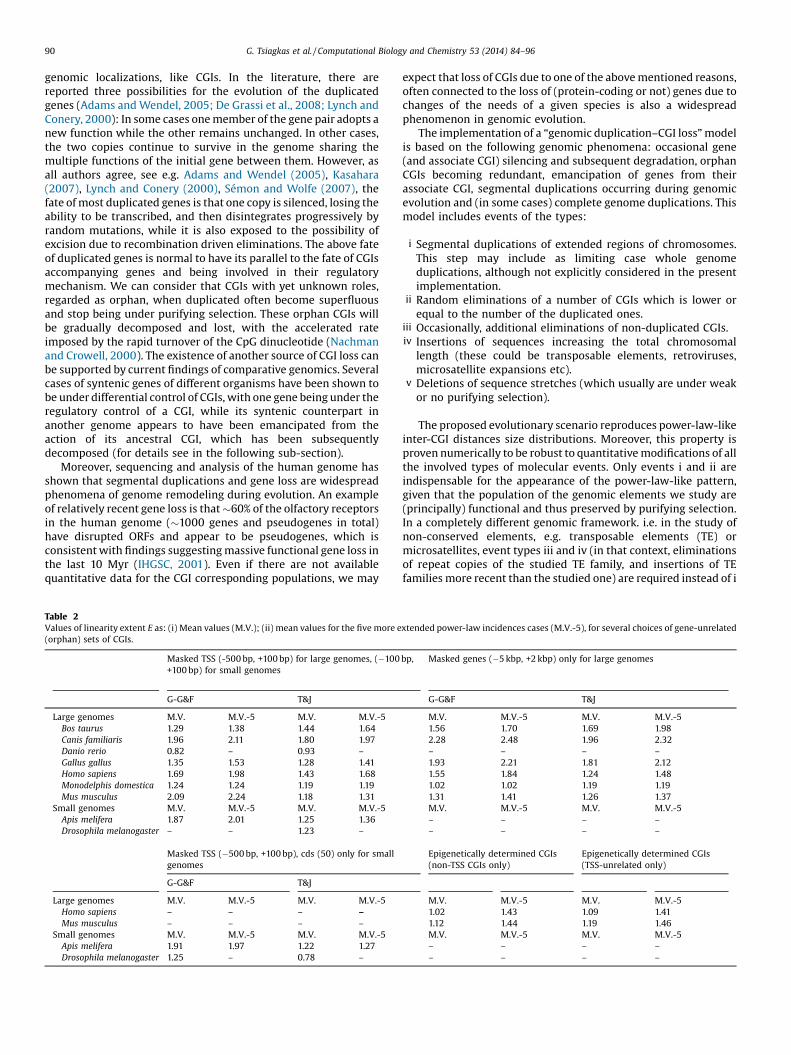
We have also performed gene masking and subsequently westudied the spacers’ size distribution for orphan CGIs, in somechromosomes for each organism, as described in detail in theMethods. In Fig. 2, examples of these distributions are presented,for the same chromosomes as in Fig. 1. In Table 2 mean values aregiven for the orphan CGI spacers’ size distribution in the same formwith Table 1, while in Supplementary Table all the studied cases areincluded. Power-law-like distributions of orphan CGIs are wide-spread, while, in some instances of masked genomes, we observeincrease of the extent of linearity when orphan islands areconsidered instead of the full populations.
Additionally, for the human andmouse genomes, chromosomaldistributions for the islands determined by Illingworth et al. (2010)based on methylation data are studied and the power-law-likepattern is also found. When a masking procedure is applied in theepigenetically determined CGI collection (for details see Methods,sub-Section 2.5) the picture remains qualitatively the same. Weobserve that power-law-like distributions are again formed, likethe ones found in the orphan CGI populations derived on the basisof compositional criteria, although the extent of linearity issomewhat reduced. In Fig. 3, for one chromosome of eachorganism, the complete sets of epigenetically determined CGIare presented (Fig. 3a and d), along with the corresponding CGIsubsets remaining after gene-masking (non-TSS CGIs; Fig. 3b ande), as well as the fraction of the TSS-unrelated CGIs (Fig. 3c and f).In Table 2, summary information about non-gene-related epige-netically determined CGIs is also included. The full set ofepigenetically determined CGI populations and their orphansubsets are presented in the Supplementary Table. See also theSupplementary Plots.
We have also attempted a search for the determination ofthe form of distribution of distances between CGIs using
nism; (ii) mean values of linearity extent E for the five more extended power-lawSection 2.4.
T&J Epigenetically determined CGIs (complete population)
M.V. M.V.-5 M.V. M.V.-51.40 1.79 – –
1.54 1.82 – –
0.88 – – –
1.05 1.33 – –
1.33 1.74 1.26 1.731.01 1.34 – –
1.33 1.59 1.45 1.74M.V. M.V.-5 M.V. M.V.-51.16 1.41 – –
– – – –
1.03 – – –
– – – –

88 G. Tsiagkas et al. / Computational Biology and Chemistry 53 (2014) 84–96
threshold sets different than the standard and the “alternative”G-G&F and T&J. In the supplementary file “grid” the extents oflinearities are presented in the form of grids of thresholds (seeMethods) for all the studied cases, while characteristic plots aregiven in Fig. 4.
[(Fig._1)TD$FIG]
Fig. 1. Inter-CGI spacers’ complementary cumulative size distributions inwhole chromoare to base 10. Each sub-plot (a–f) corresponds to a chromosome of one of the examined gGardiner–Garden and Frommer, G-G&F (Lmin = 200bp, GC >50%, CpGo/e >0.6) or the Takaiused. Genomic curves are accompanied in each plot by 10 curves of surrogate data (contininferred by linear regression.
3.2. An evolutionary scenario reproducing the observed power-law-like distributions based on segmental duplications and CGI loss
Segmental duplication events occurred continuously in theevolutionary past of virtually all eukaryotes (De Grassi et al., 2008;
somes. Linearity in log–log scale (a power-law-like pattern) is observed. Logarithmsenomes, for a specific choice of thresholds in the detection of CpG–Islands. Either theand Jones, T&J (Lmin = 500bp, G+C>55%, CpGo/e > 0.65) sets of thresholds have beenuous lines), corresponding to randomly distributedmarkers. The linear segments are

G. Tsiagkas et al. / Computational Biology and Chemistry 53 (2014) 84–96 89
Kehrer-Sawatzki and Cooper, 2008; Kirsch et al., 2008; McLysaghtet al., 2002; Shapira and Finnerty, 1986). It has been shown that atleast 10% of the non-repetitive human genome consists ofidentifiable (i.e. relatively recent) segmental duplications (Baileyet al., 2002). Additionally, most extant taxa have experiencedpaleopolyploidy during their evolution (i.e. duplication of thewhole genome and subsequent reduction to diploidy), see e.g.
[(Fig._2)TD$FIG]
Fig. 2. Same cases of chromosomal distributions as in Fig. 1, sub-plot (a–f), but here exclubeen used. Again, power-law-like linearity is observed, often more extended than in the csimilar to Fig. 1. Logarithms are to base 10.
Adams and Wendel (2005), Gibson and Spring (2000), Sémon andWolfe (2007) and references therein. It is estimated that 50% of allgenes in a genome are expected to duplicate giving an “offspring”at least once on time scales of 35–350million years, not taking intoaccount events of polyploidization (Lynch and Conery, 2000).Segmental duplication and polyploidisation generate copies ofsome or all the genes of an organism, but also of other functional
ding gene-related CGIs. Several alternative ways of retaining only orphan CGIs haveorresponding complete population. Surrogate data curves and linear regression are
90 G. Tsiagkas et al. / Computational Biology and Chemistry 53 (2014) 84–96
genomic localizations, like CGIs. In the literature, there arereported three possibilities for the evolution of the duplicatedgenes (Adams andWendel, 2005; De Grassi et al., 2008; Lynch andConery, 2000): In some cases onemember of the gene pair adopts anew function while the other remains unchanged. In other cases,the two copies continue to survive in the genome sharing themultiple functions of the initial gene between them. However, asall authors agree, see e.g. Adams and Wendel (2005), Kasahara(2007), Lynch and Conery (2000), Sémon and Wolfe (2007), thefate ofmost duplicated genes is that one copy is silenced, losing theability to be transcribed, and then disintegrates progressively byrandom mutations, while it is also exposed to the possibility ofexcision due to recombination driven eliminations. The above fateof duplicated genes is normal to have its parallel to the fate of CGIsaccompanying genes and being involved in their regulatorymechanism. We can consider that CGIs with yet unknown roles,regarded as orphan, when duplicated often become superfluousand stop being under purifying selection. These orphan CGIs willbe gradually decomposed and lost, with the accelerated rateimposed by the rapid turnover of the CpG dinucleotide (Nachmanand Crowell, 2000). The existence of another source of CGI loss canbe supported by current findings of comparative genomics. Severalcases of syntenic genes of different organisms have been shown tobe under differential control of CGIs, with one gene being under theregulatory control of a CGI, while its syntenic counterpart inanother genome appears to have been emancipated from theaction of its ancestral CGI, which has been subsequentlydecomposed (for details see in the following sub-section).
Moreover, sequencing and analysis of the human genome hasshown that segmental duplications and gene loss are widespreadphenomena of genome remodeling during evolution. An exampleof relatively recent gene loss is that�60% of the olfactory receptorsin the human genome (�1000 genes and pseudogenes in total)have disrupted ORFs and appear to be pseudogenes, which isconsistentwith findings suggestingmassive functional gene loss inthe last 10 Myr (IHGSC, 2001). Even if there are not availablequantitative data for the CGI corresponding populations, we may
Table 2Values of linearity extent E as: (i) Mean values (M.V.); (ii) mean values for the five more e(orphan) sets of CGIs.
Masked TSS (-500bp, +100bp) for large genomes, (�100+100bp) for small genomes
G-G&F T&J
Large genomes M.V. M.V.-5 M.V. M.V.-5Bos taurus 1.29 1.38 1.44 1.64Canis familiaris 1.96 2.11 1.80 1.97Danio rerio 0.82 – 0.93 –
Gallus gallus 1.35 1.53 1.28 1.41Homo sapiens 1.69 1.98 1.43 1.68Monodelphis domestica 1.24 1.24 1.19 1.19Mus musculus 2.09 2.24 1.18 1.31
Small genomes M.V. M.V.-5 M.V. M.V.-5Apis melifera 1.87 2.01 1.25 1.36Drosophila melanogaster – – 1.23 –
Masked TSS (�500bp, +100bp), cds (50) only for smallgenomes
G-G&F T&J
Large genomes M.V. M.V.-5 M.V. M.V.-5Homo sapiens – – – –
Mus musculus – – – –
Small genomes M.V. M.V.-5 M.V. M.V.-5Apis melifera 1.91 1.97 1.22 1.27Drosophila melanogaster 1.25 – 0.78 –
expect that loss of CGIs due to one of the abovementioned reasons,often connected to the loss of (protein-coding or not) genes due tochanges of the needs of a given species is also a widespreadphenomenon in genomic evolution.
The implementation of a “genomic duplication–CGI loss”modelis based on the following genomic phenomena: occasional gene(and associate CGI) silencing and subsequent degradation, orphanCGIs becoming redundant, emancipation of genes from theirassociate CGI, segmental duplications occurring during genomicevolution and (in some cases) complete genome duplications. Thismodel includes events of the types:
i
xte
bp,
Segmental duplications of extended regions of chromosomes.This step may include as limiting case whole genomeduplications, although not explicitly considered in the presentimplementation.
ii
Random eliminations of a number of CGIs which is lower orequal to the number of the duplicated ones.iii
Occasionally, additional eliminations of non-duplicated CGIs. iv Insertions of sequences increasing the total chromosomallength (these could be transposable elements, retroviruses,microsatellite expansions etc).
v
Deletions of sequence stretches (which usually are under weakor no purifying selection).The proposed evolutionary scenario reproduces power-law-likeinter-CGI distances size distributions. Moreover, this property isproven numerically to be robust to quantitativemodifications of allthe involved types of molecular events. Only events i and ii areindispensable for the appearance of the power-law-like pattern,given that the population of the genomic elements we study are(principally) functional and thus preserved by purifying selection.In a completely different genomic framework. i.e. in the study ofnon-conserved elements, e.g. transposable elements (TE) ormicrosatellites, event types iii and iv (in that context, eliminationsof repeat copies of the studied TE family, and insertions of TEfamilies more recent than the studied one) are required instead of i
nded power-law incidences cases (M.V.-5), for several choices of gene-unrelated
Masked genes (�5kbp, +2 kbp) only for large genomes
G-G&F T&J
M.V. M.V.-5 M.V. M.V.-51.56 1.70 1.69 1.982.28 2.48 1.96 2.32– – – –
1.93 2.21 1.81 2.121.55 1.84 1.24 1.481.02 1.02 1.19 1.191.31 1.41 1.26 1.37M.V. M.V.-5 M.V. M.V.-5– – – –
– – – –
Epigenetically determined CGIs(non-TSS CGIs only)
Epigenetically determined CGIs(TSS-unrelated only)
M.V. M.V.-5 M.V. M.V.-51.02 1.43 1.09 1.411.12 1.44 1.19 1.46M.V. M.V.-5 M.V. M.V.-5– – – –
– – – –

G. Tsiagkas et al. / Computational Biology and Chemistry 53 (2014) 84–96 91
and ii (see Sellis et al., 2007; Klimopoulos et al., 2012). Events iii, ivand v are numerically shown to be dispensable for the emergenceof power-laws in the computer simulations studied herein. Eventsof type iii, although not essential for the emergence of power-law-type linearity, are important, as several authors bring evidenceabout loss of CGIs over evolutionary time due to de novo
[(Fig._3)TD$FIG]
Fig. 3. Inter-CGI spacers’ complementary cumulative size distributions in whole chromSeveral cases of non-TSS or TSS-unrelated (orphan) islands are considered. Surrogate d
methylation (see e.g. Antequera and Bird, 1993). The involvementof this type of events in the formation of the observed linearities isindicated by the relatively higher linearities observed in mousewhere higher island elimination rates are observed, as the aboveauthors remark (see also discussion in the next sub-section). Theinclusion of events type iv tests the robustness of the model,
osomes for epigenetically determined CGIs from the human and mouse genome.ata curves and linear regression are similar to Fig. 1. Logarithms are to base 10.

92 G. Tsiagkas et al. / Computational Biology and Chemistry 53 (2014) 84–96
because for many organisms important parts of the genome aregenerated by repeat proliferation. Events of type v represent eitherdeletion of sequence regions usually due to unequal recombinationor gradual shrinkage by a balance of indel (insertion/deletion)events favoring decrease of the sequence length.
The model presented herein is formally similar to anothermodel introduced previously, in order to account for theappearance of a power-law-like pattern in the chromosomal
[(Fig._4)TD$FIG]
Fig. 4. Plots of inter-CGI spacers’ complementary cumulative size distributions in wholesub-Section 2.4 and the supplementary file “grid”. Surrogate data curves and linear re
distribution of genes (Sellis and Almirantis, 2009). Both are basedon an analytically solvable model introduced by Takayasu et al.(1991) for the appearance of power-law size distributions inaggregative growth of particles in physicochemical systems.
Notice that the model presented herein, conceived to describethe genomic dynamics of CGIs, is not analytically solvable and thusno universal exponents (slopes for the linear segment in log–logscale) may be obtained. This is verified by all our computer
chromosomes. Here non-standard threshold sets are used, for more details see thegression are similar to Fig. 1. Logarithms are to base 10.

[(Fig._5)TD$FIG]
Fig. 5. Simulations using the proposed evolutionary model. For details see inSection 2 and Section 4. Linearity in log–log scale similar to the one observed in theplots of inter-CGI spacers’ complementary cumulative size distributions is found.Logarithms are to base 10.
G. Tsiagkas et al. / Computational Biology and Chemistry 53 (2014) 84–96 93
simulations and is in accordance with the variety of slope valuesmet in the study of genomic CGI distributions. Thus, our datadeviate from the typical power-law not only because they alwayshave the linearity in log–log scale truncated at a lower and anupper cut-off (in fact, this is a feature common to all cases ofnaturally occurring “power-laws”) but mainly because they lackany universal exponent (slope). This is the principal reasonwhywecall the pattern we have found “power-law-like” throughout thisarticle. For a recent in depth view of the requirements for having apower-law, see Stumpf and Porter (2012). These authors state thatthese requirements include a statistically sound power-law(extended linearity in log–log scale with indications of conver-gence to a universal exponent) and a concrete underlying theory tosupport it. In our case we clearly show that the log–log linearitieswe observe in our genomic data (often being quite extended) lack auniversal exponent (slope). On the other hand, this deviation fromuniversality is a characteristic feature shared between the genomicinter-CGI distributional patterns we describe herein and thesimulations of the proposed evolutionary model. This feature,along with the common dependence on the evolutionaryparameters shared between model and genomic distributions,as found in several instances, corroborates the hypothesis that theevolutionary dynamics described by this model is at the origin ofthe observed genomic patterns.
In the simulation of Fig. 5a, only events of the types i and ii areincluded (segmental duplications followed by CGI loss). We seethat, as observed in real chromosomes, power-law-like curves(linear in log–log scale) are formed in the inter-CGI spacers' sizedistributions. A decrease in the number of allowed segmentalduplications, depicted in Fig. 5b, decreases the extent of thelinearity. If we include additional elimination of CGI (events of typeiii), as intuitively expected, the linearity is considerably increased(see Fig. 5c). These results are compatible with extended power-law linearity found, in cases where an extended genic remodelingin the recent past of the organism is plausible (perhaps, the case ofthe human genome) with many genes inactivated (e.g. the case ofhuman olfactory receptors) and several genes having theirregulatory pattern changed. We may infer that gene inactivationand reassignment of the roles of genes (which may have causedtheir emancipation from an associate CGI) led several CGIs to ceasebeing under purifying selection and thus they progressivelydecomposed.
4. Discussion
4.1. Analysis of the observed power-law-like chromosomal CGIdistributions. Taxonomy-related evidence
The property of the formulated simple model to producepower-law-like distributions is an indication that it could beextended to include more detailed modeling of conservationthrough evolutionary time, in line with the view that functionalityis a necessary condition for CpG islands to form stable power-laws.The similarity of the power-law-like pattern emerging insimulations of this model with the genomic distributions ofinter-CGI distances cannot be considered, however, as an absoluteproof that this model is at the origin of the genomic pattern.Moreover, it is probable that the observed distributions are theresult of the proposedmechanism in synergy with other aspects ofgenomic dynamics. More specifically, the expansion–modificationmodel proposed by Li (1991), shown to generate long-rangecorrelations in nucleotide sequences might have significantlycontributed to power-law-like distributional patterns of severalgenomic components (repeats, protein coding segments, CGIs),especially in small genomes. For a related discussion seeKlimopoulos et al. (2012).
In the previous paragraph we consider the possibility that thegenomic power-law-like size distributions of CGIs might be anindication of functionality. The power-law inter-repeat sizedistributions of distances between TEs could be seen as acounter-example (Klimopoulos et al., 2012). However, as exten-sively discussed therein, TEs are long-lived genomic objects, underno purifying selection, recognizable in mammalian genomes up to

94 G. Tsiagkas et al. / Computational Biology and Chemistry 53 (2014) 84–96
200My, (Ostertag and Kazazian, 2001) thus allowing the interplayof event types iii and iv of the proposed model. These are eventsnot requiring evolutionary conservation of the involved genomicelements in order to generate power-law-like distributions.Contrary to TEs, CpG Islands retain their identity in theevolutionary time scale (i.e. they stay above given thresholds forCG% and for CpGo/e) only for relatively short times after ceasing tobe under purifying selection. This is due to the mutability of CpGafter being methylated, which makes its genomic turnover rate tobe the highest of any other dinucleotide. CpG is, in fact, reported todisappear from a given position at least one order of magnitudefaster than any other dinucleotide in the eukaryotic genome; seeNachman and Crowell (2000) and Antequera (2003).
An immediate observation stemming from our study is that thestandard threshold sets (G-G&F and T&J) may produce power-law-like distributions not only in human, mouse and other mammaliangenomes, from which they are principally derived, but also in avariety of other genomes. From log–log linearities found hereinone might infer that an important proportion of the CGIs detectedin all examined genomes using these thresholds are functional, onthe basis of the argument presented above: i.e. that log–loglinearity implies functionality for CGI populations. In H. sapiens,the maximum of the linearity in log–log scale is indeed observedfor the standard threshold sets or for values being in their closevicinity, with no signs of skewed deviations to any direction in theparameter (threshold) space for all analyzed chromosomes. Thesituation changes, to some extent, for several of the other studiedgenomes asmay be revealed byan inspection of the data presentedin the supplementary file “grid”. Especially in mouse, where CGIsare known to be eroded, i.e. they are decreased in number whilethe “surviving” ones are shorter and with lower CG% and CpGo/evalues (Antequera and Bird, 1993; Matsuo et al., 1993) we observethat the maximum linear length is systematically positioned atlower threshold combinations than the standard ones. Human andmouse, and in fact other vertebrate genomes too, according toAntequera and Bird (1993), are losing CpG Islands over evolution-ary time due to de novo methylation in the germ line followed byCpG loss throughmutation. More specifically, type iii events of theproposed model occur according to the cited literature with aparticularly higher rate in rodents. On the other hand, by simpleinspection of Table 1 we see that the mouse genome presents forG-G&F the highest mean extent, i.e. highest mean value of log–loglinearity (M.V.) of all examined genomes, this being a corrobora-tion of the proposed model. Another point compatible with themodel is that this optimum is reached for the relaxed (G-G&F) andnot for the stringent (T&J) threshold set, as the erosion of mouseCGIs probably makes the relaxed thresholds more suitable forfiltering in most of the functional CGIs. Note that this result doesnot contradict the earlier finding of Han and Zhao (2009) that theT&J threshold set is particularly suitable for identifying promoter-associated CGIs in human and probably other genomes as well. Asalready mentioned, in our study we attempt to identify thedistributional patterns of CGI populations of different functionali-ties and not only the gene-transcription related, often focussing ontheir non-gene-related subset (orphan islands).
In other genomes the optimum (maximum linear extent) ispositioned at lower value combinations, while sporadically highvalues of thresholds may perform better (see data in the “grid”).The existence of several organisms with higher power lawlinearities for lower thresholds and shorter minimum length(i.e. when Lmin = 200 performs better than Lmin = 500) is compatiblewith the finding that “many known functional CGIs are shorterthan commonly assumed – the extreme example being XenopusCGIs” (Hackenberg et al., 2006).
On the other hand, the observation of Han and Zhao (2008) thatin fish genomes stringent thresholds (T&J) gave the best results on
functional CGIs determination is compatible with our finding thatin D. rerio, the lengthier log–log linear extents (the only ones above2) are found in the higher threshold value region. The prevalence ofthe higher thresholds in the formation of the most extended linearsegments in log–log scale suggests that in fish genomes, functionalislands in generalmight be compositionallymoved toward high CG% and CpGo/e values.
Another point where findings presented herein comply withfindings of other research groups following a different approach isour observation that chromosome III of Saccharomyces cerevisiae isthe one presenting the globally maximal extent of linear segment(E =1.85) and the only one which exhibits linearity for alternativethreshold set (altG-G&F and altT&J). This is in accordance with thefindings of Li et al. (1998) and Bradnam et al. (1999), see also Sharpand Lloyd (1993), about chromosome III being atypical in manyregards: It presents large-scale compositional (C +G content)inhomogeneity and high extent of compositional mosaicism ofgenes found only in this chromosome. It is also worthy to note thatthe two chromosomes (I and XI) reported by Bradnam et al. (1999)to be next to III in their degree of variation of silent-site C +Gcontent are the ones with the next higher extents of linearity(1.6 and 1.5 respectively). These authors consider as themore likelyreason for the particularities of chromosome III that it contains themating type loci thus being under a selective pressure protecting itfrom disruptions and keeping it intact in evolutionary time. On theother hand, slowing down of the transposition dynamics,according to our proposed model, also has as effect the protectionof the power-law-like pattern from random interruptions of theinter-CGI spacers thus maximizing linearity in log–log scale. Thishas also been shown numerically through computer simulationsallowing random transpositions, where a decrease of the linearityextent in log–log scale was observed (figure not included herein).
4.2. Gene-related vs. orphan CGIs
The distributions of coding segments and of genes in a variety ofgenomes are shown to followa power-law-like spatial distribution,long-rangeness and fractality, by using several differentapproaches (Sellis and Almirantis, 2009; Athanasopoulou et al.,2010). In order to exclude the possibility that the power-law-likespatial distribution of CGIs is a mere consequence of a power-lawdistribution of genes, given the systematic connection of manyCGIs with promoters of protein-coding genes, we extended ouranalysis to the subset of CGIs characterized as orphan, i.e. notspatially connected to genes. Moreover, the separated study oforphan CGIs allows for the investigation of different modes ofchromosomal distribution and thus of different functionalitiesof this class of genomic element compared to entire CGIpopulations. The observation that power-law-like linearity persists(and is sporadically more extended) in orphan CGI distributions isindicative of distinct functionalities for this type of genomiclocalizations.
The result of Han et al. (2008) that the dog genome hosts thehighest percentage of gene-unrelated functional CGIs if compared toany studied genome is compatible, in view of the proposed model,with our result (see Table 2) that dog genome, for both standardthresholdchoices, represents theglobal optimumof linearityextent,when full gene and flanks masking is applied, to all examinedgenomes. The same optimum is reached if we examine the M.V.-5 values. Along the same lines is the observation that this genome ischaracterized by the maximum of increase of linearity when fullgene and flanks masking is applied either for G-G&F or for T&Jthresholds (if masked and unmasked genomes are compared).Considering mean values from all chromosomes as depicted inTables 1 and 2, we note that this increase is much higher for the G-G&F than for the T&J threshold set (0.67 vs. 0.45 respectively). This

G. Tsiagkas et al. / Computational Biology and Chemistry 53 (2014) 84–96 95
may represent further evidence that functional gene-unrelated(orphan) islands accomplish their role under less stringentcompositional constraints. More generally, this is also an indicationthat two classes of islands (gene-related and orphan) might bedistinguished using several compositional or distributional criteriain a converging way.
4.3. CGIs derived on the basis of methylation data
CGIs determined on the basis of methylation data, provided byIllingworth et al. (2010) for human andmouse chromosomes oftenfollow power-law-like distributions (Tables 1 and 2 and detaileddata available in Supplementary Table). The observation of a clearlylower extent of power-law linearity in themethylation-derived CGIdistributions in human and mouse raises a question about theprevalence of the methylation-based over the composition-basedprediction of the CGI character. One could think that a combinationof CG% and CpGo/e clearly higher than the prevailing in the bulkgenome can be seen as a trustworthy marker of any CGIfunctionality, given that such locally maintained heterogeneitiesare indications of conservation due to functionality. On the otherhand, experimentally observed methylation might be due to somespecific conditions of the studied cell population and its state,given that methylation is an in vivo reversible feature. Analternative explanation for compositionally predicted but methyl-ated CGIs is that these sequences could be functional islands (thus,conserved by purifying selection) until recently, which have losttheir function although they have not yet changed their composi-tion due to mutational dynamics. Such newly de-functionalizedCGIs are also expected to participate to the linearity in log–log plotsaccording to the proposed model. We believe that only furtherresearch may resolve this ambiguity. The observation we made ondeviations in power-law linearity extent, between composition-based and methylation-state-based CGI populations, strengthensthe complementary roles of the two approaches in the predictionof functional CGIs, at least for the time being.
5. Conclusions
In this work we investigated the distributional features ofCpG–Islands in several genomes by means of a study of inter-CGIdistances considering only entire chromosomes. Linearity in log–log scale was often found in the range between two and threeorders of magnitude. A simple evolutionary model, formallyanalog to one previously proposed by our group for theunderstanding of genic segment distributions was formulatedand simulations have shown that it might account for thedistributional patterns reported herein. We deduced that both,the taxonomy of the considered organisms and the functional roleof the studied island population leave their imprint on theobserved distributions. Several inferences based on knowndifferences of compositional and other characteristics betweenspecies have been made, which are compatible with the proposedmodel. At the present time only CGIs involved in genetranscription represent a well defined island set, although severalother functions have been attributed to CGIs in the recent past.We have studied in separate the population of CGIs which lieoutside of genes and flanks considering them as gene-unrelatedor orphan, and they were also found to follow power-law-likedistributions. A limitation of the present work is that thechromosomal distribution of CGIs cannot be disentangled fromthe complex large-scale compositional characteristics of thegenome, thus their distribution also reflects the large-scalefeatures of the isochore partition of genomes and othercompositional inhomogeneities. However, it is noteworthy thateven the A. melifera genome, studied herein, lacking the clear
partition into isochores observed in warm-blooded animals,presents a clearly inter-CGI linearity in log–log scale, quantifiedby the mean value (M.V.) of all chromosomes, which not onlysurvives but increases when gene-unrelated (regarded as orphan)CGIs are studied, for both G-G&F and T&J threshold sets (cf.Tables 1 and 2). When a more refined annotation of functionalroles of CGIs is available, we expect that a treatment like the onepresented herein could allow for the deduction of more nuancedconclusions.
Acknowledgements
We would like to acknowledge Professors Stavros J. Hamo-drakas and George C. Rodakis (both at the Faculty of Biology,University of Athens) for serving as academic advisors to G.T., andPhilippa Constantinou for having participated in an initial stage ofthis study. We are particularly indebted to Professor Oliver Claywho predicted the particularly high power-law-linearity of yeastchromosome III on the basis of thefindings of Bradnamet al. (1999)about the compositional mosaicism of this chromosome.
Appendix A. Supplementary data
Supplementary data associatedwith this article can be found, inthe online version, at http://dx.doi.org/10.1016/j.compbiol-chem.2014.08.013.
References
Adamic, L.A., Huberman, B.A., 2002. Zipf’s law and the internet. Glottometrics 3,143–150.
Adams, K.L., Wendel, J.F., 2005. Polyploidy and genome evolution in plants. Curr.Opin. Plant. Biol. 8, 135–141.
Antequera, F., Bird, A., 1993. Number of CpG islands and genes in human andmouse.Proc. Natl. Acad. Sci. U. S. A 90, 11995–11999.
Antequera, F., 2003. Structure, function and evolution of CpG island promoters. Cell.Mol. Life Sci. 60, 1647–1658.
Athanasopoulou, L., Athanasopoulos, S., Karamanos, K., Almirantis, Y., 2010. Scalingproperties and fractality in the distribution of coding segments in eukaryoticgenomes revealed through a block entropy approach. Phys. Rev. E 82, 051917.
Bailey, J.A., Gu, Z., Clark, R.A., Reinert, K., Samonte, R.V., Schwartz, S., Adams, M.D.,Myers, E.W., Li, P.W., Eichler, E.E., 2002. Recent segmental duplications in thehuman genome. Science 297, 1003–1007.
Bird, A.P., 1986. CpG-rich islands and the function of DNA methylation. Nature 321,209–213.
Bird, A.P., 1987. CpG islands as genemarkers in the vertebrate nucleus. Trend. Genet.3, 342–347.
Bock, C., Walter, J., Paulsen, M., Lengauer, T., 2007. CpG island mapping byepigenome prediction. PloS Comp. Biol. 3, 1055–1070.
Bradnam, K.R., Seoighe, C., Sharp, P.M., Wolfe, K.H., 1999. G +C content variationalong and among saccharomyces cerevisiae chromosomes. Mol. Biol. Evol 16,666–675.
Cayrou, C., Coulombe, P., Vigneron, A., et al., 2011. Genome-scale analysis ofmetazoan replication origins reveals their organization in specific but flexiblesites defined by conserved features. Genome Res. 21, 1438–1449.
Clauset, A., Shalizi, C.R., Newman, M.E.J., 2007. Power-law distributions in empiricaldata. arXiv. 0706.1062v1 [physics.data-an].
De Grassi, A., Lanave, C., Saccone, C., 2008. Genome duplication and gene-familyevolution: the case of three OXPHOS gene families. Gene 421, 1–6.
Gardiner-Garden, M., Frommer, M., 1987. CpG islands in vertebrate genomes. J. Mol.Evol. 196, 261–282.
Gibson, T.J., Spring, J., 2000. Evidence in favour of ancient octaploidy in thevertebrate genome. Biochem. Soc. Trans. 28, 259–264.
Glass, J.L., Thompson, R.F., Khulan, B., Figueroa,M.E., Olivier, E.N., Oakley, E.J., Zant, G.V., Bouhassira, E.E., Melnick, A., Golden, A., Fazzari, M.J., Greally, J.M., 2007. CGdinucleotide clustering is a species-specific property of the genome. Nucl. AcidsRes. 35, 6798–6807.
Hackenberg, M., Previti, C., Luque-Escamilla, P.L., Carpena, P., Martinez-Aroza, J.,Oliver, J.L., 2006. CpGcluster: a distance-based algorithm for CpG-islanddetection. BMC Bioinformatics 7, 446–458.
Han, L., Su, B., Li, W.-H., Zhao, Z., 2008. CpG island density and its correlations withgenomic features in mammalian genomes. Genome Biol. 9, R79.
Han, L., Zhao, Z., 2008. Comparative analysis of CpG islands in four fish genomes.Comp. Funct. Genomics doi:http://dx.doi.org/10.1155/2008/565631.
Han, L., Zhao, Z., 2009. CpG islands or CpG clusters: how to identify functional GC-rich regions in a genome? BMC Bioinformatics 10, 65. doi:http://dx.doi.org/10.1186/1471-2105-10-65.

IHG
Illin
Jab
Kas
Keh
Kirs
Klim
Li, W
Li, WLi,
Luq
Lyn
Ma
Mc
Nac
New
Ost
Sell
Sell
Sém
Sha
Sha
Sim
Stu
Tak
Tan
Tak
96 G. Tsiagkas et al. / Computational Biology and Chemistry 53 (2014) 84–96
SC, 2001. Initial sequencing and analysis of the human genome. Nature 409,860–921.gworth, R.S., Gruenewald-Schneider, U., Webb, S., Kerr, A.R., James, K.D., Turner,D.J., Smith, C., Harrison, D.J., Andrews, R., Bird, A.P., 2010. Orphan CpG islandsidentify numerous conserved promoters in the mammalian genome. PLoSGenetics 6, e1001134.bari, K., Bernardi, G., 2004. Cytosine methylation and CpG, TpG (CpA) and TpAfrequencies. Gene 333, 143–149.ahara, M., 2007. The 2R hypothesis. An update. Curr. Opin. Immunol. 19,547–552.rer-Sawatzki, H., Cooper, D.N., 2008. Molecular mechanisms of chromosomalrearrangement during primate evolution. Chromosome Res. 16, 41–56.ch, S., Munch, C., Jiang, Z., Cheng, Z., Chen, L., Batz, C., Eichler, E.E., Schempp, W.,2008. Evolutionary dynamics of segmental duplications from human Y-chromosomal euchromatin/heterochromatin transition regions. Genome Res.29 doi:http://dx.doi.org/10.1101/gr.076711.108.opoulos, A., Sellis, D., Almirantis, Y., 2012. Widespread occurrence of power-law distributions in inter-repeat distances shaped by genome dynamics. Genedoi:http://dx.doi.org/10.1016/j.gene.2012.02.005.., 1991. Expansion-modification systems: a model for spatial 1/f spectra. Phys.Rev. A 43, 5240–5260.., 2002. Zipf’s law everywhere. Glottometrics 5, 14–21.
W., Stolovitzky, G., Bernaola-Galvan, P., Oliver, J.L., 1998. Compositionalheterogeneity within, and uniformity between, DNA sequences of yeastchromosomes. Genome Res. 8, 916–928.ue-Escamilla, P.L., Martinez-Aroza, J., Oliver, J., Gomez-Lopera, J.G., Roman-Roldan, R., 2005. Compositional searching of CpG islands in the human genome.Phys. Rev. E 71, 061925.ch, M., Conery, J.S., 2000. The evolutionary fate and consequence of duplicategenes. Science 290, 1151–1155.tsuo, K., Clay, O., Takahashi, T., Silke, J., Schaffner, W.,1993. Evidence of erosion ofmouse CpG islands during mammalian evolution. Somat. Cell Mol. Genet. 19,543–555.
Lysaght, A., Hokamp, K., Wolfe, K.H., 2002. Extensive genomic duplication duringearly chordate evolution. Nat. Genet. 31, 200–204.hman, M.W., Crowell, S.L., 2000. Estimate of the mutation rate per nucleotide inhumans. Genetics 156, 297–304.man, M.E.J., 2005. Power laws: Pareto distributions and Zipf’s law. Contemp.Phys. 46, 323–351.ertag, E.M., Kazazian, H.H., 2001. Biology of mammalian L1 retrotransposons.Annu. Rev. Genet. 35, 501–538.is, D., Provata, A., Almirantis, Y., 2007. Alu and LINE1 distributions in the humanchromosomes: evidence of global genomic organization expressed in the formof power laws. Mol. Biol. Evol. 24, 2385–2399.is, D., Almirantis, Y., 2009. Power-laws in the genomic distribution of codingsegments in several organisms: an evolutionary trace of segmental duplica-tions, possible paleopolyploidy and gene loss. Gene. 447, 18–28.on, M.,Wolfe, K.H., 2007. Reciprocal gene loss betweenTetraodon and zebrafishafter whole genome duplication in their ancestor. Trends Genet. 23, 108–112.pira, S.K., Finnerty, V.G., 1986. The use of genetic complementation in the studyof eukaryotic macromolecular evolution. Rate of spontaneous gene duplicationat two loci of Drosophila melanogaster. J. Mol. Evol. 23, 159–167.rp, P.M., Lloyd, A.T., 1993. Regional base composition variation along yeastchromosome III: evolution of chromosomeprimary structure. Nucleic Acids Res.21, 179–183.s, D.W., Righton, D., Pitchford, J.W., 2007. Minimizing errors in identifying Levyflight behaviour of organisms. J. Anim. Ecol. 76, 222–229.mpf, M.P.H., Porter, M.A., 2012. Mathematics: critical truths about power laws.Science 335, 665–666.ai, D., Jones, P.A., 2002. Comprehensive analysis of CpG islands in humanchromosomes 21 and 22. PNAS 99, 3740–3745.ay, A., O'Donnell, A.H., Damelin, M., Bestor, T.H., 2007. Hyperconserved CpGdomains underlie Polycomb-binding sites. Proc. Nat. Acad. Sci. U. S. A. 104,5521–5526.ayasu, H., Takayasu, M., Provata, A., Huber, G., 1991. Statistical properties ofaggregation with injection. J. Stat. Phys. 65, 725–745.